 Chi Young Moon1*
 Gina M. Magnotti1
 Brandon A. Sforzo1
 Aniket Tekawade2Alan L. Kastengren3Christopher F. Powell1
- 1Argonne National Laboratory, Energy Systems Division, Lemont, IL, United States
- 2Argonne National Laboratory, Data Science and Learning Division, Lemont, IL, United States
- 3Argonne National Laboratory, X-Ray Science Division, Lemont, IL, United States
High injection pressure in diesel engines can lead to cavitation-induced erosion in injector nozzles. One important factor affecting the severity of erosion is the fuel and its properties. Traditionally, modeling and simulation studies have used single-component representations of fuels, but realistic fuels feature a multitude of components and can even include volatile additives such as water and alcohol. To provide realistic benchmarks and comparisons, experimental measurements quantifying erosion characteristics were made using ultra-low sulfur diesel (ULSD) and two alternative diesel fuels (ADF). X-ray imaging and computed tomography were used to investigate cavitation-induced erosion onset and progression. Hard X-ray tomography revealed injector internal geometry, including details such as surface marks from the manufacturing process and erosion patterns from repeated injections. Erosion progression was measured using X-ray tomography and imaging performed between injections. The critical erosion site was found to be similar across different fuel blends, while the erosion rate and incubation time were sensitive to the fuel blend. The injector geometry and the erosion characteristics were also prepared for numerical model development and validation.
1 Introduction
In modern diesel engines, injection pressures have been steadily rising to improve engine performance and efficiency and to decrease emissions and their environmental impact (Reitz et al., 2020) However, higher injection pressures can lead to cavitating fuel flow in injectors (Arcoumanis et al., 2000; Andriotis et al., 2008). Cavitating flow can not only affect the fuel spray downstream of the orifice but also can induce erosion and cause damage to the injector surface, further affecting the downstream spray characteristics. Damage due to erosion can quickly counteract any benefits gained by raising the injection pressure. Durability studies have shown that in as little as 600 h, cavitation damage has been detected in common-rail injection systems (Tzanetakis et al., 2018; Tzanetakis et al., 2020). Accurate models for estimating injector durability are crucial for maintaining efficiency throughout the engine’s life cycle.
Another recent trend in diesel engine development is interest in alternative diesel fuels (ADF) (Riiff et al., 2017; Wei et al., 2018; Sun, 2020; Gaspar, 2021). ADFs include blendstocks that aim to reduce the fuel’s environmental impact by using renewable sources for components. However, an important requirement for these ADFs is maintaining engine performance compared to standard diesel. There have been many investigations on the effect of ADF blends on their spray and combustion characteristics (Park et al., 2009; Liu et al., 2011; Liu et al., 2015; Gaspar, 2021).
For blended fuels, investigating cavitation behavior is particularly important due to preferential cavitation, the cavitation of different fuel components at different rates (Vidal et al., 2021). In addition, cavitation and cavitation-induced erosion are sensitive to changes in fuel properties that result from blending additional components into diesel fuel (Magnotti and Som, 2020; Rachakonda and Magnotti, 2021).
A better understanding of the multi-component fuel cavitation and subsequent erosion characteristics are required for improving model predictions. Numerous experimental and modeling studies have investigated cavitation in diesel injectors (Gavaises et al., 2009; Duke et al., 2014; Westlye et al., 2016; Mitroglou et al., 2017; Battistoni et al., 2019; Cristofaro et al., 2020; Maes et al., 2020; Magnotti et al., 2021b; Pratama et al., 2021). However, Skoda et al. (2011) showed that the relationship between cavitaion and erosion may be more complicated. Using varying fuel properties and a sensitivity analysis, Magnotti and Som, (2020) found that the vapor pressure is the dominant factor for cavitation (positively correlated), but the fuel’s viscosity is the dominant factor for erosion severity (negatively correlated). In fact, density, vapor pressure, and surface tension are found to have a small effect on erosion. That is, a fuel with high vapor pressure and viscosity may lead to increased cavitation, but the erosion risk may be lowered compared to a fuel with lower viscosity.
An ongoing challenge has been the sensitivity of cavitation to small-scale features of the nozzle geometry, motivating the use of realistic nozzle geometries and modeling that incorporates the fuel’s chemical components.
Most diagnostic techniques to study cavitation in situ require optical access. This often forces compromises in the pressure, size, shape, and material used for laboratory experiments when compared to typical diesel injectors. These compromises limit the data that is, available for model validation purposes. Single component surrogate fuels are used often to model diesel fuel, but diesel is a multi-component mixture that can vary in its composition and properties (Mueller et al., 2016). This challenge is compounded when considering ADFs which combine diesel with blendstock, increasing the complexity of representing the fuel properties and the need to incorporate models of preferential cavitation (Rachakonda and Magnotti, 2021; Vidal et al., 2021).
This paper details measurements of the internal geometry, erosion rate, and critical sites in injector nozzles using X-ray diagnostics to assist in the development of a multi-component cavitation and erosion prediction model. X-ray studies allow detailed measurements of the injector’s internal geometry, informing more accurate boundary conditions for modeling (Matusik et al., 2018; Guo et al., 2020; Sforzo et al., 2022). In addition, X-ray imaging of the injector orifice walls over a number of injections provides insights into the erosion process, as well as quantification of the erosion rate and the critical locations where erosion is likely to occur. In this work, we present measurements and analysis of realistic injector nozzles running real fuels. Using ultra-low sulfur diesel (ULSD) and two ADF blends with additives manufactured by Sylvatex, X-ray tomography and imaging is used to quantify cavitation-induced erosion within the orifices of a multi-hole injector. In addition to providing validation data for numerical models under diesel injection-relevant conditions, the results offer insights into the relationship among fuel properties and the resultant erosion patterns, rates, and relative erosion risk.
2 Materials and Methods
2.1 Injection Setup
Experiments were performed at the 7-BM beamline of the Advanced Photon Source at Argonne National Laboratory (Kastengren et al., 2012a). The injector is a Bosch CRIN 3 diesel injector with its tip partially removed, which allows different nozzles to be installed (Yasutomi et al., 2020; Magnotti et al., 2021a). The nozzles were manufactured from Al 6061-T6 to observe erosion with fewer injection events relative to steel and within laboratory-relevant timescales (Magnotti et al., 2019). The nozzles used in the experiments feature three side-oriented orifices, which have a 73° angle with respect to the injector needle axis. While this is fewer holes than a production diesel injector, it allows for a clear visualization of a hole in projection without overlap from neighboring holes. The three holes also have a sharp inlet radius of curvature, which is intended to promote cavitation (Magnotti et al., 2021a). The injector is mounted on a rotational stage, which is then sealed in a pressure chamber with X-ray transparent windows. A schematic of the injector setup is shown in Figure 1.
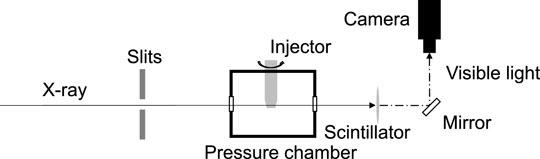
FIGURE 1. A schematic of the injection experiment and X-ray diagnostic setup.
Fuel at room temperature is delivered to the injector using a common-rail injection system operating with a nominal rail pressure of 150 MPa. The injector is triggered at a rate of 10 Hz using an electronic driver with a commanded 480 μs duration, resulting in an actual hydraulic injection duration of 1.5 ms. The fuel is injected into the chamber, which is maintained at an ambient pressure of 0.1 MPa using nitrogen gas. Nitrogen flows through the chamber at a rate of 4 L per minute to purge residual vapor fuel and fine droplets from previous injection events.
Three different fuels were tested for investigating the nozzle erosion characteristics: ultra-low sulfur diesel (ULSD) and two ULSD blends with different additives. The additives are MicroX1 and MicroX2, manufactured by Sylvatex. Table 1 shows the basic properties of ULSD and the two ADF blends. There is a significant difference between ULSD and the two blends in their vapor pressures. Six nominally identical nozzles were manufactured and cleaned using an ultrasonic water bath for 5 min, rinsed with acetone, dried with compressed air, and then used for erosion measurements. Table 2 shows the six nozzles, their corresponding labels and the fuel blend used in the injection experiments. The nozzles were manufactured in two batches, with the first three being AM3-1, AM3-2, and AM3-3. Improvements in the machining process and a slight taper to the orifices (negative K-factor) were introduced to the second batch of the nozzle tips. It is important to note that each nozzle batch contain nominally identical nozzles.
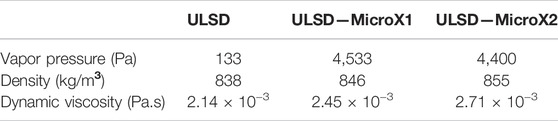
TABLE 1. Fuel properties of ULSD and the two alternative diesel fuels. Vapor pressure and density were measured at 25 C, while dynamic viscosity was measured at 40 C.
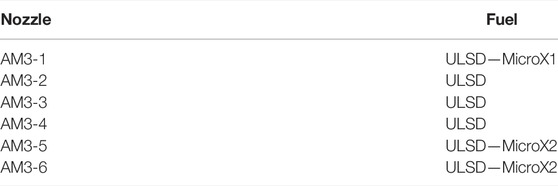
TABLE 2. Nozzles and the fuels used for the injection experiments.
2.2 High-Resolution X-Ray Tomography
High-resolution X-ray computed tomography (CT) scans were performed on select nozzles before and after the experiment. AM3-1 was scanned before any injections with ULSD occurred. AM3-4 was scanned after 19,000 injections with ULSD while AM3-6 was scanned after 25,000 injections with ULSD-MicroX2 blend. The X-ray tomography setup at the 7-BM beamline is optimized for geometry measurements of fuel injector nozzles. This method has been shown to accurately measure injector orifice diameter with errors as low as 1.6 μm (Matusik et al., 2018). A detailed explanation of the methods, setup, and analysis is detailed in Matusik et al. (2018). In brief, a broadband (white) X-ray beam passes through a set of filters and slits to control the beam size and filter the low-energy photons that would otherwise get absorbed by the metal injector body. Injectors are mounted without the pressure chamber described in the previous section for this measurement. X-rays that pass through the injector are absorbed by a scintillator, which emits visible light directed to a camera.
A series of projection images of each nozzle is acquired while the injector rotates 180°. Bright and dark field images are acquired with the injector moved out of the image frame and the X-ray shutters closed, respectively, and used for intensity normalization. Tomographic reconstruction is done using an open-source Python code TomoPy (Gürsoy et al., 2014). A Fourier transform algorithm gridrec is used for the reconstruction process accompanied by a Parzen filter (Dowd et al., 1999; Marone and Stampanoni, 2012). The reconstructed volume is segmented into air and metal voxels using CTSegNet, a segmentation workflow using convolution neural networks (CNN) (Tekawade et al., 2019). The segmented volume is converted into an isosurface as a detailed representation of injector geometry and a computational mesh. In addition, the reconstructed volume is used for a geometric analysis of the nozzle orifices using a process detailed in Matusik et al. (2018). The reconstruction volumes are aligned with the orifice axes and the orifice wall edges at each slice are fitted with ellipses, which provide statistics related to the orifice diameter and area.
2.3 In-situ X-Ray Imaging and Tomography
With the injection system setup as described in Section 2.1, limited-view in-situ tomography scans and projection images were acquired as a number of injections were performed. The limited-view tomography is similar to the high-resolution tomography described in the previous section, but the angular range is limited to 145° as opposed to 180° due to structural supports that mount the injector and the rotational stage in the pressure chamber. In addition, the spatial resolution is decreased from 1.30 μm/pix from the high-resolution imaging setup to 2.93 μm/pix due to changes required in the imaging system. As a result of these challenges, the tomographic reconstruction of these scans contains reconstruction errors and artifacts that could not be addressed. However, one of the three nozzle orifices was aligned properly with the rotational range and unaffected by the reconstruction artifacts. Therefore, the nozzle orifice geometric analysis as performed on the high-resolution reconstructions was limited to the single orifices acquired in-situ.
Projection images were also acquired at a single fixed angle to image the orifice geometry between each injection. Before any injection takes place, ten images of a nozzle orifice were acquired and averaged to improve the image’s signal-to-noise ratio. This process was repeated approximately every 3,000 injections to record the erosion process within the orifice.
A sample image from the AM3-2 injector operated with ULSD is shown in Figure 2A. The portion of the image containing the orifice of interest (highlighted in red) is rotated and cropped. In Figure 2B, the rotated and cropped image showing the projections of the top and bottom surface in the orifice can be seen. Most of the pixels within the orifice are set to zero to prevent any gas bubbles or metal fragments from being detected as the orifice boundary (Figure 2C shows an example of a gas bubble captured within the orifice). A Sato filter is used to enhance the edge detection process (Sato et al., 1998). The distance between the top and bottom edges is then measured at each pixel along the orifice axis to provide a measure of the orifice size vs. downstream distance in the orifice.
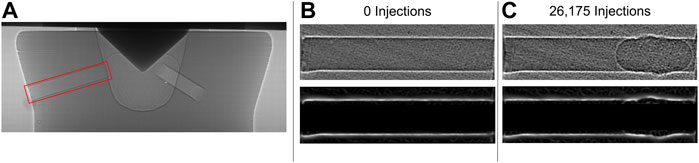
FIGURE 2. (A) A projection image of AM3-2 nozzle with 0 injections. The region with the orifice of interest is highlighted. (B). The orifice region cropped and rotated, acquired at 0 injections (top). Image after applying a Sato filter (bottom). (C) The same orifice imaged after 26,175 injections with ULSD (top). Image after applying a Sato filter (bottom).
2.3.1 Needle Lift
The projection images were also acquired during injections to track the injector needle motion. Using a high-speed CMOS camera recording at 50 kHz, a series of images were acquired recording the needle motion. The location of the needle tip is tracked through cross-correlation, providing axial (“lift”) and lateral (“wobble”) movements. A detailed explanation of the needle lift measurement and post-processing steps are detailed in Kastengren et al. (2012b). The needle lift data is also provided as a CFD boundary condition.
3 Results
3.1 Needle Motion
Figure 3 shows the needle movement in both the axial and lateral directions. The lateral movement is very small, with a maximum displacement of 10 μm off-axis. The minimized lateral movement is important to note, as large off-axis motion has been found to promote asymmetric internal flow and cause phase transition at the orifice (Torelli et al., 2019). In addition, a recording of 100 injection events 0.46 ms after the initial command (near full needle lift position) revealed that the shot-to-shot repeatability is excellent, with the maximum variation is less than 9 μm. The minimum variation across multiple injections once again minimizes asymmetry in the injector internal flow and orifice-to-orifice variation (Torelli et al., 2018).
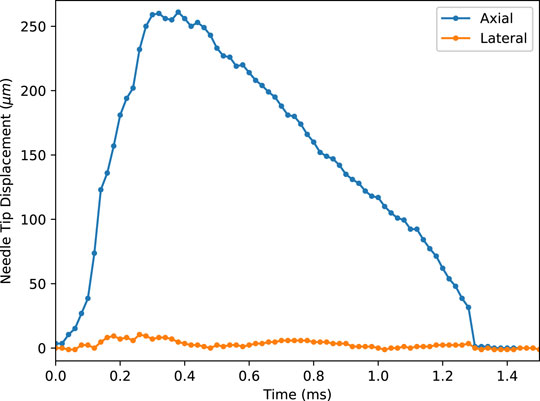
FIGURE 3. The needle tip displacement in axial and later directions.
3.2 Geometry
As the injector nozzles were manufactured in two separate batches, the difference between the two nozzle generations can be seen in Figure 4. Compared to AM3-1 in Figure 4A, the nozzles from the second batch (shown in 4b and c) show improvements in the sac and orifice surfaces. The most notable feature is seen in the sac, where machining marks are plainly visible in Figure 4A, where as the second batch nozzles AM3-4 and AM3-6 have cleaner sac surfaces. While the injector geometry can influence the flow cavitation, the erosion measurements presented in the ensuing sections show that the differences between the two batches are minimal and do not affect the erosion patterns greatly.
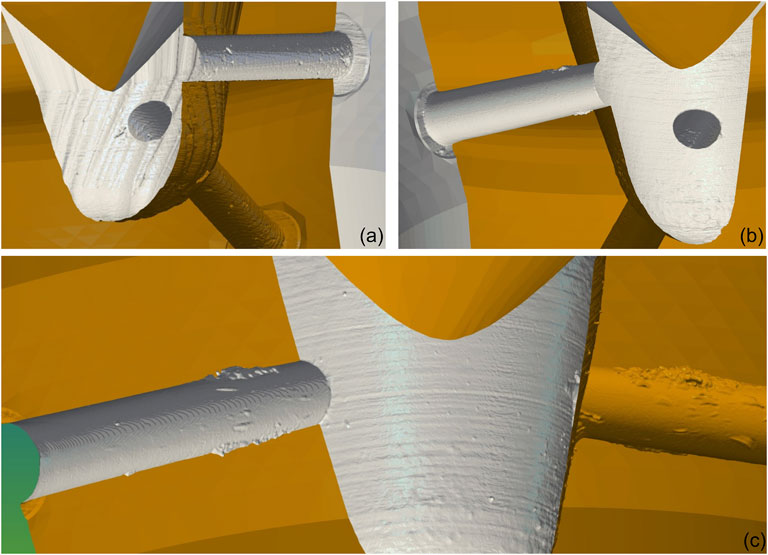
FIGURE 4. Three CT-scanned geometries of the nozzle tips. (A) AM3-1, unused. (B) AM3-6 after 25,000 injections with ULSD-MicroX2. (C) AM3-4 after 19,000 injections with ULSD.
The isosurfaces of the three nozzles characterized by X-ray tomography are depicted in Figure 4. Even in the unused nozzle (AM3-1, Figure 4A), machining patterns in the sac and imperfections in the orifice are visible. After improvements were made to the injector tip machining process, analysis of the AM3-4 and AM3-6 injector tips, which were manufactured later in the experimental campaign and are visualized in Figures 4B,C, confirms that these machining patterns are not observed in the sac. The iso-surfaces were subsequently prepared for computational fluid dynamics (CFD) mesh generation.
Erosion patterns are clearly visible within the orifices in AM3-4 and AM3-6. Most of the erosion occurs within the first third of the orifice length and is concentrated on the top and bottom surfaces, which will conveniently aid the in-situ imaging measurements in quantifying the erosion rate and location. Very little erosion is seen near the orifice exit. A qualitative assessment of the injector isosurfaces indicates that less erosion is observed in the AM3-6 injector operated with ULSD-MicroX2 relative to the AM3-4 injector operated with ULSD, even after enduring 6,000 more injections.
3.3 Orifice Tomography and Imaging
To quantify the degree of cavitation erosion from the tomography data, the orifice area is measured by fitting an ellipse on the reconstructed volume (Matusik et al., 2017; Matusik et al., 2018). As stated in Section 2.3, the in-situ tomography data acquired during the injection experiments have a lower spatial resolution compared to the high-resolution tomography and only a single orifice had sufficient data quality for reconstruction. Figure 5 shows the measurements acquired for the orifice of interest from three different nozzles, with AM3-1 and AM3-4 missing the initial clean measurements with 0 injections. Figure 5 once again highlights the slight differences between the two batches of the injectors. AM3-1 features a K-factor of 0 (or constant orifice diameter) whereas AM3-4 and AM3-6 feature a negative K-factor (or expanding nozzle geometry). The second-generation injector tips (AM3-4 and 3-6) have similar orifice geometries.
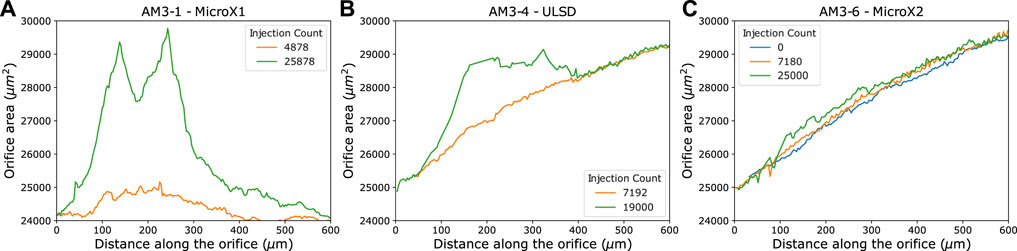
FIGURE 5. Orifice area quantified using the single orifice tomographyc reconstruction. (A) AM3-1 with ULSD-MicroX1. (B) AM3-4 with ULSD. (C) AM3-6 with ULSD-MicroX2.
The orifice area measurements provide information on the erosion location and rate. The severe erosion shown in AM3-1 and AM3-4 is concentrated around 200 μm from the orifice entrance. AM3-4 and AM3-6 in 5b and c also show the orifice slightly diverging from the entrance to the exit. This characteristic is not seen with AM3-1. The MicroX2 blend once again shows much less erosion occurring compared to the MicroX1 blend and ULSD.
These results can be compared with those from the high-resolution tomography. Figure 6 shows the comparison between the low and high-resolution tomography scans. The spatial resolutions are 1.3 μm/pix and 3.2 μm/pix for the high and low-resolution tomography measurements. The hole numbers were matched using identifiable marks present in the nozzle. In AM3-4, there are variations in the amount of erosion occurring from orifice to orifice. Orifices 2 and 3 show more erosion than orifice 1. AM3-6 shows that very little erosion occurred in all three orifices.
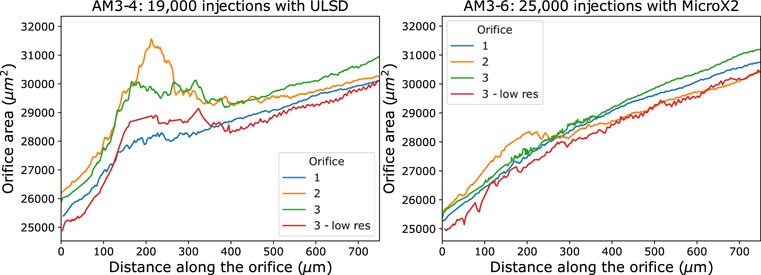
FIGURE 6. Orifice area by both tomography methods.
Comparing the in-situ and high-resolution tomography data, Figure 7 shows the orifice measured by both methods, and the data has been normalized using the orifice area at the entrance. AM3-4 shows that the low-resolution data tracks well with the high-resolution reconstruction, providing additional confidence in the in-situ tomography measurements.
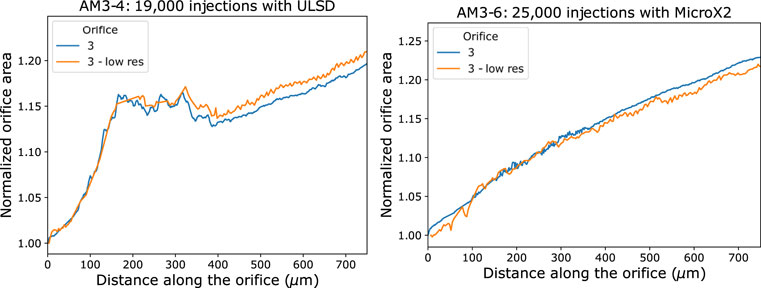
FIGURE 7. A comparison of orifice 3 areas between the tomography methods. The area has been normalized by the entrance area.
The orifice heights measured from the projection images are shown in Figure 8. The recorded height at every pixel along the orifice axis is first normalized by the orifice height at 0 injections to show the change in geometry from the baseline. A spatial averaging every 5 pixels (15 μm) is performed to decrease random noise in the data. The shaded bands represent one standard deviation within the averaged portion. While limited to seeing the 2D projection of the orifice wall as opposed to the 3D volume analysis using tomography, the projection images allow for a more detailed look at the temporal and spatial trends of the incubation period and critical erosion location. The orifices measured in Figure 8 are referred as orifice 2 in the high-resolution tomography scans of the injector geometry.
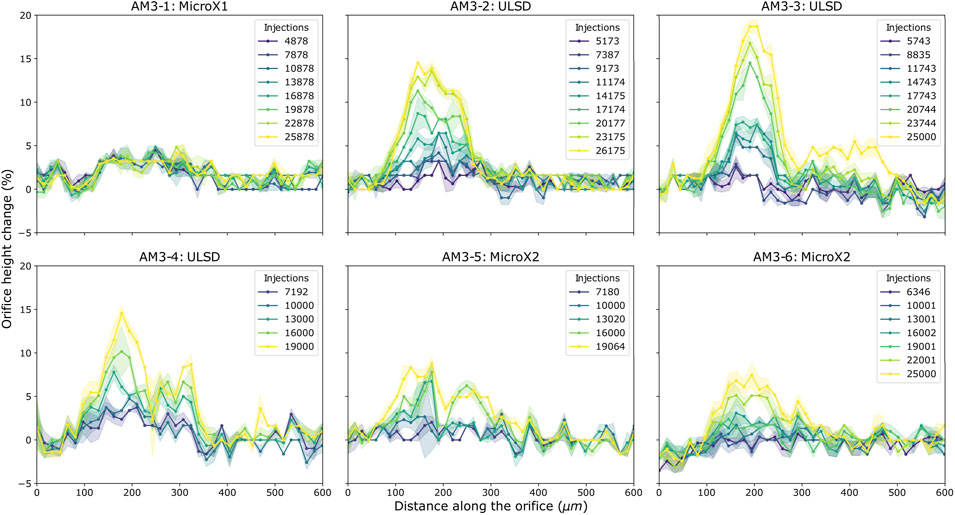
FIGURE 8. Orifice height measured using X-ray imaging, normalized by the baseline orifice height at zero injections.
Focusing on the orifice height changes in the injector nozzle using the MicroX1 blend, images from AM3-1 showed a large metal chip lodged in the orifice and slowly flowing out throughout the 26,000 injections. Examples at three different injection counts throughout the run can be seen in Figure 9. This blockage was only visible in AM3-1 using the MicroX1 blend. With the obstruction visible throughout the majority of the images, it is difficult to draw any conclusions related to the erosion rate in this orifice using MicroX1. If the fuel flow is blocked from one orifice, it may lead to increased flow and cavitation in the other orifices. This may explain the small amount of erosion measured with the imaging method in this orifice relative to the erosion measured with tomography in the other two orifices (as seen in Figure 5) but require further evidence and examination for confirmation.
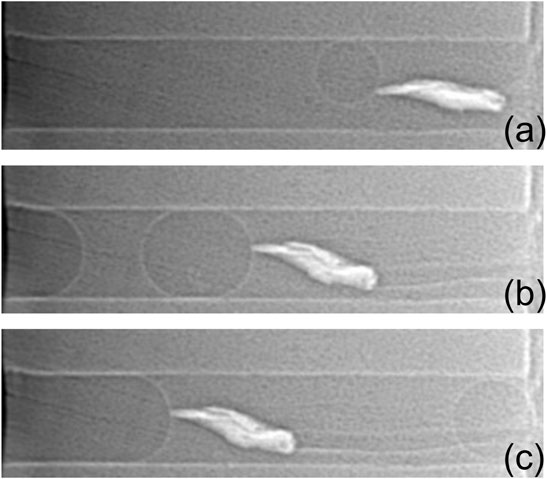
FIGURE 9. Projection images of the AM3-1 nozzle using MicroX1 fuel blend at three different injection counts: (A) 4,878, (B) 13,878, (C) 25,878.
Across all nozzles, most of the erosion is focused around 200 μm from the orifice entrance, matching multiphase flow simulations that show high cavitation intensity levels in the first third of the orifice and no cavitation at the orifice exit (Magnotti et al., 2021c). The consistency in erosion location between the different fuel blends suggests that the erosion location is more sensitive to the injector geometry than the fuel properties.
The three ULSD cases (AM3-2, AM3-3, and AM3-4) show consistency in the erosion location and change in orifice height. Also important to note that AM3-2 and AM3-3 were generation 1 nozzles, while AM3-4 uses the improved nozzle design. By examining the ULSD cases across the injector designs, the effect of the geometry changes on erosion between the two batches are inferred to be minimum. To account for image noise and edge tracking errors, we define the erosion incubation period (or time before first amount of material is removed from the orifice) as more than 5% change in orifice height. Using this metric, the incubation periods for the MicroX2 and ULSD cases are 10,000 and 13,000 injections, respectively. In AM3-3, two distinct steps of erosion are visible. The first stage of erosion occurs between 9,000 and 12,000 injections and the erosion rate is very low until 18,000 injections. Between 18,000 and 20,000 injections, the erosion rate quickly increases, and a large amount of material is removed. This behavior is less visible in the other nozzles, but the first increase around 10,000 and 13,000 injections for ULSD and MicroX2 cases respectively are noticeable in AM3-3 and AM3-6. Looking at the final orifice height between the ULSD and MicroX2 cases, the ULSD cases shows higher peaks than MicroX2 cases with similar final injection counts, indicating deeper erosion patterns. Similar trends are seen comparing AM3-2 and AM3-3 using ULSD to AM3-6 using MicroX2.
Summarizing the observations from X-ray measurements, critical erosion sites are focused around 200 μm from the orifice entrance. For the AM3-1 nozzle using MicroX1, a significant amount of erosion is observed using in-situ tomography in one orifice. However, the phase contrast images showed a large metal chip in another orifice. This blockage likely caused increased flow in the other orifices and may explain the increased erosion in those orifices. Very little erosion is observed for the MicroX2 cases using all measurement methods. The initial erosion incubation time using MicroX2 is longer, around 13,000 injections, compared to 10,000 injections for the pure ULSD cases. Looking at Table 1, MicroX2 has higher vapor pressure and viscosity than ULSD. Higher vapor pressure would lead to increased levels of cavitation, but MicroX2 shows lower amounts of erosion than ULSD. This suggests that while the MicroX2 cases could have increased levels of cavitation, but mitigated the erosion risk with higher viscosity, as suggested by Magnotti and Som, (2020).
4 Discussion
X-ray tomography and imaging were used to measure the internal geometry of injector nozzle orifices and characterize cavitation-induced erosion. Using real fuels (ULSD and two ADFs), the measurements were provided as validation data for model development under realistic conditions.
Hard X-ray tomography of the injector nozzles revealed important features such as grooves from manufacturing and orifice to orifice variation in the erosion pattern. While small changes were made between the two batches of injectors, ULSD cases for both designs showed minimum effect on erosion. Isosurfaces of the nozzle geometry were also prepared to be used for computational mesh generation.
X-ray tomography and imaging performed in-between injections showed the progression of erosion as it occurred on the orifice walls. This additional information was offset by lower spatial resolution compared to the high-resolution tomography, but the low-resolution orifice geometry measurements matched well with the high-resolution counterpart, providing additional confidence in measurement accuracy. The needle motion measurements showed minimal off-axis lateral motion and shot-to-shot variation.
Between the ULSD and MicroX2 cases, MicroX2 cases showed lower erosion rates and longer incubation time. Comparisons with the MicroX1 could not be made due to the blocked orifice. From all measurements, critical erosion sites are focused around 200 μm after the orifice opening. The location was consistent for all three fuel blends, suggesting that injector geometry is a bigger influence for erosion site than fuel composition. However, some caution must be taken when these results are considered for real steel injectors. Al 6061-T6 alloy was used for practical purposes regarding number of injections required for producing cavitation-induced erosion. Several studies have compared the effects of material property on cavitation erosion. Laguna-Camacho et al. (2013) compared the erosion rate and pattern between various aluminum and steel alloys. Different damage mechanisms govern the erosion rate and the pitting patterns that form on the surface depending on the material properties. Abouel-Kasem et al. (2009) similarly found different pitting mechanisms when comparing brass, pure aluminum, and stainless steel. A consistent finding throughout similar experimental results is that cavitation-induced erosion is not simply correlated to the material’s yield strength, and the varying damage mechanisms play an important role in quantifying erosion Franc et al. (2012); Patella et al. (2001). As such, the erosion rate and severity measured using aluminum cannot be related directly steel injectors. However, the nozzle geometry is likely the dominant factor for the cavitation location (and therefore cavitation-induced erosion) and not affected by the material properties. This demonstrates the value of using aluminum nozzles as a litmus test to provide valuable information on the effects of fuel properties and erosion location based on nozzle geometry in laboratory-relevant timescale.
The initial erosion incubation times for the MicroX2 cases were longer, around 13,000 injections, compared to 10,000 for ULSD. Comparing the fuel properties of ULSD and MicroX2, MicroX2 has a higher vapor pressure and viscosity. While this experiment did not directly measure cavitation, the higher vapor pressure suggests increased levels of cavitation within the orifices. However, the results also show an inverse relationship between fuel viscosity and erosion severity. Nozzles using MicroX2 show lower erosion rates and longer incubation times. As Skoda et al. (2011) found, the results from this experiment suggest that increased cavitation does not always lead to higher erosion. They also support findings by Magnotti and Som, (2020) that fuel properties affect cavitation and erosion separately. The effect of fuel viscosity is only expected to be a part of the larger understanding regarding cavitation and erosion, it does provide a general trend that can be considered when blending different components into diesel fuel. In addition, while the findings from these two specific ADF blends cannot be transferred to the many different blends that are used and developed, the modeling effort this experiment supports can be used to assess the erosion risks of other ADFs.
The orifice height and area were prepared as validation data for numerical model development. High cycle fatigue occurs when more than 10,000 cycles are required to reach failure, indicating the impact stresses are primarily below the yield strength and cause elastic deformation. If more than one impact occurs at a particular location within a single injection event, then these results suggest that erosion is due to high cycle fatigue. Although heavy duty diesel injectors likely undergo ultra high cycle fatigue (more than 106 cycles to failure), these x-ray measurements can help provide insight into fatigue failure due to low stress, elastic impacts which are also expected to occur and lead to damage in heavy duty diesel injectors. The information provided by the geometry measurements allows for accompanying numerical studies investigating cavitation and erosion in diesel injectors. The erosion rates and critical sites provide quantitative benchmarks for model development and validation of cavitation-induced erosion due to high cycle fatigue. Improved models for cavitating flow and injector durability will enhance design and predictive capabilities for future combustion systems.
Data Availability Statement
The raw data supporting the conclusion of this article will be made available by the authors, without undue reservation.
Author Contributions
CP and GM planned the experiment. CP, BS, AK, and AT conducted the experiment. CP, BS, AT, and CM analyzed the data. CM prepared the manuscript. All authors reviewed the manuscript.
Funding
Argonne fuel spray research is sponsored by the U.S. Department of Energy Vehicle Technologies Program under the direction of Gurpreet Singh, Siddiq Khan, and Michael Weismiller.
Conflict of Interest
The authors declare that the research was conducted in the absence of any commercial or financial relationships that could be construed as a potential conflict of interest.
Publisher’s Note
All claims expressed in this article are solely those of the authors and do not necessarily represent those of their affiliated organizations, or those of the publisher, the editors and the reviewers. Any product that may be evaluated in this article, or claim that may be made by its manufacturer, is not guaranteed or endorsed by the publisher.
Acknowledgments
Research presented in this paper was performed at the 7-BM beamline at the Advanced Photon Source at Argonne National Laboratory. Use of the APS is supported by the U.S. Department of Energy (DOE) under Contract No. DEAC0206CH11357. The authors would like to acknowledge Mel Luetkens at Sylvatex Inc., for his technical support and guidance.
References
Abouel-Kasem, A., El-Deen, A. E., Emara, K. M., and Ahmed, S. M. (2009). Investigation into Cavitation Erosion Pits. J. Tribol. 131 (3), 031605. doi:10.1115/1.3075863
Andriotis, A., Gavaises, M., and Arcoumanis, C. (2008). Vortex Flow and Cavitation in Diesel Injector Nozzles. J. Fluid Mech. 610, 195–215. doi:10.1017/S0022112008002668
Arcoumanis, C., Flora, H., Gavaises, M., and Badami, M. (2000). Cavitation in Real-Size Multi-Hole Diesel Injector Nozzles. SAE Trans. 109, 1485–1500. doi:10.4271/2000-01-1249
Battistoni, M., Som, S., and Powell, C. F. (2019). Highly Resolved Eulerian Simulations of Fuel Spray Transients in Single and Multi-Hole Injectors: Nozzle Flow and Near-Exit Dynamics. Fuel 251, 709–729. doi:10.1016/j.fuel.2019.04.076
Cristofaro, M., Edelbauer, W., Koukouvinis, P., and Gavaises, M. (2020). A Numerical Study on the Effect of Cavitation Erosion in a Diesel Injector. Appl. Math. Model. 78, 200–216. doi:10.1016/j.apm.2019.09.002
Dowd, B. A., Campbell, G. H., Marr, R. B., Nagarkar, V. V., Tipnis, S. V., Axe, L., et al. (1999). Developments in Synchrotron X-Ray Computed Microtomography at the National Synchrotron Light Source. Dev. X-ray Tomogr. II 3772, 224–236. doi:10.1117/12.363725
Duke, D., Swantek, A., Tilocco, Z., Kastengren, A., Fezzaa, K., Neroorkar, K., et al. (2014). X-ray Imaging of Cavitation in Diesel Injectors. SAE Int. J. Engines 7, 1003–1016. doi:10.4271/2014-01-1404
Franc, J.-P., Riondet, M., Karimi, A., and Chahine, G. L. (2012). Material and Velocity Effects on Cavitation Erosion Pitting. Wear 274-275, 248–259. doi:10.1016/j.wear.2011.09.006
Gaspar, D. J. (2021). Top 13 Blendstocks Derived from Biomass for Mixing-Controlled Compression-Ignition (Diesel) Engines: Bioblendstocks with Potential for Decreased Emissions and Improved Operability. Richland, WA (United States): Tech. rep., Pacific Northwest National Lab.PNNL. doi:10.2172/1806564
Gavaises, M., Andriotis, A., Papoulias, D., Mitroglou, N., and Theodorakakos, A. (2009). Characterization of String Cavitation in Large-Scale Diesel Nozzles with Tapered Holes. Phys. fluids 21, 052107. doi:10.1063/1.3140940
Guo, H., Torelli, R., Rodriguez, A. B., Tekawade, A., Sforzo, B., Powell, C., et al. (2020). Internal Nozzle Flow Simulations of the Ecn Spray C Injector Under Realistic Operating Conditions. SAE Int. J. Adv. Curr. Pract. Mobil. 2, 2229–2240. doi:10.4271/2020-01-1154
Gürsoy, D., De Carlo, F., Xiao, X., and Jacobsen, C. (2014). Tomopy: a Framework for the Analysis of Synchrotron Tomographic Data. J. Synchrotron Radiat. 21, 1188–1193. doi:10.1107/s1600577514013939
Kastengren, A., Powell, C. F., Arms, D., Dufresne, E. M., Gibson, H., and Wang, J. (2012a). The 7BM Beamline at the APS: a Facility for Time-Resolved Fluid Dynamics Measurements. J. Synchrotron Radiat. 19, 654–657. doi:10.1107/S0909049512016883
Kastengren, A., Tilocco, F. Z., Powell, C. F., Manin, J., Pickett, L. M., Payri, R., et al. (2012b). Engine Combustion Network (Ecn): Measurements of Nozzle Geometry and Hydraulic Behavior. At. Spr. 22, 1011–1052. doi:10.1615/atomizspr.2013006309
Laguna-Camacho, J. R., Lewis, R., Vite-Torres, M., and Méndez-Méndez, J. V. (2013). A Study of Cavitation Erosion on Engineering Materials. Wear 301, 467–476. doi:10.1016/j.wear.2012.11.026
Liu, H., Lee, C.-f., Huo, M., and Yao, M. (2011). Comparison of Ethanol and Butanol as Additives in Soybean Biodiesel Using a Constant Volume Combustion Chamber. Energy fuels. 25, 1837–1846. doi:10.1021/ef200111g
Liu, Y., Li, J., and Jin, C. (2015). Fuel Spray and Combustion Characteristics of Butanol Blends in a Constant Volume Combustion Chamber. Energy Convers. Manag. 105, 1059–1069. doi:10.1016/j.enconman.2015.08.047
Maes, N., Skeen, S. A., Bardi, M., Fitzgerald, R. P., Malbec, L.-M., Bruneaux, G., et al. (2020). Spray Penetration, Combustion, and Soot Formation Characteristics of the Ecn Spray C and Spray D Injectors in Multiple Combustion Facilities. Appl. Therm. Eng. 172, 115136. doi:10.1016/j.applthermaleng.2020.115136
Magnotti, G., Kundu, P., Nunno, A. C., and Som, S. (2021a). “Linking Cavitation Erosion in a Multi-Hole Injector with Spray and Combustion Development,” in International Conference on Liquid Atomization and Spray Systems Iclass. doi:10.2218/iclass.2021.5827
Magnotti, G., Nunno, A. C., Kundu, P., Tekawade, A., Sforzo, B. A., Kastengren, A. L., et al. (2021b). A Comparison of Injection, Spray, and Combustion Characteristics for Non-eroded and Eroded Multi-Hole Fuel Injectors. Intern. Combust. Engine Div. Fall Tech. Conf. 85512, V001T03A002. doi:10.1115/ICEF2021-67775
Magnotti, G., Tekawade, A., Sforzo, B. A., Kastengren, A. L., Powell, C. F., and Som, S. (2021c). “Impact of Injector Geometry Details on Cavitation and Erosion Development in a Multi-Hole Aluminum Injector Nozzle,” in Proceedings of the 11th International Symposium on Cavitation (CAV).
Magnotti, G. M., Battistoni, M., Saha, K., and Som, S. (2019). Influence of Turbulence and Thermophysical Fluid Properties on Cavitation Erosion Predictions in Channel Flow Geometries. SAE Int. J. Adv. Curr. Pract. Mobil. 1, 691–705. doi:10.4271/2019-01-0290
Magnotti, G. M., and Som, S. (2020). Assessing Fuel Property Effects on Cavitation and Erosion Propensity Using a Computational Fuel Screening Tool. J. Eng. Gas Turbines Power 142 (11), 111015. doi:10.1115/1.4048457
Marone, F., and Stampanoni, M. (2012). Regridding Reconstruction Algorithm for Real-Time Tomographic Imaging. J. Synchrotron Radiat. 19, 1029–1037. doi:10.1107/s0909049512032864
Matusik, K., Duke, D., Sovis, N., Swantek, A., Powell, C., Payri, R., et al. (2017). “A Study on the Relationship between Internal Nozzle Geometry and Injected Mass Distribution of Eight Ecn Spray G Nozzles,” in Ilass Europe. 28th european conference on Liquid Atomization and Spray Systems (Editorial Universitat Politècnica de València), 313–320. doi:10.4995/ilass2017.2017.4766
Matusik, K. E., Duke, D. J., Kastengren, A. L., Sovis, N., Swantek, A. B., and Powell, C. F. (2018). High-resolution X-Ray Tomography of Engine Combustion Network Diesel Injectors. Int. J. Engine Res. 19, 963–976. doi:10.1177/1468087417736985
Mitroglou, N., Stamboliyski, V., Karathanassis, I. K., Nikas, K. S., and Gavaises, M. (2017). Cloud Cavitation Vortex Shedding inside an Injector Nozzle. Exp. Therm. Fluid Sci. 84, 179–189. doi:10.1016/j.expthermflusci.2017.02.011
Mueller, C. J., Cannella, W. J., Bays, J. T., Bruno, T. J., DeFabio, K., Dettman, H. D., et al. (2016). Diesel Surrogate Fuels for Engine Testing and Chemical-Kinetic Modeling: Compositions and Properties. Energy fuels. 30, 1445–1461. doi:10.1021/acs.energyfuels.5b02879
Park, S. H., Suh, H. K., and Lee, C. S. (2009). Effect of Bioethanol−Biodiesel Blending Ratio on Fuel Spray Behavior and Atomization Characteristics. Energy fuels. 23, 4092–4098. doi:10.1021/ef900068a
Patella, R. F., Challier, G., Reboud, J.-L., and Archer, A. (2001). “Cavitation Erosion Mechanism: Numerical Simulations of the Interaction Between Pressure Waves and Solid Boundaries,” in CAV 2001 symposium.
Pratama, R. H., Huang, W., and Moon, S. (2021). Unveiling Needle Lift Dependence on Near-Nozzle Spray Dynamics of Diesel Injector. Fuel 285, 119088. doi:10.1016/j.fuel.2020.119088
Rachakonda, S. K., and Magnotti, G. M. (2021). “Cavitation Erosion Modeling of Multi-Component Diesel Surrogates,” in ILASS Americas 31st Annual Conference on Liquid Atomization and Spray Systems.
Reitz, R. D., Ogawa, H., Payri, R., Fansler, T., Kokjohn, S., Moriyoshi, Y., et al. (2020). Ijer Editorial: The Future of the Internal Combustion Engine. Int. J. Engine Res. 21, 3–10. doi:10.1177/1468087419877990
Riiff, T. J., Webb, M. A., Orts, W., and Aramthanapon, K. (2017). Small-angle Neutron Scattering Studies on an Idealized Diesel Biofuel Platform. Energy fuels. 31, 3995–4002. doi:10.1021/acs.energyfuels.6b03185
Sato, Y., Nakajima, S., Shiraga, N., Atsumi, H., Yoshida, S., Koller, T., et al. (1998). Three-dimensional Multi-Scale Line Filter for Segmentation and Visualization of Curvilinear Structures in Medical Images. Med. image Anal. 2, 143–168. doi:10.1016/s1361-8415(98)80009-1
Sforzo, B. A., Tekawade, A., Kastengren, A. L., Fezzaa, K., Ilavsky, J., Powell, C. F., et al. (2021). X-ray Characterization of Real Fuel Sprays for Gasoline Direct Injection. J. Energy Resour. Technol. 144 (2), 022303. doi:10.1115/1.4050979
Skoda, R., Iben, U., Morozov, A., Mihatsch, M., Schmidt, S. J., and Adams, N. A. (2011). “Numerical Simulation of Collapse Induced Shock Dynamics for the Prediction of the Geometry, Pressure and Temperature Impact on the Cavitation Erosion in Micro Channels,” in WIMRC 3rd international cavitation forum (UK: University of Warwick Coventry).
Sun, N. (2020). Developing Renewable Free Fatty Acid Surfactants to Form Diesel Blendstocks. United States. doi:10.2172/1618848 Available at: https://www.osti.gov/servlets/purl/1618848
Tekawade, A., Sforzo, B. A., Matusik, K. E., Kastengren, A. L., and Powell, C. F. (2019). High-Fidelity Geometry Generation from CT Data Using Convolutional Neural Networks. Dev. X-Ray Tomogr. XII 11113, 435–445. doi:10.1117/12.2540442
Torelli, R., Magnotti, G. M., Som, S., Pei, Y., and Traver, M. L. (2019). “Exploration of Cavitation-Suppressing Orifice Designs for a Heavy-Duty Diesel Injector Operating with Straight-Run Gasoline,” in 14th International Conference on Engines & Vehicles (SAE International). doi:10.4271/2019-24-0126
Torelli, R., Matusik, K. E., Nelli, K. C., Kastengren, A. L., Fezzaa, K., Powell, C. F., et al. (2018). Evaluation of Shot-To-Shot In-Nozzle Flow Variations in a Heavy-Duty Diesel Injector Using Real Nozzle Geometry. SAE Int. J. Fuels Lubr. 11, 379–295. doi:10.4271/2018-01-0303
Tzanetakis, T., Sellnau, M., Costanzo, V., Traver, M., Williams, T., Kahraman, E., et al. (2020). “Durability Study of a Light-Duty High Pressure Common Rail Fuel Injection System Using e10 Gasoline,” in WCX SAE World Congress Experience (SAE International). doi:10.4271/2020-01-0616
Tzanetakis, T., Voice, A. K., and Traver, M. L. (2018). Durability Study of a High-Pressure Common-Rail Fuel Injection System Using Lubricity Additive-Dosed Gasoline-Like Fuel. SAE Int. J. Fuels Lubr. 11, 319–335. doi:10.4271/2018-01-0270
Vidal, A., Kolovos, K., Gold, M. R., Pearson, R. J., Koukouvinis, P., and Gavaises, M. (2021). Preferential Cavitation and Friction-Induced Heating of Multi-Component Diesel Fuel Surrogates up to 450mpa. Int. J. Heat Mass Transf. 166, 120744. doi:10.1016/j.ijheatmasstransfer.2020.120744
Wei, L., Cheung, C. S., and Ning, Z. (2018). Effects of Biodiesel-Ethanol and Biodiesel-Butanol Blends on the Combustion, Performance and Emissions of a Diesel Engine. Energy 155, 957–970. doi:10.1016/j.energy.2018.05.049
Westlye, F. R., Battistoni, M., Skeen, S. A., Manin, J., Pickett, L. M., and Ivarsson, A. (2016). “Penetration and Combustion Characterization of Cavitating and Non-Cavitating Fuel Injectors under Diesel Engine Conditions,” in SAE 2016 World Congress and Exhibition (SAE International). doi:10.4271/2016-01-0860
Keywords: direct injection, diesel, cavitation-induced erosion, x-ray diagnostics, fuel spray
Citation: Moon CY, Magnotti GM, Sforzo BA, Tekawade A, Kastengren AL and Powell CF (2022) Experimental Investigation of Cavitation-Induced Erosion Using X-Ray Imaging and Tomography. Front. Mech. Eng 8:869165. doi: 10.3389/fmech.2022.869165
Received: 03 February 2022; Accepted: 12 May 2022;
Published: 27 May 2022.
Edited by:
Michael L. Traver, Aramco Americas, United StatesReviewed by:
Sebastian A. Kaiser, University of Duisburg-Essen, GermanyOssi Kaario, Aalto University, Finland
Michele Battistoni, University of Perugia, Italy
Copyright © 2022 Moon, Magnotti, Sforzo, Tekawade, Kastengren and Powell. This is an open-access article distributed under the terms of the Creative Commons Attribution License (CC BY). The use, distribution or reproduction in other forums is permitted, provided the original author(s) and the copyright owner(s) are credited and that the original publication in this journal is cited, in accordance with accepted academic practice. No use, distribution or reproduction is permitted which does not comply with these terms.
*Correspondence: Chi Young Moon, Y21vb25AYW5sLmdvdg==