 Nilesh L. Bagal
 Divyanshu Bhardwaj
- 1Engine Air Management, Eaton, Southfield, MI, United States
- 2Center for Digital Prototypes and Twins, Eaton, Southfield, MI, United States
Upcoming global emission regulations include considerable reduction in emission of nitrogen oxides (NOx) and greenhouse gases (GHGs) for vehicles with heavy-duty (HD) diesel application. These regulations will phase between 2024 and 2030 in the United States and the European Union. CARB Regulations include up to 90% reduction in NOx levels along with ∼25% reduction in CO2. One of the primary technologies used to reduce engine out NOx emission is the use of cooled exhaust gas recirculation (EGR). Research studies carried out across multiple domains by engine/vehicle original equipment manufacturers (OEMs) and others have identified air handling as one of the technologies to help meet next-generation regulations (Joshi, 2020; Dreisbach et al. 2021). This includes more efficient turbomachinery which helps improve engine efficiency and thus reduce GHGs. This has an adverse effect on driving EGR which affects engine out NOx. In this study, the development and performance impact of the EGR pump is investigated, which allows improved engine fuel efficiency without the corresponding penalty to engine out NOx. Computational fluid dynamics (CFD) is used to optimize the EGR pump design, which leads to reduction in fluid-borne noise of the pump, which is then evaluated for fuel benefits using a calibrated GT-POWER engine model.
Introduction
The negative influence of human activities on environment and air quality including transportation is a growing concern among all nations. Fossil fuel used in the transportation sector is a major source of greenhouse gas (GHG) emissions, and fuel consumption in heavy-duty engine application is set to grow further. The U.S. trucking industry is an integral part of freight transportation, with ∼75% freight transported by trucks using HD diesel engines for powertrain. Growing focus of the U.S. Department of Transportation (DOT) and the Environmental Protection Agency (EPA) is to improve vehicle efficiency in terms of CO2 reduction along with further reduction in NOx emission. Emission limits for critical pollutants such as PM and NOx have been reduced significantly in last 2 decades and yet new emission regulations are aiming for further significant NOx reduction along with CO2. The European Union and China will follow with next-generation regulations.
The use of cooled exhaust gas recirculation (EGR) is one of the primary ways to reduce engine out nitrogen oxide (NOx) emission from a diesel engine. This is done by reintroducing part of the exhaust gas from the exhaust manifold back into the intake system, typically through a charge air cooler (Zheng, 2004; Simson, 2020). Cooled EGR, which primarily consists of inert gases from in-cylinder combustion, helps lower burned gas and flame temperature. Lower burned gas temperature lowers the rate of formation of nitrogen oxide, thus reducing the engine out NOx. Exhaust manifold pressure is maintained higher than intake pressure to flow exhaust gases to the intake. This is done by closing vane positions in the case of variable geometry turbines (VGT) or wastegate (WG) operation for a fixed geometry turbine (FGT). The turbine operates at lower efficiency in order to maintain higher back pressure, thus affecting intake boosting capability. A negative engine delta pressure helps drive EGR flow and reduce engine out NOx but at the expense of increased pumping power and thus lowering the engine efficiency, leading to more fuel consumption.
The use of a positive displacement EGR pump helps decouple turbo from boosting and EGR flow requirement (Smith, 2021). Thus, a negative engine delta pressure is not required, which reduces pumping work and thus help improve fuel economy. The EGR pump developed by Eaton (Figure 1) is an optimized roots machine for diesel application. The EGR pump is driven by a 48 V electric motor capable of operating up to 3 kW continuous power (Hopkins, 2020). EGR flow rate control is achieved using a pump speed command through a controller area network (CAN) signal.
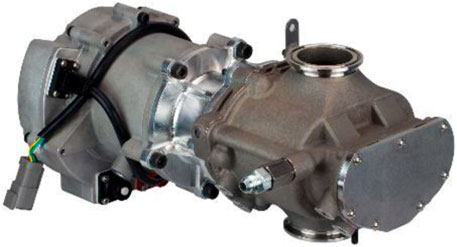
FIGURE 1. Eaton 48 V EGR pump.
This article presents a model-based development of the EGR pump product using CFD analysis and value proposition analysis of the EGR pump using GT-SUITE at Eaton. CFD analysis of the pump is discussed, including pressure pulsation and noise reduction to improve pump design and performance. The EGR pump prototypes are then manufactured and tested on gas stand to obtain performance maps. GT-POWER analysis is used to evaluate fuel consumption improvements of the EGR pump using performance maps along with optimized air system and engine calibration. Analysis led product development is important to developing robust hardware with optimizing time and engineering resources. The EGR pump prototypes are currently being tested for durability and on engine for performance validation. Figure 2 shows the model-based product development process in a flowchart. CFD and GT-SUITE analysis are highlighted in green boxes.

FIGURE 2. Flowchart of the EGR pump development process.
EGR Pump CFD Analysis
The EGR pump in consideration here is a roots-type blower, which traps a fixed volume of air between rotor lobes and the casing, and then as this sealed transfer volume rotates, it connects to the outlet port and delivers the trapped air to the outlet port, as shown in Figure 3. This pump uses a three-lobe rotor with a cycloidal profile and helps in reducing flow leakages and improving the pump volumetric efficiency. The rotors in a roots- type blower typically having a twist to reduce pulsations in the outlet flow, but since the EGR pump typically operates in a low pressure ratio regime (ratio of outlet pressure to inlet pressure) of max. pressure ratio (PR) reaching 1.3, the rotors in this application are untwisted to reduce design complexity and manufacturing costs.
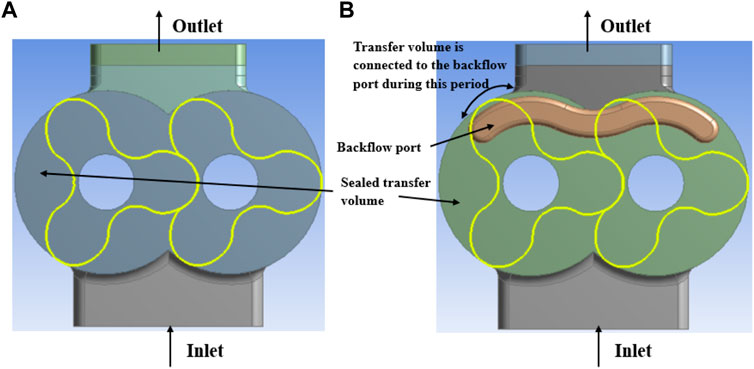
FIGURE 3. (A) Pump without backflow port. (B) With backflow port.
The pump inlet is usually at a lower pressure, and the outlet port is at a higher pressure. When low-pressure transfer volume opens to the high-pressure outlet port, the fluid from the outlet port rushes into the transfer volume, creating pressure pulsations which lead to fluid-borne noise (FBN). Since the rotors in this pump design are untwisted, the only mechanism to reduce pulsations in the outlet flow is to have a backflow port. The backflow port allows for the high-pressure air from an outlet port to gradually enter the sealed transfer volume, thereby achieving some intermediate pressurization of the transfer volume before it opens to outlet port. Thus, backflow port deign is being studied using CFD analysis to help reduce pressure pulsations in the outlet port and hence aid in pump performance and reduce pump operating noise. Three backflow port designs are evaluated for two different pump speeds using CFD analysis. CFD analysis has also been used to evaluate pressure pulsations for an angled inlet and outlet port geometry that allows for gradual pressurization of the transfer volume in addition to the backflow port.
Modeling Approach
The CFD simulations performed here to assess the flow performance of the EGR pump are 3-D transient simulations performed using commercial software Ansys CFX 17.1, in which the working fluid is air (which has been modeled using the ideal gas law to account for compressibility effects). The turbulent flow in the pump is captured using the SST turbulence model, which has been shown to perform well for flows in the presence of an adverse pressure gradient (Menter and Rumsey, 1994). The model uses a blending function to take advantage of both the near-wall modeling capability of the k-omega model and the boundary layer edge (free shear layer) modeling capability of the k-epsilon model (Menter, 1993).
As mentioned earlier, backflow port design is being evaluated to improve pump performance with lower pressure pulsations. The comparison between the different backflow port designs is made on the basis of pressure pulsations in the outlet port measured in the CFD analysis. To study the pressure pulsation in the outlet port, a section plane has been created, as shown in Figure 4, and the average pressure at this plane monitored through the simulations; higher the pressure variation, higher will be the fluid-borne noise of the pump.
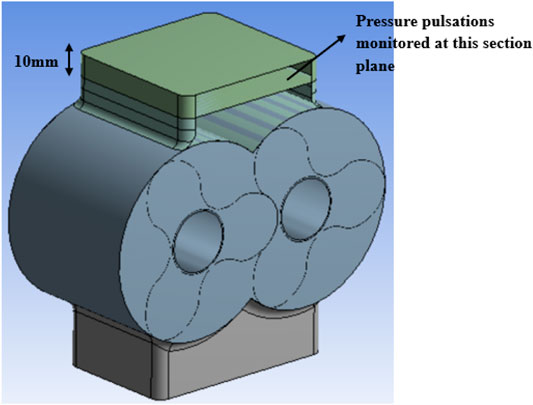
FIGURE 4. Monitoring pressure pulsations in the outlet port for the EGR pump.
Meshing Approach
The pump fluid domain consists of two static inlet and outlet port volumes and a deforming zone containing the volume between pump casing and the two meshed rotors. The deforming zone is captured using dynamic mesh created using CFX-berlin Twinmesh 17.1; this software package creates a hexahedral mesh as shown in Figure 5 for the deforming zone. The two stationary inlet and outlet ports are meshed separately using Ansys mesher 17.1 to create a tetrahedral mesh and then the deforming zone mesh is appended to complete the flow domain; appropriate interfaces are created between the static domain and the deforming zone meshes. The mesh details are shown in Table 1.
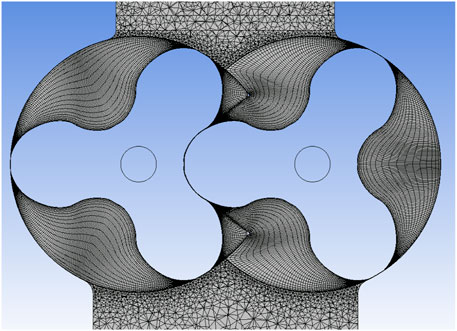
FIGURE 5. Section plane across the center of the rotors showing hexahedral mesh in the pump deforming zone and tetrahedral mesh in the static domains.
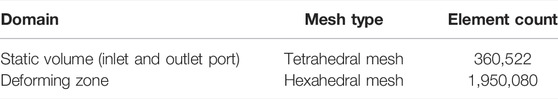
TABLE 1. Mesh details.
Boundary Conditions
The boundary conditions for the CFD simulations are a fixed inlet pressure and temperature imposed at the inlet boundary, and the outlet pressure is specified according to the pressure ratio of the pump under study. The mesh is given a dynamic mesh motion using a user-defined function (UDF) to capture the rotary motion of the rotors, and pump rotational speed is specified in the UDF.
Results and Discussion
The baseline EGR pump design and the designs with backflow port on one side and two sides are shown in Figure 6. CFD simulations were performed for the three designs at two operating points, pump speeds of 10,000 and 5,000 rpm with a pressure ratio of 1.3 (ratio of outlet pressure to inlet pressure) to capture the pressure pulsations in the outlet port, as shown in Figure 7. The pressure pulsation plot shown in Figure 7 has been scaled with the inlet pressure. The peak-to-peak (P2P) pressure pulsation in the outlet port for one-side backflow port design at 10,000 rpm condition is 36% less than the case, where there is no backflow port, and it drops further for the two-side backflow port design, a 43.6% reduction compared to without backflow port design. The peak-to-peak (P2P) pressure pulsation in the outlet port for one-side backflow port design at 5,000 rpm condition is 45.9% less than the case where there is no backflow port, and it drops further for the two-side backflow port design, a 65.9% reduction compared to without backflow port design.
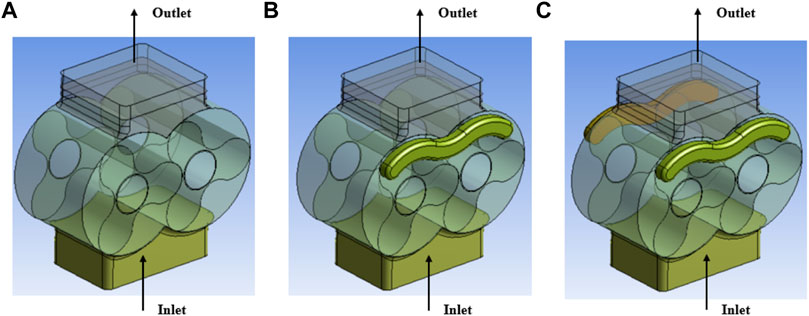
FIGURE 6. (A) Without backflow port design. (B) One-side backflow port. (C) Two-side backflow port design.
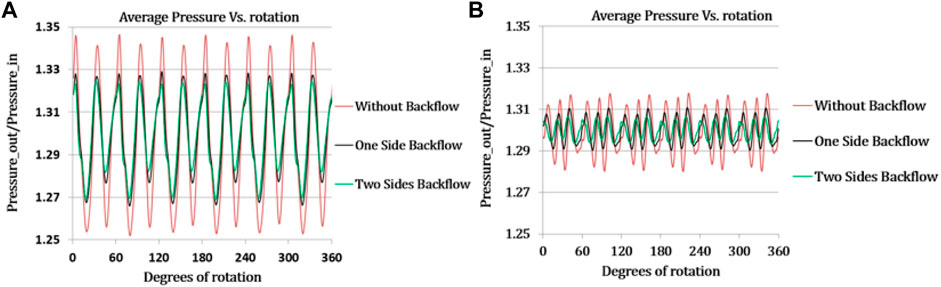
FIGURE 7. Pressure pulsations for without backflow, one-side backflow, and two-side backflow port designs. (A) 10,000 rpm and PR-1.3. (B) 5,000 rpm and PR-1.3.
As mentioned earlier, the benefit of including a backflow port in the pump can be seen in Figures 8, 9. The pressure in the transfer volume that is about to connect to the outlet port increases as we move from without backflow port design to one-side backflow port design to two-side backflow port design. This shows that the backflow port is providing a gradual pressurization to the transfer volume, and this helps in reducing the pressure pulsations in the outlet port, as seen in Figure 7. Another thing to notice here is that the pressure in the transfer volume that is about to connect with the outlet port is greater in two-side backflow port design at 5,000 rpm than that at 10,000 rpm. This is because at lower speeds, there is more time available to pressurize the transfer volume before it connects to the outlet port, and this is precisely the reason why there is higher reduction in P2P pressure pulsation with the two-side backflow port design at lower speeds.
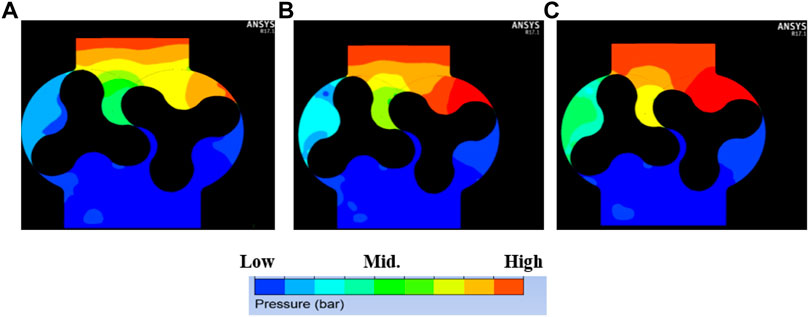
FIGURE 8. Pressurization in the transfer volume before opening to the outlet port at 10,000 rpm and PR-1.3. (A) Without backflow port design. (B) One-side backflow port design. (C) Two-side backflow port design.
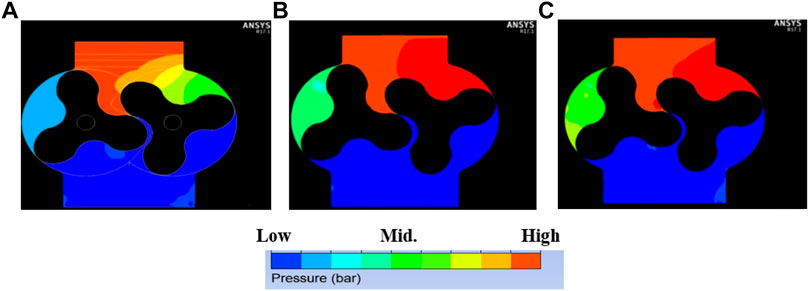
FIGURE 9. Pressurization in the transfer volume before opening to the outlet port at 5,000 rpm and PR-1.3. (A) Without backflow port design. (B) One-side backflow port design. (C) Two-side backflow port design.
Inlet and outlet port geometries have also been studied to reduce the fluid-borne noise (FBN) of the pump. The angled inlet and outlet porting with backflow slots on two sides are shown in Figure 10, and this angled configuration allows for the gradual opening of the transfer volume to the outlet, and hence, in addition to the two backflow ports, the outlet port also aids in gradual pressurization of the transfer volume. CFD simulations were performed for angled port design at 10,000 rpm pump speed and a pressure ratio of 1.3, and the results were compared with the earlier simulation results for with and without backflow port designs. The pressure pulsation comparison between the baseline design without a backflow port, the two-side backflow port design, and the angled port with two-side backflow port design is shown in Figure 11. The pressure pulsation plot shown in Figure 11 has been scaled with the inlet pressure. The P2P (peak to peak) pressure pulsations for the angled port with two-side backflow design is 50% less than the case without any backflow port design.
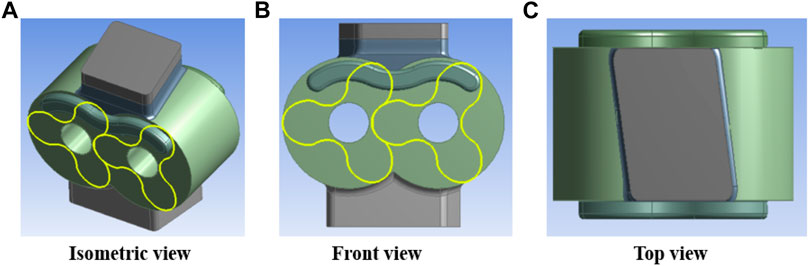
FIGURE 10. Angled port design with two sides backflow port.
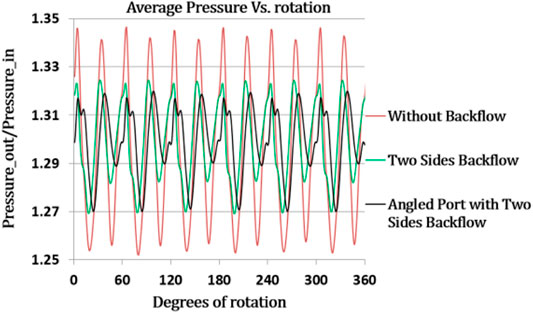
FIGURE 11. Pressure pulsations for without backflow, two sides backflow, and angled port with two sides backflow port designs at 10,000 rpm and PR-1.3.
Pressure contours at a section plane cutting across the rotors, the inlet, and outlet ports are shown in Figure 12; it can be seen here that the angled port with two-side backflow port design has the highest pressurization of the transfer volume among the three designs. This reduces the difference in pressure between the outlet port and the transfer volume, resulting in lesser pressure pulsations when this transfer volume opens to the outlet port.
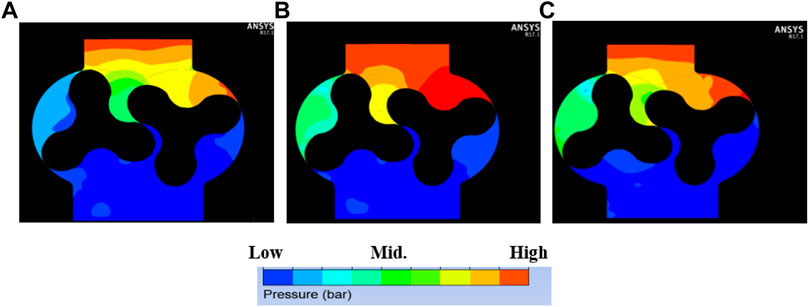
FIGURE 12. Transfer volume pressurization before opening to outlet port at 10,000 rpm and PR-1.3. (A) Without backflow port design. (B) Two-side backflow port design. (C) Angled port with two-side backflow port design.
A prototype with optimized design including a two-side backflow slot and optimized port configuration from CFD study is then manufactured. This sample is then run on a gas stand to generate the SAE standard flow and performance map to be used for analytical evaluation of the EGR pump performance in the next section.
EGR Pump Performance Evaluation
The engine CO2 reduction from using the EGR pump stems from reduced pumping losses using optimized turbo and decoupling turbo from EGR requirement. The EGR pump helps drive the required EGR for an optimized engine operation. This is achieved by optimizing the air system including dedicated turbo match for boosting and optimized exhaust system to improve pulse dynamics going in turbine. Further performance benefit can be achieved with optimizing combustion, and calibration as the EGR pump can provide higher EGR mass flow when required. The aim of this study was to analytically evaluate the EGR pump value proposition in terms of fuel savings on an HD diesel engine. The EGR pump design optimized from previous CFD study was put on a gas stand to generate an SAE standard performance map (Figure 13). This map is used in a 1-D cycle simulation tool (GT-POWER) to calculate the EGR pump power with the aim to meet the EGR flow requirement. The GT-POWER model applies this power as parasitic power to the engine and calculates the lower or additional fuel required to meet the target engine power and thus adjusts the BSFC value accordingly. This is done by the GT-POWER model based on the equation shown in the following equation. Thus, the power required to drive the EGR pump is included when evaluating the EGR pump BSFC benefit.
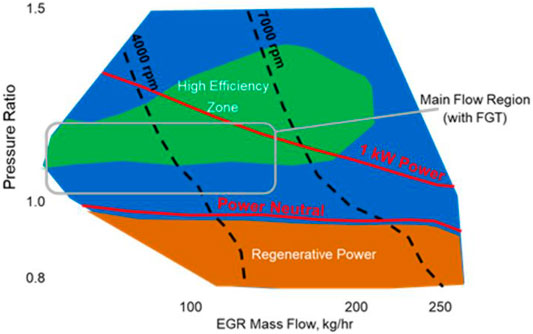
FIGURE 13. EGR pump performance map (Bitsis et al., 2021).
Methodology
In this study, analytical evaluation of the EGR pump fuel benefits is performed using a well-calibrated GT-POWER engine model. The base engine model is a generic 12.6-L engine model developed by Gamma Technologies and purchased by Eaton. The base engine model is modified to be representative of current production 13-L HD diesel engine in terms of the engine characteristics and calibration. This is done with inputs and data from the Southwest Research Institute (SwRI) Clean High Efficiency Diesel Engine (CHEDE) consortium. Eaton is part of the CHEDE consortium where the engine is being researched upon. Engine being considered is a 2019 production state-of-the-art 13-L 6-cylinder HD diesel engine with a single-stage VGT turbocharger and high-pressure loop EGR. Thus, the data used to calibrate base GT-POWER engine model come from a close to production calibration, which has been optimized by the engine original manufacturer. The baseline engine model is then validated with measured data to be used for the EGR pump analysis.
The validated baseline engine model is then implemented with the EGR pump and optimized turbo. Exhaust manifold design is changed to split exhaust to benefit from higher pulse energy. Finally, engine calibration optimization is performed to evaluate the maximum benefit from using the EGR pump. All architecture changes help improve fuel economy only when clubbed with the EGR pump. The EGR pump decouples turbo from EGR flow requirement, so the benefit from a high-efficiency turbo can be realized due to reduction in pumping loop. The EGR pump provides complete authority on EGR flow as it is battery-driven, which is not possible with turbo. This helps with optimizing the engine calibration, for example, advancing the start of injection and more EGR. An engine flowchart with the EGR pump can be seen in Figure 14.
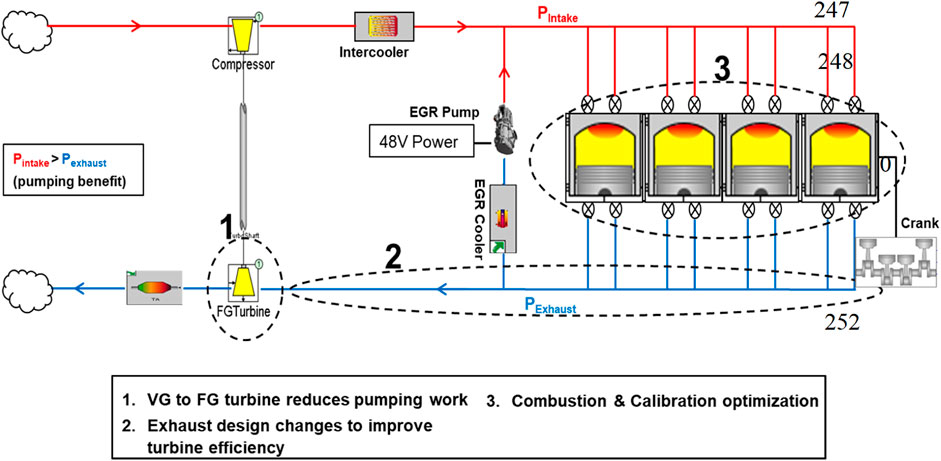
FIGURE 14. Engine flowchart with EGR pump.
Base Model Development and Calibration
The base GT-POWER engine model is developed to capture all key systems from the intake to exhaust excluding after treatment. The model carries baseline turbo maps from generic Gamma Technologies model. The DI-Pulse combustion model is used to capture in-cylinder combustion. The NOx emission model uses the Zeldovich mechanism. A good representative and well-calibrated baseline model is key for further evaluation of new technology including EGR pump, optimized turbo match, and calibration.
The model is calibrated with engine data from the SwRI CHEDE program for the 13-mode European Stationary Cycle (ESC). SwRI provided data for key performance parameters including intake and exhaust pressures and temperatures, mass flow rate, EGR level, injection timing, and engine out NOx. Turbo tuning factors are used to calibrate the engine model to match boost and back pressure along with the volumetric flow. Combustion model parameters are tuned for performance prediction along with the NOx model. Only a small set of data was used to calibrate model, and model predictions were validated using all measured data. As can be seen from Figure 15, model results were compared well with the measured data for key performance parameters. Plots show normalized data to protect raw values from the engine calibration. Measured data are on the X axis, and model predictions are on the Y axis. Points closer to 1 × 1 line show a good correlation between model prediction and measured data. Maximum difference between the measured data and GT model prediction is ∼3% for most of the parameters and all engine speeds. The BSNOx result comparison shows discrepancy between model prediction and measured data, but some of the data are questionable as it does not show much variation in engine out NOx for different operating conditions including speed, load, and EGR%. The GT model was validated separately with the parameter sweep DOE data for more confidence.
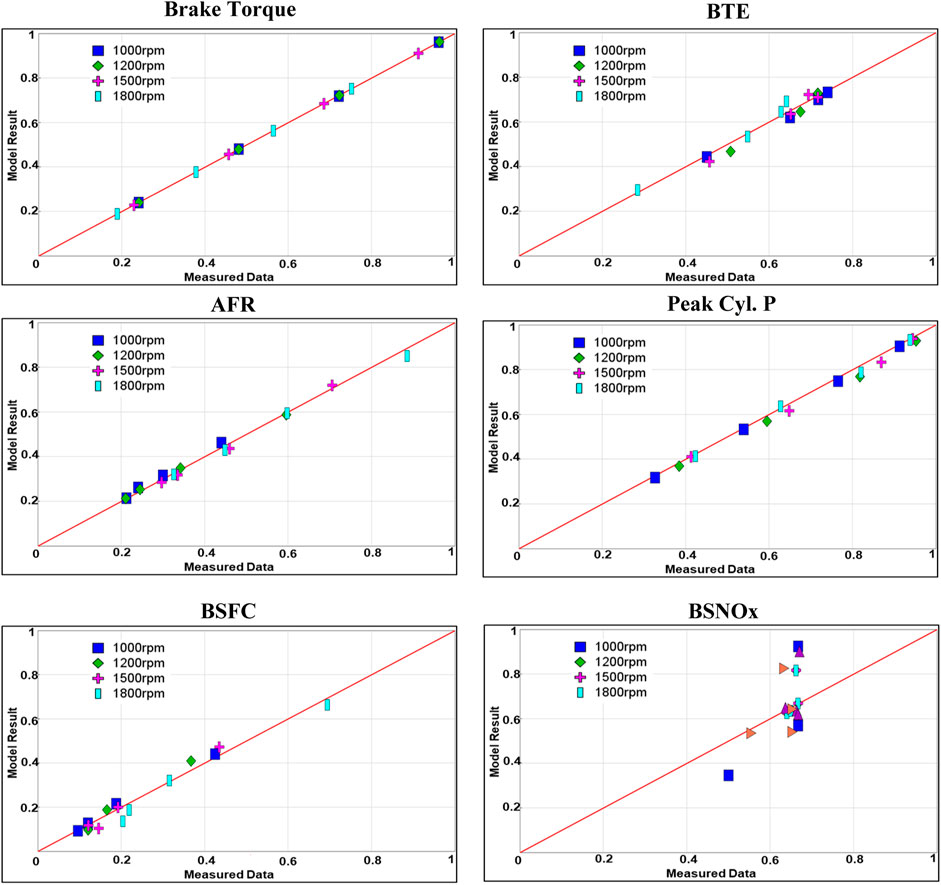
FIGURE 15. GT model prediction comparison with measured data for key engine parameters.
Along with the cycle-averaged parameters seen in Figure 15, model results for crank angle–resolved cylinder pressure are also compared with the measured data. As can be seen from Figure 16, GT model results correlate well with the measured data for in-cylinder pressure during the whole cycle. Cylinder pressure values are hidden to protect combustion details.
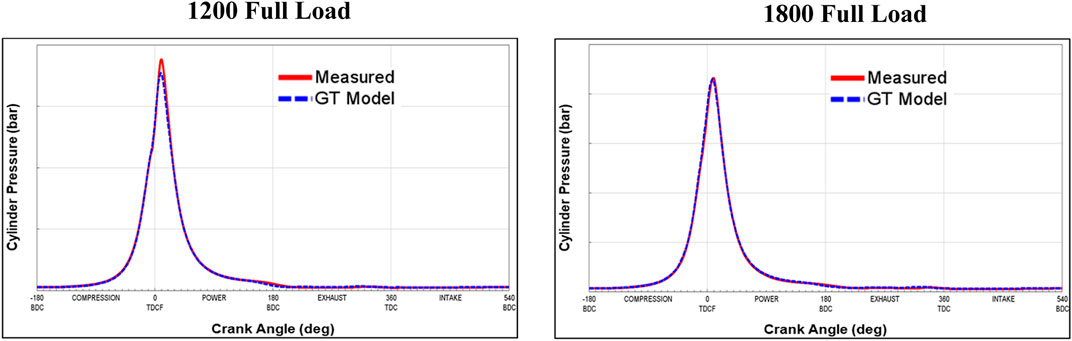
FIGURE 16. GT model prediction for cylinder pressure compares well with measured data (EGR Pump plus Turbo Matching).
The GT-POWER engine model is then implemented with Eaton EGR pump performance maps developed from optimized design discussed before. To understand the true benefit of the EGR pump, a system-level optimization needs to be performed for the air system and engine calibration. This includes a turbo match that is optimized for the EGR pump usage. Thus, a turbo match was performed to replace the VGT from the baseline engine and develop an optimized solution with a twin-entry fixed geometry turbine (FGT) with wastegate (WG). Since the EGR pump helps decouple EGR flow requirement from turbo, a high-efficiency twin-entry FGT turbine match is performed to meet the engine flow requirements. This is done using a parametric turbo map object in GT-POWER, which helps optimize turbo match by parameterizing the key turbine characteristics like wheel diameter, critical PR, peak efficiency etc. The FGT turbine size and efficiency are optimized to provide required boost at peak torque and maintain low-speed torque capability. Optimized turbine efficiency was then compared with the test data measured from a similar exercise done by SwRI for the CHEDE program and shows good comparison as seen from numbers in Figure 17. This twin-entry FGT turbine was selected to be used with the EGR pump.
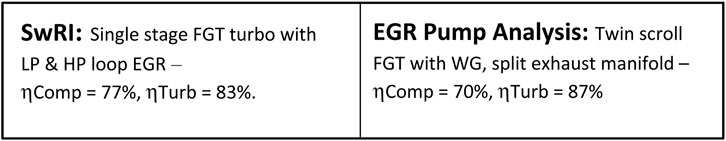
FIGURE 17. Turbine efficiency comparison.
Engine Calibration and Design Optimization
After turbo selection, engine design and calibration are optimized for maximum fuel improvement using the EGR pump. This includes modification of the exhaust manifold design from a single log to split exhaust to benefit from high–pulse energy flow into the turbine. Further engine calibration, compression ratio (CR), and Miller cycle sensitivity are evaluated to further improve fuel economy. DOE’s run with varying SOI, EGR%, CR at different levels of late intake valve closing (LIVC) for all engine operating conditions. Optimized values are then selected for these parameters which show improved fuel efficiency along with maintaining base engine BSNOx values and a peak cylinder pressure below 250 bar. Figure 18 shows DOE runs for these parameters and selected optimized value for a key engine speed load operating condition. Plots show normalized data to protect raw values from engine calibration.
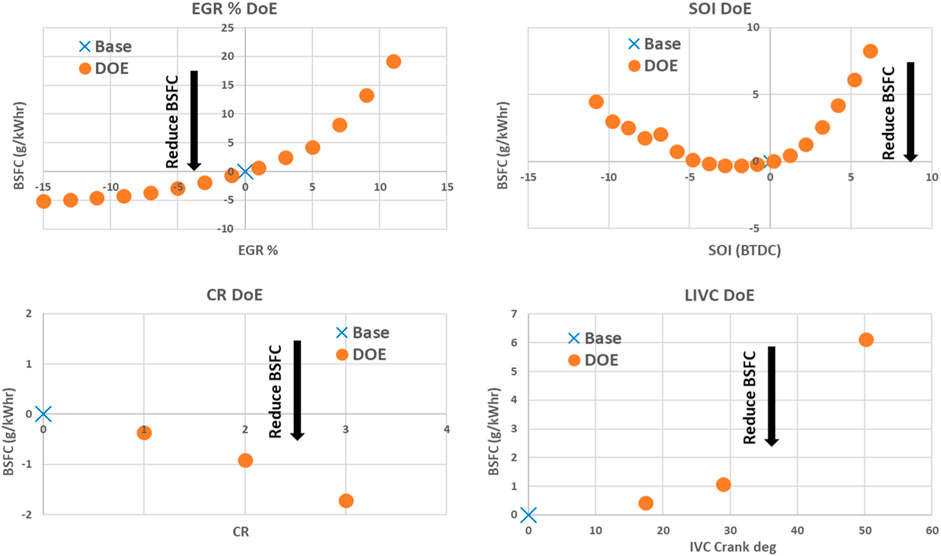
FIGURE 18. Key parameter DOE for optimized architecture.
As can be seen from Figure 18, decreasing EGR% from the baseline improved BSFC but with NOx penalty. Base engine SOI is close to the optimized value, and increasing CR improves BSFC compared to the base but with increasing peak cylinder pressure. LIVC is used to help reduce peak cylinder pressure along with increased BSFC. Optimized values of increased CR, LIVC, SOI, and EGR% are selected for each operating condition, with an aim to minimize fuel consumption and maintain the engine out NOx and peak cylinder pressure limit.
Final solution is an engine with the EGR pump, optimized turbo match, and exhaust manifold design along with key calibration parameters. The GT-POWER engine model (Figure 19) with the aforementioned optimized architecture is run for the same engine operating conditions as the baseline engine to evaluate fuel benefit from the new system. Figure 20 shows the engine model prediction result comparison for key engine performance parameters between the base engine and optimized system with the EGR pump. Parameter values are hidden to protect engine calibration and performance information as raw data are the property of the SwRI CHEDE program.
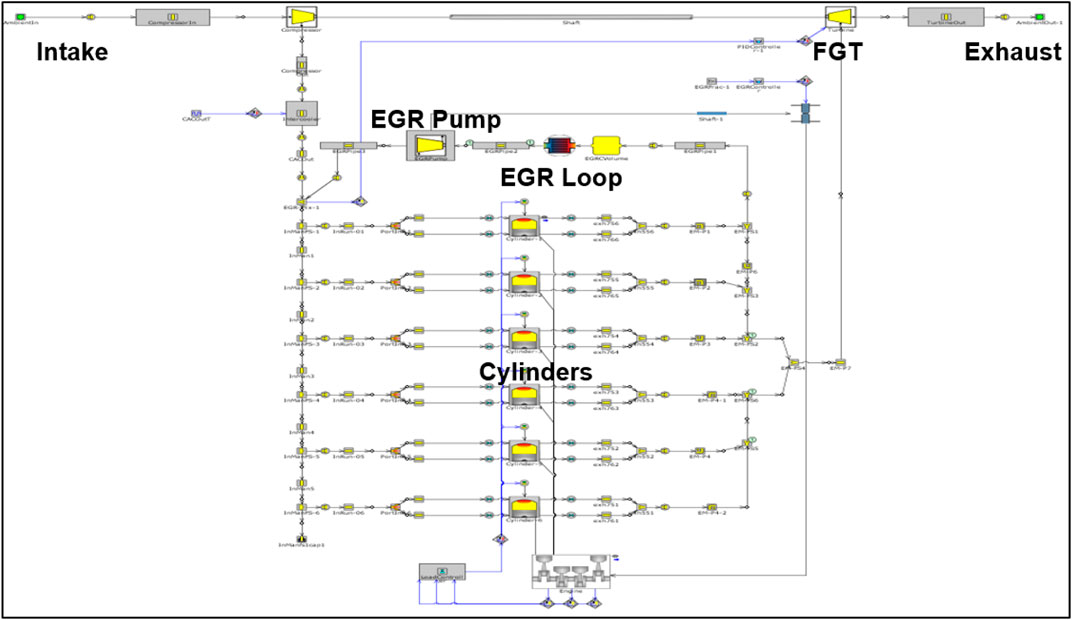
FIGURE 19. GT-POWER engine model layout with EGR pump.
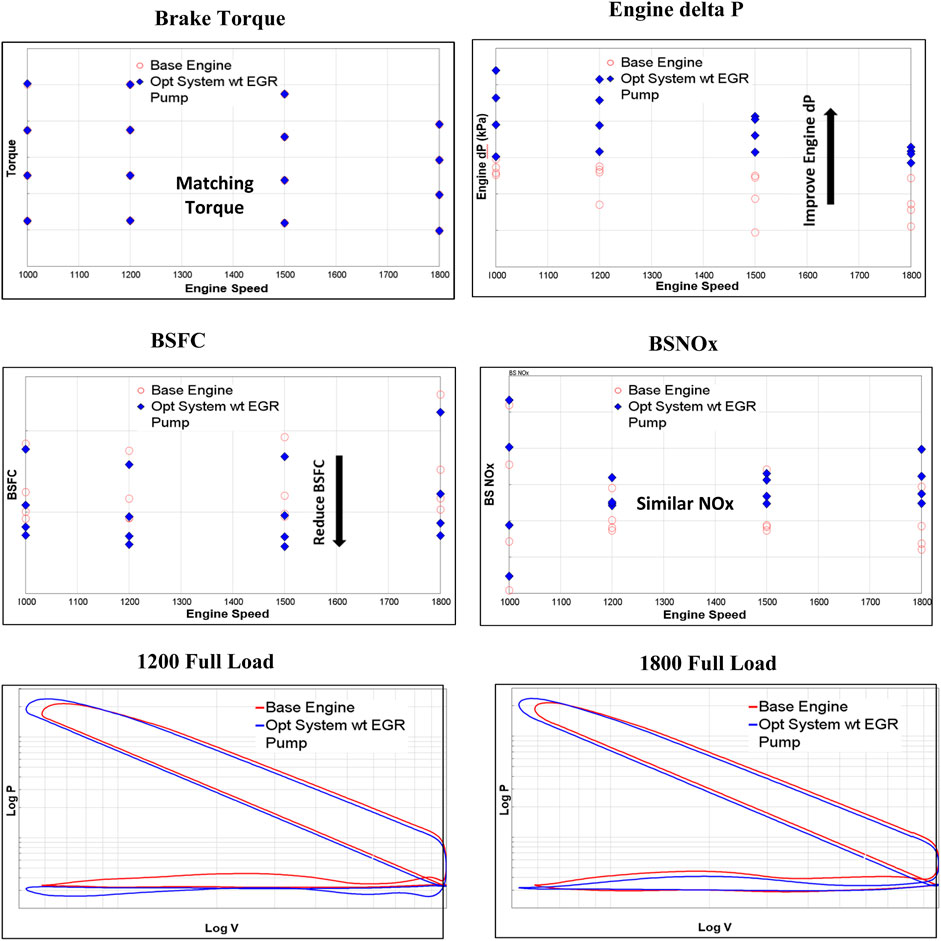
FIGURE 20. Key performance parameter comparison between base and new engine architecture.
The plot for torque comparison shows the GT model prediction for base and new engine architecture is the same; thus, s new engine maintains base engine torque and power capability. The plot for the engine delta pressure shows that negative engine delta pressure is reduced with a new engine architecture as compared to the base engine; this helps reduce pumping power. This can also be seen from a log PV plot for two different engine speeds and load plots where pumping loop is lower for a new engine. BSFC reduction for a new engine architecture is the result of the reduced pumping work for new engine architecture with the EGR pump.
Figure 21 shows %BSFC reduction for each speed load operating condition from ESC 13 mode. The new engine architecture using the EGR pump shows a maximum 6.2% fuel improvement at 1,500 rpm and full load. BTE improvement is around 1.3 point as compared to baseline engine BTE. Optimized turbo and engine calibration are dependent on the EGR pump as they provide additional benefits only when coupled with the EGR pump. Otherwise the baseline engine turbo and calibration are optimized solution for the engine architecture without the EGR pump.
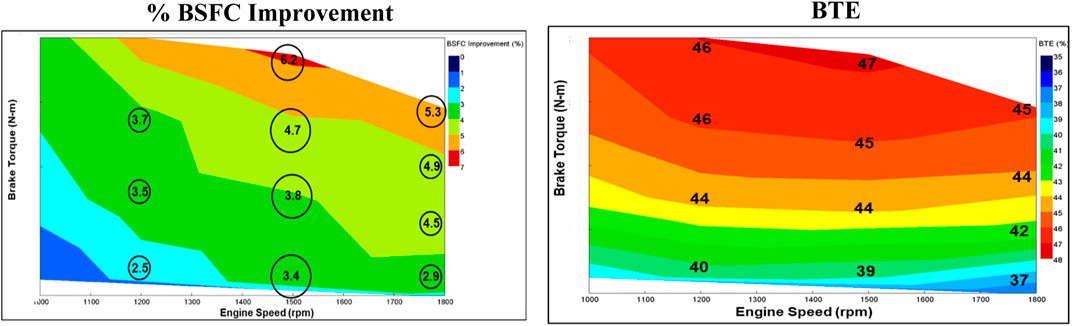
FIGURE 21. %BSFC and BTE improvement from new engine architecture using EGR pump.
Summary
This study and article describe analysis-led development of the EGR pump along with its value proposition. CFD simulations are performed on the EGR pump to predict pressure pulsations in the outlet port. These pulsations are then compared between various designs with the aim of choosing a design that has the least fluid-borne noise. Out of the backflow port geometries analyzed, the two-sided backflow port design has the least pressure pulsations. This design has approximately 43.6 and 65.9% lower peak-to-peak pressure pulsation at 10,000 rpm and 5,000 rpm speed (PR of 1.3), respectively, than the baseline design without any backflow port. The inlet and outlet port geometries are also studied, and analysis shows that angled port geometry helps in gradual pressurization of the transfer volume. The angled port design with a two-sided backflow slot shows 50% less peak-to-peak pressure pulsation at 10,000 rpm and PR of 1.3 than the baseline design without any backflow ports. The optimized CFD design is then manufactured into prototype hardware and tested on a gas stand to generate the performance map. The performance map is then used in the GT engine model analysis to evaluate fuel benefit from using an EGR pump. A well-calibrated engine model is key in predicting BSFC benefits. A baseline GT-POWER engine model is developed first to represent a state-of-the-art current production 13-L HD diesel engine. The model is calibrated using engine data provided by SwRI and validated with an additional dataset for 13-mode ESC operating conditions. This model is then implemented with the Eaton EGR pump performance map, and turbo matching is performed to optimize a twin-entry FGT turbo. The model is then used to optimize exhaust manifold design with split exhaust configuration to increase pulse energy going into the turbine, thus improving turbo efficiency further. Engine calibration optimization is then performed for key engine-operating parameters along with optimizing the Miller cycle and compression ratio. The GT-POWER model includes the parasitic power consumption of the EGR pump while calculating the increase or decrease in fuel consumption. The new optimized engine architecture with an Eaton EGR pump shows a maximum of 6.2% BSFC improvement at a 1,500 rpm full load operating condition and 4.35% fuel benefit for the 13-mode ESC engine dyno cycle. This accounts to ∼1.3 point maximum BTE improvement. Thus, the model-based approach is performed to optimize EGR pump design and evaluate the benefit on the engine application.
Next Steps
The Eaton EGR pump is a product in development. An analysis-led approach will be used to further mature the product for commercialization including motor and pump hardware. This includes further development of design, along with reliability and durability analysis. The GT model prediction of fuel benefit will be validated using engine testing of the EGR pump on multiple HD diesel engines from different OEMs.
Equation
The following equation is for fuel mass adjustment in the GT engine model to include parasitic power required to drive the EGR pump. This is done internally in the GT tool, and no additional calculations need to be performed.
where Madj is the incremental fuel mass from the GT fuel injector (calculated internally by GT), ISFCRequired is the required ISFC to meet power requirement, PumpPWR is the pump power to meet EGR flow requirement, and
Data Availability Statement
The raw data supporting the conclusion of this article will be made available by the authors, without undue reservation.
Author Contributions
NB contributed to the analysis evaluation concept and performed GT simulation for fuel benefit evaluations. NB wrote the manuscript with contribution from DB. DB performed CFD study for product development.
Conflict of Interest
NB and DB were employed by Eaton.
Publisher’s Note
All claims expressed in this article are solely those of the authors and do not necessarily represent those of their affiliated organizations, or those of the publisher, the editors, and the reviewers. Any product that may be evaluated in this article, or claim that may be made by its manufacturer, is not guaranteed or endorsed by the publisher.
Acknowledgments
The authors would like to acknowledge contributions from others within Eaton’s Vehicle Technology Innovation, Product Engineering, and Modeling and Simulation CoE teams. We would also like to thank Chris Bitsis and Andrew Morris from Southwest Research Institute (SwRI) for providing engine data and information from the CHEDE program.
References
Bitsis, D. C., Matheaus, A., Hopkins, J., and McCarthy, J. (2021). “Improving Brake Thermal Efficiency Using High Efficiency Turbo and EGR Pump while Meeting 2027 Emissions,” SAE 21FFL-0216. under peer review for Sept. 28. United States: Publication.
Dreisbach, R., Corsini, D., Egarter, P., Hadl, K., Schäffer, J., Felix Seitz, H., et al. (2021). 50% Efficiency on a Combustion Engine – Status and Measurement Results. International Engine Congress.
Hopkins, Justin. G. (2020). 48V EGR Pump for Fuel Economy Improvement and NOx Reduction for Diesel Engine. GAMC Emissions September 23, 2020.
Joshi, Ameya. (2020). “Review of Vehicle Engine Efficiency and Emissions. SAE Technical Article 2020-01-0352.
Menter, F. (1993). “July). Zonal Two Equation Kw Turbulence Models for Aerodynamic Flows,” in 23rd fluid dynamics, plasma dynamics, and lasers conference, 2906.
Menter, F., and Rumsey, C. (1994). “Assessment of Two-Equation Turbulence Models for Transonic Flows,” in Fluid Dynamics Conference, 2343. doi:10.2514/6.1994-2343
Simon, R. (2014). Efficiency and Mixing Analysis of EGR-Systems for Diesel Engines. United States: KTH Industrial Engineering and Management.
Smith, E. (2021). “Electrified Heavy-Duty 4-cylinder Engine Concept for Class 8 Trucks. SAE Technical Article 2021-01-0719.
US EPA 40 CFR Parts 9, 22, 85; NHTSA 49 CFR Parts 523, 534 (2016). Greenhouse Gas Emissions and Fuel Efficiency Standards for Medium and Heavy-Duty Engines and Vehicles-phase 2. Final Rule” - Federal Register. et al.
Keywords: EGR, BTE, BSFC, CFD, GT-power
Citation: Bagal NL and Bhardwaj D (2022) 48V EGR Pump System Development and Fuel Benefit Evaluation. Front. Mech. Eng 8:673134. doi: 10.3389/fmech.2022.673134
Received: 26 February 2021; Accepted: 10 January 2022;
Published: 11 April 2022.
Edited by:
Anand Nageswaran Bharath, Cummins, United StatesReviewed by:
Luciano Rolando, Politecnico di Torino, ItalyNicolas Miché, University of Brighton, United Kingdom
Copyright © 2022 Bagal and Bhardwaj. This is an open-access article distributed under the terms of the Creative Commons Attribution License (CC BY). The use, distribution or reproduction in other forums is permitted, provided the original author(s) and the copyright owner(s) are credited and that the original publication in this journal is cited, in accordance with accepted academic practice. No use, distribution or reproduction is permitted which does not comply with these terms.
*Correspondence: Nilesh L. Bagal, TmlsZXNoTEJhZ2FsQGVhdG9uLmNvbQ==