 Panagiotis Grigoriadis
 Alexander Hoffmann1
 Chi Binh La
- 1IAV GmbH, Berlin, Germany
- 2IAV Automotive Engineering, Inc, Northville, MI, United States
A diverse set of technology solutions are in development for reducing vehicular CO2 emissions. Beside the conventional internal combustion engine, there are hybrid powertrains, fuel cells and full electric vehicles. The challenge is finding the right technology that can be quickly implemented into production as a cost effective solution. In addition to CO2 reduction during vehicle operation, the impact of CO2 in the production and recycling of future vehicles must also be considered. From this perspective, the role of turbocharging is evolving, becoming more important for the future. It is an enabler for mature technologies known to improve engine efficiency like Miller timing, lean burn, increased exhaust gas recirculation (EGR) dilution and exhaust heat recovery. As a boosting device, improved turbocharging can also benefit other powertrain types like fuel cells. All previously mentioned applications benefit from wider compressor maps and higher compressor ratios. To achieve an extension of the performance map to areas of low mass flow rate, different methods have been discussed with the two most promising being trim reduction introduced by IAV’s Variable Trim Compressor (VTC) and swirl generation. The most common device for inducing a swirl onto the incoming airflow is to use swirl generating wings in front of the compressor wheel. However, Iwakiri explained that putting a single plate in front of the compressor wheel disturbs the recirculating flow, which acts positively to extend the compressor map. On this basis, plates were developed that guide the strongly swirled back flowing air in such a way that they impose a swirl on the incoming air. Trim reduction is well known for its ability to shift the surge line and maintain compressor efficiency. To achieve this, a conical element before the compressor wheel guides the incoming flow to the inner area of the wheel resulting in reduced flow separation. An orifice can also achieve almost the same effect but with much less axial extension. The advantages and disadvantages of these measures are explained using numerical (CFD) and experimental (turbocharger test bench) to show the potential of each approach. In summary trim reduction using a conical geometry is still the best performing approach. However, considering package restrictions, an orifice is also a good choice. Whereas swirl producing principles have a moderate impact on shifting the surge line. The extension of high mass flow rate is also of interest and this study shows a simple method to improve the compressor performance map in this area. A combination of the measures to expand the map in both directions is conceivable and is presented here as a concept.
Introduction
Exhaust gas turbochargers have been used in internal combustion engines for decades. They consist of two radial turbomachines, a compressor and a turbine wheel which are located on a common shaft. The exhaust gas provided by the internal combustion engine feeds the radial turbine that consequently drives the radial compressor. The compressor forces more air into the combustion chamber than atmospheric pressure alone thus increasing the power density for a given displacement volume of an internal combustion engine. To control the boost pressure, an exhaust flap is attached to the unregulated radial turbine. Depending on the target boost pressure, more or less exhaust gas is guided to the turbine. The more the exhaust flap is opened, the more the efficiency of the radial turbine drops. For this reason, the variable turbine geometry (VTG) was introduced. Guiding vanes are positioned in the passage to the turbine impeller, which effects the accumulation behavior of the radial turbine and the flow angle of the exhaust gas into the blade channel. In the 1990s, this technology was increasingly used in large-scale production of diesel vehicles. Owing to high exhaust gas temperatures and consequently higher cost components, its application in gasoline engines was initially limited to high-performance vehicles (Gabriel et al. 2006). By using modern valve train strategies and combustion processes, VTG technology is also being introduced in large series in gasoline engines (Demmelbauer-Ebner et al. 2018) because early inlet valve closing leads to a reduction of the charge in the cylinder, to a shift of the center of heat release to lower values and thus to a reduction in the exhaust gas temperature. The result as well is a reduced propensity for spark knock. Cooled exhaust gas recirculation is also a measure that can favorably influence the knocking behavior of a gasoline engine. In a low pressure (LP) EGR system, a portion of the exhaust gas after the catalytic converter is drawn, cooled down and fed back into the fresh air supply upstream of the compressor. Exhaust gas recirculated to the combustion chamber has higher specific heat capacity than air thus reducing combustion temperatures. With the advantage of knock reduction, however both the Miller process and LP-EGR results in a reduction in specific power. An increase in the boost pressure is therefore necessary to compensate for this disadvantage. As a result, the operating points of a radial compressor moves in the compressor map along the engine induction behavior, toward higher compressor pressure ratios. The so-called surge limit then usually has a limiting effect. An expansion of the compressor map is then the requirement of the engine developers.
With the introduction of hybridized powertrains, the vehicle's electrical system has also become more powerful. Allowing for electrified boosting systems based on 12V or 48V to be used. An example is the eCharger which is a radial compressor driven directly by a high-speed electric motor (approx. 80,000 rpm). EChargers offer the possibility of expanding the operating range at least temporarily, regardless of the availability of engine exhaust gas flow. Such a technology has been presented already several times and is used in series production (Helduk et al. 2016). The downside is that this technology is relatively complex, expensive and require a relatively large amount of package space. Though, electrically assisted turbochargers (EAT) are regarded as an alternative by giving the additional opportunity to recuperate energy from the exhaust gas. They are designed so that an electric motor is mounted on the shaft of an exhaust gas turbocharger. This allows the turbocharger to be operated independently of the engine exhaust (Groeneveld and Übler 2020). The improved transient response behavior of the internal combustion engine is limited by the electrical power of the vehicle’s electrical network and by the surge limit of the radial compressor. The combination of an electrically assisted turbocharger with a means to expand the compressor map is therefore useful.
Also newer energy conversion systems like fuel cells are using charging systems based on radial machines. Compressor maps with a wide spread are required here in order to further increase system efficiency and power density (Bilz et al. 2016).
This means that in many modern applications, from internal combustion engines to fuel cells, there is a benefit for compression maps with a wide spread. The expansion of the compressor maps has been largely exploited through aerodynamic measures. As a result, the increase in the map spread comes at a loss in efficiency. As on the turbine side, the introduction of additional measures and technologies is now also required on the compressor side.
Literature Study
The development of technologies for expanding compressor maps goes back to the 1970’s (Jones 1970; Pampreen 1976). Back then and into the new millennium, the focus was mainly on systems that can influence the swirl in front of the compressor. For this purpose, guide vanes were positioned directly in front of the compressor impeller (IGV) in such a way that they impart a swirl to the inflowing air (Uchida et al. 2006; Kindl et al. 2004). An extensive literature search on the design, regulation and on experimental and numerical investigations of IGV can be found in Liu et al. (2019). In summary, it can be said that there are studies in which the surge limit has been reduced by up to 59% and the efficiency has been increased from 1 to 2%.
In Grigoriadis et al. (2011); Grigoriadis et al. (2012) a new approach was introduced based on the principle of seemingly reducing the trim of a compressor when necessary. For the experimental investigations, a conical body was made and positioned in front of the impeller. The incoming air is accelerated and prevented from entering the part of the impeller that is at a high peripheral speed. This leads to less flow separation and to a more favorable inflow angle onto the blade channel. The conical body covered approximately 40% of the inlet cross-section. This resulted in a shift of the surge limit by approximately 33% and an increase in the isentropic compressor efficiency by 7%-points. A variable system was also shown that produces a trim variability (VTC). The approach of trim change was later included in the studies by Bogner et al. (2018); Fujiwara et al. (2018); Karstadt et al. (2018); Weiske et al. (2018); Glahn et al. (2019). However, in these studies the streamlined cone body was replaced by a more compact design. In the closed position, the flow is guided through an orifice and in the open position, the inlet cross-section is completely released again. For these concepts, a similar potential with regard to the surge limit shift was shown as for the VTC system. Different measures for shifting the surge limit were already assessed in Czapka (2015). VTC, IGV, but also an exit guide vane system (EGV) and combinations were examined numerically and experimentally. As a single measure, the VTC system had the highest potential. In Herbst and Eilts (2015) and Herbst et al. (2011) an experimental investigation came to similar results. The basic charging system (2-stage) of a 1.4L gasoline engine with an effective output of 125 kW was replaced by a 1-stage charging system with VTG and a map-expanding measure on the compressor (IGV or VTC). The conclusion was that the best way to achieve the goal of setting the original base full load was to use the “VTG and VTC” combination.
Iwakiri et al. (2017) takes a completely different approach. The publication shows that a plate is placed in front of the impeller along the direction of flow (IASP). This plate influences the strongly swirled backflow generated near the shroud in such a way that the swirl is suppressed. This in turn has a positive effect on the inflowing air, whereby the surge limit is shifted by 20–35% towards lower mass flow rate. It would be interesting whether a stronger influence on the inflowing air, in the sense of imposing a swirl, would also be possible with such a measure.
In the majority of the publications, the two parameters “surge limit shifting” and “efficiency increase” are named, but an independent analysis is not helpful to evaluate different measures. A surge limit shift should be assessed if possible at iso-efficiency.
Numerical Studies
Theoretical Simplified Considerations
The leading edge of a compressor impeller blade has a decisive influence on the operating behavior of a compressor. In simplified terms, it is assumed that the entry speed c1 of the air into the compressor is the same over the entire entry cross section. As the leading edge radius r1 increases, the peripheral speed u1 increases linearly at a constant compressor speed. By twisting the leading edge angle, a uniform flow angle β1 into the blade channel can be produced over the entire leading edge radius. The equations for calculating the flow angle β1 are as follows (see also Figure 1):
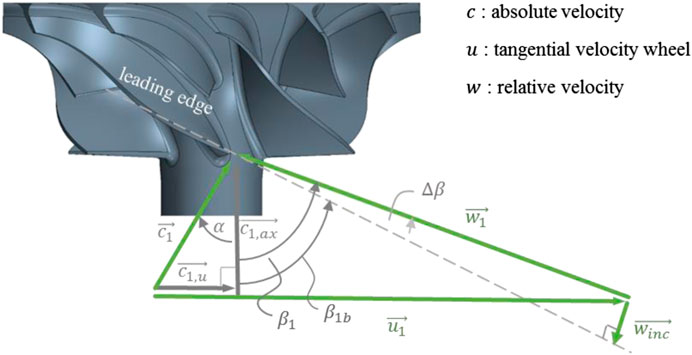
FIGURE 1. Velocity triangle at the compressor inlet.
Relative flow angle at the leading edge:
Circumferential speed:
Circumferential proportion of the entering flow:
Axial proportion of the entering flow:
Depending on the leading edge radius, the compressor speed and in particular the compressor flow rate, a large number of different ideal leading edge geometries results. Since only one geometry can be implemented in an impeller design, a compromise has to be found, which in the end can only be ideal for one ratio of c1 and u1.
All boundary conditions that deviate from this would lead to increasing incorrect flow onto the leading edge and thus to so-called incidence losses Δhinc. The incidence losses are calculated as follows, assuming an adiabatic process:
Incidence losses:
Deviation of the flow angle from the blade angle:
Velocity proportion related to angle deviation:
The leading edge geometry is selected such that the incidence losses are kept as low as possible in the relevant operating range (see black line in Figure 2). In order to achieve this and due to the quadratic relationship in Eq. 5, the geometry must be closer to the ideal course for high flow rates.
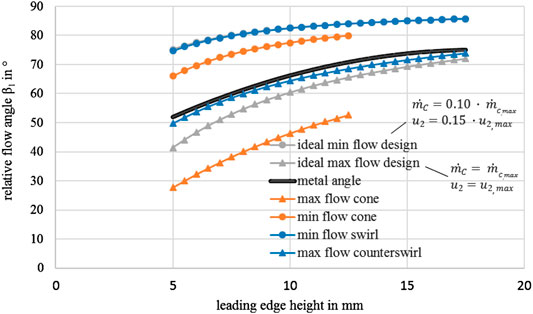
FIGURE 2. Calculated leading edge designs for different flow conditions.
The aim of additional measures is among other things, to reduce losses in order to improve the flow range and the efficiency of the compressor. The losses can be reduced by minimizing the difference (Δβ) between the inflow angle β1 and the chosen compromise angle βb. The equations given above were used for two measures (swirl and cone). Figure 2 shows the results of the inflow angles for different flow conditions. In summary, it can be stated that at low flow rates a trim reduction and at high flow rates a counter-swirl can bring the inflow angles closer to the compromise angles. This result can also be seen in Figure 3. It must be noted however, that this is a simplified preliminary consideration in which a flow constriction due to backflow or blockage through the wheel hub is not taken into account, but it has an important impact on the results Figure 4.
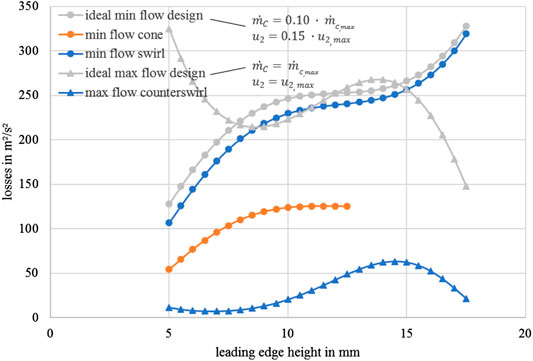
FIGURE 3. Calculated incidence losses for different flow conditions at compressor inlet.

FIGURE 4. Inflow conditions calculated on the basis of different methods for a medium flow rate and a medium peripheral speed.
Though, CFD calculations are necessary to cover all flow effects occurring in the compressor and to be able to make a better evaluation.
Model Description
The commercial software STAR-CCM +® from CD-adapco® was used for the numerical calculation of the flow conditions of the radial compressor. These calculations were used to:
1. visualize and to evaluate flow effects for IGV, VTC and IASP
2. design equivalent substitute bodies for the subsequent experimental investigation
3. enhance principles (IASP)
For this example, a radial compressor of a 2.0L passenger car engine with an inlet diameter of d1 = 35 mm and an outlet diameter of d2 = 46 mm was modeled.
Hexagonal mesh elements were employed with the areas close to the wall more finely resolved with the help of several prism layers. The following parameters were used as criteria for the net quality:
Cell quality >1,0 · 10–5
Skewness Angle <85°
y+ <150
The boundary conditions were chosen so that a constant pressure (1013 hPa) was specified at the inlet and a mass flow rate at the outlet. The walls were assumed to be adiabatic and the speed to be constant.
Compressor Performance Parameters
For the evaluation of the operating behavior, global variables such as the isentropic compressor efficiency ηsC, the total pressure ratio of the compressor Πtt,C and the normalized compressor mass flow were calculated as follows:
Total to total compressor pressure ratio:
Total pressure at compressor inlet:
Total pressure at compressor exit:
Normalized compressor mass flow rate:
with p1,ref = 1013 mbar and T1,ref = 293 K
Isentropic compressor efficiency:
For the assessment of the measures, the shift in the surge line is particularly important. The RANS method was chosen because of the shorter computing times. With this method, however, one cannot make any direct statements about the instability of the flow. However, it is common practice to use the fluctuations in the residuals and the mass deficit between compressor entry and compressor exit as criteria for instability. The following equations are used to calculate the standard deviation of mass deficit:
Mass deficit of each iteration:
Mean value of imbalances of the last N iterations:
Standard deviation:
Standard deviation in percent:
Results
Comparison of Cone, IGV and IASP
Figure 3 shows the ideal flow angle over the radius for a medium flow rate (dash-dot) and an assumed angle profile for the leading edge (dashed). The black solid line is the result of a CFD simulation and already shows the fundamental differences between CFD and the simplified approach, which was described in Theoretical Simplified Considerations. Using the example of a flow deflection, as it could take place at IGV, the limits of the simplified approach are to be illustrated. The course of the CFD calculation is on average below the result of the simplified calculation and shows larger deflections at very small (<7 mm) and at very large (>16 mm) leading edge radius.
If, based on the CFD result for normal inflow (black line), a loss-free 60° deflection of the flow is assumed and it is also assumed that such a process occurs decoupled from the flow in the impeller, the pink trace results. As in Theoretical Simplified Considerations, a flow deflection considered under these conditions have little influence on the flow conditions, even with medium flow rate. If a swirl element is implemented in a CFD model, which causes the same deflection, the result is the green trace, which:
• clearly differs from the simplified approach and;
• approaches the geometric course of the leading edge.
The total pressure ratio, the isentropic efficiency and the average flow angle for the basic geometry for a swirl insert, for a cone and for IASP are shown in Figure 5. The simulated operating point was chosen so that it roughly corresponds to operation of a turbocharger compressor in the low end torque of an internal combustion engine. In the base, with the selected boundary conditions an average flow angle of 58.96° is achieved. With a view to reducing the incidence losses, the flow angle must be reduced. As already known from the preliminary investigations, this works very well by reducing the trim from 0.76° to 0.59, which means that the average flow angle drops to 50.64°. Deviating from the results of the preliminary investigation, a swirl insert with blade angles starting with 30° at the blade root and ending with 60° at the tip can also achieve good results with regards to the lowering of the mean flow angle (52.61°). The use of the IASP brings only a marginal change in the mean flow angle (58.78°). The efficiency was calculated for all variants, but it is difficult to evaluate because the operating point does not remain constant in the calculations. Especially in the case of swirl use, the pressure ratio deviates by approximately 3% from the base value. The evaluation of the measures on the basis of only one operating point is not sensible, as serious advantages or disadvantages could lie in other regions of the respective map. This part of the study should therefore be used as a visualization of effects that do not emerge from the global variables in the experiment that follows later.
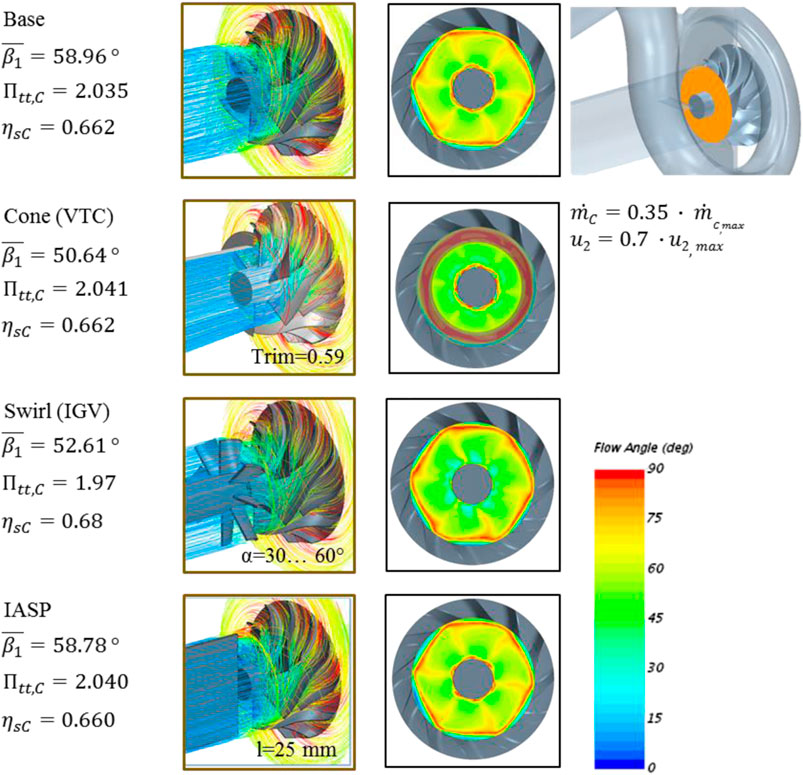
FIGURE 5. CFD results of base, cone, swirl and IASP.
Backflow Guiding Plates
CFD calculations were carried out in order to understand the mechanisms of IASP. Essentially, the result was that the plate alone did not make much of an impact. Only the combination of plate and enlarged compressor inlet leads to the results shown by Iwakiri et al. (2017). The mass deficit decreases from the base of approximately 3.5 g/s to values <1 g/s, which indicates increasing stability of the flow.
Figure 6 shows the comparison between the flow profiles with a cylindrical compressor inlet (shown on the left) and with an enlarged compressor inlet (shown on the right). The expansion causes a reduction in the flow velocity c1, as a result the air exiting the compressor wheel which has a high tangential velocity component can penetrate further upstream into the compressor inlet. The air particles collide against the plate and generate a counter-swirl, which ultimately increases the value of the mean flow angle to 63.13°. The research gave rise to the idea of using this high-energy flow to positively influence the air flowing into the compressor. From Grigoriadis (2008) it emerges that the influence of the recirculating air increases with decreasing air mass flow. The plate is therefore replaced by guide elements. These guide elements should guide the air flowing back in such a way that they impart a positive swirl to the air flowing in. A parameter variation led to a geometry proposal for the subsequent experimental investigations. The varied parameters include the number of guide elements, the distance to the impeller, the width of the guide elements and others. Figure 7 shows two selected results from this variation. The two variants differ in particular that variant 6 was positioned much closer to the impeller (1.5 mm) than variant 3 (15 mm) in the axial direction. In both cases, an increase in the pressure ratio compared to the base is achieved. As already described above, the slightly increased efficiency cannot be assessed on this basis. For testing and due to the simpler geometry, an insert based on variant 3 was manufactured.
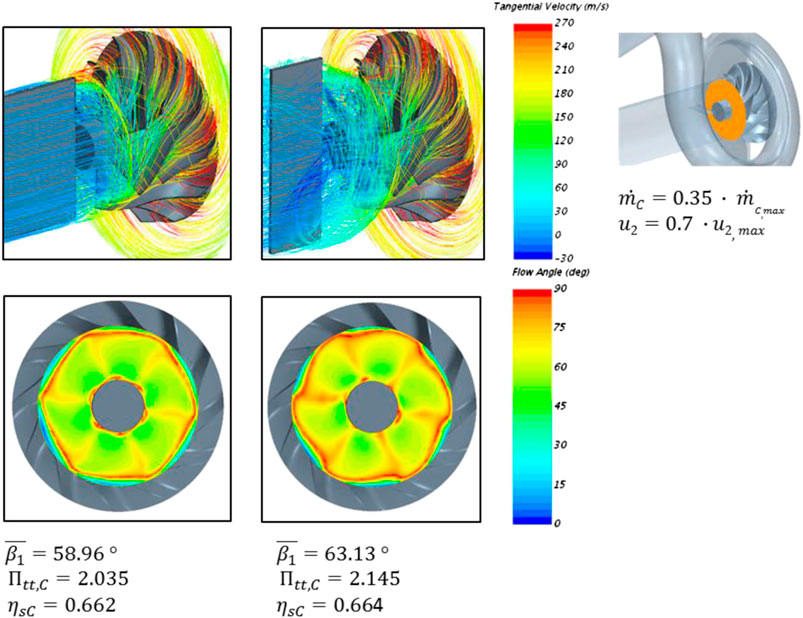
FIGURE 6. CFD results for an inserted plate before compressor for both, cylindrical compressor entry and extended compressor entry.
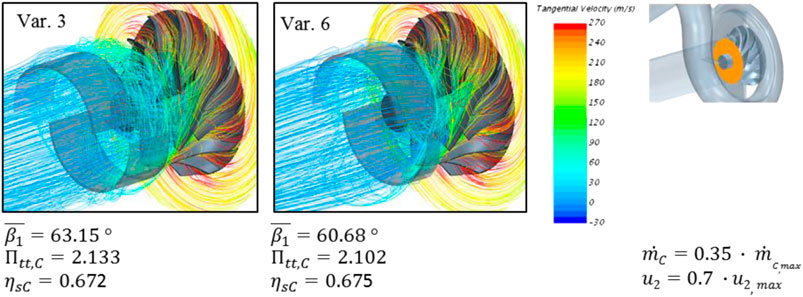
FIGURE 7. CFD results for different Backflow Guiding Plate (BGP) variants.
Orifice Design
The experimental evaluation should also consider an orifice as a trim-reducing measure and should show how the cone and orifice differ in terms of efficiency and surge limit shift. In order to ensure comparability, the effective cross-section for both measures must be as identical as possible. As is known, the effective cross-section deviates from the geometric cross-section and is dependent on the separation of the flow-guiding geometry. In the case of the orifice, stronger detachment is to be expected.
A design with the help of the CFD is therefore advisable. The aperture on the basis of the CFD calculations is therefore selected in such a way that the (geometric) trim is 0.64 instead of 0.59, thus creating the same flow profile. (see Figure 8).
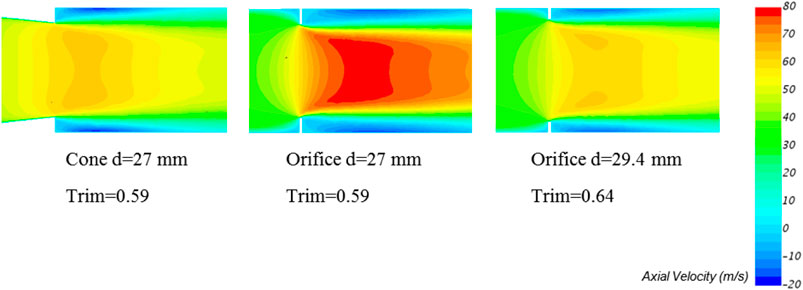
FIGURE 8. Comparison of the axial velocity distribution for a cone and two orifice variants at low mass flow.
Combination With Counter-Swirl
This study deals primarily with the expansion of the compressor map towards lower mass flows and the associated measures. Nevertheless, an expansion of the compressor map to include higher mass flows is desirable. The preliminary study already showed that a counter-swirl could be very promising with regard to the approach of the flow angle to the inlet geometry. A combination of counter-swirl and a measure to shift the surge limit is therefore desirable. Extensive internal investigations with the help of CFD have shown that this is most likely to succeed if a flow body is placed in the middle of the inlet pipe. The idea is to deactivate both measures if necessary. Figure 9 shows an example of a combination of counter-swirl and cone, whereby the cone could also be replaced here by an orifice or a swirl element.
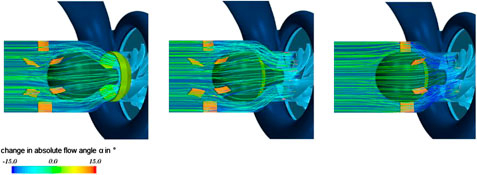
FIGURE 9. Concept for combining counter-swirl, flow-body and cone; influence on the inflow behavior. In the left is for low, in the middle for medium and in the right for high compressor mass flow.
It can be seen that the guide elements for generating a counter-swirl almost completely lose their effect when they are axially decoupled from the flow body (Figure 9 left and center). The reason is that the air mass is not completely influenced by the guide elements anymore. The situation changes when the guide elements are moved axially towards the compressor wheel. The air can now be fully influenced by the guide elements. A change in the inflow angle by around 15° seems to be possible. All experimental investigations are carried out with flow bodies in order to be prepared for a possibly desired combination with counter-swirl.
Experimental Studies
Measurement Method
Experimental studies were carried out on IAV’s turbocharger test bench. The hot gas required for driving the turbocharger turbine is generated in a natural-gas combustion chamber capable of delivering a maximum exhaust-gas output of 330 kW. The exhaust-gas temperature can be adjusted between ambient temperature and 1100°C with a maximum flow rate of 0.32 kg/s. Two throttle valves are fitted downstream of the turbocharger compressor to provide the capability of simulating air mass flow behavior over a wide range.
Pressure is recorded by means of static measuring points upstream and downstream of the compressor as well as upstream and downstream of the turbine. Temperature is recorded immediately downstream of the pressure measuring point, with three temperature sensors distributed around the circumference per measurement level. Hot-film anemometers records flow through the turbocharger compressor and through the turbocharger turbine. Turbocharger speed is recorded on the basis of an inductive measurement principle. The surge limit is detected by analyzing the pressure downstream of the compressor where an oscillating sudden drop in pressure is recognized as surge.
Test Method
The housing of a compressor was adapted so that various inlet geometries could be positioned in front of the impeller. For this purpose, a carrier and the different measures were 3D-printed and sandblasted (see Figure 10). AlSi10 Mg was used because it can withstand the high air temperatures. The flow geometries were selected and manufactured based on the CFD studies carried out in chapter 3. All inserts are positioned in the carrier at a distance of 2 mm from the impeller, the flow body is positioned 1 mm in front of the impeller.
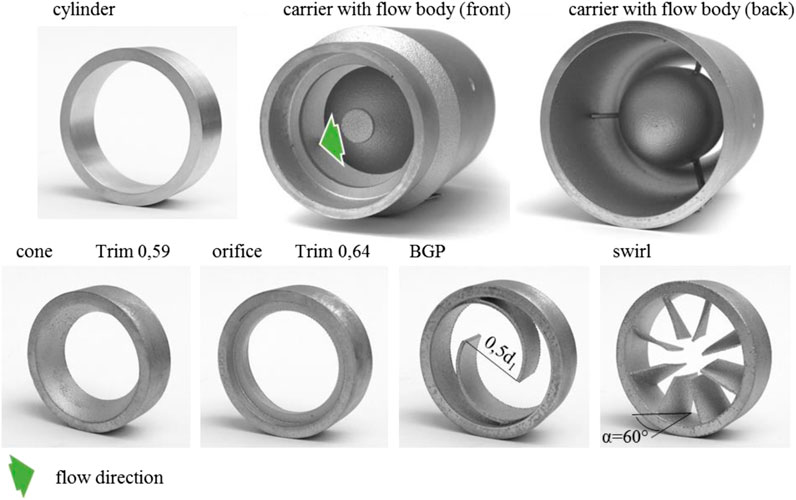
FIGURE 10. Inserts for producing a trim reduction (cone, orifice) and to produce a swirl (swirl, BGP); insert carrier (top right and middle) to position the inserts in front of the compressor wheel.
Heat flow in the turbocharger influences the result for determining the isentropic compressor efficiency. To reduce this influence, the temperature of the lubricating oil was lowered from 90°C to 45°C and the exhaust gas temperature from 600°C to 350°C. Two different test modes were carried out:
1. Performance map at u2 = 210, 275, 340, 410 und 475 m/s with 6–12 operating points
2. Constant compressor pressure ratio at Πtt,C = 2
The map measurement allows the evaluation of the overall behavior of a compressor and gives a good overview of the performance. Mode two (const. Πtt,C) is an evaluation in which the compressor pressure ratio is kept constant, which is ultimately decisive for the operation of a connected consumer (internal combustion engine, fuel cell). For this, however, the pressure ratio to be driven must be selected so that it corresponds to a real operation. The pressure ratio 2 was therefore selected in the tests carried out here.
Experimental Results
The performance parameters for the map enhancing measures measured were calculated and are shown in Figure 11. The spread of a map is defined as the difference between the maximum achievable mass flow and the surge limit at a fixed pressure ratio. The maps show clear differences with regard to the spread. The map with the cone insert is very narrow, with a small spread, and the map with BGP is relatively wide, with a relatively high spread. With a view to variability, the spread becomes less important since it is then possible to switch to the initial state and to reach the initial map (gray lines in Figure 10). The decisive factor is how far the compressor map and thus the surge limit can be shifted towards lower mass flows. Here the picture is exactly the opposite. When using the cone insert, the surge limit is shifted by 35% at a circumferential speed of 475 m/s based on 0.098 kg/s. By using the orifice insert, 19% and by using the BGP or swirl insert 12% of shifting are achieved. The isolines show the difference between the respective measure and the basic configuration. The two trim-reducing inserts show a relatively strong mass flow-dependent effect here. To the left of the zero isoline (white) there is an efficiency advantage of up to 6%-points and to the right of the zero isoline an efficiency disadvantage of up to 14%-points is observed. The two swirl-inducing measures (BGP, swirl) show no efficiency advantage at low mass flow.

FIGURE 11. Compressor performance maps for different geometrical inserts.
The sectional view (Figure 12) shows even better that the trim reduction differs positively from the remaining measures in terms of the combination of efficiency increase and surge limit shift. With iso-efficiency, the displacement of the surge limit is around 20% for the cone and around 14.5% for the orifice. The smaller shift and the larger spread of the gradient for the orifice indicate that the geometric trim may have been selected a little too large. On the other hand, the curves for cone and orifice lie on top of one another with a low mass flow. A lower geometric trim for the orifice would presumably lead to a further shift in the surge limit, but also to a further decrease in the efficiency. The use of swirl causes a strong shift in the surge limit (∼17%) at this pressure ratio, but does not result in any efficiency advantage compared to the base, as already explained above. With the use of BGP, only a surge limit shift of 7% can be achieved. At this point it is a reminder that all inserts were measured in combination with a flow body. If the flow inserts are replaced by a cylindrical ring (see Figure 10, top left), a positive behavior can be determined at high mass flow. A mass flow increase of around 5% can be achieved. Assuming that the mass flow does not have to be increased above the maximum mass flow of the base, the efficiency can increase by up to 14 %-points. The CFD investigations showed that this behavior is due to the more favorable flow guidance. The lack of airflow at the hub, which normally leads to detachment and thus to losses, is particularly advantageous here.
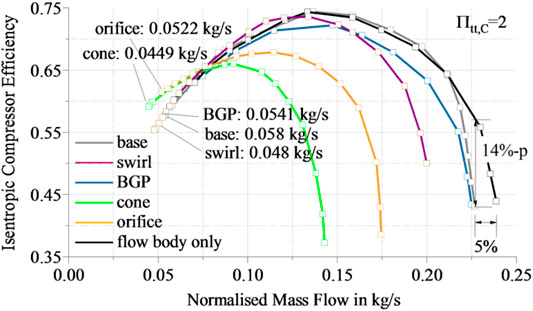
FIGURE 12. Isentropic compressor efficiency for different inserts and at a constant compressor pressure ratio of 2. Values in kg/s indicate surge limit for each insert.
Summary
The study shows the different methods for influencing the compressor map, whereby only intake measures were considered. The main aim of the investigations was to shift the compressor map towards lower flow rates. First, numerical methods were used to evaluate the various measures. The consideration and simplified calculation of the inflow angle β1 helps to improve the understanding of the inflow conditions at the impeller. However, this simplified method does not allow a complete aerodynamic evaluation. Calculations were then carried out with the help of the CFD. It emerged from this that reducing the trim to about 0.59 or adding a swirl with deflection angles of up to 60° had clear advantages. As a space-saving alternative to the cone, an orifice was designed with the help of CFD and used in the later experiment. Extensive investigations were carried out with the aim of using the high-energy, strongly swirled outlet flow at the compressor inlet in order to impart a swirl to the incoming air. For this purpose, guide elements were positioned at the compressor inlet (BGP). Here the CFD indicated clear advantages with regard to the surge limit shift.
The housing of a radial compressor was prepared so that different inserts could be positioned in front of the compressor impeller. The most promising measures resulting from the CFD were used, such as cone, BGP and swirl. The orifice as an alternative to the cone was also included in the evaluation. In summary the trim-reducing measures have a clear advantage in terms of surge limit shift and increase in efficiency, whereby the cone has slight aerodynamic advantages (surge line shift by 20% instead of 14.5% at iso-efficiency), but the orifice could represent a more compact solution. Swirl elements allow a stabilization of the flow and thus a shift in the surge limit, but not with iso-efficiency as the cone and orifice do. Even if the use of BGP was not yet productive there is potential in the concept that could be tapped with further investigations.
Finally, the flow body can be cited as a measure to expand the compressor map, which enables an expansion to higher flow rates of around 5%. Further potential can be realized by introducing a counter-swirl. The first CFD studies on this were carried out and presented. The expansion of the map by a total of 10% would be conceivable with the help of the combination of flow body and counter-swirl. If the latter is supplemented by one of the measures investigated to stabilize the flow, i.e. with a cone, a system could be designed that allows both a shift to lower and to higher mass flow rates. A possible arrangement of all three measures (cone, counter-swirl, flow body) is shown.
Data Availability Statement
The original contributions presented in the study are included in the article/Supplementary Material, further inquiries can be directed to the corresponding author.
Author Contributions
All authors have made a substantial, direct, and intellectual contribution to the work and approved it for publication.
Conflict of Interest
Author CBL is employed by IAV Automotive Engineering, Inc.
The remaining authors declare that the research was conducted in the absence of any commercial or financial relationships that could be construed as a potential conflict of interest.
Acknowledgments
The authors thank Marvin Richter and Aryan Karimian who showed tremendous dedication in making this paper such a success.
References
Bilz, S., Rothschuh, M., Schütte, K., and Wascheck, R. (2016). “Model-based efficiency improvement of automotive fuel cell systems,” in Simulation and testing for vehicle technology. C. Gühmann, J. Riese, and K. von Rüden, Berlin, Germany: Springer. doi:10.1007/978-3-319-32345-9_14
Bogner, M., Heldmann, M., Artinger, A., Ehrhard, J., and Beer, J. (2018). “Turboladerverdichter mit variablem Einlass zur Realisierung hocheffizienter Antriebskonzepte,” in: Ladungswechsel im Verbrennungsmotor 2017, Proceedings. Editors J. Liebl, Wiesbaden: Springer Vieweg. doi:10.1007/978-3-658-22671-8_8
Czapka, T. (2015). Erweiterung des Verdichterkennfelds eines Abgasturboladers für verbrauchsoptimierte Verbrennungsmotoren. Dissertation. Hannover: Leibniz University Hannover, ISBN 978-3-8325-3994-8.
Demmelbauer-Ebner, W., Theobald, J., Worm, J., and Scheller, P. (2018). The New 1.5-l EA211 TGI evo. MTZ Worldwide. 79, 16–21. doi:10.1007/s38313-018-0063-z
Fujiwara, T., Bamba, T., Numakura, R., Sasaki, Y., and Yokoyama, Y. (2018). “Variable geometry compressor development to improve operating range and efficiency for automotive turbocharger,” in 13th international conference on turbochargers and turbocharging, London, May 16–17, 2018, 57–70.
Gabriel, H., Lingenauber, R., and Ramb, T. (2006). “Der Turbolader mit variabler Turbinengeometrie (VTG) für den neuen Porsche 911 Turbo – Ein Meilenstein in der Ottomotorenaufladung,” in 11th Supercharging Conference, Dresden.
Glahn, C., Königstein, A., and Hermann, I. (2019). “Der variable Kompressoreinlass – Die nächste Entwicklungsstufe nach der variablen Turbinengeometrie,” in 24th Supercharging Conference, Dresden.
Grigoriadis, P., Benz, A., and Sens, M. (2011). “Variable Trim Compressor – Ein neuer Ansatz für eine variable Verdichtergeometrie,” in 16th Supercharging Conference, Dresden. 249–261.
Grigoriadis, P. (2008). Experimentelle Erfassung und Simulation instationärer Verdichterphänomene bei Turboladern von Fahrzeugmotoren. Dissertation, Berlin: Technical University of Berlin, doi:10.14279/depositonce-1768
Grigoriadis, P., Müller, S., Benz, A., and Sens, M. (2012). “Variable trim compressor – a new approach to variable compressor geometry,” in 10th International Conference on Turbochargers and Turbocharging, London, May 11, 2012, 111–120. doi:10.1533/9780857096135.3a.111
Groeneveld, K., and Übler, J. (2020). With the electric exhaust turbocharger Mercedes-AMG is increasing efficiency and performance, Daimler Global Media Site, Press Release 17. June 2020.
Helduk, T., Weiß, U., Fröhlich, A., and Helbig, J. (2016). The new V8 TDI engine from audi Part 1: engine architecture and turbocharging concept with electric powered compressor, MTZ Worldwide 77, 20–25. doi:10.1007/s38313-016-0041-2
Herbst, F., and Eilts, P. (2015). Experimental investigation of variable geometry compressor for highly boosted gasoline engines. SAE International, Technical Paper 2015-01-1289. doi:10.4271/2015-01-1289
Herbst, F., Stöber-Schmidt, C., Eilts, P., Sextro, T., Kammeyer, J., Natkaniec, C., et al. (2011). The potential of variable compressor geometry for highly boosted gasoline engines. SAE International, Technical Paper 2011-01-0376. doi:10.4271/2011-01-0376
Iwakiri, Y., Otsuka, M., and Kashimoto, A. (2017). Enhancement of surge margin for an automotive turbocharger centrifugal compressor by an inlet anti-swirl plate. Trans. Soc. Automot. Eng. Jpn. Inc. 48 (2), 265. doi:10.11351/jsaeronbun.48.265
Jones, B. A. (1970). Single stage experimental evaluation of variable geometry inlet guide vanes and stator blading, Part VI, final Report NASA CR-54559. PWA-FA-2641, Pratt and Whitney Aircraft; NASA Contracr NAS3-7604.) NASA-CR-54559.
Karstadt, S., Weiske, S., and Münz, S. (2018). Turbocharger with variable compressor geometry – another contribution to improved fuel Economy by the boosting system, in 27th aachen colloquium automobile and engine technology. Aachen, 1191–1214.
Kindl, H., Schorn, N., Schulte, H., Serrano, J.R., Margot, X., and Donayre, J.C. (2004). Influence of various compressor inlet designs on compressor performance, conference on Thermo- and Fluid Dynamic processes in diesel engines (THIESEL), 103–116.
Liu, M., Tan, L., and Cao, S. (2019). A review of prewhirl regulation by inlet guide vanes for compressor and pump. J. Power Energy. 233 (6), 795. doi:10.1177/0957650918820795
Pampreen, R. C. (1976). The Use of variable inlet guide vanes for automotive gas turbine engine augmentation and load control. Detroit, SAE International, Techinal Paper No. 760285.
Uchida, H., Kashimoto, A., and Iwakiri, Y. (2006). Development of wide flow range compressor with variable inlet guide vane, research report. R&D Review of Toyota CRDL. 41, 3.
Keywords: compressor, variability, IGV, surge limit, Orifice, Counter-swirl, IASP, VTC
Citation: Grigoriadis P, Hoffmann A and La CB (2021) Evaluation of Variable Compressor Technologies. Front. Mech. Eng 6:600024. doi: 10.3389/fmech.2020.600024
Received: 28 August 2020; Accepted: 02 December 2020;
Published: 28 January 2021.
Edited by:
Sriram S. Popuri, Cummins, United StatesReviewed by:
Jason Chen, Navistar, Inc., United StatesHarold Sun, GAC Automotive Research and Development Center, Guangzhou Automobile Group Co., Ltd., China
John Wright, Cummins, United States
Copyright © 2021 Grigoriadis, Hoffmann and La. This is an open-access article distributed under the terms of the Creative Commons Attribution License (CC BY). The use, distribution or reproduction in other forums is permitted, provided the original author(s) and the copyright owner(s) are credited and that the original publication in this journal is cited, in accordance with accepted academic practice. No use, distribution or reproduction is permitted which does not comply with these terms.
*Correspondence: Panagiotis Grigoriadis, cGFuYWdpb3Rpcy5ncmlnb3JpYWRpc0BJQVYuZGU=