 Delfino Reyes
 David Martínez3
 Hyeonu Heo
 Arup Neogi
94% of researchers rate our articles as excellent or good
Learn more about the work of our research integrity team to safeguard the quality of each article we publish.
Find out more
ORIGINAL RESEARCH article
Front. Mech. Eng., 23 December 2020
Sec. Micro- and Nanoelectromechanical Systems
Volume 6 - 2020 | https://doi.org/10.3389/fmech.2020.592787
This article is part of the Research TopicDevelopments in Acoustic, Phononic, and Mechanical Materials for Wave ControlView all 8 articles
Defects can be introduced within a 2-D periodic lattice to realize phononic cavities or phononic crystal (PnC) waveguides at the ultrasonic frequency range. The arrangement of these defects within a PnC lattice results in the modification of the Q factor of the cavity or the waveguide. In this work, cavity defects within a PnC formed using cylindrical stainless steel scatterers in water have been modified to control the propagation and Q factor of acoustic waveguides realized through defect channels. The defect channel–based waveguides within the PnC were configured horizontally, vertically, and diagonally along the direction of the propagation of the acoustic waves. Numerical simulations supported by experimental demonstration indicate that the defect-based waveguide’s Q factor is improved by over 15 times for the diagonal configuration compared to the horizontal configuration. It also increases due to an increase in the scatterers’ radius, which was varied from 0.7 to 0.95 mm.
Over the past three decades, the growing development and understanding of artificial crystal arrangements composed of periodically disposed materials with different physical properties have led to novel metamaterials. This phononic crystal and metamaterials have been utilized to control and manipulate acoustic and mechanical wave propagation (Wagner, 2016). The phononic crystal’s elastic properties and the periodicity of the lattice and dimension of the scatterers produce the well-known phononic bandgaps (PnBGs). PnBGs represent the frequency ranges of the waves that are not supported within the phononic structure, and thereby their transmission through the crystal is blocked. The PnBGs can be modified by tailoring the impedance contrast among their components, i.e., elastic constants or the mass density of the scatters and matrix, by adjusting the filling fraction ratio or the material parameters (Zhou, 2009; Pennec, 2010) or the spatial distribution of their components (Zhang Z., 2017; Reyes, 2019). Several manufacturing techniques have been used for the design of PnCs with tunable PnBGs through external stimulus directly acting on one or both of their components, making it possible to realize active PnCs whose acoustic properties are sensitive to electric or magnetic fields (Allein, 2016; Ponge, 2016), stress (Zhang P., 2017), or heat absorption (Walker, 2014), among other factors. The sensitivity of materials to external stimulus has resulted in the concept of tunable PC structures that has been proposed to manipulate acoustic wave propagation. The modification of material properties and configuration has led to bandgap engineering and the tunable mechanical reconfiguration and materials with coupling between waveguides and defects (Walker, 2017; Wang, 2020).
PnBGs are composed of forbidden eigenmodes, which, as in solid-state theory, can be modified by inducing defects in the perfect PnC through the removal or distortion of the scatterers (Aly, 2017). Introducing a defect into the otherwise regular structure, either a point defect or a linear defect, can open up small transmission windows within the PnBGs (Lucklum, 2010). It can result in an acoustic waveguide device's formation to guide waves at frequencies within the PnBG. It has been demonstrated that in a defect-based waveguide, the interdefects separation is critical for the quality and transmissivity of the wave at the guided frequencies (Escalante, 2013; Dong, 2017). The quality factor,
Phononic crystals with various Q factors have been reported and tailored mainly for operation in the high-frequency range of MHz to GHz. These structures were mostly based on microengineering hollowed plates (Mohammadi, 2009; Bahr, 2014). The lattice parameters of PnCs with resonance frequencies in the GHz or MHz are mostly micrometric devices with the active component of a few microns. Phononic crystals designed for low-frequency applications suffer relatively reduced scattering losses compared to GHz or MHz devices. The absolute phononic gaps in high-frequency GHz or MHz micrometric structures appear at a frequency below the Bragg limit. The localization of resonant high-frequency acoustic modes occurs within a defect band of the PnCs (Liu, 2000). The inclusion of tungsten in a silicon lattice yields a Q factor of 104 at 1.314 GHz (Goettler, 2010). A fully planar 2D optomechanical crystal of silicon microchip consisting of a nanoscale photonic crystal cavity was shown to operate at 1.4 GHz frequency for 57 nm cavities, yielding a Q of 1.5 × 10⁶, which strongly depends on the operation and device temperature (Mayer Alegre, 2011). Silicon carbide PnC cavities operating in the RF and microwave showed Q factors of 2000 and 500 for 2.24 and 2.55 GHz frequency, respectively (Ziaei-Moayyed, 2011). The fabrication of high-frequency PnCs uses standard CMOS processes to realize high-Q RF MEMS resonators operating at 2.81 (Q ∼ 903) and 4.54 (Q ∼ 54) GHz (Bahr, 2014).
Q factors in the MHz region have also been explored. A PnC with line defects realized by embedding a honeycomb array (lattice parameter of 15 μm) of cylindrical holes (6.5 μm) within a thin Si slab showed Q factors of 6,300 and 2,128 at 126.52 and 149.1 MHz, respectively (Mohammadi, 2009). A silicon PnC micromechanical resonator, manufactured by removing two rows of scattering holes from the center of the PnC was able to induce resonances in the MHz range. Q factors ranging from 1,000 to 100 were reported in this structure (Wang, 2014). A quasi-1D phononic crystal performed using dielectric membranes with a lattice parameter of ∼1 mm was used to realize high Q factors, 2.2 × 10⁶ and 5.2 × 10⁶ at 2.81 and 2.73 MHz, respectively (Tsaturyan, 2014). A quality factor value of 105,900 at 261.5 MHz was reported in PnC using 14.2 μm AlN unit cells with 4.7 μm air holes [24]. A Fabry-Perot SAW resonators formed between tapered PnC mirrors and patterned on a GaN-on-sapphire material platform were used to increase the Q factor at 194.07 MHz (Xu, 2018). All these reports demonstrate Q factors in the high-frequency range. However, there is not much work on optimizing the Q factor of cavities or waveguides at the low frequency. A two-dimensional PnC consisting of PZT-4D rods (175 μm) in air ambient with its lattice parameter optimized for 490 kHz was reported (Shakeri, 2019). A rod with a strain-dependent radius was introduced as a defect site within the PnC to control the defect frequency. This active phononic structure induced a resonance frequency in the kHz regime, 426.14 and 433.13 kHz, with a Q factor of around 1,100. Low-frequency ultrasound in the kHz frequency range is essential for nondestructive evaluation of materials and imaging at depth.
The corresponding filtering and coupling between defects can be improved or tuned to yield Q factor optimized for different frequency intervals by adjusting the geometrical and material parameters or even the scatterers’ orientation (Lu, 2009; Wang, 2020). The coupling strength can essentially control the Q factor of PnC with defect-based waveguides. The periodicity of separation between each defect can significantly modify the Q factor when the defect is made of a scatterer with different features with respect to the rest of the defects within the PnC (Wang, 2018; Reyes, 2019). Besides, the material and geometrical features of the defect can also influence the Q factor. In complex PnC-based Q factor structures, it can depend on the temperature and the dimensionality of the defect (Ziaei-Moayyed, 2011).
In this work, the Q factor of a defect-based waveguide is optimized. A PnC with stainless steel scatterers in water was considered with a bandgap in the kHz ranges as the basic platform for controlling acoustic wave propagation. Phononic crystals formed with varying radii of the scatterers were simulated. Acoustic waveguides were formed by defect channels that were created in a direction along and orthogonal to the direction of the propagation of the ultrasonic waves within the phononic crystal as well in a direction diagonal to the wave propagation. Results reveal that the quality factor is enhanced by over 15 times for the diagonal configuration and is also improved by increasing the cylinders’ radius while keeping the lattice parameter constant. The efficiency of the diagonal waveguide channel was corroborated using an experimental demonstration.
In order to investigate the effect of the spatial configuration of the induced defects in a perfect PnC, three PnCs with defects were considered in the COMSOL-Multiphysics platform. The perfect PnC was simulated as an array of 19 × 19 steel cylinders arranged as a square lattice and immersed within a water matrix. The square-shaped matrix was considered to reduce the computational effort. The cylinder diameter (
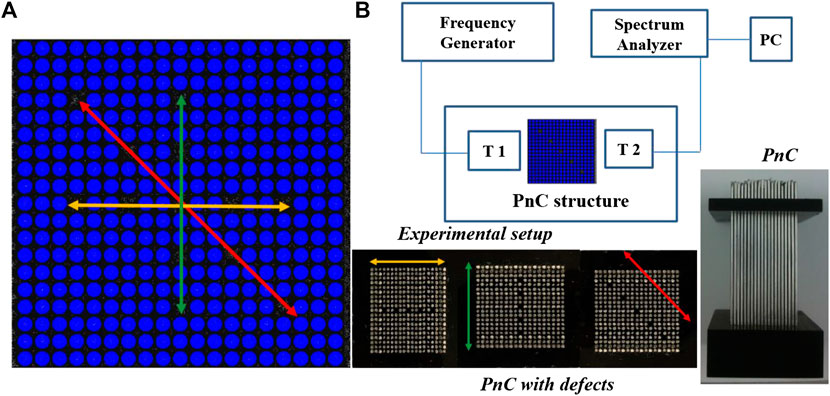
FIGURE 1. (A) Horizontally, vertically and diagonally local performed defects in the PnC. (B) Experimental setup to test the transmission features; insets correspond to the PnC (right) and the diagonal induced defect (bottom).
The experimental transmission spectra of the PnCs and the different defect configurations were achieved using the ultrasonic spectroscopy technique, as shown in Figure 1B. According to the abovementioned lattice parameter and cylinder diameter, steel rods were periodically fixed and capped by a bottom and top Plexiglas bases (inset in Figure 1B, right). Two immersion transducers (Olympus V301) placed face to face were used as emitter and receiver (44 mm apart). The phononic structure was located between the transducers, with a distance of 2 mm of separation from either faces of the transducer to avoid the near-field zone and the transducer facets’ reflections. A broadband input signal from 200 to 700 kHz range was utilized from a frequency generator (Teledyne LeCroy, WaveStation 2012) to obtain each analyzed phononic structure’s transmission spectrum experimentally. The output signal crossing the crystal was recorded by the other transducer that was connected to a spectrum analyzer (Tektronix-MDO3024) coupled to a PC for the data processing. PnC and transducers were located in a Plexiglas tank filled with 40 L of DI water at room temperature. A picture of the defect-based structures is illustrated in Figure 1B (bottom), for the horizontal, vertical, and diagonal defect configurations.
Simulation results about the transmission features of the perfect 19 × 19 PnC (black line in Figure 2) showed two well-defined transmission bands; the first band starts at 200 kHz, and its intensity decreases at 380 kHz, while the second one is clearly identified between 480 and 580 kHz. The PnC structure provides a phononic bandgap in the range 380 < f < 480 kHz. The blue line in Figure 2 corresponds to the transmission spectrum of the PnC for the horizontal configuration, while the green is for the vertical configuration, and the red line corresponds to the diagonal configuration, as depicted in Figure 1A. It can be observed that the defect arrangement modifies the bandgap in different ways. The horizontal configuration induces a new transmission band inside the bandgap from 400 kHz < f < 445 kHz, whereas the diagonal configuration has a narrow band from around 425 kHz < f < 428 kHz. It implies that the horizontal configuration opens the bandgap by around 45%, while the diagonal opens it up by only 3%. The vertical defect lines do not induce strong transmission, as observed from the three peaks in the green line.
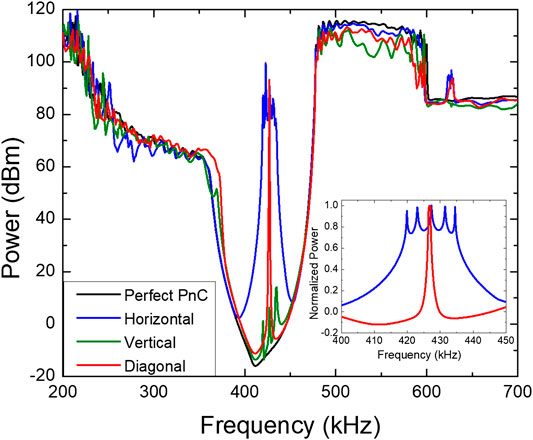
FIGURE 2. Theoretical transmission spectrums of the perfect PnC and the defect configurations. Inset depicts the normalized power for the induced band for the horizontal and diagonal configurations.
The inset plot within Figure 2 shows the normalized transmission band induced by the defects for the horizontal and diagonal configuration with a higher resolution. For the horizontal arrangement, five resonant modes were induced; those peaks appear at 419.9, 423, 427.3, 431.5, and 434.5 kHz. The simulation of a unique defect (as will be shown below) introduced in the center of the crystal showed a nonintense peak centered at 426.7 kHz, which is not present at the multidefect horizontal. The transmission band due to the horizontal configuration is a result of the coupling of the individual resonances at each cavity defect. For the vertical configuration (green line in Figure 2), the three small-peaks peaks in the transmission spectra were observed at 419.9, 427.3, and 434.5 kHz, which were also present in the horizontal arrangement. Interestingly, for the diagonal configuration, a narrow peak centered at 426.7 kHz was recorded. However, for this configuration, a higher resolution shows that the narrow peak is still composed of three resonances whose frequencies are 426.43, 426.68, and 426.99 kHz and are separated by around 0.27 kHz.
Bulk bandstructure calculations of the phononic crystals having different combinations of five defects are presented in Figure 3. The whole phononic crystal was considered as the supercell, the reference primitive cell, and the primitive wave vectors of the supercell Brillouin zone were chosen to find the eigenvalues within the frequency ranging from 400 to 450 kHz. The supercell bandstructure was calculated using the finite element method, COMSOL Multiphysics software. In Figure 3, the bandstructure for the horizontal (Figure 3A) and diagonal (Figure 3B) configurations shows the possible modes. The horizontal defects have five distinct modes between 420 and 440 kHz, at 423.7, 427.1, 431.3, 435.7, and 438.6 kHz. In the diagonal defect configuration, the superposition of multiple modes leads to a single dominant mode at 430.8 kHz. These modes were separated by 0.2 kHz in the transmission spectrum, with the central frequency around 430.8 kHz (430.4, 430.6, 430.8, 431, and 432.2 kHz). The calculated eigenmodes differ by 4 kHz with respect to the transmitted peaks in Figure 2 and occur due to the system’s finite length. It should be noted that the experimentally measured transmission spectrum in Figure 2 and the pressure maps in Figure 4 were for the finite PnC. In contrast, the bandstructure was calculated for the infinite supercell. However, there is a qualitative agreement of the same pressure maps in Figure 4. The bandstructure for the perfect PnC is displayed in Figure 3C. The phononic bandgap was calculated between 375 and 495 kHz, with a stopgap in the frequency interval 400–450 kHz at which the defect mode–induced transmission was observed for the defect configurations. The experimentally observed transmission characteristics well-matched with the calculated band structures and numerically calculated transmission.
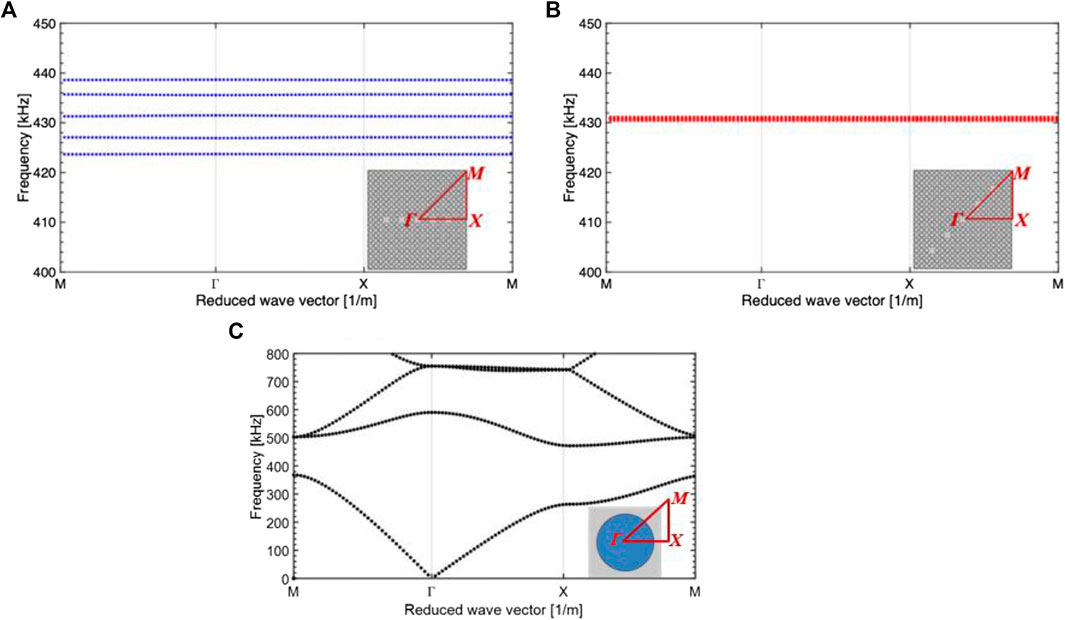
FIGURE 3. (A) Bandstructure diagram for the horizontal configuration. (B) Bandstructure diagram for the diagonal configuration. The insets depict the supercell, the reference primitive cell, with five defects, and the primitive wave vectors. (C) Bandstructure diagram for the perfect phononic structure.
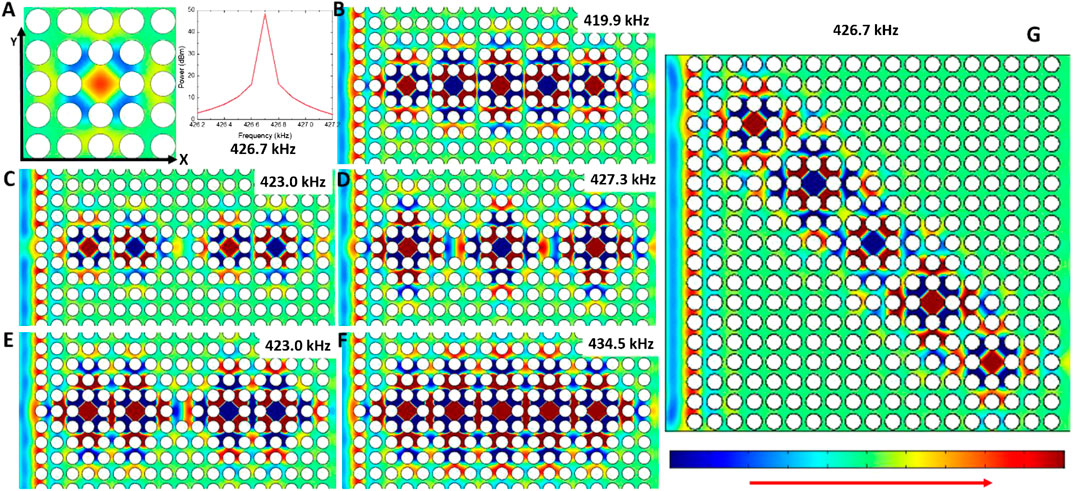
FIGURE 4. (A) Resonance peak and pressure map at 426.7 kHz for a unique defect induced in the center. (B–F) Pressure maps for the five resonant frequencies observed for the horizontal defects configuration. (G) Pressure map for the resonant peak at 426.7 kHz for the diagonal defects disposition.
From the inset in Figure 2, it was found that the FWHM, or simply
As was aforementioned, a unique defect induced in the center of the crystal, i.e., nine periods away from the emitter and receiver, breaks the symmetry and leads to a transmission peak at 426.7 kHz, shown in Figures 4A. Here, the pressure field of this resonant frequency is also displayed. The pressure field of all the shown frequencies was obtained from COMSOL results. By exploring within the cavity, it is observed that the energy distribution is symmetrical in both X and Y directions. The resonance mainly occurs in the central region and is symmetrically spread out to the neighboring scatterers. Figures 4B–F depict the pressure fields at five resonant frequencies for the horizontal defect configuration, which were spectrally plotted in Figure 2. Figures 4B corresponds to the pressure field for the first resonant frequency at 419.9 kHz. The energy distribution observed in this case for the first, third, and fifth cavities shows the same energy distribution inside the cavity as observed for the single defect—the maxima energy is concentrated at the center of the cavity. However, for the second and fourth cavities, the minimum energy intensity is concentrated at the cavities’ center. This observed pressure distribution is produced by the periodic propagation of the guided wave. Figures 4B–F show that each resonant frequency yields a different energy distribution at the five induced cavities. Those five resonant frequencies have a very similar wavelength between 3.46 and 3.40 mm. In Figures 4G, the energy distribution of the diagonal configuration at 426.7 kHz is presented. The first, fourth, and fifth energy distributions are similar to the single cavity, whereas showing an inversion in the second and third cavities. The five cavities’ energy distribution is different from those observed in any other frequency of the horizontal configuration.
In Figure 5, the experimental results for the case simulated in Figure 2 are displayed. There is a good agreement of the experimental results and the numerical analysis. The inset in Figure 5 shows the expanded plot in terms of normalized power. It can be seen that the width of the transmission peak is observed for the diagonal configuration at 427.43 kHz. The experimental results showed a quality factor of
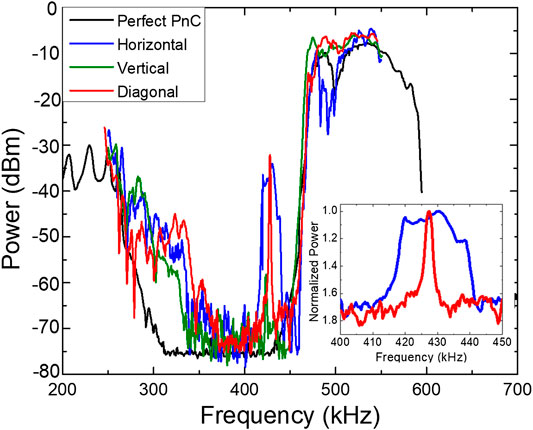
FIGURE 5. Experimental transmission spectrums of the perfect PnC and the defect configurations. Inset depicts the normalized power of the induced band for the horizontal and diagonal configurations.
As can be seen from the previous results, the horizontal cavity configuration leads to a strong coupling between the allowed modes inside the bandgap in the presence of a defect. However, the diagonal configuration does not induce strong lateral coupling and back reflection. The decrease in the FWHM results from the tunneling of the single resonant mode, which is enhanced in the presence of the five defects. For the particular arrangement of the PnC, a defect located in the center induces asymmetry broken resonant transmission at 426.7 kHz, as is reported in Figure 4.
The transmission of this resonant peak is not higher in magnitude, but the bandwidth is narrower than the five-coupled horizontal defects or the weakly coupled diagonal defects due to the highest possible Q factor within the PnC structure. As shown in Figure 2, five-defects’ combination exhibits a narrower transmission with higher intensity than a single defect (100 dBm versus 50 dBm). Experimentally, our detection system’s sensitivity did not permit the observation of the transmission change due to a single defect. The five diagonally arranged defects enhance the Q factor compared to the horizontal configuration and improve the transmitted signal’s intensity compared to a single defect.
In order to help us to analyze and understand the diagonal and horizontal configuration of defects, five more PnCs were numerically analyzed, keeping the lattice parameter at 2 mm, but by varying the radii as 0.70, 0.75, 0.85, 0.90, and 0.95 mm, in addition to 0.80 mm which has been already described. The varying radius of the crystals results in different filling fraction
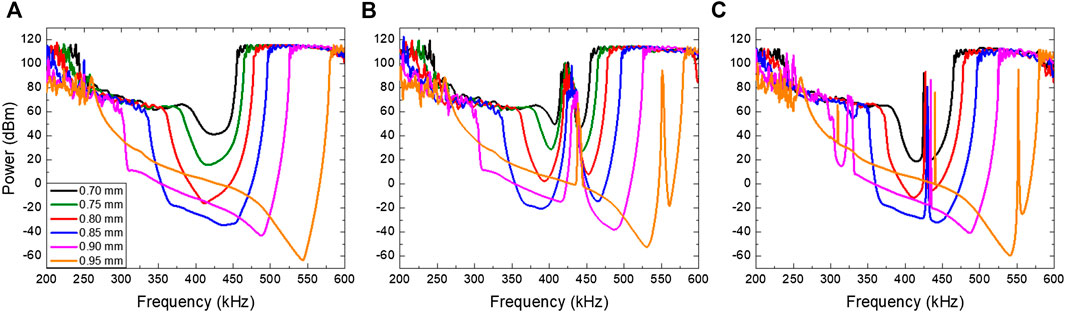
FIGURE 6. (A) Transmission spectrums of the perfect crystal (B) with defects horizontally disposed and (C) with the diagonal configuration.
The normalized power of each PnC with horizontal and diagonal configurations is shown in Figures 7A, B, respectively. Here, the transmission power is presented as a staircase plot from 405 to 445 kHz. For the horizontal configuration, it is observed that the induced band is wider, and the five resonant peaks can be observed as identified by the black arrows for 0.7, 0.8, and 0.9 mm radii to exemplify the five resonant peaks. It is observed that bandwidth tends to be narrower when the radius of the cylinders increases. For the diagonal configuration, only one resonance peak is observed (each identified with the black arrow), which becomes narrower as the scatters’ radius increases. For 0.95 mm, only a very narrow peak can be observed.
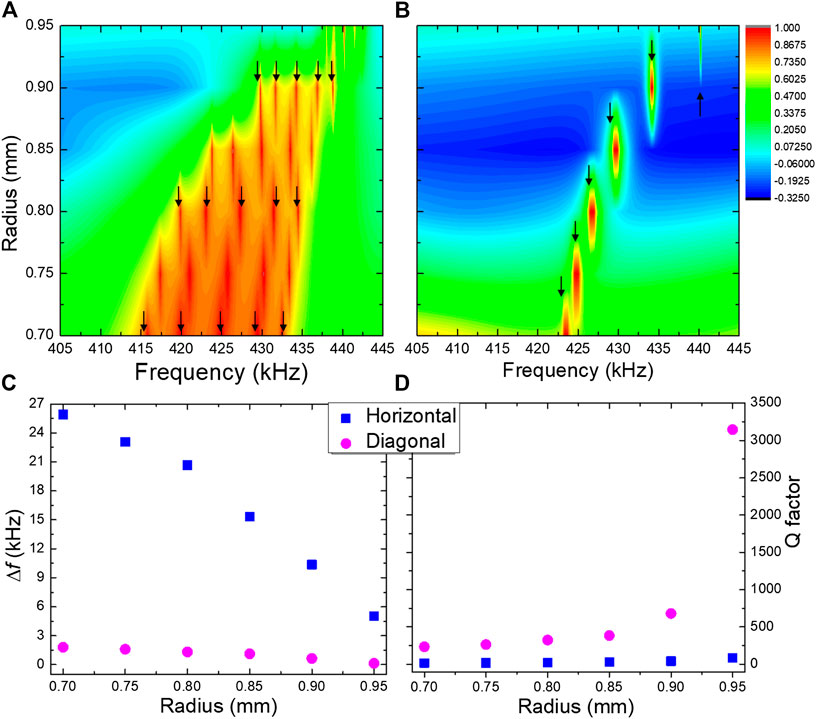
FIGURE 7. (A) Normalized power for the horizontal disposition for the PnCs with different radius and (B) for the diagonal configuration. (C)Δf and (D) quality factor for the horizontal and diagonal configurations for the different radius.
The numerical analysis shows that for the defects’ diagonal arrangement, the quality factor is improved by over fifteen times when the radii are 0.8 mm and 35 times when it is 0.95 mm. Those results are summarized in Figures 7C, D. Thus, the diagonal configuration allows a more efficient frequency-selective structure that could be used in sensing systems or wireless communication. The Q factor for the extra narrow peak recorded for the 0.95 mm radius PnC, as shown in Figures 6B, C, was also calculated. It is also composed of five resonant peaks for the horizontal disposition while it is narrower for the diagonal configuration and centered at 552 kHz. This peak’s quality factor is 136 for the horizontal and 593 for the diagonal configurations, respectively. The quality factor of the PnC with a radius of 0.95 mm was over 35 times larger for the diagonal configuration compared to the horizontal ones, 3,174 vs. 89. It is well known that the coupling strength depends on the number of scatters between each defect. If the number increases, the coupling decreases, and then, the quality factor increases (Dong, 2017; Wang, 2018). This effect was analyzed in this revised manuscript. We conclude that it is possible to increase the quality factor by increasing the separation between defects. However, an enhancement of the Q factor values implies a loss in the transmitted signal’s intensity. Additionally, it also necessitates an increased periodicity or a larger PnC. For practical applications, this fact would require a detector with higher sensitivity and a larger crystal. As the diagonal configuration does not induce strong coupling between adjacent defects, the transmission is independent of the number of defects and separation between these defects. Thus the diagonal configuration will always yield higher Q values than the horizontal defects arrangement.
The manipulation of the inner radius in hollow steel cylinders squarely immersed in water was reported (Khelif, 2003) to be useful to tune the frequency and width of the guided ultrasonic signal (∼170 kHz). Here, the configuration of defects induced in a perfect phononic structure and the radius of scatters shown to be crucial for Q factor and the transmitted frequency through the performed waveguide.
Numerical simulations supported by experimental demonstration indicate that the Q factor of defect-based waveguides is improved by over 15 times for defects in a diagonal configuration along the propagation axis compared to their horizontal configuration, in a PnC composed of steel cylinders of 0.8 mm radius immersed in water. It also increases due to an increase in the scatterers’ radius, which was varied from 0.7 to 0.95 mm. For a radius of 0.95 mm, the theoretical analysis showed that the diagonal configuration’s Q factor was 35 times larger than the horizontal disposition. The reason was due to the horizontal inducing of five defects modes with a broader induced peak. In contrast, the diagonal defects allow a single mode due to this configuration that does not induce strong lateral coupling. Results will be useful for the high Q cavity operating in the low-frequency range using a cheap and simple PnC waveguide.
The raw data supporting the conclusions of this article will be made available by the authors, without undue reservation.
DR, MM, EW, and AN performed the experimental and simulations details, besides the discussion of the results to write the manuscript, which was mainly written by DR and AN. DM performed the numerical calculations of the acoustic properties of the designed phononic structures. HH carried out the bandstructure calculations.
This work was supported by the National Science Foundation-sponsored EFRI: NewLAW project entitled, “GOALI: EFRI NewLaw: Non-reciprocal effects and Anderson localization of acoustic and elastic waves in periodic structures with broken P-symmetry of the unit cell” Award#1741677.
EW was employed by the company Echnovus Inc.
The remaining authors declare that the research was conducted in the absence of any commercial or financial relationships that could be construed as a potential conflict of interest.
The authors acknowledge the above-referred funding from NSF. DR acknowledges the support from the NSF‐EFRI project as a visiting researcher at UNT.
Allein, F. T. (2016). Tunable magneto-granular phononic crystals. Appl. Phys. Lett. 108, 161903. doi:10.1063/1.4947192
Aly, A. H. (2017). Phononic crystals with one-dimensional defect as sensor materials. Indian J. Phys. 91, 1021–1028. doi:10.1007/s12648-017-0989-z
Bahr, B. M. (2014). “Phononic crystals for acoustic confinement in CMOS-MEMS resonators,”in IEEE international frequency control symposium (FCS), Taipei, Taiwan, May 19–22, 2014 (New York City, USA: IEEE), 1–4.
Churnside, J. H. (2005). Comparison of airborne lidar measurements with 420 kHz echo-sounder measurements of zooplankton. Appl. Opt. 44 (26), 5504–5511. doi:10.1364/ao.44.005504
Dong, H. W. (2017). Inverse design of high-Q wave filters in two-dimensional phononic crystals by topology optimization. Ultrasonics 76, 109–124. doi:10.1016/j.ultras.2016.12.018
Eichler, A. C. (2011). Parametric amplification and self-oscillation in a nanotube mechanical resonator. Nano Lett. 11 (7), 2699–2703. doi:10.1021/nl200950d
Escalante, J. M. (2013). Dispersion relation of coupled-resonator acoustic waveguides formed by defect cavities in a phononic crystal. J. of Physics D: Applied Physics, 46, 1–10. doi:10.1088/0022-3727/46/47/475301
Goettler, D. S.-K. (2010). Realizing the frequency quality factor product limit in silicon via compact phononic crystal resonators. J. of App. Phys. 108, 084505. doi:10.1063/1.3475987
Han, Y. Y. (2019). High quality factor electromagnetically induced transparency-like effect in coupled guided-mode resonant systems. Optics Express 27, 7712–7718. doi:10.1364/oe.27.007712
Khelif, A. D.-R. (2003). Two-dimensional phononic crystal with tunable narrow pass band: Application to a waveguide with selective frequency. J. of App. Phys. 94, 1308–1311. doi:10.1063/1.1557776
Lehto Miller, J. M. (2018). Effective quality factor tuning mechanisms in micromechanical resonators. App. Phys. Revs. 5, 041307. doi:10.1063/1.5027850
Liu, Z. Z. (2000). Locally resonant sonic materials. Science, 289 (5485), 1734–1736. doi:10.1126/science.289.5485.1734
Lu, M. H. (2009). Phononic crystals and acoustic metamaterials. Mater. Today, 12 (12), 34–42. doi:10.1016/s1369-7021(09)70315-3
Lucklum, R. L. (2010). 1D and 2D phononic crystal sensors. Procedia. Eng. 5, 436–439. doi:10.1016/j.proeng.2010.09.140
Mayer Alegre, T. P.-N. (2011). Quasi-two-dimensional optomechanical crystals with a complete phononic bandgap. Opt. Express 19, 5658–5659. doi:10.1364/oe.19.005658
Mohammadi, S. E. (2009). High-Q micromechanical resonators in a two-dimensional phononic crystal slab. App. Phys. Lett. 94, 051906. doi:10.1063/1.3078284
Otter, W. J. (2014). 100 GHz ultra-high Q-factor photonic crystal resonators. Sens. Actuator. A Phys. 217, 151–159. doi:10.1016/j.sna.2014.06.022
Park, Y. R. (2017). Biotunable nanoplasmonic filter on few-layer MoS2 for rapid and highly sensitive cytokine optoelectronic immunosensing. ACS Nano. 11 (6), 5697–5705. doi:10.1021/acsnano.7b01162
Pennec, Y. V.-R. (2010). Two-dimensional phononic crystals: examples and applications. Surf. Sci. Rep. 65, 229–291. doi:10.1016/j.surfrep.2010.08.002
Ponge, M. F. (2016). Control of elastic wave propagation in one-dimensional piezomagnetic phononic crystals. The J. of the A. Soc. of Am. 139, 3288. doi:10.1121/1.4950756
Reyes, D. W. (2019). All-acoustic signal modulation and logic operation via defect induced cavity effects in phononic crystal coupled-resonator acoustic waveguides. New J. Phys. 21, 113012. doi:10.1088/1367-2630/ab4f4f
Rostami-Dogolsara, B. M.-F. (2019). Designing phononic crystal based tunable four-channel acoustic demultiplexer. J. Mol. Liq. 281, 100–107. doi:10.1016/j.molliq.2019.02.066
Shakeri, A. D.-F. (2019). Designing a tunable acoustic resonator based on defect modes, stimulated by selectively biased PZT rods in a 2D phononic crystal. Ultrasonics 92, 8–12. doi:10.1016/j.ultras.2018.09.001
Tsaturyan, Y. B. (2014). Demonstration of suppressed phonon tunneling losses in phononic bandgap shielded membrane resonators for high-Q optomechanics. Opt. Express 22, 6810–6821. doi:10.1364/oe.22.006810
Wagner, M. R. (2016). Two-dimensional phononic crystals: disorder matters. Nano. Lett. 16, 5661–5668. doi:10.1021/acs.nanolett.6b02305
Walker, E. R. (2014). Tunable ultrasonic phononic crystal controlled by infrared radiation. Appl. Phys. Lett. 105, 143503. doi:10.1063/1.4894489
Walker, E. W. (2017). Radio-frequency actuated polymer-based phononic meta-materials for control of ultrasonic waves. NPG Asia Mater. 9, e350. doi:10.1038/am.2016.209
Wang, N. H. (2014). Evidence on simultaneous improvement of motional impedance and Q-factor of silicon phononic crystal micromechanical resonators by variously engineering the cavity defects. J. of App. Phys. 115, 094904. doi:10.1063/1.4867044
Wang, Y. F. (2018). Channeled spectrum in the transmission of phononic crystal waveguides. J. Sound Vib. 437, 410–421. doi:10.1016/j.jsv.2018.09.030
Wang, Y. G. (2020). Tunable and active phononic crystals and metamaterials. Appl. Mech. Rev. 72 (4), 040801. doi:10.1115/1.4046222
Xu, Y. F. (2018). High quality factor surface Fabry-Perot cavity of acoustic waves. Appl. Phys. Lett. 112, 073505. doi:10.1063/1.5013161
Zhang, P. J. (2017). Soft phononic crystals with deformation-independent band gaps. Proc. R. Soc. A 473, 20160865. doi:10.1098/rspa.2016.0865
Zhang, Z. L. (2017). Topological design of phononic band gap crystals with sixfold symmetric hexagonal lattice. Comput. Mater. Sci. 139, 97–105. doi:10.1016/j.commatsci.2017.07.037
Zhou, X. Z. (2009). Effects of material parameters on elastic band gaps of two-dimensional solid phononic crystals. J. of App. Phys. 106, 014903. doi:10.1063/1.3159644
Keywords: phononic crystal, waveguides, defects, quality factor, ultrasound
Citation: Reyes D, Martínez D, Mayorga M, Heo H, Walker E and Neogi A (2020) Optimization of the Spatial Configuration of Local Defects in Phononic Crystals for High Q Cavity. Front. Mech. Eng. 6:592787. doi: 10.3389/fmech.2020.592787
Received: 08 August 2020; Accepted: 15 October 2020;
Published: 23 December 2020.
Edited by:
Chengzhi Shi, Georgia Institute of Technology, United StatesReviewed by:
Yan-Feng Wang, Tianjin University, ChinaCopyright © 2020 Reyes, Martínez, Mayorga, Heo, Walker and Neogi. This is an open-access article distributed under the terms of the Creative Commons Attribution License (CC BY). The use, distribution or reproduction in other forums is permitted, provided the original author(s) and the copyright owner(s) are credited and that the original publication in this journal is cited, in accordance with accepted academic practice. No use, distribution or reproduction is permitted which does not comply with these terms.
*Correspondence: Delfino Reyes, ZHJleWVzLmZjQGdtYWlsLmNvbQ==; Arup Neogi, YXJ1cEB1bnQuZWR1
Disclaimer: All claims expressed in this article are solely those of the authors and do not necessarily represent those of their affiliated organizations, or those of the publisher, the editors and the reviewers. Any product that may be evaluated in this article or claim that may be made by its manufacturer is not guaranteed or endorsed by the publisher.
Research integrity at Frontiers
Learn more about the work of our research integrity team to safeguard the quality of each article we publish.