 Bo Shu
 Sonal K. Vallabhuni
 Jiaxin Zheng1,2
 Ravi X. Fernandes
95% of researchers rate our articles as excellent or good
Learn more about the work of our research integrity team to safeguard the quality of each article we publish.
Find out more
ORIGINAL RESEARCH article
Front. Mech. Eng. , 24 July 2020
Sec. Engine and Automotive Engineering
Volume 6 - 2020 | https://doi.org/10.3389/fmech.2020.00047
This article is part of the Research Topic Fundamental Characterization and Performance of Alternative Fuels View all 9 articles
Liquefied natural gas (LNG) and liquefied biogas (LBG) as transport fuels constitute one of the pillars of the European clean fuel strategy. LNG and LBG often contain higher hydrocarbons up to C5, which leads to more complex ignition properties when utilizing them in gas engines. Therefore, it is essential to understand their combustion behavior and to quantify the abnormal combustion such as knocking propensity in correlation to the methane number (MN). Currently, there is no traceable standard to define the MN, and the literature algorithms give no consistent results for the same LNG/LBG mixtures. In this study, the correlation between the MN and ignition delays of several LNG/LGB mixtures containing C1-C5 alkanes and nitrogen was investigated at temperatures between 870 and 1,550 K, at 10, 20, and 40 bar, and with equivalence ratios of 0.4 and 1.2. Good correlations have been observed for mixtures with MN 50–90 at high temperatures. At intermediate temperatures, discrepancies were found between mixtures with same MN but different C1-C3 compositions. Moreover, the addition of butane and propane isomers at low vol.% showed no effect on the ignition delay times (IDTs) at intermediate temperatures.
To meet the goals of the Paris Agreement1, limiting the global warming to 2°C above pre-industrial level, carbon dioxide (CO2) emissions from transportation and combustion-based power generation need to be reduced. Liquefied natural gas (LNG) and liquefied biogas (LBG) have attracted the public and scientific communities as alternative fuels for future transportation and energy systems due to their lowest CO2 emissions relative to their energy content among all the hydrocarbons because of the low C/H ratio2 (LNG Metrology). In 2013, LNG has been announced as a part of the European Union (EU) clean fuel strategy3.
LNG is produced by cooling the natural gas to −162°C at their extraction points, while LBG is produced by cooling the biogas to the same temperature level. The liquefaction procedure and the liquid state generate several advantages for the use of LNG/LBG as transportation fuels over compressed natural gas (CNG), e.g., the liquefaction procedure can remove undesired impurities such as dust, acid gases, water, and heavy hydrocarbons; furthermore, the energy densities of LNG and LBG are greater than that of CNG (factor 1.5), and they can be stored without significant overpressure, thus not requiring heavy pressure tanks4, which makes LNG/LBG cost-efficient in marine and road transportation over long distances. However, implementing LNG/LBG as fuel in combustion engines has several challenges. Unlike CNG, LNG, and LBG often contain hydrocarbons up to C5 that have totally different boiling points, which leads to composition changes over time during the transport, transfer, and storage because of the boil-off of the volatile components. This process is also known as LNG aging (Glomski and Michalski, 2011). As a result, the use of LNG/LBG as fuel in engines can induce very different combustion behaviors, e.g., knock resistance, thermal efficiency, and emissions. Among others, the knock resistance of LNG/LBG is the one most important parameter for engine design, and it describes the anti-knock ability of fuels in a running engine. Knock is defined as an abnormal combustion in spark ignition (SI) engines, which occurs when a certain part of the fuel/air mixture in front of the turbulent spark-ignited flame auto-ignites and combusts due to the high pressure and temperature induced by the flame. The occurrence of knocking leads to an increase in emissions, a decrease in the engine efficiency, and even engine failure (Kalghatgi, 2018). Therefore, good understanding of the knocking propensity of LNG/LBG is crucial for their practical applications in gas engines.
The knocking properties of LNG and LBG can be characterized by the methane number (MN), which is the counterpart of the octane number for gasoline. MN has been defined as the volume fraction of methane in a methane/hydrogen mixture ranging from 0 to 100. The knocking behavior of the methane/hydrogen mixtures can be characterized in a defined test engine under defined operating conditions. The MNs for pure methane and pure hydrogen are 100 and 0, respectively. A fuel gas assigned with a MN shows the same knocking behavior as a methane/hydrogen mixture with a corresponding MN. However, the knocking behavior of LNG/LBG depends not only on the composition of the gas but also on the design of the test engines and the operating conditions. The first methane number measurements of LNG were performed in a test engine under defined conditions originated from the Anstalt für Verbrennungsmotoren Prof. List (AVL) in 1971 (Leiker et al., 1972). The AVL methane number algorithm was then defined for experiments performed on a test bench. Unfortunately, the AVL engine test bench is not available at present and no reproducible direct measurement is possible anymore. One disadvantage of the AVL algorithm is that it covers hydrocarbons only up to butane (C4). However, various LNG/LBG samples from various sources contain non-negligible amounts of pentane (C5) and nitrogen (N2). Therefore, the AVL algorithm has been further developed by Motoren-Werke Mannheim (MWM) considering the higher hydrocarbons in more detail and treating the influence of N2 differently (EN 16726, 2015). The MWM method has been widely applied and adopted by EUROMOT in 2016 (MWMMN Calculation Method, 2013). Further efforts to improve the AVL method have been reported by Andersen (Andersen, 1999) and by Gieseking and Brown (Gieseking and Brown, 2016). Andersen reported on the Danish Gas Technology Center (DGC) algorithm that is based on the AVL MN triangle diagram and defines the methane number of gas samples calculated by adding the methane number without inert gases and the methane number with inert gases. The DGC algorithm also considers only the hydrocarbons up to C4, and CO2 and N2 are taken into account as inert gases. Gieseking and Brown (Gieseking and Brown, 2016) developed the National Physical Laboratory (NPL) algorithm that applied the great dataset measured from AVL. Hydrocarbons greater than C4 were also not considered in this algorithm due to lack of experimental data. One important change made there was that the NPL algorithm removed the correction of CO2 because it will be generally eliminated during the liquefaction process and no CO2 will be found in LNG. Moreover, the NPL algorithm evaluated the uncertainty from the AVL ternary diagram for the first time, and the calculation of the methane number always included the uncertainties from the LNG gas compositions.
Gersen et al. (2015) described a process to investigate the effect of varying compositions of gaseous fuels on engine knock by taking the auto-ignition process during the compression and burn periods of the engine cycle into account. As a measure for the knocking propensity, they used the Propane Knock Index (PKI) instead of methane/hydrogen references. It is defined as the fraction of propane in a mixture of methane/propane which shows the same knock propensity as the investigated gas (Gersen et al., 2015). The PKI can be further converted into an MN. Eilts and Klare (2018) performed further engine tests to investigate the determination of the service MN of LNG that is an engine-dependent MN. No consistent results have been found between the service MN (SMN) and the calculated MN from the aforementioned algorithms; however, the same tendencies between SMN and MN have been observed, but different absolute values were obtained. Although many efforts have been done to determine the MN experimentally or mathematically, no consistent result has been found between the different MN algorithms for the same gas compositions (Gieseking and Brown, 2016; Eilts and Klare, 2018). To understand the nature of the knocking propensity of LNG and LBG, further investigations on their combustion chemistry, especially reaction kinetics, are therefore essential.
One primary factor that influences the knock characteristics in an engine is the fuel composition that determines the reactivity of the fuel and the energy release in the combustion processes. The knocking propensity of selected fuels can be correlated to their ignition properties, such as the ignition delay time (IDT) at typical operating conditions. The IDT defines how easily a fuel can be spontaneously ignited. IDT is the time between the moment the fuel–air mixtures reach the temperature and pressure which are sufficient for initiating the ignition and the moment an actual macroscopic ignition event can be observed, e.g., strong heat release. For the reference methane/hydrogen mixtures, Zhang et al. (2012a,b) have performed ignition delay experiments on CH4/H2 mixtures with hydrogen mole fractions of 0, 20, 40, 60, 80, and 100% at temperatures from 900 to 2,000 K, pressures from 5 to 20 bar, and equivalence ratios from 0.5 to 2.0 in a shock tube. Three ignition regimes were identified according to the hydrogen fraction (<40, 60, and >80% of H2). The combustion chemistry behind the different ignition behaviors at different ignition regimes was analyzed in detail and in-depth understanding was obtained. For the LNG gases, all the reported MN algorithms were developed based on the AVL engine measurements where the knocking was affected by both the chemical nature of the gases and the fluid dynamics in the combustion chamber; however, the combustion chemistry of the natural gas has not been fully understood, and it is crucial to first investigate the correlation between the IDT and the MN as well as the effect of the gas composition.
The current work is therefore designed to investigate the ignition behavior of LNG and LBG mixtures containing CH4/C2H6/C3H8/n-C4H10/i-C4H10/n-C5H12/i-C5H12/N2 and the reference mixtures containing only CH4 and H2. The composition of real LNG and LBG mixtures varies strongly from resource to resource, and it is unreasonable to investigate all the possible LNGs. One big challenge in correlating the MN and ignition behavior is that, for different LNGs, the MN can be the same but the gas composition is quite different from each other and, therefore, the ignition delay may be different as well. Moreover, for mixtures that have almost identical gas components, the volume fraction of the isomers, especially for the higher hydrocarbons C4 and C5, can also be different; the molecular structures of higher hydrocarbons can strongly change the knocking resistance. It is also important to investigate the effect of the butane and pentane isomers on the ignition properties. Therefore, in this work, 11 LNG/LBG mixtures and five reference mixtures were produced to investigate the ignition behavior of LNGs/LBGs with the same MN but different gas compositions or different mole fractions of the butane and pentane isomers. Mix 1 to Mix 11 are mixtures having MNs from 70 to 80. Mix 1–3 were defined to study the effect of C1-C3 alkanes for the same MN. Mix 5–7 and Mix 9–11 were defined to investigate the effect of butane and pentane isomers for the same MN, respectively. Mix 4 and Mix 8 were defined to investigate the effect of a small change in the C4 and C5 components on the ignitions, respectively. Table 1 lists the details of the corresponding LNG/LBG and reference mixtures. The MNs of the mixtures shown on the table were determined applying the MWM algorithm, which considered higher hydrocarbons up to C5 and the impurity of N2.
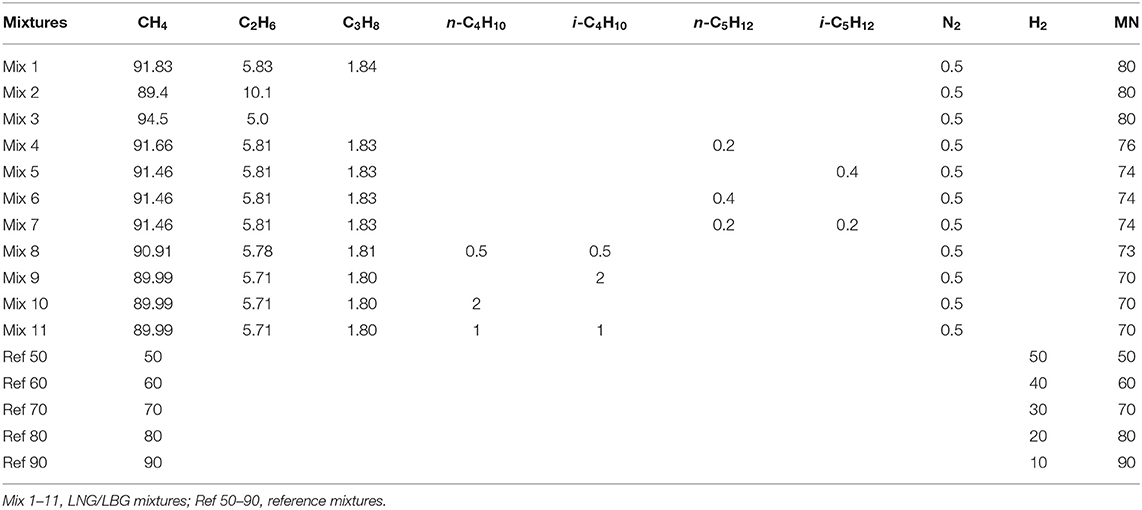
Table 1. Compositions (% volume) of the tested liquefied natural gas (LNG)/liquefied biogas (LBG) mixtures and the reference mixtures in the high-pressure shock tube (HPST) as well as in the rapid compression machine (RCM).
The ignition property of the mixtures was investigated in a high-pressure shock tube and a rapid compression machine at pressures of 10, 20, and 40 bar, temperatures between 870 and 1,525 K, and two equivalence ratios, 0.4 and 1.2, that cover the main relevant operation conditions of modern LNG engines. The fuel-lean and fuel-rich conditions have been chosen due to their significance in both practical applications and validation of the chemical kinetic mechanisms, and such a big dataset is not available in the literature. Table 2 provides the detailed experimental conditions performed in this study. All the measured IDT data can be found in Table S1. These data revealed the correlation between the MNs and ignition delays and further served as a validation target for evaluating the performance of the chemical kinetic mechanism (Zhang et al., 2015) selected in our previous study (Vallabhuni et al., 2018). Furthermore, kinetic modeling simulations were performed to obtain deeper insights on the relevant ignition chemistry that explains the discrepancy between mixtures that have the same methane number.
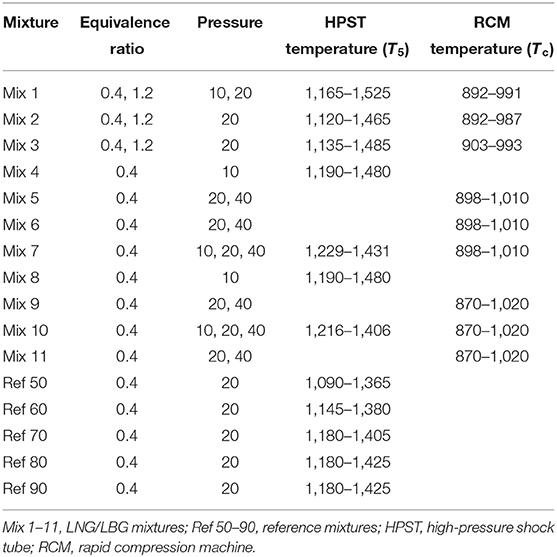
Table 2. Details of the experimental conditions investigated in this work.
Shock tube experiments on the ignition delay time of the LNG and LBG mixtures at high temperatures, i.e., 1,100–1,550 K, were performed at Physikalisch-Technische Bundesanstalt (PTB), Germany, in a stainless steel diaphragm-type high-pressure shock tube (HPST) behind reflected shock waves. The HPST has an overall inner diameter of 70 mm and is separated into a 3.5-m driver section and a 4.5-m driven section. Aluminum plates with different thicknesses were used as a diaphragm between the driver and driven sections. For 10-bar measurements, aluminum plates with a thickness of 300 μm were used. Two-millimeter-thick aluminum plates with 0.7-mm depth predefined cuts were used to obtain 20-bar behind reflected shock waves. Both driver and driven sections can be evacuated down to 5E−5 mbar via a turbomolecular pump (Leybold).
A set of four piezoelectrical pressure sensors (Kistler 603C) were installed at an equal distance of 500 mm on the top of the driven section, where the last transducer is 20 mm upstream of the end wall of the driven section, to measure the incident shock velocities that were further applied to calculate the thermodynamic states behind reflected shock waves using ideal shock equations. One additional pressure sensor (Kistler 603C) was mounted on the center of the end wall of the driven section to measure the pressure behind reflected shock waves and further to determine the ignition delay times. All the pressure sensors are connected to a charging amplifier (Kistler model 5018A) and the amplified signals were further digitized and recorded via a data acquisition card (Spectrum M4i.4016-Exp).
Gas mixtures studied in the shock tube were prepared manometrically in a 50-L stainless steel mixing vessel and allowed to homogenize for at least 12 h before use. The respective reference mixtures Ref 50–Ref 90 were prepared in the lab applying high-purity CH4 and H2 (>99.999%, Linde). The LNG and LBG mixtures were produced from PRAXAIR with an uncertainty of each subcomponent <2%.
The ignition delay times measured in the HPST were defined as the time between the arrival of the reflected shock wave and the steepest pressure increase due to the ignition. Figure 1 depicts a typical pressure–time history and the determination of the ignition delay time in a shock tube experiment. The overall uncertainty in the shock tube measurement is 5%, including the uncertainty of the gas composition, the initial state, and the shock velocity. All the shock tube measurements were performed once because the generation of a shock wave cannot be precisely defined. All the data points obtained in the HPST demonstrated a very good correlation between the temperature and the ignition delay.
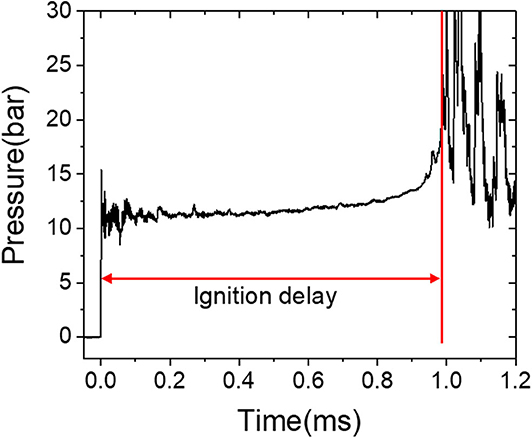
Figure 1. Representative pressure profile for shock tube investigation of the methane/ethane mixture.
The rapid compression machine (RCM) experiments were performed at Physikalisch-Technische Bundesanstalt (PTB). The details of this RCM setup have been described elsewhere (Vallabhuni et al., 2018). Briefly, it is a single-piston RCM that consists of three chambers, i.e., pneumatic driver chamber, hydraulic brake chamber, and reaction chamber. The reaction chamber has an inner diameter of 50 mm and was electropolished. Six ports are installed at equal distances around the reaction chamber and 1 cm away from the end wall for gas inlets/outlets, pressure sensors, and optical windows. The reaction chamber can work under a maximum pressure of 200 bar in a temperature range of 600–1,100 K. To avoid turbulence during the fast compression, a creviced piston is applied. The compression temperature (Tc) can be varied either by changing the compression ratio of the reaction chamber via using different end walls or by heating the RCM and mixture cylinders with heating tapes. To rule out the change of the heat loss characteristics of the RCM, the compression ratio of the reaction chamber in this work was fixed to 20.93 and heating tapes were used.
The ignition delay measurements were realized by recording the pressure profiles. The pressure time histories during the reactions were recorded applying a Kistler (601H) pressure sensor. To overcome the thermal shock effect on the pressure sensor, a thin silicon layer was coated on the surface of the pressure sensor. In this study, test mixtures were prepared manometrically in a 10-L stainless steel tank. Argon and nitrogen (>99.999% pure, Linde) were used as bath gases to reach the appropriate Tc. These gaseous mixtures were prepared at least 12 h prior to use to ensure the homogeneity of the mixtures. Additionally, for each measurement, a non-reactive mixture was prepared in a second mixing tank. The oxygen in the reactive mixture was substituted by nitrogen which has the same heat capacity. The non-reactive mixtures were applied in the RCM to obtain the heat loss for each measurement. Figure 2 depicts one example pressure profile of the reactive and non-reactive mixtures and the determination of the ignition delay time, which is the time between the end of the compression and the steepest pressure rise because of the ignition.
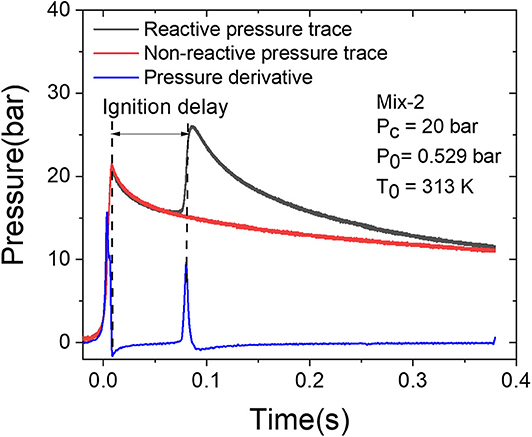
Figure 2. Typical reactive pressure profile (black solid line) and the corresponding non-reactive pressure profile (solid red line) as well as the pressure derivative of reactive pressure for the determination of the ignition delay time (blue solid line).
In this work, no direct measurement was applied to measure the temperature in the reaction chamber. Therefore, the temperature at the end of compression (Tc) was determined indirectly applying the measured pressure and the specific heats following Equation (1), considering the adiabatic core hypothesis (Zhang et al., 2012a,b).
Here, T0 and P0 represent the initial temperature and pressure in the reaction chamber, respectively, and γ is the specific heat of the initial mixture.
The uncertainty of the experimental data obtained in the RCM includes the repeatability of the experiments and the systematic uncertainty. Each measurement for the reactive mixtures has been repeated for at least three times to ensure statistical significance. The overall uncertainty of the ignition delay times measured in the RCM results from 5% uncertainty in repeatability and from about ±10 K uncertainty in Tc.
In this work, the NUI Galway's n-hexane mechanism (Zhang et al., 2015), which consists of 913 species and 4,150 reactions, was applied for the chemical kinetic modeling. It has been validated against a variety of experimental results from shock tubes, RCM, and flames that covered a wide range of conditions (Metcalfe et al., 2013; Bugler et al., 2016, 2017; Vallabhuni et al., 2018). Most importantly, this mechanism updated the two butane isomers and the three pentane isomers that are the investigation targets in this work (Bugler et al., 2015). Modeling of the shock tube data was performed applying an in-house Cantera (2015) code based on a homogeneous constant volume reactor applying the pressures and temperatures behind reflected shock waves as the initial conditions. As can be seen in Figure 1, the dp/dt of the shock tube measurements (defined as the percentage change of pressure per time unit) were about 10% per millisecond. To take this effect into account, the volume profiles were calculated via the measured pressure signals and applied to the simulations. RCM is not an ideal constant volume reactor as well, which has heat loss from the core region to the walls of the reaction chamber (Hu and Keck, 1987). In order to account heat losses in the rapid compression machine, the volume profiles are given to the constant volume reactor model to simulate the heat loss during and after compression, which were calculated using the pressure signals from the non-reactive mixtures for each operating condition.
This section presents the experimental results and validation of the numerical calculations. The correlation between the MNs and IDTs are illustrated and the effect of the gas composition will be discussed. In order to obtain a better understanding of the ignition property of the investigated LNG/LBG mixtures, sensitivity analyses were performed under the conditions of interest to provide deeper insights on the ignition behaviors.
Figure 3 illustrates the IDTs of the reference mixtures Ref 50–Ref 90 measured in the HPST at 20 bar and equivalence ratio (ϕ) of 0.4 in the temperature range 1,100–1,450 K together with the linear fitted lines. As expected, an increase in the reactivity of the reference mixtures was observed with the decrease of methane number, i.e., an increase in hydrogen content increases the reactivity, and the reference mixture Ref 50 shows the highest reactivity. Moreover, the activation energies of mixtures Ref 50–Ref 90 are slightly different from each other, which results in an approaching IDT at a lower temperature range.
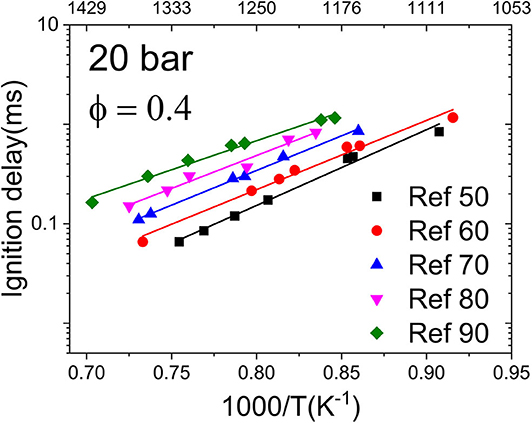
Figure 3. Ignition delay times (IDTs) of the reference mixtures (Ref 50–Ref 90) measured in the high-pressure shock tube (HPST) at 20 bar and ϕ = 0.4. Points are experimental data and lines are linear fits.
Figure 4A depicts the measured ignition delays of the LNG/LBG mixtures having MNs ranging from 70 to 80 with an equivalence ratio of 0.4 at 10 bar and temperatures between 1,190 and 1,490 K. It can be seen that the IDTs of LNG/LBG decrease with a decreasing MN. However, only Mix 1 and Mix 10, with MNs of 80 and 70, respectively, showed a clear difference from each other, whereas the Mix 4, 7, and 8 (MNs of 76, 74, and 70, respectively) show very close ignition delays. Unlike the reference mixtures, the activation energies of the LNG/LBG gases are very similar, i.e., the differences between the mixtures remain the same in the studied temperature range.
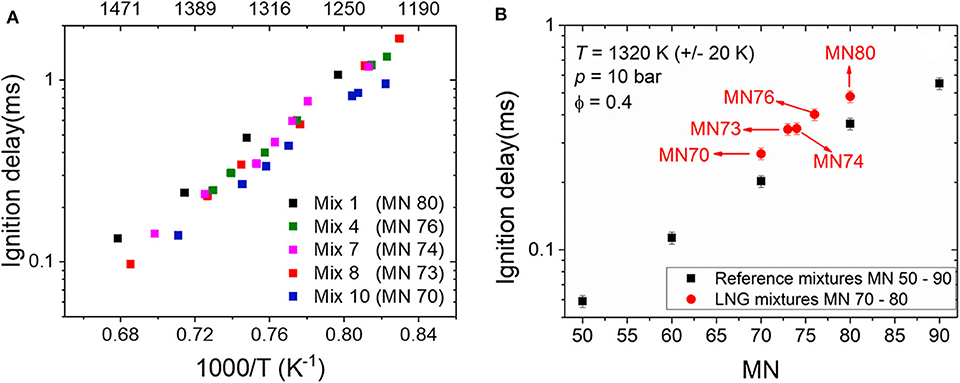
Figure 4. (A) Ignition delay times (IDTs) of liquefied natural gas (LNG)/liquefied biogas (LBG) mixtures (methane number, 70–80) measured in the high-pressure shock tube (HPST) at 10 bar, ϕ = 0.4. (B) Comparison of the IDTs of LNGs/LBGs and the reference mixtures at 1,320 K (±20 K), 10 bar, ϕ = 0.4.
To explore the correlation between the MNs and the IDTs, one data point was taken from each LNG/LBG mixture, i.e., Mix 1, Mix 4, Mix 7, Mix 8, and Mix10, at 1,320 K (±20 K), 10 bar, ϕ = 0.4, are plotted together with the data from the reference mixtures MN 50–90 at the same condition in Figure 4B. It must be noted that it is challenging to reach exactly the same post-shock conditions in the shock tube experiments due to the non-uniform burst behavior of the diaphragms. As shown in Figure 4B, the IDTs of the reference mixtures decrease with decreasing methane number. This tendency was also observed in the LNG/LBG mixtures covering the MNs from 70 to 80. One major difference is that the IDTs of the LNG/LBG mixtures are longer than those of the reference mixtures at the same MNs. Considering that the IDT contributes directly to the knocking propensity of fuels, this discrepancy implies different knocking behaviors of a reference gas and a LNG/LBG gas that have the same MN, and this should be further investigated in a LNG/LBG engine test bench.
The mixtures (Mix 1–3) that have the same MNs, i.e., 80, were further investigated at a higher pressure, 20 bar, with both equivalence ratios 0.4 and 1.2, and the measured IDTs are plotted as a function of temperature in Figures 5A,B, respectively. Mix 1 was a ternary mixture that contains methane, ethane, and propane, while Mix 2 and Mix 3 were binary mixtures containing methane/ethane and methane/propane, respectively. At high temperatures, i.e., 1,100–1,450 K, three mixtures with an equivalence ratio of 0.4 (Figure 5A) show very close ignition delays, whereas the ignition delays at intermediate temperatures, i.e., 920–1,000 K, show clear differences. The discrepancies between the three mixtures are larger at a lower temperature, e.g., the IDT of Mix 1 is longer than that of Mix 2 with a factor of 3 at 920 K. However, the discrepancies between the IDTs of Mix 1–3 at the equivalence ratio of 1.2 are much smaller compared to case ϕ = 0.4 within a factor of 1.2.
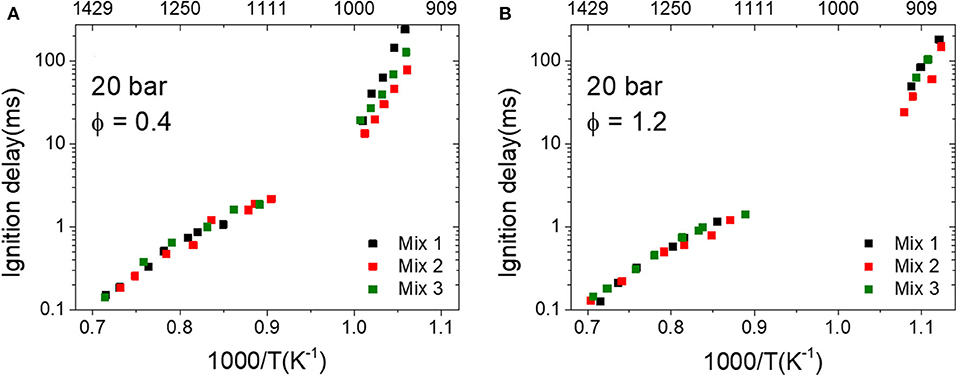
Figure 5. Measured ignition delay times (IDTs) of mixtures 1–3 (MN 80) at 20 bar. (A) ϕ = 0.4 and (B) ϕ = 1.2.
To further compare the correlation between the MNs and IDTs, the measured IDTs of Mix 1–3 (MN 80) at 20 bar and equivalence ratio 0.4 are plotted together with the reference mixtures Ref 70–90 in Figure 6. The IDTs of Mix 1–3 are presented in points and those of Ref 70–90 are presented in lines. It can be seen that the correlation between the MNs and IDTs of the LNG/LBG mixtures agrees partially with the trend of the reference mixtures, i.e., the IDT points of Mix 1–3 (MN 80) fall between the lines of Ref 70 and 90. However, these IDT points do not overlap with the MN 80 line for the whole temperature range (1,140–1,430 K), namely, the ignition delays of the LNG/LBG mixtures are close to the reference mixture Ref 80 at temperatures higher than 1,300 K and approach the reference mixture Ref 90 at lower temperatures. This behavior is considered reasonable due to the different activation energies of the LNG/LBG and reference mixtures, especially since the IDTs of the reference mixtures Ref 50–90 approach each other with decreasing temperatures (cf. Figure 3), which was not observed between the LNG/LBG mixtures from MN 70 to 80 (cf. Figure 4). It is also noted that the range between each 10 MN of the reference mixtures is very small and the measured IDTs from other LNG/LBG mixtures with MN between 70 and 80 cannot be clearly distinguished within such a small range considering the uncertainty of the measurements.
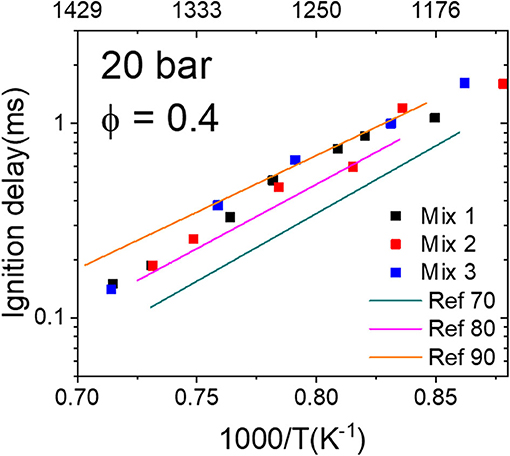
Figure 6. Comparison of the ignition delay times (IDTs) of the liquefied natural gas (LNG)/liquefied biogas (LBG) mixtures to the reference mixtures measured in the high-pressure shock tube (HPST) at 20 bar, ϕ = 0.4. Points are Mix 1–3 (MN 80) and lines are reference mixtures Ref 70, 80, and 90.
The experimental results from Mix 1–3 demonstrated that the gas composition (C1-C3) of the mixtures with the same MN has a significant effect on the IDTs at intermediate to low temperatures (cf. Figure 5). Real LNG/LBG mixtures also contain traceable amounts of butane and pentane isomers, and their influences on the IDTs at intermediate to low temperatures as well as the correlation to MN are also of interest. The mixtures Mix 5–7 and Mix 9–11 were therefore investigated at fuel-lean conditions in the RCM, and the measured IDTs were plotted as a function of temperature in Figure 7. The fuel-rich conditions were not investigated due to the minor difference (0.2% and 1%) from the isomers. In general, the IDTs of Mix 9–11 that contain 2 vol% butane isomers (MN 70) are slightly shorter than those of Mix 5–7 which contain 0.4 vol% pentane isomers (MN 74) at both 20 and 40 bar, which agrees with the MN–IDT correlation. However, the IDTs of the same mixture group show no differences between each other at both pressures, i.e., the isomer of butane or pentane does not change the ignition behavior under the same vol%. This finding is contrary to that reported by Gersen et al. (2015), where the methane/i-butane and methane/n-butane mixtures were investigated in a RCM at a wide range of pressures and where both mixtures showed different ignition delays. It is worth mentioning that the mixtures applied by Gersen et al. (2015) contained much more (6 vol%) butane isomers than in this work (2 vol%); however, the real LNG/LBG gases contain generally butane isomers up to 1.5% (Zhang et al., 2012a,b).
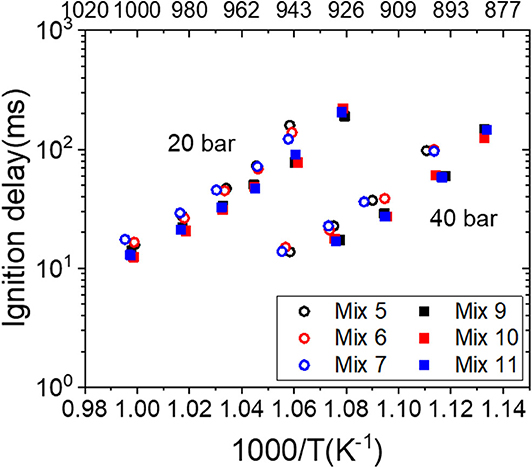
Figure 7. Ignition delay times (IDTs) of the liquefied natural gas (LNG)/liquefied biogas (LBG) mixtures (MN 70 and 74) measured in the rapid compression machine (RCM) at 20 and 40 bar, ϕ = 0.4.
The measured ignition delays have presented reasonable correlation to their calculated MNs applying the MWM algorithm. However, the discrepancy between Mix 1–3 (MN 80) found at intermediates temperatures is not well-understood. It is therefore crucial to analyze the chemical kinetics of the ignition property under the critical conditions. In a previous study (Vallabhuni et al., 2018), the NUIG n-hexane mechanism (Zhang et al., 2015) has been applied for simulating the ignition delays of several LNG/LBG mixtures; good agreement between the measurements and simulations was found. Therefore, this mechanism was applied further in this work. Figures 8A,B depict the comparison between the experimental results and the simulated IDTs for Mix 1–3 and Mix 5–7, respectively. The NUIG n-hexane mechanism showed very good performance for Mix 1–3, which contained only C1-C3 compositions. The simulated IDTs for Mix 5–7 show discrepancies in the measurements and are overall longer than the measured ones within a factor of 2. However, the negligible effect of pentane isomers on the IDTs was observed by the NUIG n-hexane mechanism as well.
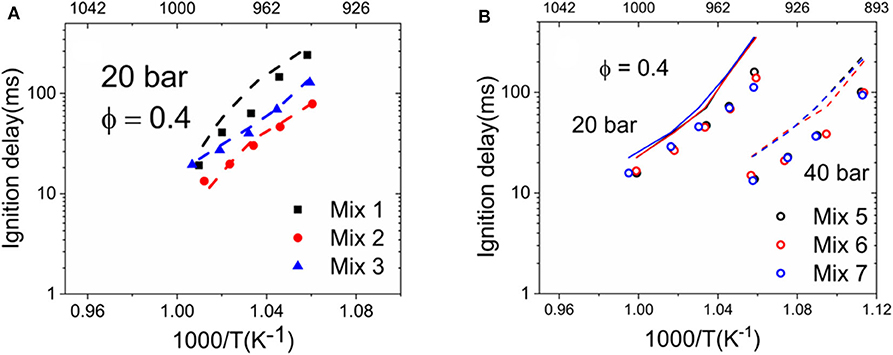
Figure 8. Comparison between the measured ignition delay times (IDTs) of liquefied natural gas (LNG)/liquefied biogas (LBG) mixtures and the simulated IDTs applying the NUIG n-hexane mechanism (Zhang et al., 2015). Symbols are the experimental points, and lines are the simulations. (A) Mix 1-3 (MN 80); (B) Mix 5-7 (MN 74).
As the NUIG n-hexane mechanism showed very good performance on the studied conditions of Mix 1–3, modeling analyses were further performed to investigate the crucial elementary reactions that are sensitive to the ignition delay times of Mix 1–3 at intermediate temperatures. Sensitivity analysis (SA) on hydroxyl radical (OH), which is the most important indicator of the ignition onset, was therefore performed. The normalized sensitivities of the 10 most sensitive elementary reactions of each mixture were demonstrated in Figures 9, 10 for the fuel-lean and fuel-rich conditions, respectively. In the analysis, the normalized sensitivity coefficient S is defined as S = , where ki represents the rate constants of the elementary reactions and [OH] is the concentration of OH. The SA was performed at the time of ignition. A positive value indicates a promotion on the formation of OH radicals that accelerates the ignition and a negative value indicates an inhibition of OH formation that further inhibits the ignition (Davidson and Hanson, 2004). In the fuel-lean case (ϕ = 0.4), the chain branching reaction H2O2 (+M) = 2OH (+M) is the most promoting reaction for all three mixtures. For Mix 2, the other promoting reactions are H2O2 or OH radical formation reactions and H abstraction reactions of methane and ethane with higher normalized sensitivity values compared to those of Mix 1 and 3 due to its high ethane concentration (10%). This resulted in a faster ignition compared to the other two mixtures, and the measured IDTs in the RCM of Mix 2 were therefore the shortest at the same conditions. For Mix 1 and 3, the recombination reaction of CH3O2 and CH2O radicals into CH3O2H shows a relatively high sensitivity, which was not found in the case of Mix 2. The promotion reactions of Mix 1 and Mix 3 are very similar, whereas the normalized sensitivities in Mix 3 are generally higher than those in Mix 1, thus resulting in the faster ignition of Mix 3 than Mix 1 observed in the RCM measurements.
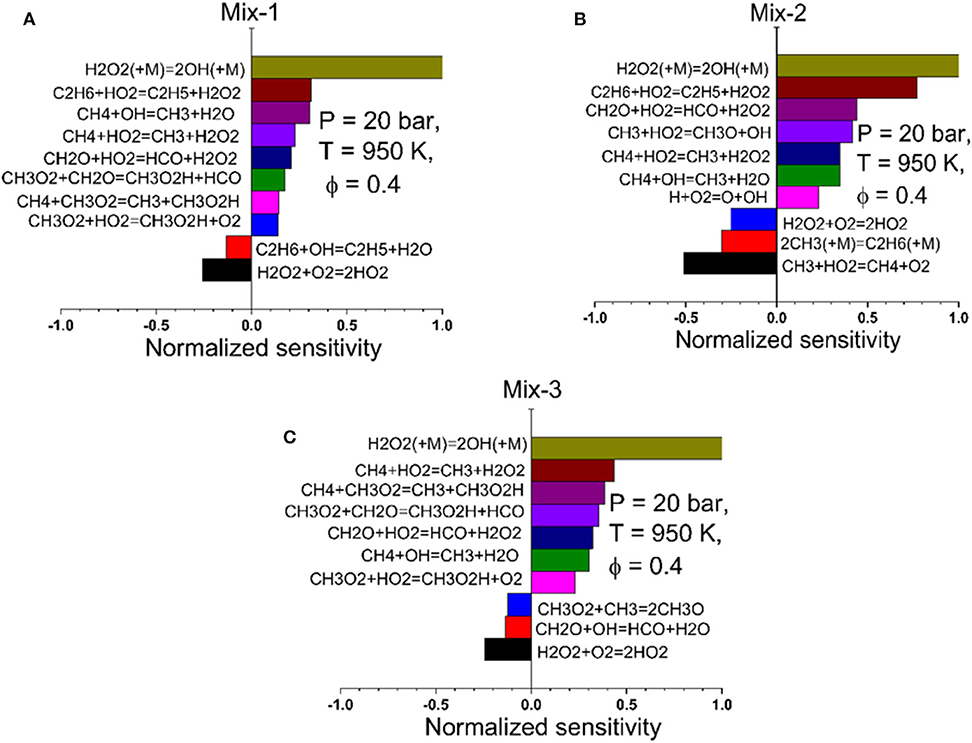
Figure 9. Normalized sensitivity analysis on the OH radical at time of ignition for Mix 1 (A), Mix 2 (B), and Mix 3 (C) at 20 bar, 950 K, and ϕ = 0.4 based on the NUIG n-hexane mechanism (Zhang et al., 2015).
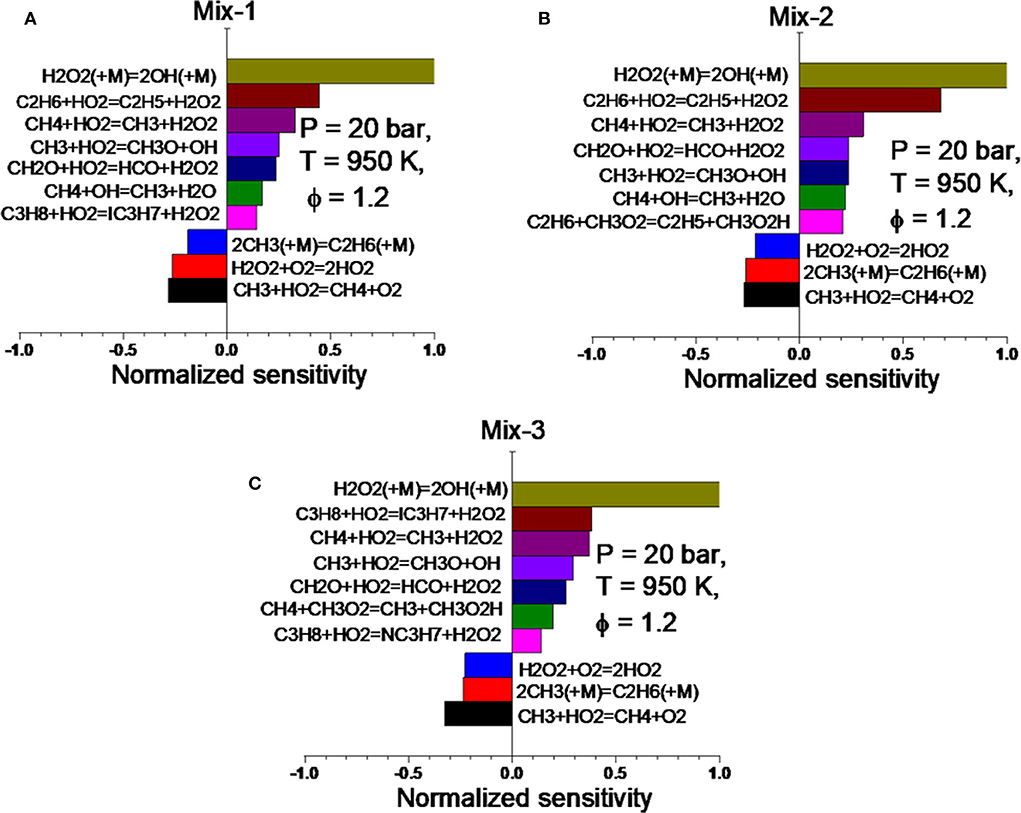
Figure 10. Sensitivity analysis on the OH radical at time of ignition for Mix 1 (A), Mix 2 (B), and Mix 3 (C) at 20 bar, 950 K, and ϕ = 1.2 based on the NUIG n-hexane mechanism (Zhang et al., 2015).
In the fuel-rich condition (ϕ = 1.2), the most sensitive elementary reactions of the three mixtures are almost identical. This can lead to very similar ignition delays at the same temperature, which has been observed in the RCM measurements (cf. Figure 5B). By comparing the normalized sensitivities of all reactions, it can be found that the H abstraction of ethane is much more dominating in Mix 2 than in the other two mixtures. Moreover, the normalized sensitivities of the reactions in Mix 1 and Mix 3 are very similar to each other. These observations from the SA were also reflected in the measured IDTs shown in Figure 5B, where the IDTs of Mix 1 and 3 are almost overlapping whereas those of Mix 2 are slightly shorter than the other two. By analyzing the SA of Mix 1–3 under both equivalence ratios, it can be concluded that, by having the same MN, e.g., 80, the mixture containing high vol% ethane has the higher reactivity and may result in a higher knocking propensity in engine operations.
The ignition delay times (IDTs) of different LNG/LBG and reference mixtures were investigated in a high-pressure shock tube and a rapid compression machine covering temperatures from 870 to 1,550 K, pressures of 10, 20, and 40 bar, and equivalence ratios of 0.4 and 1.2. The correlation between the methane number (MN) and the IDTs was analyzed, and chemical kinetic modeling based on the NUIG n-hexane mechanism (Zhang et al., 2015) was performed to gain insights on the ignition behaviors. The following findings were obtained in this work:
1. The IDTs of the reference mixtures, namely, Ref 50–Ref 90, showed very good correlation with the MN, i.e., the reactivity of the mixtures increased with decreasing MN, and Ref 90 has the lowest reactivity and therefore the longest IDT. However, the activation energies of the reference mixtures have slight differences, which led to approaching IDTs toward the lower temperature region.
2. The LNG/LBG mixtures with MN from 70 to 80 were investigated at high temperatures, and the IDTs of the mixture with MN 70 were clearly shorter than the mixture with MN 80. The IDTs of the mixtures with MN 73, 74, and 76 are in the range of MN 70 and 80; however, the IDTs were too close to each other and no clear differences were observed. Moreover, unlike the methane/hydrogen reference mixtures, the activation energies of the LNG/LBG mixtures showed no obvious difference.
3. The IDTs of the LNG/LBG mixtures with MN 80 measured at temperatures higher than 1,100 K and at 20 bar are quite similar. However, at temperatures between 890 and 1,020 K, the IDTs of the fuel-lean mixtures (ϕ = 0.4) showed clear discrepancies with each other, and the discrepancy was much smaller in the fuel-rich condition (ϕ = 1.2). According to the sensitivity analyses, the discrepancy observed at ϕ = 0.4 was attributed to the different methane/ethane/propane concentrations that lead to different reaction kinetics. However, in the fuel-rich condition, the SA of the three mixtures are very similar to each other, which resulted in similar IDTs observed in the measurements. From the experimental observation and the modeling analyses, it can be seen that, for the same MN, the mixture containing more ethane is more reactive and may cause a higher knocking propensity in engine operations.
4. The investigation on the mixtures containing butane and propane isomers showed that the IDTs were not affected by changing the small vol% (<2 vol%) isomers in the mixture.
5. The NUIG n-hexane mechanism (Zhang et al., 2015) showed very good performance for the mixtures containing C1-C3 compositions; however, for the mixtures with C4 and C5, the simulated IDTs were overall longer than the measurements.
All datasets generated for this study are included in the article/Supplementary Material.
BS defined the scientific work and performed the data analysis as well as the construction of the manuscript. SV performed the experiments in RCM and the corresponding chemical kinetic simulation and contributed to the manuscript. JZ performed the experiments in shock tube and the corresponding chemical kinetic modeling and contributed to the manuscript. RF supervised the scientifc work and contributed to the manuscript. All authors contributed to the article and approved the submitted version. SA performed extra scientific investigations and contributed to revising the manuscript.
This work was part of the EMPIR project 16ENG09 Metrological support for LNG and LBG as transport fuel (LNG III). The EMRP and EMPIR are jointly funded by the participating countries within EURAMET and the European Union.
The authors declare that the research was conducted in the absence of any commercial or financial relationships that could be construed as a potential conflict of interest.
The Supplementary Material for this article can be found online at: https://www.frontiersin.org/articles/10.3389/fmech.2020.00047/full#supplementary-material
1. ^Paris Agreement. Available online at: https://unfccc.int/sites/default/files/english_paris_agreement.pdf
2. ^LNG Metrology. Available online at: https://lngmetrology.info/
3. ^European Clean Fuel Strategy. Available online at: https://ec.europa.eu/commission/presscorner/detail/en/IP_13_40
4. ^Shell. Available online at: http://www.shell.com/energy-and-innovation/natural-gas/liquefied-natural-gaslng.html
Andersen, P. (1999). Algorithm for Methane Number Determination for Natural Gasses. Horsholm: Danish Gas Technology Centre.
Bugler, J., Marks, B., Mathieu, O., Archuleta, R., Camou, A., Grégoire, C., et al. (2016). An ignition delay time and chemical kinetic modelling study of the pentane isomers, combustion and flame. Comb. Flame 163, 136–156. doi: 10.1016/j.combustflame.2015.09.014
Bugler, J., Rodriguez, A., Herbinet, O., Battin-Leclerc, F., Dagaut, P., and Curran, H. J. (2017). Experiments and modeling of n-pentane oxidation in two jet-stirred reactors. Proc. Combust. Inst. 36, 441–448. doi: 10.1016/j.proci.2016.05.048
Bugler, J., Somers, K. P., Silke, E. J., and Curran, H. J. (2015). Revisiting the kinetics and thermodynamics of the low-temperature oxidation pathways of alkanes: a case study of the three pentane isomers. J. Phys. Chem. A 119, 7510–27. doi: 10.1021/acs.jpca.5b00837
Cantera. (2015). An Object-oriented Software Toolkit for Chemical Kinetics, Thermodynamics, and Transport Processes. Version 2.2.0
Davidson, D. F., and Hanson, R. K. (2004). Interpreting shock tube ignition data. Int. J. Chem. Kinet. 36, 510–523 doi: 10.1002/kin.20024
Eilts, P., and Klare, L. (2018). Investigations on the Determination of the Service Methane Number of LNG. SAE Technical Paper. doi: 10.4271/2018-01-1143
Gersen, S., van Essen, M., Levinsky, H., and van Dijk, G. (2015). Characterizing Gaseous Fuels for their Knock Resistance based on the Chemical and Physical Properties of the Fuel. SAE Technical Paper. doi: 10.4271/2015-01-9077
Gieseking, B., and Brown, A. (2016). Novel algorithm for calculating the methane number of liquefied natural gas with defined uncertainty. Fuel 185, 932–940. doi: 10.1016/j.fuel.2016.07.105
Glomski, P., and Michalski, R. (2011). Problems with determination of evaporation rated and properties of boil-off gas on board LNG carrier. J. Pol. CIMAC. 6, 133–140.
Hu, H., and Keck, J. (1987). Autoignition of Adiabatically Compressed Combustible Gas Mixtures. SAE Mobilus. doi: 10.4271/872110
Kalghatgi, G. (2018). Knock onset, knock intensity, superknock and preignition in spark ignitionengines. Int. J. Eng. Res. 19, 7–20. doi: 10.1177/1468087417736430
Leiker, M., Cartillieri, W., Christoph, K., Pfeifer, U., and Rankl, M. (1972). Evaluation of Antiknocking Propertyof Gaseous Fuels by Means of Methane Number and its Practical Application to Gas Engines. New York, NY: ASME Paper 72-DGP-4. p. 1–15.
Metcalfe, W. K., Burke, S. M., Ahmed, S. S., and Curran, H. J. (2013). A hierarchical and comparative kinetic modeling study of C1–C2 hydrocarbon and oxygenated fuels. Int. J. Chem. Kinet. 45, 638–75. doi: 10.1002/kin.20802
Vallabhuni, S. K., Lele, A. D., Patel, V., Lucassen, A., Moshammer, K., AlAbbad, M., et al. (2018). Autoignition studies of Liquefied Natural Gas (LNG) in a shock tube and a rapid compression machine. Fuel 232, 423–430. doi: 10.1016/j.fuel.2018.04.168
Zhang, K., Banyon, C., Togbé, C., Dagaut, P., Bugler, J., and Curran, H. J. (2015). An experimental and kinetic modeling study of n-hexane oxidation. Combust. Flame 162, 4194–207. doi: 10.1016/j.combustflame.2015.08.001
Zhang, Y., Huang, Z., Wei, L., Zhang, L., and Law, C. K. (2012a). Experimental and modeling study on ignition delays of lean mixtures of methane hydrogen oxygen argon at elevated pressures. Comb. Flame 159, 918–931. doi: 10.1016/j.combustflame.2011.09.010
Keywords: liquefied natural gas, liquefied biogas, rapid compression machine, auto-ignition delays, chemical kinetics, modeling, shock tube
Citation: Shu B, Vallabhuni SK, Zheng J, Agarwal S and Fernandes RX (2020) Experimental and Modeling Studies on the Correlation Between Auto-Ignition Delays and the Methane Number of Liquefied Natural Gas (LNG) and Liquefied Biogas (LBG). Front. Mech. Eng. 6:47. doi: 10.3389/fmech.2020.00047
Received: 26 February 2020; Accepted: 02 June 2020;
Published: 24 July 2020.
Edited by:
Guillaume Vanhove, Université de Lille, FranceReviewed by:
Robert A. Schießl, Karlsruhe Institute of Technology (KIT), GermanyCopyright © 2020 Shu, Vallabhuni, Zheng, Agarwal and Fernandes. This is an open-access article distributed under the terms of the Creative Commons Attribution License (CC BY). The use, distribution or reproduction in other forums is permitted, provided the original author(s) and the copyright owner(s) are credited and that the original publication in this journal is cited, in accordance with accepted academic practice. No use, distribution or reproduction is permitted which does not comply with these terms.
*Correspondence: Bo Shu, Ym8uc2h1QHB0Yi5kZQ==
Disclaimer: All claims expressed in this article are solely those of the authors and do not necessarily represent those of their affiliated organizations, or those of the publisher, the editors and the reviewers. Any product that may be evaluated in this article or claim that may be made by its manufacturer is not guaranteed or endorsed by the publisher.
Research integrity at Frontiers
Learn more about the work of our research integrity team to safeguard the quality of each article we publish.