 Luis Iglesias1
 Priyadarshini Shanmugam2
 Jean-François Michaud2Daniel Alquier2
 Dominique Certon2
 Isabelle Dufour1*
- 1Université de Bordeaux, Laboratoire IMS UMR-CNRS 5218, Talence, France
- 2Université de Tours, GREMAN UMR-CNRS 7347, Tours, France
Functionalized films are commonly used in gas sensing to target a particular gas. This is due, in part, to their usually high capability to detect very low concentrations and their high selectivity. However, their poor stability over time remains a challenge when dealing with applications that require the sensing to remain reliable without frequent recalibration. For this reason, uncoated gas sensors have become increasingly popular regardless of their lower sensitivity and their often non-selective characteristics. There exist different approaches for gas sensing without a functionalized film. One possibility is to use an uncoated resonating sensor and tracking its resonant properties which depend on its surrounding environment. The easy integration capability of capacitive micromachined ultrasonic transducers (CMUTs) makes them great candidates for uncoated gas sensing. Moreover, they are able to reach very high resonant frequencies and, therefore, allow for a shorter response time. In this article, a method to detect gas by following the value of the admittance of an uncoated silicon nitride CMUT array at either the resonant or at the anti-resonant frequency is presented and tested. This chemical detection is purely based on the change of the physical properties of the gas mixture (the mass density and the viscosity). A general model describing the impact of the electrical and mechanical properties of the CMUT in the sensitivity is presented, validated and applied to carbon dioxide and methane detection.
1. Introduction
In gas sensing, coating a device with a thin film specifically tailored to chemically interact with the target analyte is by far the most common approach (Göpel, 1994; Park et al., 2007; Lee et al., 2011; Qiu et al., 2015). However, it has been shown that using a sensitive coating compromises the long term stability of the sensor (Korotcenkov and Cho, 2011) mostly due to aging of such film (Sharma et al., 2001; Romain and Nicolas, 2010). For this reason, there is an increasing interest toward uncoated sensors, which rely on the change of the physical properties of their surrounding gas such as thermal conductivity (Daynes, 1933; Hale et al., 1992; Simon and Arndt, 2002), or mass density (Tétin et al., 2010; Boudjiet et al., 2014; Rosario and Mutharasan, 2014). Despite the lack of selectivity of uncoated sensors, it is still possible to discriminate from different gases by measuring multiple parameters at once (Iglesias et al., 2019).
It has been shown that both the resonant frequency and the quality factor of uncoated resonant sensors such as microcantilever resonators depend on physical properties of the fluid surrounding them (Sader, 1998; Abdolrazzaghi and Daneshmand, 2016). This has been used previously for characterizing liquids (Heinisch et al., 2015) and even gases, despite the fact that their mass density and viscosity are much smaller. Gas detection such as hydrogen, carbon dioxide, argon, helium and methane detection have already been demonstrated using uncoated resonant sensors (Tétin et al., 2010; Boudjiet et al., 2014; Rosario and Mutharasan, 2014; Iglesias et al., 2019). These measurements have been performed either using silicon or piezoelectric cantilevers at frequencies below 200 kHz. However, capacitive micromachined ultrasonic transducers (CMUTs) (Haller and Khuri-Yakub, 1996) present an advantage over piezoelectric resonators due to their relatively easy integration (Törndahl et al., 2002; Wygant et al., 2008; Gurun et al., 2011; Um et al., 2014). Additionally, gas sensing has already been done with uncoated ultrasonic microresonators by measuring the time of flight of a signal propagating through the gas (Toda and Kobayakawa, 2008; Shanmugam et al., 2018). Nevertheless, a physical gas detection using the measurement of the admittance spectrum of an uncoated silicon nitride CMUT array has, to the best of our knowledge, never been done. The principle, which is based on the measurement of the value of the admittance at the resonance and anti-resonance and not on the corresponding frequency shifts, along with an analytical model of the impact of a change in the gas composition, are presented and verified under mixtures of nitrogen and either carbon dioxide (CO2) or methane (CH4) as an example.
The principle of this method along with the experimental setup and results will be presented in the following sections.
2. Materials and Methods
2.1. Sensor and Model
Schematics of a single Capacitive Micromachined Ultrasonic Transducer (CMUT) like the one used in this study are shown in Figure 1A. The microfabrication process based on surface micromachining can be found in Heller et al. (2018). By applying a voltage V between the electrodes, the silicon nitride membrane deflects, changing the capacitance of the sensor.
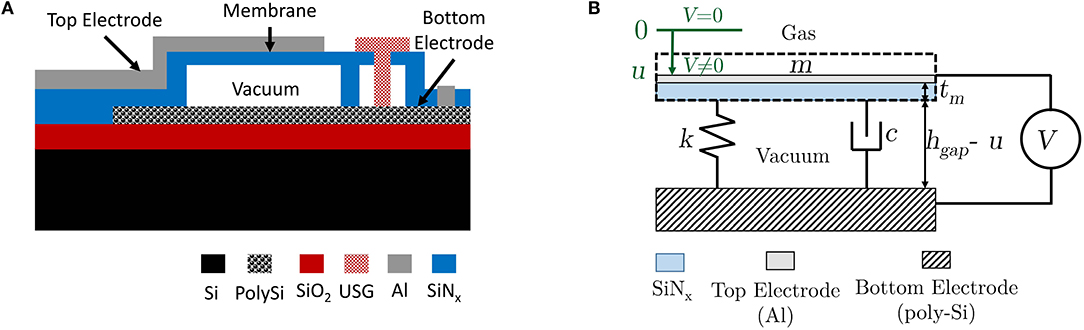
Figure 1. (A) Schematic view of a single CMUT from this study where USG stands for Undoped Silicon Glass. (B) Lumped model schematics of a single CMUT.
It has been shown previously that a simple lumped model as the one in Figure 1B can describe accurately the behavior of a single CMUT (Wenchao et al., 2008; Koymen et al., 2017) and it results in the following equation corresponding to Newton's second law of motion:
where k is the stiffness of the membrane, c the linear damping coefficient (depending on the viscous losses in the gas), m the displaced mass (of both the membrane and the surrounding gas), u the displacement of the membrane, V the actuation voltage, ϵ0 the vacuum dielectric constant, A the surface of the membrane and heq the equivalent gap of the CMUT, whose expression is:
where hgap is the gap between the dielectric membrane and the bottom electrode at rest (V = 0), tm the thickness of the membrane and ϵr the relative permittivity of the membrane.
In such case, by considering that:
where Vdc is the bias and Vac the excitation voltage, it can be shown that, at a given Vdc such that Vac < < Vdc, the harmonic electrical admittance Y of a single CMUT can be expressed as:
where j is such that j2 = −1, ω the angular frequency of the excitation, C0 the static electrical capacitance and ks the stiffness of the membrane by taking into account the electrostatic softening. The expression of ks and C0 are:
where udc is the static displacement of the membrane corresponding to V = Vdc.
From Equation (4), under vacuum and assuming no solid viscous losses (Koymen et al., 2017) (c = 0), the vacuum admittance resonant (ωr, 0) and anti-resonant (ωa, 0) angular frequencies can be defined. Their expressions are:
Similarly, the corresponding quality factors (c ≠ 0) of the admittance resonance (Qr) and anti-resonance (Qa) can be defined:
The CMUT's electromechanical coupling coefficient (kt) (Yaralioglu et al., 2003) is introduced as:
Equations (6), (7), and (9) can then be rearranged:
which leads to the final expression of Y:
where C00 is the capacitance without bias (kt = 0):
and Yn the normalized admittance containing all the information about the resonant properties of the CMUT. Its expression is:
where:
The modulus of the reduced admittance |Yn| is maximum at x = xr and minimum at x = xa:
Their corresponding values, respectively, |Yr|max and |Yr|min, are:
where:
Therefore both, |Yn|max and |Yn|min, depend only on both Qa and kt. From Equation (11), one could argue that, at a fixed polarization, kt still depends on the gas through ωr, 0 or ωa0. However, from Equation (1) in static:
udc depends only on k, ϵ0, A, Vdc, and heq. None of which depend on the gas properties. This means, according to Equation (11), that at fixed polarization kt is constant. However, a change in the gas composition induces a change dQa in Qa. Therefore one can expect to see a change in |Yn|max and |Yn|min as well. At this point, it should be highlighted that xr is only defined for values of kt below a critical value kc for which xr = 0:
which happens close to the collapse voltage Vcoll. Finally, by differentiating Equations (21) and (22), at fixed kt, it comes:
where αr and αa are the electrical gains in sensitivity at the resonance and anti-resonance, respectively. Their expressions are:
By analyzing the difference Δα:
it is possible to show that Δ α < 0 for which is the case in practice since . Therefore, the sensitivity is always higher by tracking |Yn|min instead of |Yn|max. That being said, for typical values of Qa (10–1,000) and (below 0.3), this difference is rather small (below 1%).
It is worth noticing that the formulae of this section 2.1 are the same for an array of identical CMUTs in parallel like the one shown in Figure 2. Nevertheless the overall variations are added with a higher number of CMUTs, which improves the signal to noise ratio.
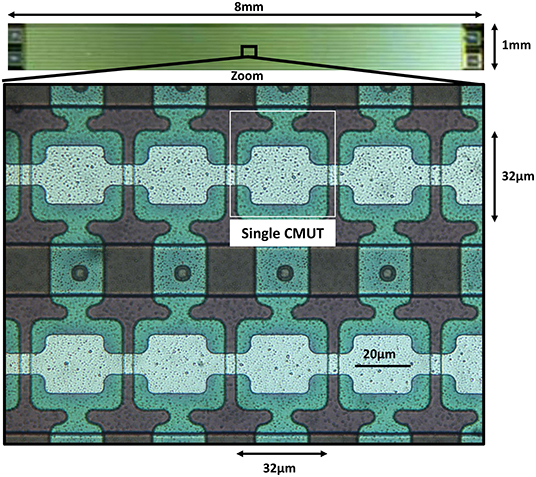
Figure 2. Picture of the array (~ 8 mm × 1 mm) composed of thousands of single CMUTs in parallel and zoom. Membrane dimensions: 32μm × 32μm × 450 nm, ωa = 50rad/μs, Qa = 33, Vcoll = 58V.
At this point, the model can be applied to all kinds of sensing where the principle is to track the admittance peaks of a CMUT. In the particular case of gas sensing with an uncoated CMUT array, m and c will change due to the effect of the gas (air or N2 for instance) and will modify the quality factor Qa. Finally, the sensitivity to a particular gas will depend both on its viscosity and its mass density through dQa (viscous losses).
2.2. Model Validation
In order to compare the model, some parameters of the model need to be determined by the measured admittance |Y(ω)|.
The parameters ωr, 0 (in N2) and Qr (in N2) were extracted from the measured conductance G, which is the real part of the admittance Y:
Indeed, the maximum of G, named Gmax, is for ω = ωr, 0 and Qr can be estimated by using:
where Δω is the bandwidth at G = Gmax/2.
C00 was obtained by measuring the slope of |Y(ω)| at Vdc = 0V as shown in Figure 3A for which the value C00 = 190pF was obtained. Knowing the value of C00 allowed to compute |Yn| = |Y|/(C00ω) for different values of Vdc. It allowed to determine the value of kt by using Equation (33):
where:
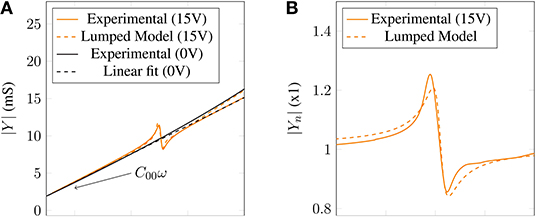
Figure 3. Comparison between experimental and theoretical values under N2 (, Vdc = 15V, Qa = 33, ωa, 0 = 50rad/μs). (A) |Y| as a function of ω. (B) |Yn| as a function of ω.
Knowing ωr, 0, Qr and kt, ωa, 0 = 50 rad/μs and Qa = 33 are simply obtained by using Equations (13) and (14), respectively.
Figure 3B shows the experimental values of |Yn| (solid) for Vdc = 15V and its expression (Equation 17) resulting from the lumped model approximation (dashed) as a function of ω. Both curves are in agreement with each other. The mismatch can be explained by the simplicity of the model. Indeed, neither a particular geometry nor a non-uniformity between the array elements (Lee et al., 2009) have been considered. Also, in order to verify experimentally that the sensitivity at the resonance is comparable at the one at the anti-resonance, the relative change in admittance was measured in both cases while the gas composition was changed from pure N2 to 80% of CO2 in N2. The results, shown in Figure 4, confirm the barely higher sensitivity in the case of the anti-resonance. Moreover, in Figure 4, the relative change of the resonant angular frequency, ωr, during the same experiment has been plotted. It can be easily concluded that, with this particular device, tracking the admittance at either the resonance or anti-resonance is much more sensitive than the typical method of tracking the resonant angular frequency (gas detection step only visible in the inset of Figure 4).
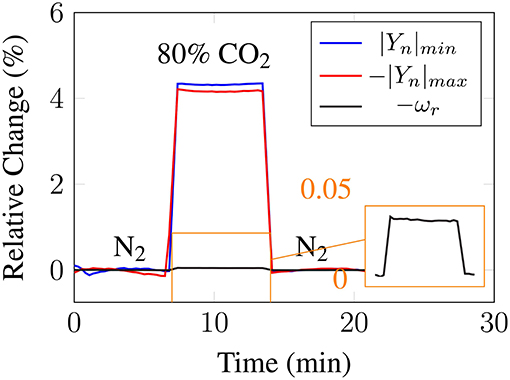
Figure 4. Relative change at both, the resonance and anti-resonance of |Yn| for 80% of CO2. The relative change of the resonant angular frequency, ωr, is also plotted in this figure with an inset in order to better see the variation of the parameter (, Vdc = 15V, Qa = 33, ωa, 0 = 50rad/μs).
Additionally, verification of the expression of αa from Equation (29) is shown in Figure 5 where the theoretical values are shown for different values of Qa as a function of kt (solid lines). The experimental values were obtained through Equation (27) by monitoring |Yn|min for Vdc varying from 1V to 52V (90% of Vcoll) in order to avoid damaging the sensors. For each value of Vdc, 4% of CO2 was introduced in order to be able to measure d|Yn|min even for low values of kt. The obtained dQa from the obtained values of Qa is dQa = −0.126 (for the case Vdc = 35V). These values are also plotted (orange dots) and are in agreement with the theory. The obtained values are reported in Table 1.
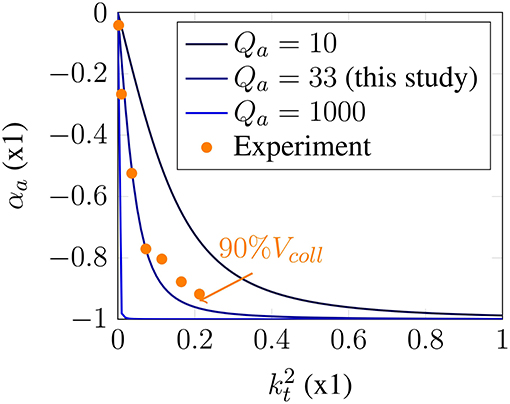
Figure 5. αa as a function of kt. 4% of CO2 in N2 was used to measure d|Yn|min/|Yn|min and the corresponding dQa.

Table 1. Experimental values used in Figure 3.
Intuitively (and this is confirmed by the plot of αa in Figure 5), for gas detection, one should try to get as close to Vcoll as possible (taking into account Vac) in order to reach the highest sensitivity. However, the noise standard deviation (σ) increases as well with Vdc (Wygant et al., 2016) and, therefore, the limit of detection (LOD), which can be approximated by Equation (35) (Lange et al., 2002), does not necessarily improve.
where S is the overall sensitivity to a particular gas. For this reason, the results presented in the following section were carried out at 60% of Vcoll (Vdc = 35V) where the best trade-off between noise and sensitivity was measured.
3. Results and Discussion
3.1. Changing the Gas
In order to test the performances of this method, tests where pure N2 is alternated with either CO2 (heavier gas) or CH4 (lighter gas) at different concentrations (4%, 3%, 2%, 1%) were performed. The relative variation of |Yn|min with respect to N2 (d|Yn|min/|Yn|min) for both sequences is shown, in Figures 6A,B, respectively. The temperature drift was compensated by removing the slow varying background.
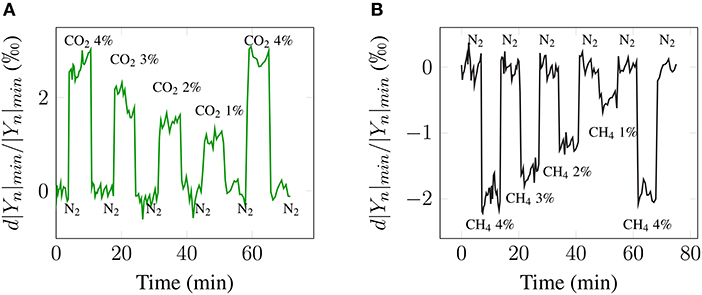
Figure 6. Measurement for Vdc = 35V of d|Yn|min/|Yn|min (drift removed) by alternating pure N2 and either CO2 (A) or CH4 (B) in different concentrations (4%, 3%, 2%, 1%, and 4%).
These results where used afterwards to plot the calibration curves (Figure 7) which show good linearity (at least for that concentration range). Therefore, the sensitivity of the sensor S can be defined for each mixture (N2 and either CO2 or CH4) as the slope of the calibration curve. These values are and .
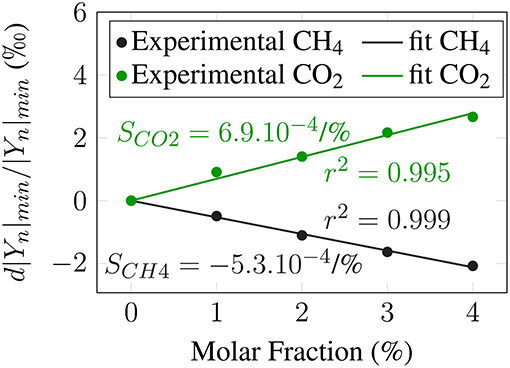
Figure 7. Sensor output characteristic for CO2 (green) and CH4 (black).
In the simpler case of a cantilever respecting Euler-Bernoulli conditions and for small variations, dρ and dη of the mass density ρ and the viscosity η of the gas, it can be shown that the quality factor Q varies (Iglesias et al., 2019):
where a and b are positive constants depending on the geometry and the main gas (N2 in this case). Reported values of dρ/ρ and dη/η for 1% of either CO2 and CH4 are presented in Table 2.
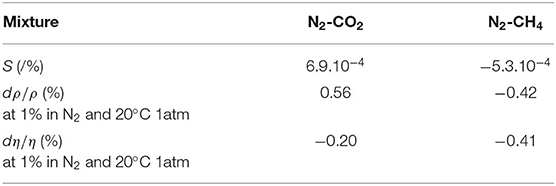
Table 2. Measured values of S for Vdc = 35V and reported values of dρ/ρ and dη/η according to previous work (Iglesias et al., 2019).
Therefore, since for CH4 dρ and dη (with respect to N2) are both negative, the sign of SCH4 is consistent with the theory (αa < 0). Moreover, given the sign of SCO2 and considering that, in the case of CO2, dρ > 0 and dη < 0 this indicates that the effect of the mass density is dominant over the one of the viscosity. Indeed, by applying Equation (36) to CO2 and CH4 to Qa with values from Table 2, it can be shown that |a/b| = 5.6. This means that (assuming that Equation 36 holds for a square membrane) this sensing method would be more suitable to detect gases that would induce an important change in the gas mass density ρ rather than for gases that would only induce it in the gas viscosity η. That being said, the influence of the viscosity remains non-negligible.
3.2. Limit of Detection
Once the sensitivity measured, an estimation of the limit of detection (LOD) for each gas (CO2 or CH4) can be estimated (Equation 35). For this, the noise standard deviation of d|Yn|min/|Yn|min (σ = 0.11‰) was measured under pure N2. The computed values both for CO2 and CH4 (respectively LODCO2 = 0.5% and LODCH4 = 0.6%) were then tested experimentally with an appropriate sequence of lower concentrations for each gas (1%, 0.75%, 0.5%, 0.25%, 1% for CO2 and 1%, 0.8%, 0.6%, 0.4%, 1% for CH4). The results are shown in Figure 8 and are consistent with the calculations.
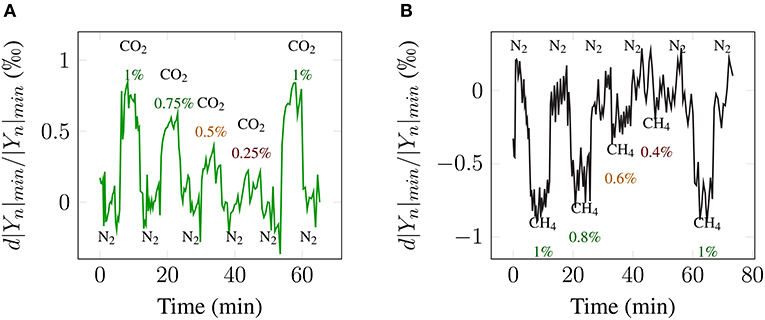
Figure 8. Measurement for Vdc = 35V of d|Yn|min/|Yn|min (drift removed) by alternating pure N2 and either CO2 at 1%, 0.75%, 0.5%, 0.25%, and 1% (A) or CH4 at 1%, 0.8%, 0.6%, 0.4%, and 1% (B). The concentrations were chosen in order to estimate their respective LOD.
4. Conclusion
In conclusion, an analytical model of the influence of the bias voltage in the sensitivity when measuring the value of the normalized admittance at either the resonance or the anti-resonance of a CMUT was presented. This model showed that the sensitivities at both the resonance and anti-resonance are comparable although slightly higher at the anti-resonance. Experiments have been performed by measuring the admittance value at the anti-resonance which is much more sensitive for the tested device than measuring the resonant frequency which is more classical in the community of resonant gas sensors. The expression of the sensitivity at the anti-resonance was verified at different values of the bias voltage in the context of gas sensing without sensitive coating. Examples of measurements were presented for mixtures of N2 and either CO2 or CH4 for which a sensitivity of 6.9.10−4% and −5.3.10−4/% were obtained, respectively, and limits of detection of 0.5% and 0.6% were demonstrated, respectively. Such values could potentially be improved by further optimization of other parameters such as the geometry of the CMUT. Combining the presented measurements with other sensors could also compensate for the lack of selectivity to extend the capabilities beyond binary mixtures.
Data Availability Statement
The datasets generated for this study are available on request to the corresponding author.
Author Contributions
PS, J-FM, DA, and DC have designed and fabricated the CMUTs. LI and ID have developed the modeling and data treatments. LI has done the measurements. All the authors have contributed to the writing of the paper.
Funding
This research was performed thanks to the contest Programme d'Investissements d'Avenir of the French Goverment under the supervision of the French National Radioactive Waste Management Agency (ANDRA).
Conflict of Interest
The authors declare that the research was conducted in the absence of any commercial or financial relationships that could be construed as a potential conflict of interest.
Acknowledgments
The authors would like to thank Laurent Colin from GREMAN for the design of the PCB where the CMUTs chips were wired to and the fabrication of the cell allowing the gas to flow over the CMUTs.
References
Abdolrazzaghi, M., and Daneshmand, M. (2016). “Enhanced Q double resonant active sensor for humidity and moisture effect elimination,” in 2016 IEEE MTT-S International Microwave Symposium (IMS) (San Francisco, CA: IEEE), 1–3.
Boudjiet, M., Cuisset, V., Pellet, C., Bertrand, J., and Dufour, I. (2014). Preliminary results of the feasibility of hydrogen detection by the use of uncoated silicon microcantilever-based sensors. Int. J. Hyd. Energy 39, 20497–20502. doi: 10.1016/j.ijhydene.2014.03.228
Daynes, H. A. . (1933). Gas analysis by measurement of thermal conductivity. Cambridge University Press 1933. VIII + 357 S. m. 76 Abb. Preis 16/- sh. Z. angew. Math. Mech. 13, 328–328. doi: 10.1002/zamm.19330130419
Göpel, W. (1994). New materials and transducers for chemical sensors. Sens. Actuat. B Chem. 18, 1–21. doi: 10.1016/0925-4005(94)87049-7
Gurun, G., Hasler, P., and Degertekin, F. (2011). Front-end receiver electronics for high-frequency monolithic CMUT-on-CMOS imaging arrays. IEEE Trans. Ultrason. Ferroelect. Freq. Contr. 58, 1658–1668. doi: 10.1109/TUFFC.2011.1993
Hale, J., Stehle, G., and Bals, I. (1992). Gas analysis using a thermal conductivity method. Sens. Actuat. B Chem. 7, 665–671. doi: 10.1016/0925-4005(92)80383-9
Haller, M., and Khuri-Yakub, B. (1996). A surface micromachined electrostatic ultrasonic air transducer. IEEE Trans. Ultrason. Ferroelectr. Freq. Cont. 43, 1–6. doi: 10.1109/58.484456
Heinisch, M., Voglhuber-Brunnmaier, T., Reichel, E., Dufour, I., and Jakoby, B. (2015). Application of resonant steel tuning forks with circular and rectangular cross sections for precise mass density and viscosity measurements. Sens. Actuat. A Phys. 226, 163–174. doi: 10.1016/j.sna.2015.02.007
Heller, J., Boulme, A., Alquier, D., Ngo, S., and Certon, D. (2018). Performance evaluation of CMUT-based ultrasonic transformers for galvanic isolation. IEEE Trans. Ultrason. Ferroelectr. Freq. Cont. 65, 617–629. doi: 10.1109/TUFFC.2018.2796303
Iglesias, L., Boudjiet, M., and Dufour, I. (2019). Discrimination and concentration measurement of different binary gas mixtures with a simple resonator through viscosity and mass density measurements. Sens. Actuat. B Chem. 285, 487–494. doi: 10.1016/j.snb.2019.01.070
Korotcenkov, G., and Cho, B. (2011). Instability of metal oxide-based conductometric gas sensors and approaches to stability improvement (short survey). Sens. Actuat. B Chem. 156, 527–538. doi: 10.1016/j.snb.2011.02.024
Koymen, H., Atalar, A., and Tasdelen, A. S. (2017). Bilateral CMUT cells and arrays: equivalent circuits, diffraction constants, and substrate impedance. IEEE Trans. Ultrason. Ferroelect. Freq. Contr. 64, 414–423. doi: 10.1109/TUFFC.2016.2628882
Lange, D., Hagleitner, C., Hierlemann, A., Brand, O., and Baltes, H. (2002). Complementary metal oxide semiconductor cantilever arrays on a single chip: mass-sensitive detection of volatile organic compounds. Anal. Chem. 74, 3084–3095. doi: 10.1021/ac011269j
Lee, H. J., Park, K. K., Cristman, P., Oralkan, O., Kupnik, M., and Khuri-Yakub, B. T. (2009). “A low-noise oscillator based on a multi-membrane CMUT for high sensitivity resonant chemical sensors,” in 2009 IEEE 22nd International Conference on Micro Electro Mechanical Systems (Sorrento: IEEE), 761–764. doi: 10.1109/MEMSYS.2009.4805494
Lee, H. J., Park, K. K., Kupnik, M., Oralkan, O., and Khuri-Yakub, B. T. (2011). Chemical vapor detection using a capacitive micromachined ultrasonic transducer. Anal. Chem. 83, 9314–9320. doi: 10.1021/ac201626b
Park, K. K., Lee, H. J., Yaralioglu, G. G., Ergun, A. S., Oralkan, O., Kupnik, M., et al. (2007). Capacitive micromachined ultrasonic transducers for chemical detection in nitrogen. Appl. Phys. Lett. 91:094102. doi: 10.1063/1.2776348
Qiu, Y., Gigliotti, J. V., Wallace, M., Griggio, F., Demore, C. E., Cochran, S., et al. (2015). Piezoelectric micromachined ultrasound transducer (PMUT) arrays for integrated sensing, actuation and imaging. Sensors 15, 8020–8041. doi: 10.3390/s150408020
Romain, A., and Nicolas, J. (2010). Long term stability of metal oxide-based gas sensors for e-nose environmental applications: an overview. Sens. Actuat. B Chem. 146, 502–506. doi: 10.1016/j.snb.2009.12.027
Rosario, R., and Mutharasan, R. (2014). Piezoelectric excited millimeter sized cantilever sensors for measuring gas density changes. Sens. Actuat. B Chem. 192, 99–104. doi: 10.1016/j.snb.2013.10.017
Sader, J. E. (1998). Frequency response of cantilever beams immersed in viscous fluids with applications to the atomic force microscope. J. Appl. Phys. 84, 64–76. doi: 10.1063/1.368002
Shanmugam, P., Iglesias, L., Michaud, J. F., Dufour, I., Alquier, D., Colin, L., et al. (2018). “CMUT based air coupled transducers for gas-mixture analysis,” in 2018 IEEE International Ultrasonics Symposium (IUS) (Kobe), 1–4.
Sharma, R. K., Chan, P. C., Tang, Z., Yan, G., Hsing, I.-M., and Sin, J. K. (2001). Investigation of stability and reliability of tin oxide thin-film for integrated micro-machined gas sensor devices. Sens. Actuat. B Chem. 81, 9–16. doi: 10.1016/S0925-4005(01)00920-0
Simon, I., and Arndt, M. (2002). Thermal and gas-sensing properties of a micromachined thermal conductivity sensor for the detection of hydrogen in automotive applications. Sens. Actuat. A Phys. 97–98, 104–108. doi: 10.1016/S0924-4247(01)00825-1
Tétin, S., Caillard, B., Ménil, F., Debéda, H., Lucat, C., Pellet, C., et al. (2010). Modeling and performance of uncoated microcantilever-based chemical sensors. Sens. Actuat. B Chem. 143, 555–560. doi: 10.1016/j.snb.2009.09.062
Toda, H., and Kobayakawa, T. (2008). High-speed gas concentration measurement using ultrasound. Sens. Actuat. A Phys. 144, 1–6. doi: 10.1016/j.sna.2007.12.025
Törndahl, M., Almqvist, M., Wallman, L., Persson, H., and Lindstrom, K. (2002). “Characterisation and comparison of a cMUT versus a piezoelectric transducer for air applications,” in 2002 IEEE Ultrasonics Symposium, 2002. Proceedings, Vol. 2 (Munich: IEEE), 1023–1026.
Um, J.-Y., Kim, Y.-J., Cho, S.-E., Chae, M.-K., Song, J., Kim, B., et al. (2014). An analog-digital hybrid RX beamformer chip with non-uniform sampling for ultrasound medical imaging with 2d CMUT array. IEEE Trans. Biomed. Circuits Syst. 8, 799–809. doi: 10.1109/TBCAS.2014.2375958
Wenchao, Z., Ting, Y., and Fengqi, Y. (2008). “A 1-D lumped theoretical model for CMUT,” in 2008 IEEE/ASME International Conference on Advanced Intelligent Mechatronics (Xian: IEEE), 318–322. doi: 10.1109/AIM.2008.4601680
Wygant, I. O., Kupnik, M., and Khuri-Yakub, B. T. (2016). “CMUT design equations for optimizing noise figure and source pressure,” in 2016 IEEE International Ultrasonics Symposium (IUS) (Tours: IEEE), 1–4.
Wygant, I. O., Zhuang, X., Yeh, D. T., Oralkan, O., Sanli Ergun, A., Karaman, M., et al. (2008). Integration of 2d CMUT arrays with front-end electronics for volumetric ultrasound imaging. IEEE Trans. Ultrason. Ferroelect. Freq. Contr. 55, 327–342. doi: 10.1109/TUFFC.2008.652
Yaralioglu, G. G., Ergun, A. S, Bayram, B., Haeggström, E., and Khuri-Yakub, B. T. (2003). Calculation and measurement of electromechanical coupling coefficient of capacitive micromachined ultrasonic transducers. IEEE Trans. Ultrason. Ferroelect. Freq. Contr. 50, 449–456. doi: 10.1109/tuffc.2003.1197968
Keywords: CMUT, capacitive sensor, MEMS, uncoated sensors, gas sensing, resonator
Citation: Iglesias L, Shanmugam P, Michaud J-F, Alquier D, Certon D and Dufour I (2020) Proof of Concept and Preliminary Results of Gas Detection by Measuring the Admittance at the Resonance and Anti-resonance of an Uncoated CMUT. Front. Mech. Eng. 6:14. doi: 10.3389/fmech.2020.00014
Received: 13 December 2019; Accepted: 03 March 2020;
Published: 24 March 2020.
Edited by:
Silvan Schmid, Vienna University of Technology, AustriaReviewed by:
Qin Zhou, University of Nebraska-Lincoln, United StatesDaniel Hernández-Cruz, Autonomous University of Chiapas, Mexico
Copyright © 2020 Iglesias, Shanmugam, Michaud, Alquier, Certon and Dufour. This is an open-access article distributed under the terms of the Creative Commons Attribution License (CC BY). The use, distribution or reproduction in other forums is permitted, provided the original author(s) and the copyright owner(s) are credited and that the original publication in this journal is cited, in accordance with accepted academic practice. No use, distribution or reproduction is permitted which does not comply with these terms.
*Correspondence: Isabelle Dufour, aXNhYmVsbGUuZHVmb3VyQGltcy1ib3JkZWF1eC5mcg==