 Karol Grochalski
 Michał Wieczorowski1
94% of researchers rate our articles as excellent or good
Learn more about the work of our research integrity team to safeguard the quality of each article we publish.
Find out more
ORIGINAL RESEARCH article
Front. Mech. Eng. , 31 March 2020
Sec. Tribology
Volume 6 - 2020 | https://doi.org/10.3389/fmech.2020.00012
The paper presents the impact of lighting type and direction on measurements of surface asperities using focus-variation microscopy. Particular attention was paid to the direction of lighting when using a light ring. It was pointed out that the lighting direction directly affects the values of the parameters Rt, Rz, and Rc. The article also presents the impact of a light polarizer on the surface topography parameters. It has been shown that the positioning of a sample with a regular and directed structure relative to the optical axis of the light polarizer affects the accuracy of mapping surface asperities. The largest differences were observed for Rz and Rt parameters. A method of using an external polarizer mounted on a focus variation microscope lens was also presented.
The manufacturing process's design is related to the understanding of structural requirements for the surface of materials in order to provide determined properties and performance parameters. An integral part of this procedure is the metrological analysis of the surface during and after the completion of the technological process. Therefore, the choice of a control method and a measuring device for the materials' surface analysis is important. It is also important to ensure the reliability of surface mapping, along with the performance parameters such as resolution and measuring extent, and the time of measurement, which in turn translates into the cost and utility of a device.
The most current devices for measuring the spatial topography of a surface are contact profilometers. Their usage is related to long data acquisition time (in the case of stereometry). The contact profilometer's flaw is the need for the tested element to make contact with the measuring sample and the possibility of scratching it during the measurement (Dobrzanski and Pawlus, 2005; Wieczorowski, 2013).
No-contact profile devices to measure objects, in which there is no contact between the measuring tip and the measured surface, are being manufactured through the addition of optical heads. There are also groups of profilometers that use structural light, which covers a larger area of the analyzed surface (Lange, 1993; Jordan, 1998; Tiziani et al., 2000; Mathia et al., 2011). Measurements using contactless methods are burdened with additional errors, resulting from internal reasons such as drive trains, as well as external ones such as vibrations or temperature changes. Some interfering factors can be eliminated, but it is necessary to be aware of disturbances and the methods' limitations. Occurring disruptions and methods to reduce them in non-contact measurements of surface asperities are presented in publications (Gao et al., 2007; Giusca et al., 2012; Giusca and Leach, 2013; Leach et al., 2015).
Focus variation microscopes are an interesting type of optical instrument for measuring surface topography. Precise optics are the main element of this measuring system. They include various lens systems that can be equipped with measuring lenses, which allows measurements with different resolutions. The semipermeable mirror directs the beam coming out of the source to the optical path of the system, and the lens focuses it on the measured element (Nayar and Nakagawa, 1994; Helmli, 2011). Depending on the topography of the tested element, the light reflects on the surface of the object when it reaches it. All the rays reflected from the test object reaching the lens are registered by the sensor behind the light dividing system. Due to the small depth of field of view (appropriate lens of the device), only a small area of space is sharp. To fully detect the surface at full depth of field, the precision optical system is displaced relative to the table where the sample is placed. Displacement can be achieved by a table or optical system along axis Z. During this motion, sharp images representing the asperities and geometry of the measured surface are continuously registered (Leach, 2011; Kapłonek et al., 2016; Brzozowski et al., 2017). This means that every part of the object has been reproduced in the image with the appropriate sharpness and resolution. A special calculation algorithm converts the data collected by the sensor into three-dimensional information with full depth of field of view. This is achieved by analyzing changes in focus along the vertical axis Z (Danzl et al., 2009; Grochalski et al., 2018). The limitations of this technique include the inability to perform measurements on transparent objects with surface irregularities below 10 nm. Difficulties in measurements are also introduced by light reflections reflected from the measured surface. There are methods to reduce unwanted effects, such as using a polarizer in the optical system or changing the intensity of incident light on the sample (Mendak et al., 2018). Interference with lighting conditions by changing parameters, changing the direction of incidence on a measured sample, or introducing additional optics can cause surface measurement errors. The reflection of light rays differs depending on the direction of light interaction on the surface, which translates to proper data acquisition. Additional optical elements such as polarizers reduce the number of rays reaching the detector and also direct the wave. This is undesirable, particularly where the reflection of the light rays acting on the surface to be measured is diffuse. Such issues are particularly important because the type of lighting chosen determines the information recorded by the detector, data acquisition, and subsequent analysis (Aydin and Akgul, 2008; Billiot et al., 2013; Pertuz et al., 2013). Therefore, the question of how lighting parameters influence the correctness of the representation of asperities of the surface becomes important.
The aim of the study was to determine the impact of lighting parameters and the direction of the incident light on the measurement of surface unevenness. The study was to determine the dependence of selected lighting parameters on the results obtained from surface topography, which in turn would enable the selection of optimal settings for making correct measurements and reducing errors resulting from methodology. Similar studies are presented in Giusca et al. (2014) and Le Goic et al. (2016). The most important aim was to determine the polarizer's influence on the measurement of surface asperities and the impact of the polarized light's direction on surfaces with oriented structure (e.g., scratches, grooves). Previously, this type of research was not carried out in the measurement of surface roughness. Determining the relationship between light polarization and surface asperities' parameters can result in the most accurate representation of measured value.
For the tested object's measurements, the focus-variation microscope was used. The test object was a pattern type C marked with 530x PJ89 symbol with parameter Ra =1 μm. The pattern was placed on the measuring table of the device and additionally secured against moving (Figure 1A). The grooves of the reference plate were positioned parallel to the optical axis Y of the microscope and settings were made at ×100 magnification (Figures 1B,C). The measurement was made at vertical resolution 0.02 μm and ×50 magnification for the same sample area in order to compare the effect of lighting parameters on selected surface parameters such as:
• Rp - Maximum peak height of the roughness profile,
• Rz - Maximum height of roughness profile,
• Rt - Total height of roughness profile,
• Ra - Arithmetic mean deviation of the roughness profile,
• Rc - Mean height of the roughness profile elements.
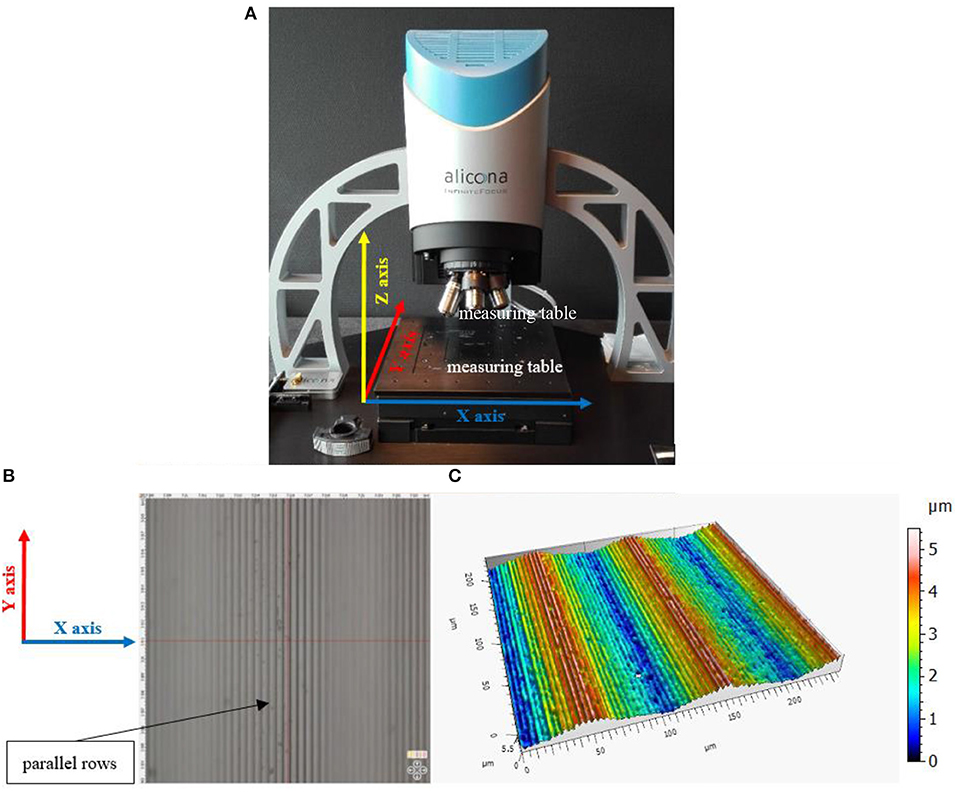
Figure 1. The view of the tested surface on the device—setting of the sample in relation to axis Y: (A) the view of the device, (B) the view of the actual surface, and (C) the view of surface topography.
The test was carried out for various types of lighting. This model of optical profilometer allowed the sample to be illuminated with a light ring and with light that passes through its lens (coaxial lighting). The light ring made it possible to regulate the light intensity by selecting the area/sector to be active. The scheme and marking of individual sectors, as well as the nomenclature used for marking individual measurements, are shown in Figure 2. For national value of the measurement in regard to the influence of light condition, assume the light coming from the profilometer lens was compared. Based on this measurement, measurements which use light ring were carried out, lighting individual combinations of the light sectors. The results are summarized in the table and in the graph. Additionally, a 3D view of the analyzed surfaces for the light coming out of the lens is presented, as well as the most unfavorable variant (in terms of discrepancies in surface topography parameters) using the light ring.
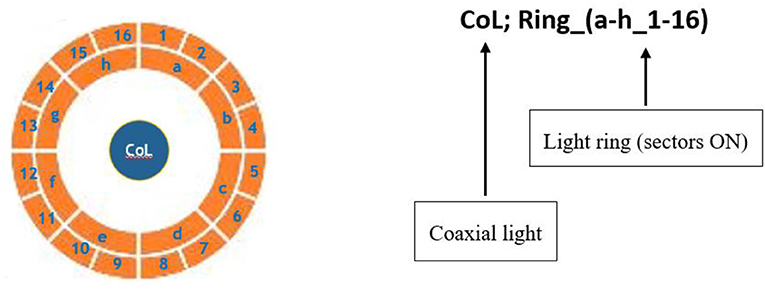
Figure 2. Markings of individual light sectors of the ring.
This type of study was based on the comparison of surface parameters obtained without a polarizer and parameters obtained with the polarizer implemented to the optical system. For this purpose, the same surface was tested without changing the position of the sample, which is the case of determination of influence of the lighting direction. In addition, the influence of changing the light's polarization direction was checked. The variable parameter in this experiment was the orientation of the polarizer in the optical system of the profilometer in the range of 0°-180° in regard to a still sample. For the national value of the measurement, to which the influence of polarization of light and polarizer settings were compared, the light from the light ring was adopted with all segments enclosed (without enclosed polarization). The task of the polarizer, in accordance with its purpose, is to eliminate reflections coming from the tested surface. A change in the orientation of the polarizer axis was to determine the influence of the reflection's reduction and to limit light diffraction on the surface of the sample (at its edges, in the valleys and at the tops). The notion of the experiment is shown in Figures 3, 4.
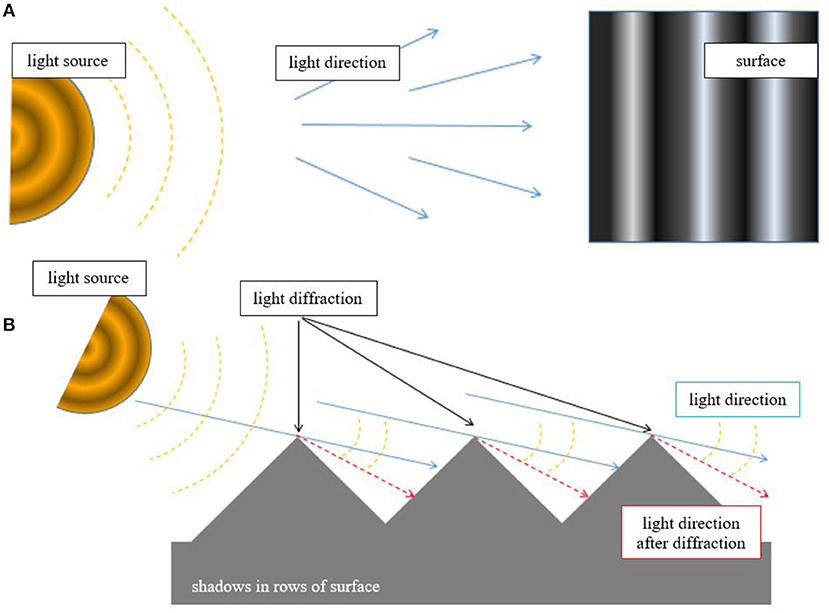
Figure 3. The diagram of scattered light falling on the tested surface: (A) the direction of the light falling on the surface and (B) light diffraction at the tops of the sample.
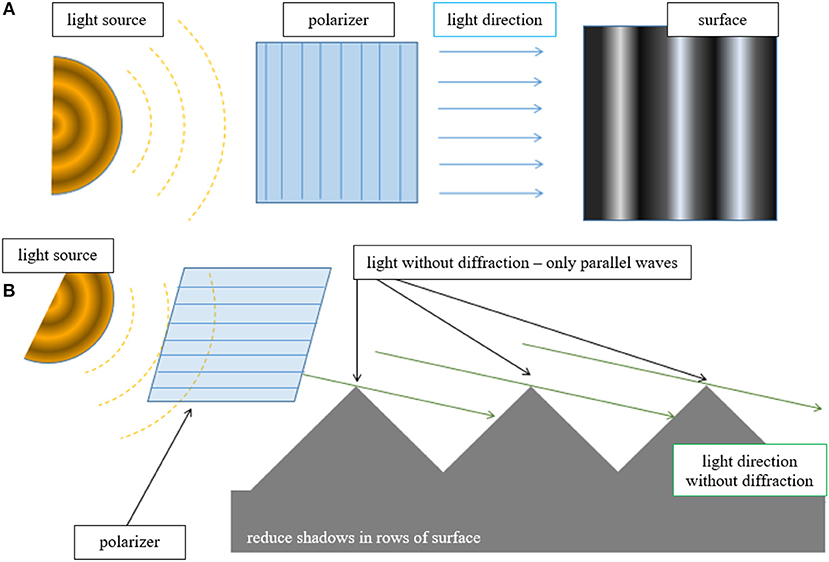
Figure 4. The diagram of polarized light falling on the tested surface: (A) the direction of the light falling on the surface and (B) limitation of light diffraction at the tops of the sample.
Figures 3A,B show a non-polarized, diffused light penetrating and refracting at the tops of the pattern. Figures 4A,B show polarized light with limited diffraction. The effect of this treatment is a more realistic reflection of shadows that develop on the surface, the essence of using the ALICONA profilometer. This effect is advantageous especially while using directional light.
Tests were also carried out using the external, rotatable polarizer placed in front of the profilometer lens.
• The polarizer mounted in the rotary holder put on the profilometer lens, designed for tests with the use of light coming out of the lens (Figure 5).
• The polarizer mounted in the rotary holder placed on the light ring (Figure 6).
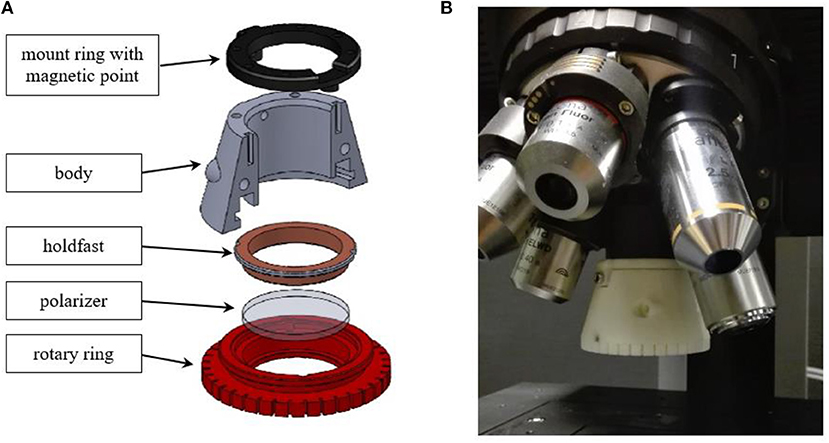
Figure 5. External polarizer placed in front of the lens of the ALICONA profilometer for the use of light coming of the lens: (A) the view of a cross-section of the external polarizer fixing and (B) the actual assembly of the polarizer on the lens of the ALICONA profilometer.
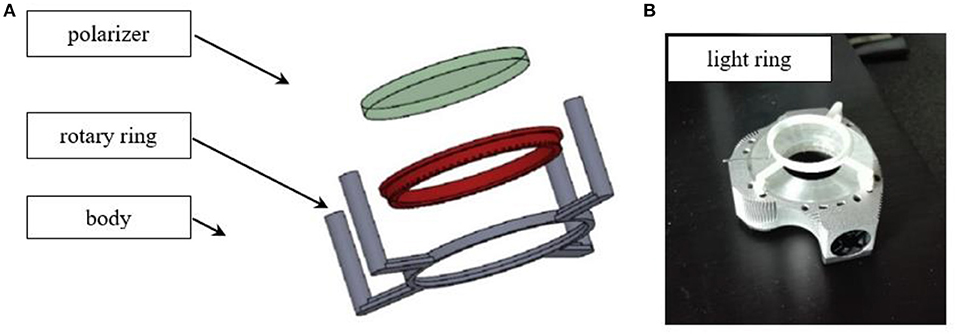
Figure 6. External polarizer placed in front of the lens of the ALICONA profilometer for usage with light ring: (A) the view of the external polarizer fixing and (B) the actual assembly of the polarizer on the light ring.
The use of an external light polarizer aimed to accelerate the angular arrangement of the polarization axis. Due to the introduction of an additional element in the optical system of the device, causing internal light refraction and lack of possibility to set precise focus for the objects with magnification higher than ×20, the test is this variant was not continued.
The tables (Tables 1, 2) and graphs (Figures 7–9) show data on the influence of light direction on the obtained parameters of the measured surface. A comparison of Rp, Rz, Rt, Ra, and Rc values for scattered and polarized light was carried out. Additionally, the differences between the obtained values of diffused and polarized light were correlated with the different directions of light falling. Because of the partial absorption of the light by the polarizer system for some settings of the light ring (lighting of individual sections), data acquisition was not possible.
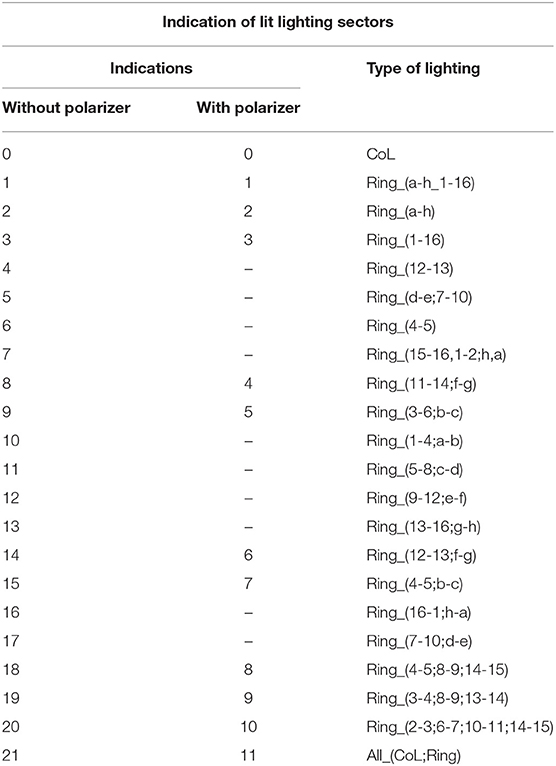
Table 1. Indication of active light sectors corresponding to the results marked on the diagram (Figures 7, 8).
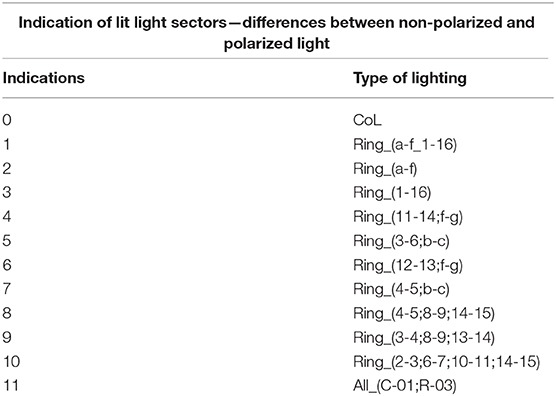
Table 2. Indication of active light sectors corresponding to the results marked on the diagram—differences between non-polarized and polarized light (Figure 9).
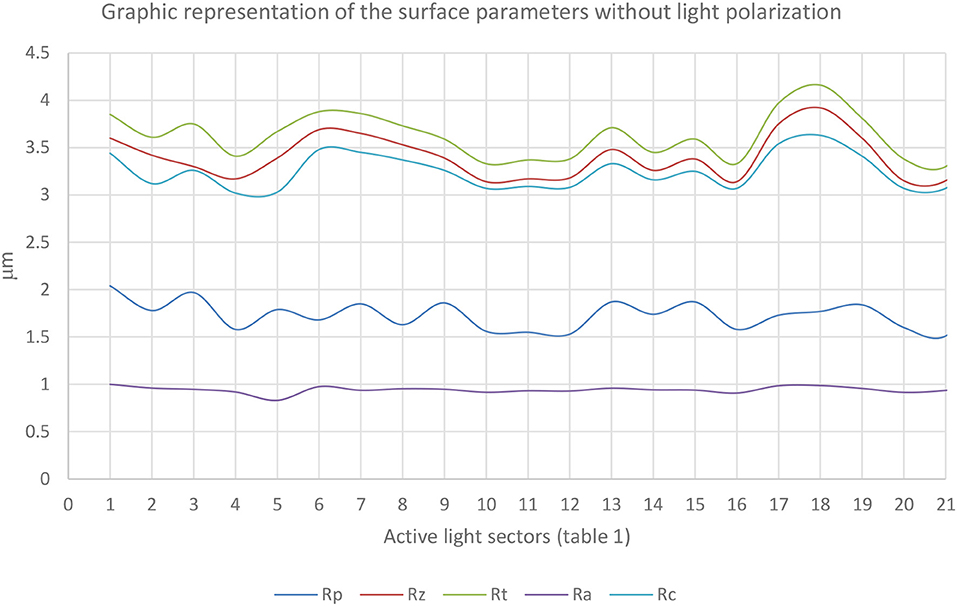
Figure 7. Graphic representation of the surface parameters without light polarization depending on active light sectors.
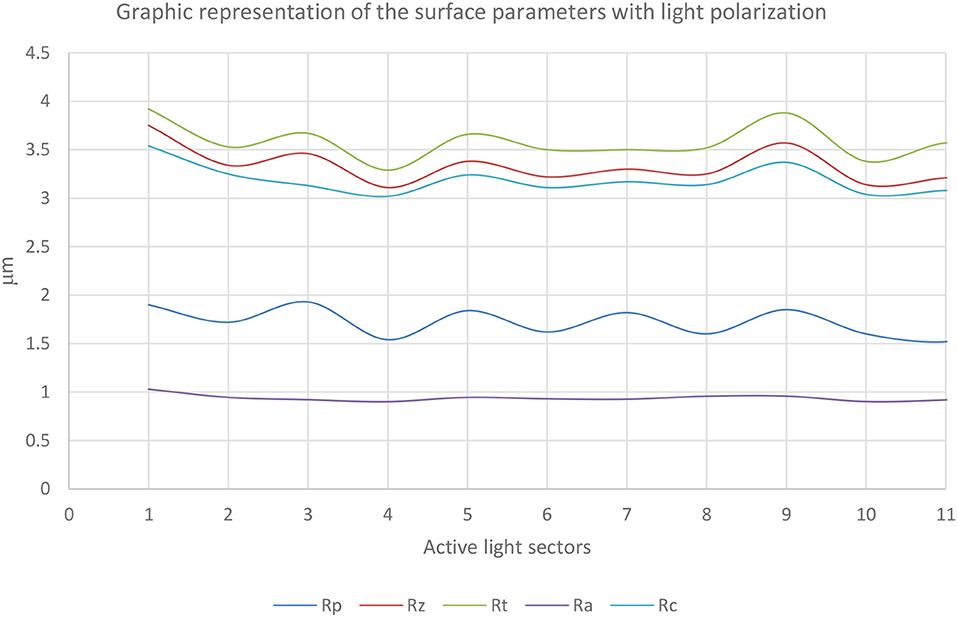
Figure 8. Graphic representation of the surface parameters with light polarization depending on active light sectors.
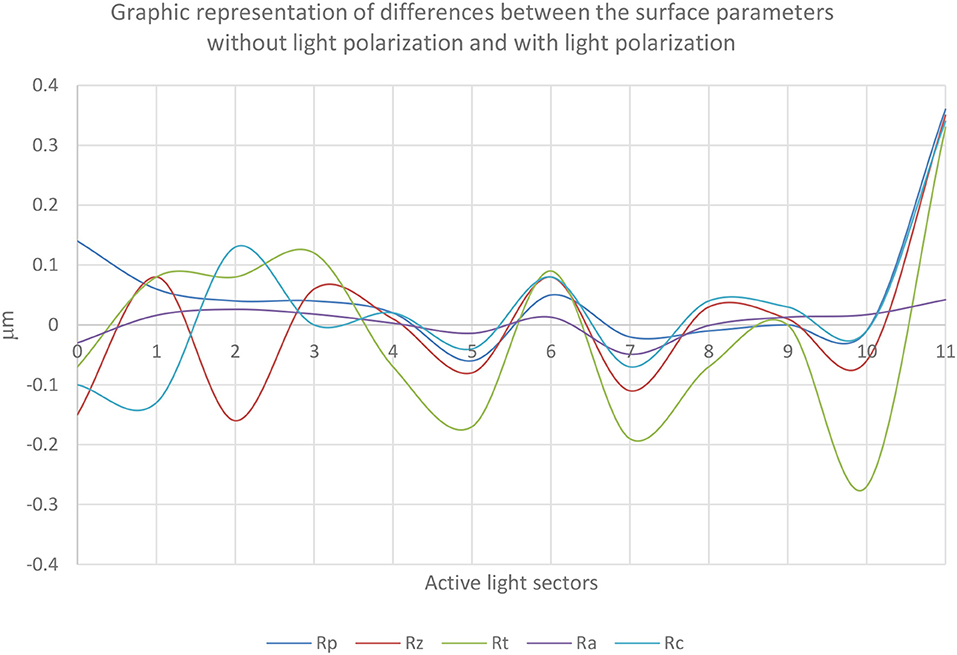
Figure 9. Graphic representation of differences of the surface parameters for non-polarized and polarized light obtained at various active light sectors.
Tests also included the influence of the alignment of the polarization axis in regard to the tested pattern. The polarizer was set in the range of 0°–180°. The obtained data is presented on the radial graph (Figure 10).
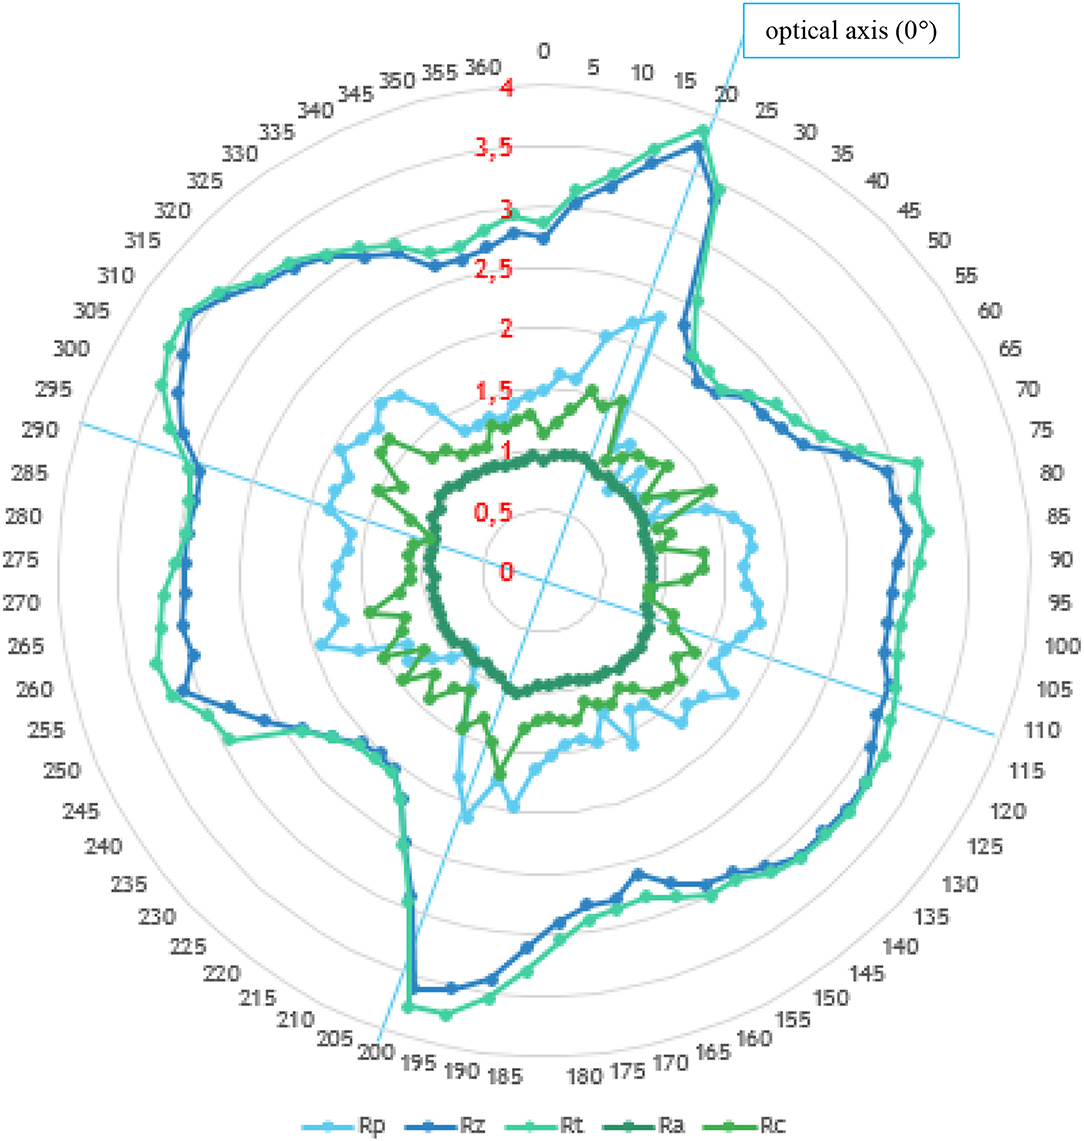
Figure 10. Graphic representation of surface parameters depending on the angle of polarizer's optical axis in relation to the surface.
The obtained data present a significant increase in parameters Rt, Rz, and Rp for the grooves of the pattern positioned parallel to the axis of polarization. The decrease of the parameters' values was observed when the polarization axis was set at the angle 25° to the grooves of the pattern. This is caused by the suppression of the polarized light wave in the unevenness of the surface, thus resulting in the disturbance of the return signal that falls on the profilometer's detector. The obtained surface topography images for the setting of axis polarization at a different angle in relation to the tested surface is presented in Figures 11A,B, 12A,B. The illustrations show the most favorable and the most distorted image, corresponding to the angular settings for parameters 0° and 25° shown in Figure 10.
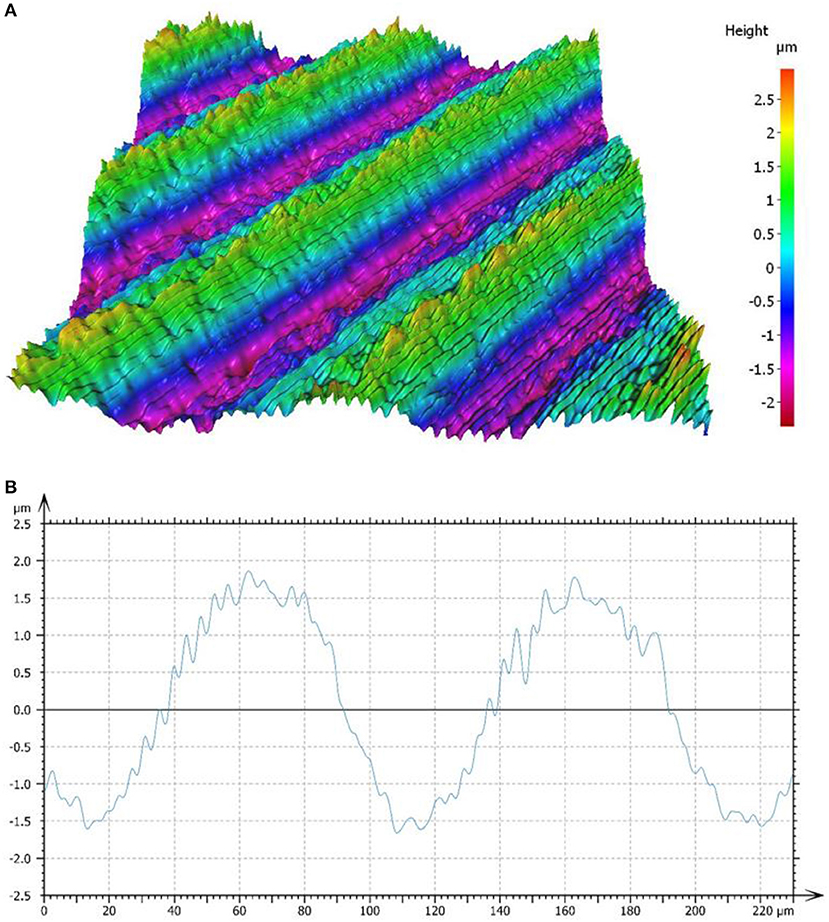
Figure 11. Surface obtained during polarized light measurement—polarization axis set parallel to the order of the pattern (0°): (A) 3D surface view and (B) 2D profile.

Figure 12. The surface devoid of details obtained during polarized light measurement—the set polarization axis was 25°: (A) 3D surface view and (B) 2D profile.
For the measurement made with the polarization axis set parallel to the order of the sample (Figure 11A), there are clearly visible grooves on the surface. This dependence can also be seen on the transverse profile (Figure 11B). The details present in the same measurement area cannot be observed for the setting of the polarization axis at an angle of 25°, which corresponds to the lowest obtained parameters Rt, Rz, and Rp. The obtained surface is characterized by a smoothed structure on which only a clear undulation without characteristic grooves can be seen (Figures 12A,B).
Regardless of the setting of the polarization axis in relation to the sample, Ra parameter being the reference value remains unchanged and remains at the level declared by the manufacturer of the formula Ra = 1 μm.
Based on the tests, it was found that the direction of the incident light on the tested surface in the optical profilometry affects the obtained surface profilometers.
The most favorable conditions for measurement are with lighting coming from the lens or parallel lighting from the light ring. In the case of the light ring, all sectors on the circumference should be turned on to ensure optimal measurement conditions. In cases of isolating individual sectors (directional light falling), we can more precisely notice the structure of the surface (randomly oriented unevenness). This finds application, in particular, while finding local tops or when it is necessary to determine parameter Rz. By using directional light, a longer time of exposure is necessary, which translates into longer measurement time. The use of directional lighting is recommended for specific types of surfaces. This also requires attention to the orientation of the sample in relation to the axis of the profilometer's table. In the most favorable variant selectively chosen light sectors, differences reaching up to 27% for Rz and Rt parameters were noted.
The biggest differences were observed in the measurements using the polarizer in which the orientation was changed in relation to the sample, which has a directional surface structure such as rows or scratches. Different surface parameters were obtained depending on the angle setting of the polarization axis, as well as different projections of the transverse profile.
The biggest values for the Rp, Rz, and Rt parameters occurred when the polarization axis was placed parallel to the grooves that occur in the structure of the tested surface. Differences between the values of selected parameters are up to 95%: from 2 to 3.9 μm. In this case, the obtained topography of the tested surface shows the largest number of details. In other angular settings, parameters' values were decreasing, and the transverse profile reflected the topography of the pattern imprecisely.
An attempt made by using the external polarizer (placed in front of the lens) obtained images that were characterized by poorer focus due to internal light reflections. This type of solution can only be only used for small magnifications up to ×20.
The datasets generated for this study are available on request to the corresponding author.
KG: data analysis and development, development of measurement methodology, and research. MW: substantive supervision. JH'R: analysis and preparation of results. GL: assistance in operating measuring device.
The authors declare that the research was conducted in the absence of any commercial or financial relationships that could be construed as a potential conflict of interest.
Aydin, T., and Akgul, Y. S. (2008). “A new adaptive focus measure for shape from focus,” in British Machine Vision Conference (Leeds), 1–10. doi: 10.5244/C.22.8
Billiot, B., Cointault, F., Journaux, L., Simon, J. C., and Gouton, P. (2013). 3D image acquisition system basedon shapefrom focus technique. Sensors 13:5040–5053. doi: 10.3390/s130405040
Brzozowski, D., Wieczorowski, M., and Gapinski, B. (2017). Pomiar geometrii i ocean powierzchni narzedzi za pomoca mikroskopu róznicowania ogniskowego. Mechanik Miesiecznik Naukowo-Techniczny 90, 1020–1022. doi: 10.17814/mechanik.2017.11.167
Danzl, R., Helmli, F., and Scherer, S. (2009). “Focus variation – a new technology for high resolution optical 3D surface metrology,” in The 10th International Conference of the Slovenian Society for Non-Destructive Testing (Ljubljana).
Dobrzanski, P., and Pawlus, P. (2005). Gaussian Regression Robust Filtering of the Surface Topography Measurement. Saint-Etienne: Met&Props, 133–142.
Gao, F., Leach, R. K., Petzing, J. N., and Coupland, J. (2007). Surface measurement errors using commercial scanning white light interferometers. Measure. Sci. Technol. 19, 1–18. doi: 10.1088/0957-0233/19/1/015303
Giusca, C. L., Claverley, J. D., Sun, W., Leach, R. K., Helmli, F., and Chavigner, M. P. J. (2014). Practical estimation of measurement noise and flatness deviation on focus variation microscopes. CIRP Annals 63, 545–548. doi: 10.1016/j.cirp.2014.03.086
Giusca, C. L., and Leach, R. K. (2013). Calibration of the scales of areal surface topography measuring instruments: part 3. Resolution. Meas. Sci. Technol. 24:105010. doi: 10.1088/0957-0233/24/10/105010
Giusca, C. L., Leach, R. K., Helary, F., Gutauskas, T., and Nimishakavi, L. (2012). Calibration of the scales of areal surface topography measuring instruments: part 1. Measurement noise and residual flatness. Meas. Sci. Technol. 23:65005. doi: 10.1088/0957-0233/23/3/035008
Grochalski, K., Wieczorowski, M., Gapinski, B., and Mendak, M. (2018). Wybrane zródła błedów w mikroskopii róznicowania ogniskowego. Gliwice: XVII Krajowa i VIII Miedzynarodowa Konferencja Naukowo Techniczna Metrologia w Technikach Wytwarzania.
Helmli, F. (2011). “Focus variation instruments,” in Optical Measurement of Surface Topography (Springer), 131–166. doi: 10.1007/978-3-642-12012-1_7
Jordan, H.-J. (1998). Highly accurate non-contact characterization of engineering surfaces using confocal microscopy. Measure. Sci. Technol. 9, 1142–1151. doi: 10.1088/0957-0233/9/7/023
Kapłonek, W., Nadolny, K., and Królczyk, G. M. (2016). The use of focus variation microscopy for the assessment of active surfaces of a new generation of coated abrasive tools. Measure. Sci. Rev. 16, 42–53. doi: 10.1515/msr-2016-0007
Lange, D. A. (1993). Analysis of surface roughness using confocal microscopy. J. Mater. Sci. 28, 3879–3884. doi: 10.1007/BF00353195
Le Goic, G., Hennebelle, F., Samper, S., Pitard, G., and Juillion, P. (2016). Focus Variation 3D Roughness Metrology by Multi-Light Illumination: A Measurement Optimisation for Engineering Surfaces Assessment. Bourgogne Franche-Comté: Arts et Métiers, University.
Leach, R. K. (2011). Optical Measurement of Surface Topography. Berlin: Springer-Verlag. doi: 10.1007/978-3-642-12012-1
Leach, R. K., Giusca, C. L., Haitjema, H., Evans, C., and Jiang, X. (2015). Calibration and verification of areal surface texture measuring instruments. CIRP Ann. 64, 797–813. doi: 10.1016/j.cirp.2015.05.010
Mathia, T.G., Pawlus, P., and Wieczorowski, M. (2011). Recent trends in surface metrology. Wear 271, 494–508. doi: 10.1016/j.wear.2010.06.001
Mendak, M., Wieczorowski, M., Grochalski, K., and Gapinski, B. (2018). Wpływ warunków pomiaru na wiarygodność oceny geometrii narzedzi przy wykorzystaniu mikroskopu róznicowania ogniskowego. Dzwirzyno: XII Szkoła Obróbki Skrawaniem.
Nayar, S. K., and Nakagawa, Y. (1994). Shape from focus system. IEEE Trans. Pattern Anal. Mach. Intell. 16, 824–831. doi: 10.1109/34.308479
Pertuz, S., Puig, D., and Garcia, M. A. (2013). Analysis of focus measure operators for shape from focus. Pattern Recognition 46, 1415–1432. doi: 10.1016/j.patcog.2012.11.011
Keywords: surface topography, optical profilometer, focus variation, polarizer, optical error
Citation: Grochalski K, Wieczorowski M, H'Roura J and Le Goic G (2020) The Optical Aspect of Errors in Measurements of Surface Asperities Using the Optical Profilometry Method. Front. Mech. Eng. 6:12. doi: 10.3389/fmech.2020.00012
Received: 26 November 2019; Accepted: 26 February 2020;
Published: 31 March 2020.
Edited by:
Anna Zawada-Tomkiewicz, Koszalin University of Technology, PolandReviewed by:
Liran Ma, Tsinghua University, ChinaCopyright © 2020 Grochalski, Wieczorowski, H'Roura and Le Goic. This is an open-access article distributed under the terms of the Creative Commons Attribution License (CC BY). The use, distribution or reproduction in other forums is permitted, provided the original author(s) and the copyright owner(s) are credited and that the original publication in this journal is cited, in accordance with accepted academic practice. No use, distribution or reproduction is permitted which does not comply with these terms.
*Correspondence: Karol Grochalski, a2Fyb2wuZ3JvY2hhbHNraUBwdXQucG96bmFuLnBs
Disclaimer: All claims expressed in this article are solely those of the authors and do not necessarily represent those of their affiliated organizations, or those of the publisher, the editors and the reviewers. Any product that may be evaluated in this article or claim that may be made by its manufacturer is not guaranteed or endorsed by the publisher.
Research integrity at Frontiers
Learn more about the work of our research integrity team to safeguard the quality of each article we publish.