 Tao Zhang1
 Chao Wei
95% of researchers rate our articles as excellent or good
Learn more about the work of our research integrity team to safeguard the quality of each article we publish.
Find out more
ORIGINAL RESEARCH article
Front. Mater. , 11 February 2025
Sec. Structural Materials
Volume 12 - 2025 | https://doi.org/10.3389/fmats.2025.1550247
This article is part of the Research Topic Advanced Materials and Technologies for Sustainable Development of Underground Resources View all 43 articles
The surrounding rocks in deep roadways frequently undergo dynamic disturbances caused by adjacent blasting or mining activities. These dynamic disturbances lead to the propagation and coalescence of cracks in the surrounding rock, inducing dynamic disasters in the roadways. However, the mechanisms of rock crack propagation and the roadway failures, induced by dynamic disturbances under different blasting positions and strengths, remain unclear. To investigate the dynamic disturbance of deep roadway surrounding rocks, large-scale physical model tests are carried out on the dynamic instability of surrounding rock under high in situ stress and dynamic disturbance. The dynamic instability failure modes under different disturbance loads and positions are analyzed. The results suggest that under conditions of high ground stress, cracks initiate in stress concentration zones in deep roadways. As disturbance intensities increase, these cracks can further extend, leading to the rapid failure of the surrounding rock. The location of dynamic disturbances influences the failure process of the surrounding rock in deep roadways. Under such stress conditions, stress concentration often occurs at the arch shoulder and arch bottom of the roadway. When the source of dynamic disturbance changes from the side wall to the arch, it is more likely to cause damage within the stress concentration zones in the arch shoulder and arch bottom, which can result in instability and failure of the roadways.
The deep rock dynamic disaster is characterized by sudden occurrence and heavy destruction, posing a difficult problem to study and solve (Zhang et al., 2012; Chen et al., 2016; Zhou et al., 2020; Zhang et al., 2024). The coupling effect of high in situ stress and dynamic disturbances is a crucial factor in inducing deep rock dynamic disasters (Liu SM et al., 2020; Pan et al., 2020). The variation of the in situ stress state is closely related to various factors, and high in situ stress affects stope stability and the risk of floor water inrush (Li et al., 2021). In deep underground engineering, as the buried depth increases, the surrounding rock strength tends to increase, and deep rock often exhibits significant ductility (Huang et al., 2015; Wu et al., 2020). Floor heave frequently occurs in coal mine deep roadways, causing serious obstacles to mine transportation and normal production activities. To address the problem of floor stability, Li et al. established a mechanical model to analyze the stability of roadway floor heave (Zhou, et al., 2022).
During the construction process, the deep surrounding rock often encounters external dynamic disturbances, causing the state of deep rocks to change from ductility to brittleness, which can induce serious dynamic instability disasters such as rock bursts and shock bumps (He et al., 2012; Zhang et al., 2012; He et al., 2010; Wu et al., 2022). With the increasing demand for energy, multiple coal seam mining has emerged, and the rock layer between the two coal seams is influenced by repeated mining disturbances, making it prone to rotational instability and difficult to maintain gob-side entries in the lower coal seams (Liu et al., 2022).
As deep coal mining technology advances, the failure degree of roadway surrounding rocks will become increasingly intense under the complex stress field environment, and the occurrence of rock bursts will also increase significantly. Similar dynamic disasters occur in various deep underground projects (Zhang et al., 2012). During the process of coal seam mining, roadway surrounding rock control and support stability are crucial for normal mine operation. Researchers have studied the roof movement and deformation of an ultra-large height mining face and obtained the working resistance of the mining face and the multiple positions of spalling by introducing the equivalent immediate roof concept (Liu K et al., 2020; Wang et al., 2022). The dynamic response of deep rock mass often exhibits obvious sudden characteristics (Cai et al., 2007; He et al., 2015; Yu et al., 2017; Yu et al., 2020; Wu et al., 2024; Wei et al., 2024). When the rock mass accumulates a large amount of energy, the energy is suddenly released due to dynamic disturbance, causing phenomena such as spalling and ejection of surrounding rocks (Zhou et al., 2020). Due to the special geomechanical conditions in deep engineering, dynamic disturbances can easily cause engineering problems such as water and mud inrush, large deformation of rock mass, and large-area collapse (Zhang et al., 2022). Therefore, it is necessary to conduct systematic research on the fracture process and dynamic instability characteristics of deep roadway surrounding rocks under high ground stress conditions.
The large-scale physical model test is an important means to study the instability mechanism of deep underground engineering, effectively reflecting the mechanical response of rock mass. To observe the rock failure process, many researchers use high-speed cameras (Wei et al., 2023), acoustic emission techniques (Wei et al., 2021), 3D printing (Miao et al., 2021; Ameri et al., 2020), CT technology, and digital image correlation (DIC) to record and analyze the rock crack propagation process (Li et al., 2007; Jia et al., 2013). Šílený and Milev conducted rock burst simulation experiments in a gold mining site, analyzing the accuracy of rock burst prediction using the principle of seismic wave monitoring and the ejection speed of ejection blocks during rock bursts with high-speed photography (Šílený and Milev, 2006). He et al. developed a simulation experimental system for deep rock bursts to simulate the occurrence of rock bursts by loading or unloading in a certain direction under a true triaxial device, and detected the rock failure process using acoustic techniques (He et al., 2010; He et al., 2012). Du et al. conducted true triaxial unloading and local disturbance tests on three different rock samples and found that the disturbance direction has little influence on dynamic instability. When the value of the disturbance load reaches a certain threshold, rock burst damage can be induced (Du et al., 2016). Gong et al. used a large-scale true triaxial test system to conduct experimental research on three-dimensional caverns with prefabricated holes and developed a real-time video monitoring system to observe the occurrence of rock bursts in the wall of the hole (Gong et al., 2018). The above research has made significant progress in physical model testing under static-dynamic coupling loading. However, the dynamic load is mainly two-dimensional dynamic impact loads, which limits the understanding of dynamic instability in high-stress roadways induced by dynamic loads. Additionally, there are few monitoring methods, which hinders further revelation of the mechanism under dynamic disturbance and high static stress coupling.
The DIC technology can be utilized to analyze the rock failure process. Sutton et al. improved the theory related to digital image technology and applied this method to study the changes in the displacement field during crack propagation (Zhang et al., 2012). Many researchers use DIC technology to observe and analyze the rock failure process (Molina-Viedma et al., 2019; Li et al., 2020; Qi et al., 2022). Therefore, digital image technology can be employed to observe the fracture process of roadway surrounding rock under dynamic disturbances and analyze the deformation and failure mechanisms of surrounding rock under dynamic disturbance. In this paper, we focus on two key factors: high stress and dynamic disturbance. We analyze the dynamic instability of a large-scale physical model of deep roadway surrounding rocks based on DIC technology and study the dynamic response and fracture characteristics of deep roadway surrounding rocks.
To study the dynamic instability and failure mechanisms of deep roadways, we have developed a dynamic-static coupling loading test system to conduct large-scale physical model tests. The test system is shown in Figure 1. The loading system mainly consists of two parts: vertical stress and lateral stress loading systems. This system can apply active loads in both vertical and horizontal directions on the specimen, with the maximum loading stress reaching 10 MPa.
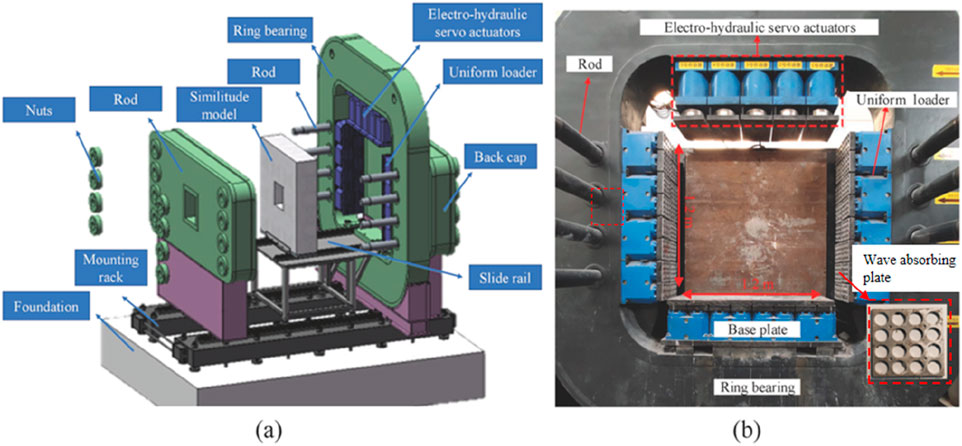
Figure 1. Model test system for dynamic and static combined loading of deep roadway: (A) Test system schematic, (B) Test system physical picture.
The loading system comprises a uniform loading mechanism, an electro-hydraulic servo actuator, a servo oil pump system, and a multi-channel control system. The upper load is applied through a dual-mode control system that combines pressure and displacement control. The system achieves a displacement control accuracy of 0.01 mm and a minimum loading speed of 0.01 mm/s. Lateral loading is regulated by an independent servo pressure system, capable of realizing arbitrary gradient loading. To effectively mitigate the reflected wave generated by the explosion shock wave at the model boundary, 5 mm thick aluminum alloy wave-absorbing plates are positioned on the loading surfaces (Figure 1B).
The simulation project of the physical model test is the coal deep roadway in Shandong Province, China. We use fine sand strata from the roadway as the main body of equivalent materials configuration. The section of the roadway is in the shape of circular arches and straight walls (Figure 2A). The radius of the semi circular arch of the roadway is 2700 mm, the height of the straight wall is 1350 mm, and the width of the roadway section is 5400 mm. The density of the fine sand layer is 2,569 kg/m3, the compressive strength is 78.15 MPa, the elastic modulus is 16.68GPa, and the internal friction angle and cohesion are 6.4 MPa and 33°, respectively. The horizontal principal stress and vertical principal stress of the deep roadway are 33.4 MPa and 20MPa, respectively.
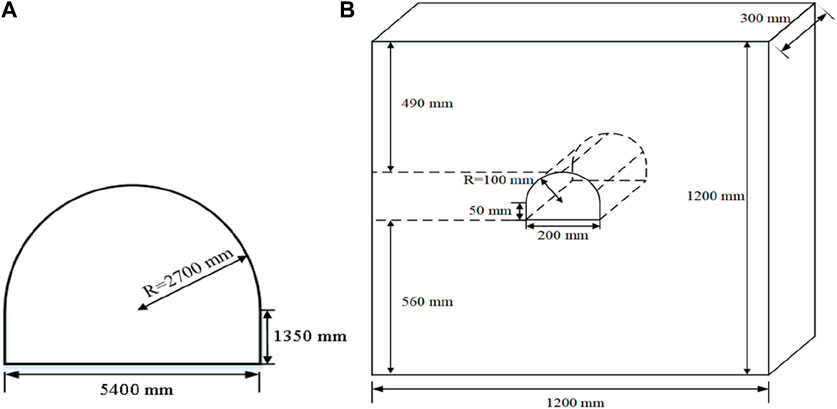
Figure 2. Real and model roadway section size. (A) Real raodway section sizes. (B) Physical model roadway sizes.
Based on the similarity principle, the geometric similarity ratio and stress similarity ratio of the physical model are 0.037 and 0.025, respectively. Using sands and talc powders as aggregates and cement as cementitious materials, five different ratios of similar materials are set up to simulate the surrounding rock, as shown in Table 1. We have made the axial compression specimens, brazilian split specimens and shear specimens with the similar materials to test the compressive strength σc and elastic modulus E (Figures 3A,B), tensile strength σt (Figure 3C), cohesion C and internal friction angle φ (Figure 3D).
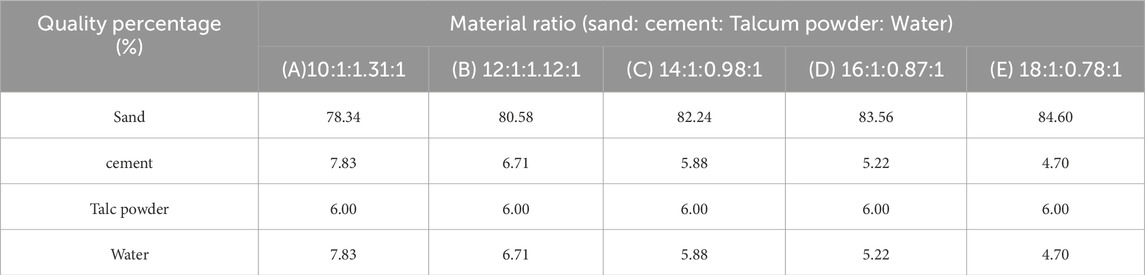
Table 1. Quality percentage of each component with different ratio.
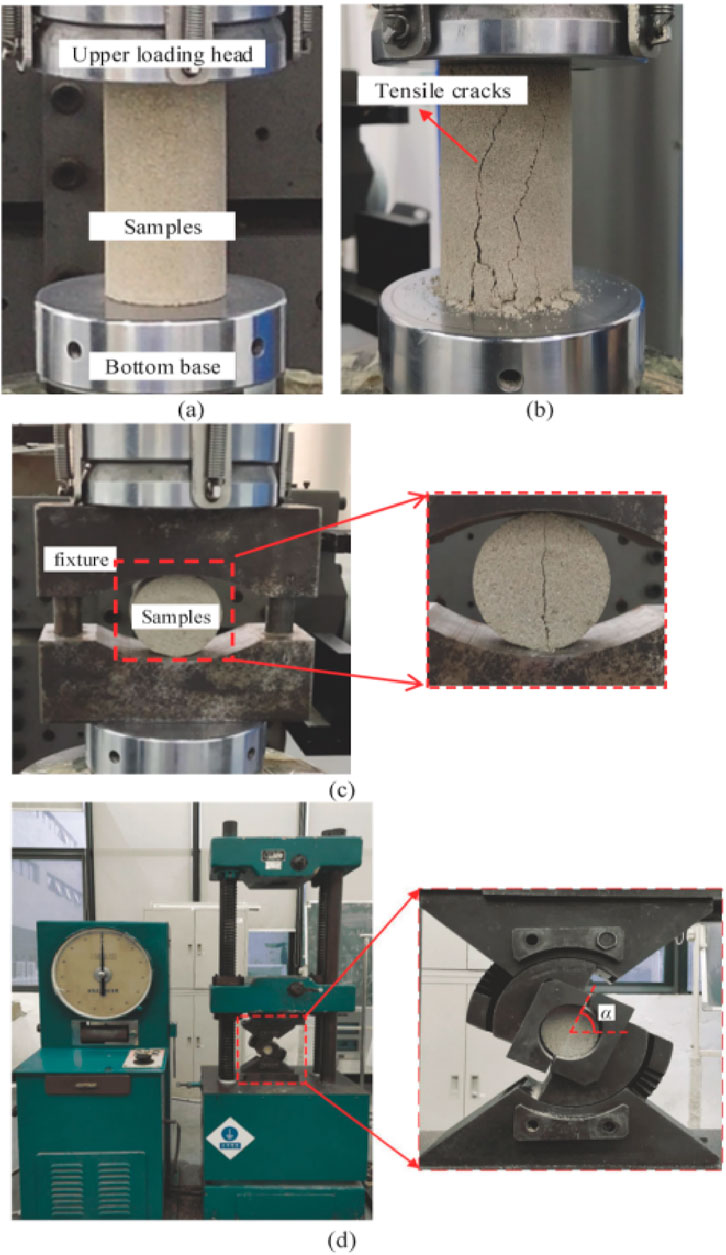
Figure 3. Physical mechanics property tests: (A) Uniaxial compression sample, (B) Crack propagation, (C) Brazilian splitting tests, (D) Wedge torsional shear specimen.
To reduce data discreteness, three samples are poured for each ratio of similar materials. Select samples for each ratio and draw stress-strain curves as shown in Figure 4. As the percentage of sand increases, the peak load of the samples gradually decreases (Figure 4A), and the tensile strength of the samples also gradually decreases (Figure 4B). Calculate the average of the mechanical parameters for the three samples under the same ratios, as shown in Table 2. The density of the samples in different groups is similar, ranging from 1728 to 1740 kg/m³. According to the similarity theory, the required uniaxial compressive strength and elastic modulus of the material should be 1.95 MPa and 0.42 GPa, respectively. Compared with the data in Table 2, the B group samples with a material ratio of 12:1:1.12:1 are the closest. The mixture ratio of the physical model samples is sand: cement: talcum powder:water = 12:1:1.12:1.
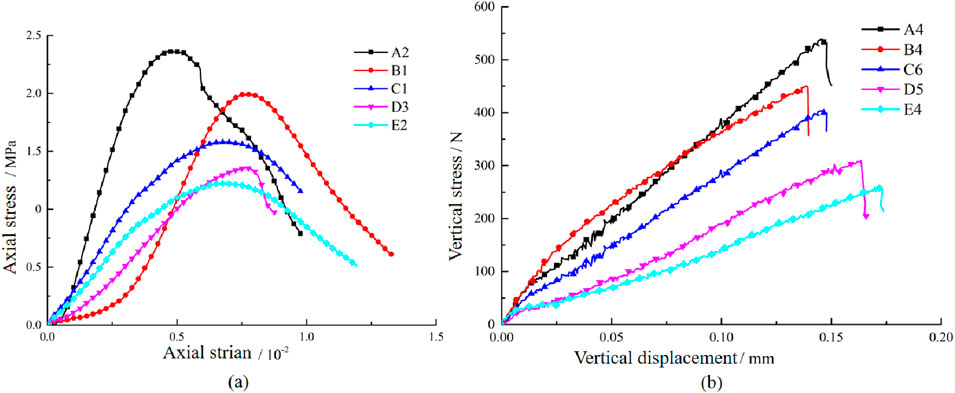
Figure 4. Mechanical curves of similar material specimens. (A) Stress-strain curve. (B) load-displacement curve.
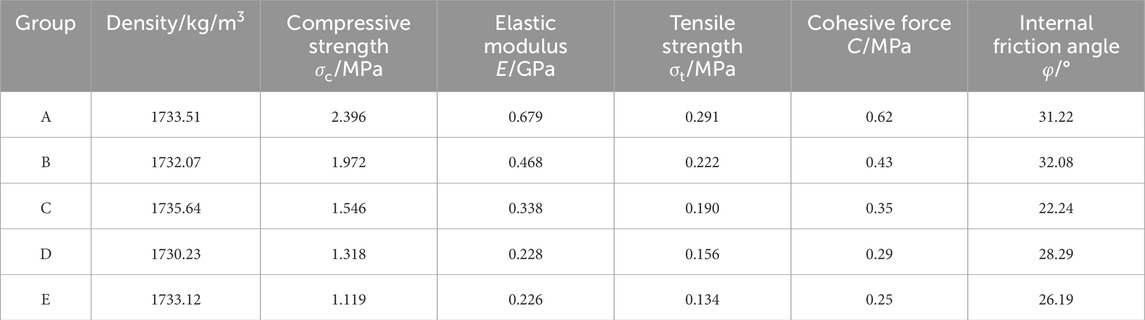
Table 2. Physical and mechanical parameters of similar materials with different proportions.
The dimensions of the roadway model are shown in Figure 1B (1,200 mm in length, 1,200 mm in height, and 300 mm in width). During the preparation process of the physical model, weigh the river sand, talcum powder, cement, and water according to the similar proportions. Put the river sand, talcum powder, and dry cement into the mixing basin and mix them evenly. Then, pour a small amount of the weighed water into the mixing materials. The similar materials are loaded into the molds in four layers, and each layer is compacted within the mold. After the sample is made, it is placed at room temperature for 24 h. When the sample is basically formed, remove the surrounding molds and allow it to cure at room temperature for 14 days.
After the physical model specimen is made, it is first subjected to static loading. The deep tunnel is located is subjected to a horizontal principal stress of 33.4 MPa and a vertical principal stress of 20 MPa, with the maximum horizontal principal stress being 1.5 to 1.8 times the vertical stress. According to the principle of stress similarity, the initial boundary stress conditions for the physical model test are calculated as horizontal initial stress of 0.84 MPa and vertical initial stress of 0.5 MPa (Figure 5A). When the confining pressure is applied, an explosive load is also applied to provide dynamic disturbance, which can induce dynamic instability in the surrounding rocks. The disturbance source is selected at a position outside 4 times the diameter of the roadway. The design position of the disturbance source is shown in Figure 5B. During the dynamic loading process, RDX (Hesogen) detonating cord is used as the disturbance source and is detonated by a detonator (Table 3). Since the disturbance loading tests are conducted four times under different dynamic disturbance energies, the corresponding simulation target value can be set by controlling the length of the detonating cord (Figure 6). During the installation process, the detonating cords and detonators are bound together and placed in the pre-cut hole slot. To study the influence of disturbance load on deep roadways, four dynamic disturbances (n = 1, 2, 3, 4) are carried out, with explosive charges of 3 g TNT, 6 g TNT, 9 g TNT, and 15 g TNT respectively for each disturbance.
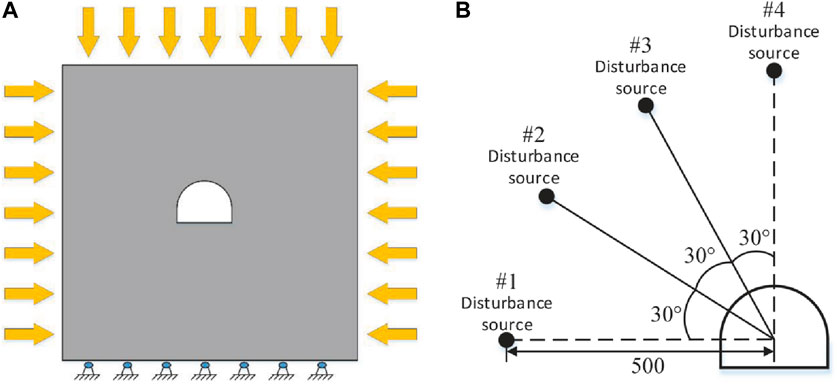
Figure 5. Loading method: (A) static loading, (B) dynamic disturbance loading.

Figure 6. Disturbance device: (A) detonating cord and detectors, (B) detonation control equipment.

Table 3. Basic properties of hesogen.
The XTDIC three-dimensional digital speckle strain measurement system is used in the test, providing 18 deformation strain calculation functions (Figure 7). The high-speed dynamic analysis system employs a 12-bit SR-CMOS image sensor, with a resolution of 2048 × 2048 and an acquisition rate of 1,000 frames per second. The camera’s frame frequency range spans from 0 to 50,000 FPS. The maximum measurement range can reach several tens of meters, and the strain measurement accuracy covers the range from 0.01% to 1,000%.
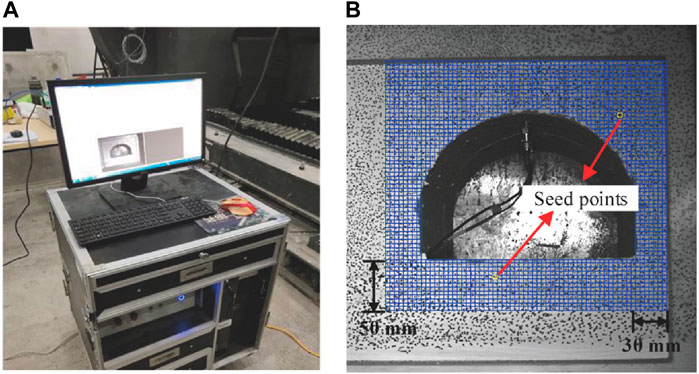
Figure 7. XTDIC digital image correlation system: (A) DIC monitoring system, (B) DIC software analysis system.
Figure 7B shows the analysis areas in the model test. In this figure, the blue grids represent the speckle areas, while the yellow grid points are the seed points. The monitoring range of the DIC system extends 30 mm from the left and right sides of the roadway, and 50 mm from the floor and roof.
The analysis process is as follows: (1) Create the speckle area in the collection image, and set the speckle size as 10 and the step length as 20; (2) Create seed points in the analysis area and make them cover all the calculated region; (3) Carry out calculation and analyze the evolution process of displacement and strain fields.
We select the typical displacement field of the roadway after the first dynamic disturbance loading (N = 1), as shown in Figure 8. Under the left disturbance loading (#1), both sides of the roadway move to the right. The left side displacement of the roadway is relatively larger, which is due to the attenuation of the strength and energy of stress waves during stress wave propagation. The roadway roof moves upward, and the roadway floor moves downward during the disturbance of dynamic loading. The displacement distribution program of the roadway exhibits a characteristic of layering, which conforms to the diffusion effect of spherical waves and has a high consistency with the displacement field distribution of surrounding rock in deep roadways under actual dynamic disturbance. Therefore, the analysis results based on DIC technology are highly reliable.
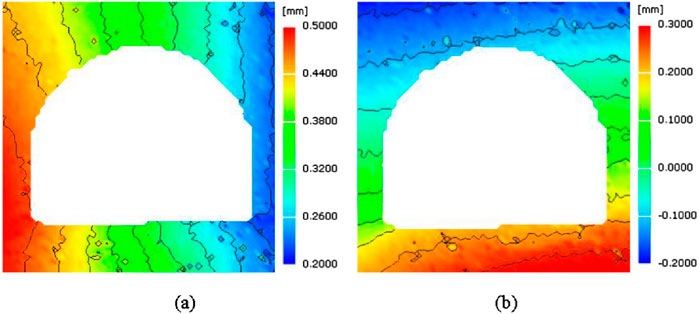
Figure 8. The distribution of roadway displacement field after the first disturbance: (A) displacement in X direction, (B) displacement in Y direction.
Figure 9 illustrates the relative displacements of the roadway roof and floor in the Y direction under different dynamic disturbances. The relative displacements of the roadway’s roof and floor exhibit obvious fluctuations. The relative displacements of the roadway’s roof and floor reach their peak values during the loading period of 8 ms–10 ms. Under the first two disturbances (#1, #2), the relative displacement of the roadway’s roof and floor first increases to a positive peak value. Conversely, under the latter two disturbances (#3, #4), the relative displacement decreases to a negative peak.
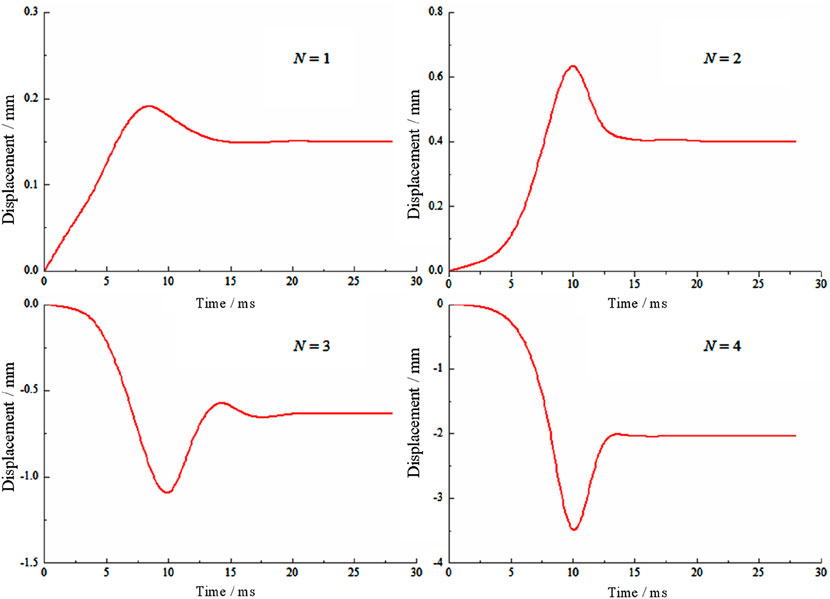
Figure 9. Relative displacement of roadway roof and floor under different disturbance intensifies and positions.
When the disturbance sources (#1, #2) are located on the side of the roadway, the explosion stress waves transmit from the side sections to the roof and floor of the roadway. Consequently, the roof and floor of the roadway are subjected to compressive stress in the Y direction. Therefore, during the first two disturbances, the relative displacement of the roadway’s roof and floor increases. When the disturbance sources (#3, #4) are located in the upper part of the roadway, the stress wave generated by the explosion first transmits to the roadway roof and then to the two sides. As a result, the relative distance between the roof and the floor decreases significantly in the Y direction. With the increase in disturbance intensity, the peak values of the relative displacement of the roadway’s roof and floor increase significantly.
Figure 10 depicts the relative displacement curve of the two sides of the roadway under different dynamic disturbances. The disturbance sources (#1, #2, #3) are located in the left part of the roadway, causing the roadway wall to be subjected to a compressive stress wave in the X direction. This results in the two sides of the roadway moving to the right. With the increase in disturbance intensity, the relative displacement peak value on both sides increases rapidly. During the fourth dynamic disturbance, when the disturbance source is above the roadway, the roadway is subjected to compressive stress in the Y direction. Additionally, the stress on the two sides increases in the X direction, leading to an increase in the relative displacement of the two sides of the roadway.

Figure 10. Relative displacement of two sides of roadway under different disturbance intensifies and positions.
The change in disturbance position and intensity has a significant impact on the relative displacement and dynamic instability failure characteristics of the roadway. When the disturbance sources are located at the side of the roadway, stress waves are transmitted from the side to the roof. The roof and floor of the roadway are subjected to compressive stress in the Y direction, leading to an increase in the relative displacement of the roof and floor under the influence of the first two disturbances. There are obvious tensile cracks on the left side of the roadway and spalling on the right side, as shown in Figure 11. When the disturbance sources are located above the roadway, the stress wave is first transmitted to the roadway roof and then to the two sides, causing a large number of rock fragments to appear around the roadway and large rock blocks to fall off the roof and side walls.
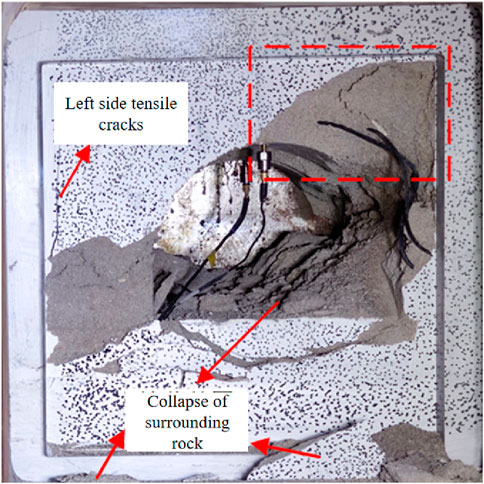
Figure 11. Instability characteristics of roadway after dynamic disturbance.
Therefore, the stress states of the surrounding rock change under different disturbance positions and intensities, changing the displacement and dynamic failure process of the surrounding rocks in deep roadways. Especially with the increase in disturbance intensity, the displacement of the surrounding rocks rapidly increases, resulting in the sudden release of a large amount of accumulated elastic energy. This can cause the collapse and ejection of the surrounding rocks.
Under high-ground stress conditions, the surrounding rocks of deep roadways develop damaged areas, leading to crack propagation and stress concentration in those areas. The cracks can extend further under dynamic disturbance, resulting in the dynamic failure of the surrounding rock. The failure and instability process of surrounding rocks in roadways under different dynamic disturbance positions and intensities is shown in Figures 12–15.
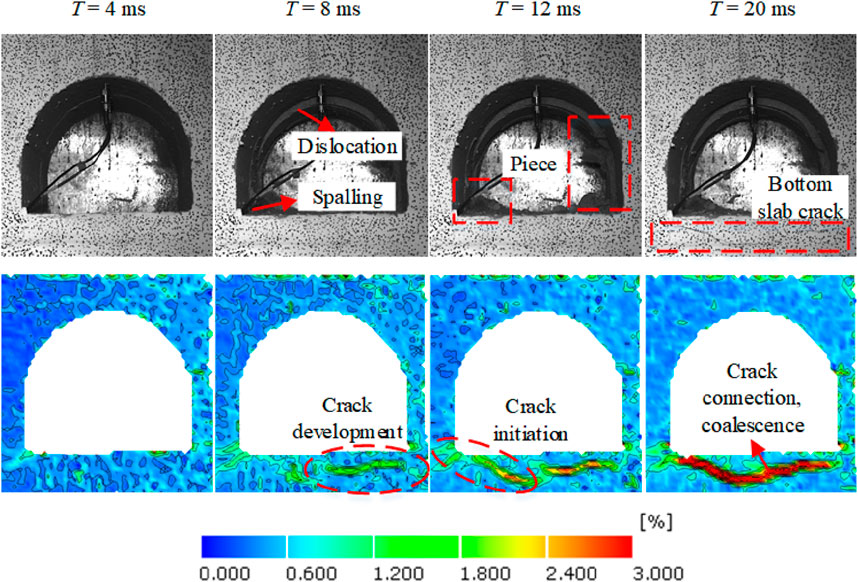
Figure 12. Evolution characteristics of strain field of roadway surrounding rock under the first disturbance.
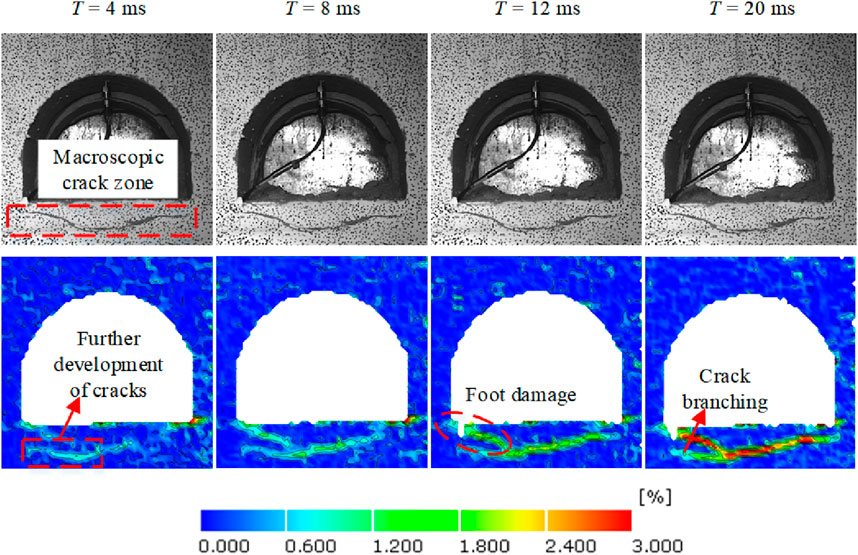
Figure 13. Evolution characteristics of strain field of roadway surrounding rock under the second disturbance.
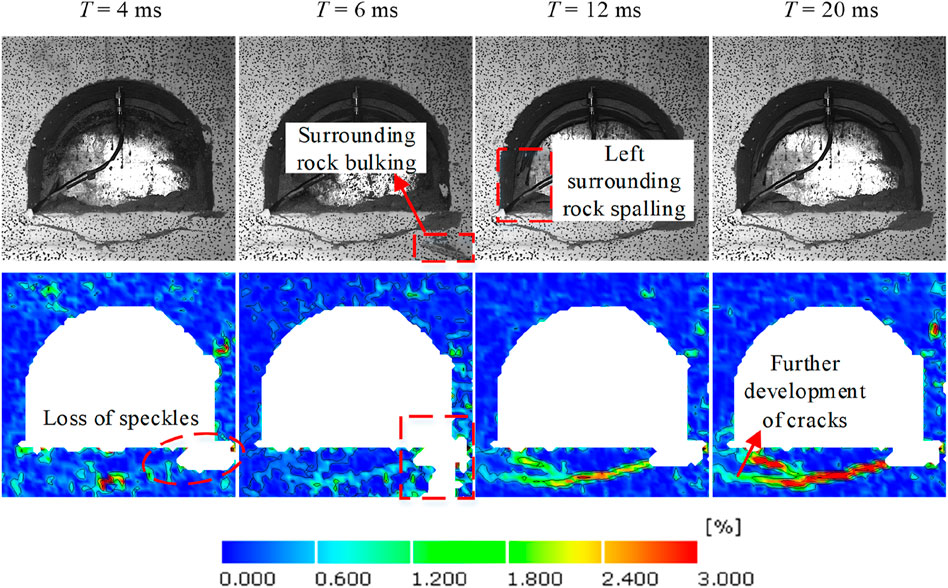
Figure 14. Evolution characteristics of strain field in surrounding rock of roadway under the third disturbance.
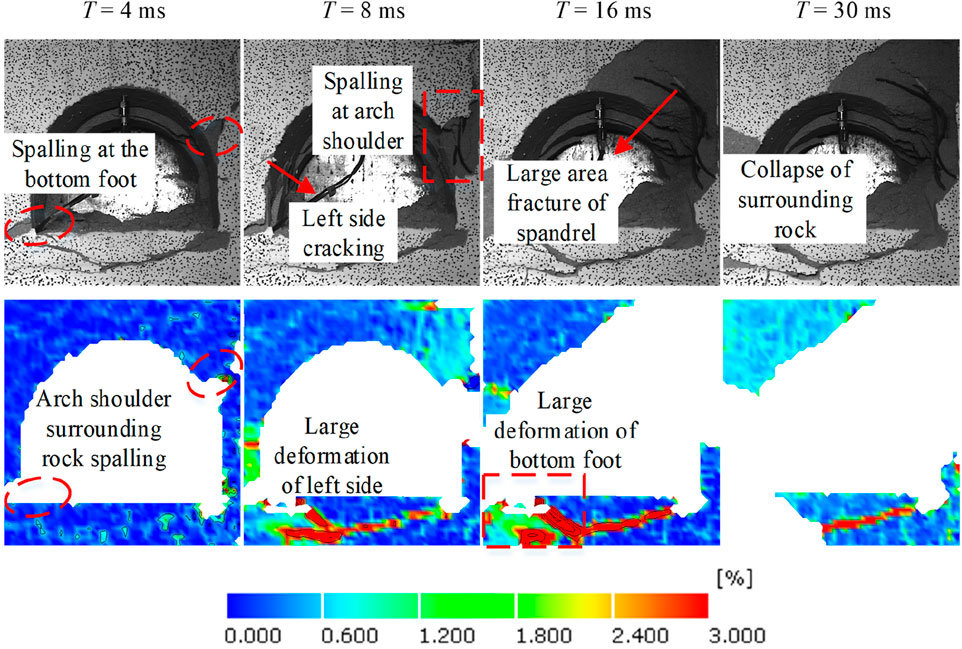
Figure 15. Evolution characteristics of strain field in surrounding rock of roadway under the fourth disturbance.
To reflect the dynamic evolution process of high ground stress roadways under different disturbance intensities and positions, we utilize Digital Image Correlation (DIC) technology to calculate the surface strain field of the surrounding rock, and select the typical maximum strain field cloud under different disturbance loads. Stress concentration areas appear at the arch crown, arch bottom, and arch shoulder positions of the roadway under high ground stress, due to which these areas suffer from damage, causing crack initiation. Under the first disturbance loading (#1) on the left side of the roadway, the evolution process of the maximum principal strain cloud is shown in Figure 12. With the propagation of stress waves, the initial cracks further extend under dynamic disturbance. The central position of the roadway roof experiences a displacement at 8 ms. A small portion of the surrounding rocks breaks off and falls into the roadway, new cracks begin to form in the roadway floor, and the spalling phenomenon of surrounding rocks also occurs on the right side of the roadway. Finally, the roadway is basically stable at 20 ms, and there are obvious macro cracks on the roadway floor, and the two cracks on the roadway floor propagate and merge into one. Under the second disturbance, the disturbance intensity increases, leading to higher stress concentration areas and strain values. The cracks in the roadway floor propagate further, and the failure of roadway surrounding rocks mainly occurs near the floor (Figure 13).
With the increase in disturbance intensity and the change of disturbance position, the evolution process of the maximum principal strain field in the roadway surrounding rock under such disturbances is shown in Figures 14, 15. The laws governing the fracture process and strain evolution indicate that an increase in disturbance intensity promotes crack propagation and coalescence, especially in stress-concentration areas of roadways. Some surrounding rock fragments are ejected and break off on the right side of the roadway. In addition, during the third disturbance, the original cracks at the roadway floor further propagate and coalesce with cracks on the left side of the roadway (Figure 14).
Under high-ground stress conditions, stress concentration is prone to occur in the arch shoulder and arch bottom of the roadway. When the source of dynamic disturbance shifts from the side to the arch, it becomes easier to cause fracture damage along the stress concentration zones in the arch shoulder and arch bottom, leading to instability and failure of the roadway. The fourth disturbance source is located directly above the roadway (Figure 15). During the disturbance loading, significant deformation occurs in the arch bottom and arch shoulder of the roadway, causing some rock to peel off. As the stress wave propagates, the deformation further increases, ultimately leading to the collapse of the surrounding rocks. Due to the high intensity of the dynamic disturbance, the surrounding rock of the roadway becomes unstable within a short period under the fourth dynamic disturbance, resulting in serious failure in the roadway.
Through four cycles of dynamic disturbances, it is observed that as the number and intensity of the disturbances increase, the number of cracks and the extent of damaged areas in the surrounding rock of the roadway also increase. Multiple fragments of the roadway surrounding rock appear to peel off, and the ejection of rock fragments can be observed. Additionally, the failure of the roadway occurs suddenly.
In this study, we design a model test system for dynamic and static coupling loading and conduct large-scale physical model tests on the dynamic instability of surrounding rock under high in-suit stress and dynamic disturbance. The dynamic fracture process of deep roadway surrounding rocks is analyzed under different disturbance intensities and positions.
(1) The large-scale physical model test method and similar materials for physical models of deep roadways under dynamic disturbance are designed. An improved deep roadway dynamic and static combination loading model test system are established to achieve dynamic instability and disaster simulation of deep roadway surrounding rock and the dynamic load disturbances are provided by the detonator and detonating cord.
(2) Under high-ground stress conditions, cracks initiate in the stress concentration zones of deep roadways, and cracks can further extend under dynamic disturbance, which promotes the dynamic failure of the surrounding rock. With the increase in disturbance intensities, the displacement and strain of the stress concentration zones in surrounding rocks rapidly increase, and a large amount of accumulated elastic energy is instantly released, which can cause the collapse of the surrounding rocks.
(3) The location of dynamic disturbances influences the failure process of surrounding rock in deep roadways. Under high-ground stress conditions, stress concentration is prone to occur in the arch shoulder and arch bottom of the roadway. When the source of dynamic disturbance changes from the side to the arch, it is easier to cause fracture damage along the stress concentration zone in the arch shoulder and arch bottom, leading to instability and failure of the roadway.
The original contributions presented in the study are included in the article/supplementary material, further inquiries can be directed to the corresponding authors.
TZ: Data curation, Funding acquisition, Investigation, Writing–review and editing, Resources. YX: Data curation, Investigation, Conceptualization, Methodology, Writing–original draft. CW: Conceptualization, Data curation, Investigation, Methodology, Writing–original draft, Formal Analysis, Funding acquisition, Software, Validation, Visualization, Writing–review and editing. HS: Methodology, Supervision, Writing–review and editing. YF: Formal Analysis, Investigation, Software, Writing–review and editing. LY: Conceptualization, Investigation, Methodology, Supervision, Writing–review and editing.
The author(s) declare that financial support was received for the research, authorship, and/or publication of this article. This work is financially supported by the Natural Science Foundation of Jiangsu Province (BK20241660), Chinese Postdoctoral Science Foundation (2023M733772), Jiangsu Funding Program for Excellent Postdoctoral Talent (2023ZB847), the Fundamental Research Funds for the Central Universities (2023QN1064), and the National Natural Science Foundation of China (52274100).
The authors declare that the research was conducted in the absence of any commercial or financial relationships that could be construed as a potential conflict of interest.
The author(s) declare that no Generative AI was used in the creation of this manuscript.
All claims expressed in this article are solely those of the authors and do not necessarily represent those of their affiliated organizations, or those of the publisher, the editors and the reviewers. Any product that may be evaluated in this article, or claim that may be made by its manufacturer, is not guaranteed or endorsed by the publisher.
Ameri, B., Taheri-Behrooz, F., and Aliha, M. R. M. (2020). Fracture loads prediction of the modified 3D-printed ABS specimens under mixed-mode I/II loading. Eng. Fract. Mech. 235, 107181. doi:10.1016/j.engfracmech.2020.107181
Cai, M., Kaiser, P. K., Suorineni, F., and Su, K. (2007). A study on the dynamic behavior of the Meuse/Haute-Marne argillite. Phys. and Chem. Earth 32, 907–916. doi:10.1016/j.pce.2006.03.007
Chen, M., Lu, W. B., Yan, P., and Hu, Y. G. (2016). Blasting excavation induced damage of surrounding rock masses in deep-buried tunnels. KSCE J. Civ. Eng. 20, 933–942. doi:10.1007/s12205-015-0480-3
Du, K., Tao, M., Li, X. B., and Zhou, J. (2016). Experimental study of slabbing and rockburst induced by true-triaxial unloading and local dynamic disturbance. Rock Mech. Rock Eng. 49, 3437–3453. doi:10.1007/s00603-016-0990-4
Gong, F. Q., Si, X. F., Li, X. B., and Wang, Y. S. (2018). Experimental investigation of strain rockburst in circular caverns under deep three-dimensional high-stress conditions. Rock Mech. Rock Eng. 52, 1459–1474. doi:10.1007/s00603-018-1660-5
He, M., Xia, H., Jia, X., Gong, W., Fei, Z., and Liang, K. (2012). Studies on classification, criteria and control of rockbursts. J. Rock Mech. Geotechnical Eng. 4, 97–114. doi:10.3724/sp.j.1235.2012.00097
He, M. C., Miao, J. L., and Feng, J. L. (2010). Rock burst process of limestone and its acoustic emission characteristics under true-triaxial unloading conditions. Int. J. Rock Mech. Min. Sci. 47, 286–298. doi:10.1016/j.ijrmms.2009.09.003
He, M. C., Zhao, F., Cai, M., and Du, S. (2015). A novel experimental technique to simulate pillar burst in laboratory. Rock Mech. Rock Eng. 48, 1833–1848. doi:10.1007/s00603-014-0687-5
Huang, L. Z., Bohne, R. A., Bruland, A., Jakobsen, P. D., and Lohne, J. (2015). Environmental impact of drill and blast tunnelling: life cycle assessment. J. Clean. Prod. 86, 110–117. doi:10.1016/j.jclepro.2014.08.083
Jia, L. C., Chen, M., Zhang, W., Xu, T., Zhou, Y., Hou, B., et al. (2013). Experimental study and numerical modeling of brittle fracture of carbonate rock under uniaxial compression. Mech. Res. Commun. 50, 58–62. doi:10.1016/j.mechrescom.2013.04.002
Li, S., Li, T., Wang, G., and Bai, S. (2007). CT real-time scanning tests on rock specimens with artificial initial crack under uniaxial conditions. Chin. J. Rock Mech. Eng. 26, 484–492. doi:10.3321/j.issn:1000-6915.2007.03.007
Li, X. L., Chen, S. J., Wang, S., Zhao, M., and Liu, H. (2021). Study on in situ stress distribution law of the deep mine taking Linyi Mining area as an example. Adv. Mater. Sci. Eng. 4, 5594181. doi:10.1155/2021/5594181
Li, Y., Gao, C. M., Li, Q., Wu, Q. Q., and Meng, W. J. (2020). Failure evolution law of reinforced anchor system under pullout load based on DIC. Adv. Civ. Eng. 12, 3340687. doi:10.1155/2020/6640687
Liu, H. Y., Zhang, B. Y., Li, X. L., Liu, C. W., Wang, C., Wang, F., et al. (2022). Research on roof damage mechanism and control technology of gob-side entry retaining under close distance gob. Eng. Fail. Anal. 138, 106331. doi:10.1016/j.engfailanal.2022.106331
Liu, K., Zhao, J., Wu, G., Maksimenko, A., Haque, A., and Zhang, Q. B. (2020). Dynamic strength and failure modes of sandstone under biaxial compression. Int. J. Rock Mech. Min. Sci. 128, 104260. doi:10.1016/j.ijrmms.2020.104260
Liu Sm, S. M., Li, X. L., Wang, D. K., and Zhang, D. M. (2020). Investigations on the mechanism of the microstructural evolution of different coal ranks under liquid nitrogen cold soaking. Energy Sources, Part A Recovery, Util. Environ. Eff. 10, 2596–2612. doi:10.1080/15567036.2020.1841856
Miao, S. T., Pan, P. Z., Zhao, S. K., Han, J., and Konicek, P. (2021). A new DIC-based method to identify the crack mechanism and applications in fracture analysis of red sandstone containing a single flaw. Rock Mech. Rock Eng. 54, 3847–3871. doi:10.1007/s00603-021-02472-5
Molina-Viedma, Á. J., López-Alba, E., Felipe-Sesé, L., and Díaz, F. A. (2019). Operational deflection shape extraction from broadband events of an aircraft component using 3D-DIC in magnified images. Shock Vib. 4, 4039862. doi:10.1155/2019/4039862
Pan, P. Z., Miao, S., Wu, Z., Feng, X. T., and Shao, C. Y. (2020). Laboratory observation of spalling process induced by tangential stress concentration in hard rock tunnel. Int. J. Geomechanics 20, 04020011.1–04020011.15. doi:10.1061/(asce)gm.1943-5622.0001620
Qi, X. Y., Yang, Z., Wang, S. W., and Fu, P. (2022). Mechanical damage test and model study of layered composite rock based on acoustic emission and DIC characteristics. Shock Vib. 6, 1–17. doi:10.1155/2022/6568588
Šílený, J., and Milev, A. (2006). Seismic moment tensor resolution on a local scale: simulated rockburst and mine-induced seismic events in the kopanang gold mine, South Africa. Pure Appl. Geophys. 163, 1495–1513. doi:10.1007/s00024-006-0089-z
Wang, S., Li, X. L., and Qin, Q. Z. (2022). Study on surrounding rock control and support stability of Ultra-large height mining face. Energies 15, 186811. doi:10.3390/en15186811
Wei, C., Li, S. C., Zhang, B., Song, Y., Zhang, Yu., and Wang, X. (2023). Experimental and numerical investigation on crack propagation and coalescence in rock-like specimens with fluid-infiltrated parallel flaws. Rock Mech. Rock Eng. 56, 1995–2015. doi:10.1007/s00603-022-03143-9
Wei, C., Yu, L. Y., Geng, S. T., Yuan, Z. C., and Wang, Y. B. (2024). Experimental and numerical studies on propagation behavior between hydraulic fractures and pre-existing fractures under prepulse combined hydraulic fracturing. J. Rock Mech. Geotechnical Eng. doi:10.1016/j.jrmge.2024.05.062
Wei, C., Zhang, B., Li, S. C., Fan, Z. X., and Li, C. X. (2021). Interaction between hydraulic fracture and pre-existing fracture under pulse hydraulic fracturing. SPE Prod. and Operations 8, 553–571. doi:10.2118/205387-PA
Wu, J. Y., Jing, H. W., Gao, Y., Meng, Q. B., Yin, Q., and Du, Y. (2022). Effects of carbon nanotube dosage and aggregate size distribution on mechanical property and microstructure of cemented rockfill. Cem. Concr. Compos. 127, 104408. doi:10.1016/j.cemconcomp.2022.104408
Wu, J. Y., Jing, H. W., Yin, Q., Yu, L. Y., Meng, B., and Li, S. C. (2020). Strength prediction model considering material, ultrasonic and stress of cemented waste rock backfill for recycling gangue. J. Clean. Prod. 276, 123189. doi:10.1016/j.jclepro.2020.123189
Wu, J. Y., Wong, H. S., Zhang, H., Yin, Q., Jing, H. W., and Ma, D. (2024). Improvement of cemented rockfill by premixing low-alkalinity activator and fly ash for recycling gangue and partially replacing cement. Cem. Concr. Compos. 145, 105345. doi:10.1016/j.cemconcomp.2023.105345
Yu, L. Y., Fu, A. Q., Yin, Q., Jing, H. W., Zhang, T., and Qin, H. (2020). Dynamic fracturing properties of marble after being subjected to multiple impact loadings. Eng. Fract. Mech. 230, 106988. doi:10.1016/j.engfracmech.2020.106988
Yu, L. Y., Su, H. J., Jing, H. W., Zhang, Q., and Yang, E. (2017). Experimental study of the mechanical behavior of sandstone affected by blasting. Int. J. Rock Mech. and Min. Sci. 93, 234–241. doi:10.1016/j.ijrmms.2017.02.002
Zhang, C., Feng, X. T., Zhou, H., Qiu, S., and Wu, W. (2012). Case histories of four extremely intense rockbursts in deep tunnels. Rock. Mech. Rock. Eng. 45, 275–288. doi:10.1007/s00603-011-0218-6
Zhang, T., Yu, L. Y., Su, H. J., Zhang, Q., and Chai, S. B. (2022). Experimental and numerical investigations on the tensile mechanical behavior of marbles containing dynamic damage. Int. J. Min. Sci. Technol. 32, 89–102. doi:10.1016/j.ijmst.2021.08.002
Zhang, W., Hu, L., Yao, Z. B., Xiong, Y. R., Zhao, J., Ma, T., et al. (2024). In-situ and experimental investigations of the failure characteristics of surrounding rock through granites with biotite interlayers in a tunnel. Eng. Geol. 343, 107816. doi:10.1016/j.enggeo.2024.107816
Zhou, X. M., Wang, S., Li, X. L., Meng, J., Li, Z., Zhang, L., et al. (2022). Research on theory and technology of floor heave control in semicoal rock roadway: taking longhu coal mine in Qitaihe mining Area as an Example. Lithosphere 11, 3810988. doi:10.2113/2022/3810988
Keywords: deep high-stress roadway, dynamic-static coupling loading, rock-like materials, DIC analysis, instability mechanism
Citation: Zhang T, Xu Y, Wei C, Su H, Feng Y and Yu L (2025) The influence of disturbance location and intensity on the deformation and failure of deep roadway surrounding rocks. Front. Mater. 12:1550247. doi: 10.3389/fmats.2025.1550247
Received: 23 December 2024; Accepted: 20 January 2025;
Published: 11 February 2025.
Edited by:
Hao Shi, Anhui University of Science and Technology, ChinaReviewed by:
Xiancheng Mei, Chinese Academy of Sciences (CAS), ChinaCopyright © 2025 Zhang, Xu, Wei, Su, Feng and Yu. This is an open-access article distributed under the terms of the Creative Commons Attribution License (CC BY). The use, distribution or reproduction in other forums is permitted, provided the original author(s) and the copyright owner(s) are credited and that the original publication in this journal is cited, in accordance with accepted academic practice. No use, distribution or reproduction is permitted which does not comply with these terms.
*Correspondence: Chao Wei, Y2hhb3dlaUBjdW10LmVkdS5jbg==; Liyuan Yu, eXVsaXl1YW5AY3VtdC5lZHUuY24=
Disclaimer: All claims expressed in this article are solely those of the authors and do not necessarily represent those of their affiliated organizations, or those of the publisher, the editors and the reviewers. Any product that may be evaluated in this article or claim that may be made by its manufacturer is not guaranteed or endorsed by the publisher.
Research integrity at Frontiers
Learn more about the work of our research integrity team to safeguard the quality of each article we publish.