 Hao-Jing Ge1Yi-Han Bai1Hang Zhang1Hao-Ran Yuan1*
 Ze-Jie Zhu1*
 Pan Liu2*
 Yun-Xiong Zeng1Jiang-Ying Wang1
- 1School of Materials and Chemistry, China Jiliang University, Hangzhou, China
- 2Frontier Research Initiative, New Industry Creation Hatchery Center (NICHe), Tohoku University, Sendai, Miyagi, Japan
The effects of the real-time changes in the microenvironment within the crevice caused by the change in crevice size on the induction of crevice corrosion of 201 stainless steel (201-SS) in 1 M (pH = 4.00) NaCl solution were evaluated using conventional methods and scanning electrochemical microscopy (SECM) containing potentiometric probes. Results show that a decrease in pH and an increase in the Cl− concentration within the gap are the pivotal determinants of crevice corrosion initiation. A narrower crevice creates a more aggressive corrosive environment. After immersion for 48 h, the corresponding pH values at the mouths of crevice with widths of 100, 250, 400 and 550 μm dropped to 1.64, 2.26, 2.73 and 2.88, respectively. The crevice size affects the accumulation rate of erosive ions and the initiation time of pits corrosion within the crevice, through the volume and diffusion effect. The coupling effect of the decrease in pH value and the increase in concentration of chloride ions is the main driver for the negative shift of the open circuit potential (OCP) and corrosion potential of 201-SS.
1 Introduction
As a degradation mode of metallic materials under the influence of environmental elements, corrosion not only results in apparent financial losses but poses a disregarded threat to both life and productivity of human beings (Tang et al., 2024; Welikala et al., 2024; Liu et al., 2021; Li et al., 2025). Despite demanding challenges, long-term efforts have identified various well-known corrosion types already, while localized corrosion stands out among them due to its exceptional concealment and potentially huge destruction, making it still a hot target of investigations worldwide till now (Chen et al., 2025; Zhu et al., 2022; Torres et al., 2021; Li et al., 2022; Xu et al., 2022; Ha et al., 2024).
Crevice corrosion is one of the local deteriorations. A series of practical evidence reveal that limitation of transport process creates a distinction in the solution chemistry within and outside crevices. This differentiation is attributed to the unique occluded structure of the materials involved (Kamaraj and Erning, 2020; Hornus et al., 2019; Matsumura et al., 2022; Pickering, 1988). This process undoubtedly heightens the risk of local dissolution compared to uniform corrosion. Additionally, two speculative theories have been presented to artificially anticipate the corrosion tendencies, namely, IR drop theory and Critical Crevice Solution theory (CCST) (Aoyama and Kato, 2023; Li et al., 2017; Ding et al., 2021; Yeh et al., 2020; Yang et al., 2013; Shojaei et al., 2019; Ning et al., 2021; Bryant et al., 2014). For CCST model, changes in the electrochemical behavior are brought on by the alternation of solution chemistry (such as a drop in dissolved O2, enrichment of H+ and Cl− (Chen et al., 2016; Zhang et al., 2021; Luo et al., 2022; Hu et al., 2011; Jafarzadeh et al., 2022). This is regarded as the triggering core for corrosion. In terms of IR drop theory, it applies exclusively that crevice corrosion appears by the potential shift from passive to active state. The potential drop is known as the “IR drop”. It can be obtained by multiplying the electrolyte’s resistance and current (Shojaei et al., 2019). The potential change is obviously affected by the chemical composition within the gap, crevice gap, solution conductivity, etc (Xiao et al., 2018; Wang et al., 2016; Nose et al., 2020; Gilbert and Zhu, 2020). It has been documented that the disparity in chemical composition within the obstructed gap has significantly broadened the potential window for active corrosion to occur. To encapsulate, these studies concur that the change in ion concentration inside the narrow gap has an important impact on initiating the crevice corrosion.
Crevice geometry emerges as another critical factor that can significantly influence the progression of crevice corrosion (Ding et al., 2021; Luo et al., 2022; Xu et al., 2022). Many innovative works have emerged to investigate the link between crevice geometry and corrosion behavior. For instance, Xu and his team emphasized that the depolarization of dissolved oxygen in the gap of steel U75V was greatly controlled by the gap size based on a set of in situ self-assembled monitoring device (Xu et al., 2022). Similarly, Luo and colleagues revealed that crevice gap dimensions substantially affect the rate of solution acidification within the crevice and the initiation period of crevice corrosion utilizing a combination of electrochemical experiments and theoretical model (Luo et al., 2022). A multi-physics coupling model was created by Ding et al. to simulate the different stages of crevice corrosion of 304 stainless steel (Ding et al., 2021). Results demonstrated that the distribution patterns of pH values and chloride concentrations within the crevice were correlated with the dimensions of the gap. Varying gap sizes resulted in quite distinctly diverse corrosion behavior. It can be inferred that crevice geometry affects corrosion behavior by changing the solution chemistry inside the gap. The studies mentioned earlier have significantly deepened our understanding of crevice corrosion phenomena. The majority of research relied on numerical simulation. The large electrode size, which leads to low spatial resolution, fails to meet the demands for high-resolution tracking of ion dynamics within the microenvironment of a crevice. Meanwhile, simulation approaches often idealize the crevice corrosion process by assuming geometric characteristics. The resulting outcomes are subjective to some extent. Therefore, it is still important to better optimize the electrode size and determine the evolution of dominant elements from an experimental perspective. Our research team has designed a solid-state Pt/IrOx-pH and Ag/AgCl ultramicroelectrode (UME) for in situ pH and the chloride ion concentration monitoring over metal/solution interface using SECM (Zhu et al., 2018; Zhu et al., 2020; Zhang et al., 2024). Furthermore, leveraging the potentiometric mode of SECM, a submicron Pt/IrOx-pH UME with a precisely controllable diameter of approximately 1 μm has been created to examine the local radial pH distribution and its progression within the crevice (Bai et al., 2023). However, the relationship between crevice corrosion behavior, crevice geometry and real-time solution chemistry within the gap is not clear.
Stainless steel is most commonly used in industry, due to its outstanding mechanical properties and low cost. Nevertheless, stainless steel is susceptible to crevice corrosion. In the light of above, this study used a commercial 201 stainless steel (201-SS) as research object in this work. Meanwhile, a custom-designed high-resolution UME integrated with SECM potentiometric mode was used to evaluate the pH and chloride ion concentration in crevice of different sizes and explore their correlation with corrosion triggering.
2 Experimental approaches
2.1 Material preparation
Table 1 details the chemical composition (wt%) of the commercial 201-SS employed in this research. 201-SS were procured from Hongwang Stainless Steel (Foshan, China). The electrochemical test specimens, which were panel-cut, featured an exposed area of roughly 4 × 7 mm2 and were securely set in epoxy resin. Prior to utilization, the testing surfaces underwent a meticulous grinding process with silicon carbide papers of 300, 600, 800, 1,000, and 2000 grits. They were mirror polished using a 1 μm silica suspension, subjected to ultrasonic cleansing in ethanol, and ultimately dried using compressed air.

Table 1. Chemical composition of the studied 201-SS (wt%).
2.2 Design of device for crevice corrosion investigation
A schematic diagram of crevice setup and experimental apparatus is illustrated in Figure 1. A rectangular Polytetrafluoroethylene (PTFE) was sandwiched between the epoxy resin and glass plate to form a gap. Before the experiment, the crevice assemblies were securely fastened with threaded plastic bolts and nuts. Also, four holes were captured along the length of glass plate (Figure 1B). The reference electrode was inserted into one hole. The other three holes with a diameter of around 1.2 mm were located at different sites on the line, which correspond to the crevice’s opening, midpoint, and base. These holes are prepared for pH and the chloride ion concentration measurement during SECM test. Note that three plastic micro-rods were prepared in advance to plug the holes. The plastic micro-rod measuring the pH value (or the concentration of chloride ions) was removed, while the other two remained obstructing the holes. To remove air bubbles, electrolyte was injected into the gap using a micro-syringe prior to the test.
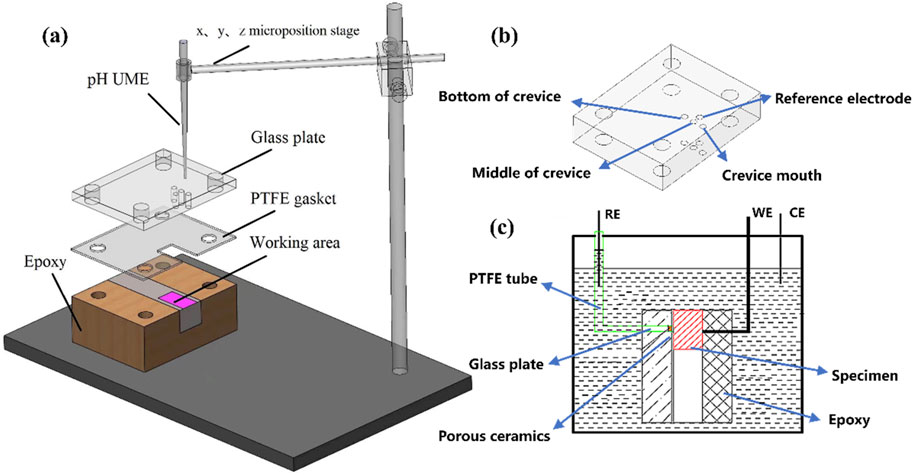
Figure 1. Schematic representation of a self-designed apparatus for crevice corrosion monitoring showing: (A) Details of the crevice configuration, (B) enlarged view of the glass plate and (C) an illustrative diagram of the electrochemical measurement setup.
Structures with varying gap widths were obtained via changing the thickness of PTFE gasket. As exhibited in Figure 2, four gap widths corresponding to 100 μm, 250 μm, 400 μm and 550 μm were generated in advance. To guarantee the validity, multiple gaskets and different devices were used for multiple combinations throughout assembly process. Each gap width was observed and measured using an optical microscope (OM, M230-HD228S, AOSW, China) before the test. The gap size of each assembled structure is displayed in Figure 2. It was discovered that the crevice corrosion constructed structure’s actual gaps were 101.30 μm, 258.47 μm, 400.74 μm and 550.47 μm, respectively. The minor errors were probably caused by the bolts and nuts’ assembly procedure.
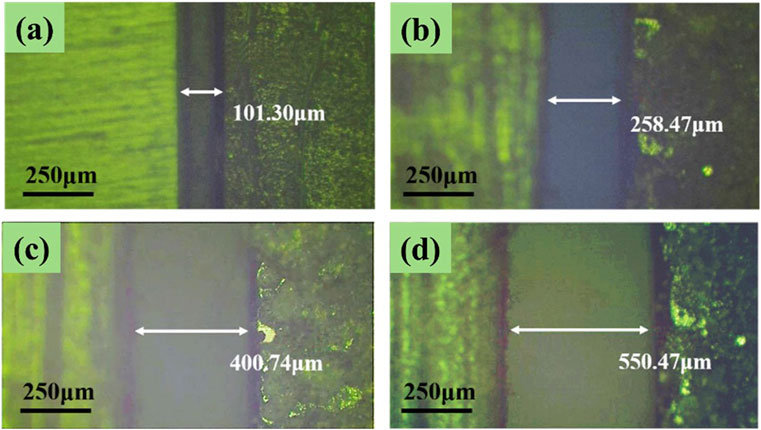
Figure 2. Optical images of samples with different gap dimensions in the current work: (A) 100 μm; (B) 250 μm; (C) 400 μm; (D) 550 μm.
2.3 Electrochemical measurements
The OCP and polarization curve measurements were performed using an electrochemical workstation (CHI920D, Chenhua, China) at room temperature. During test, 201-SS electrode was served as the working electrode (WE1), a platinum wire acted as the counter electrode, and a homemade Ag/AgCl electrode was used as reference electrode (RE1): an Ag/AgCl electrode was put into a PTFE tube brimming with 3 M KCl solution, the end of the tube was capped with a porous ceramic plug. All potentials measured during the test were referenced to an Ag/AgCl (3 M KCl) electrode. The OCP tests were carried out after immersion in solutions for 0.5, 1, 2, 4, 6, 8, 24 and 48 h. The polarization curve started after the OCP was stabilized (about 30 min, ∆OCP <10 mV) with a scan rate of 1 mV/s by positively scanning the potential from −0.2 VOCP to +0.35 VOCP. The setup and procedure for SECM test were described detail in our previous study (Bai et al., 2023; Zhu et al., 2024). In summary, a submicron Pt/IrOx-pH (with a radius of 690 nm) or Ag/AgCl (with a radius of 12.5 μm) UME prepared by us was served as the working electrode (WE2), a platinum wire functioned as the counter electrode, while an Ag/AgCl (3 M KCl) electrode acted as the reference electrode (RE2). A potentiometric mode of the SECM was selected to determine the pH and concentration of chloride ions distribution within the gap. The SECM cell configuration for microenvironment monitoring is shown in Figure 1C.
2.4 Characterization
The morphology of crevice corrosion at different positions with varying gap was observed in situ using a metallographic optical microscope (OM, M230-HD228S, AOSW, China). After immersion for 48 h, the corrosion device was retrieved, the plastic plate and PTFE gasket covering on the surface were carefully peeled off. A thorough elemental and compositional analysis of the corrosion products was performed using a high-resolution scanning electron microscope (SEM, JSM-7001F, JEOL, Japan) set at an acceleration voltage of 15 kV, integrated with energy-dispersive X-ray spectroscopy (EDS), employing a mapping technique at the same voltage for a comprehensive elemental analysis.
3 Results
3.1 OCP measurements
Figure 3A illustrates the temporal evolution of the OCP for a 201-SS electrode with a 100 μm gap after immersion in a 1 M NaCl solution. Evidently, the OCP progressively shifts to a more negative potential as the duration of immersion increases. Figure 3B presents the OCP variation for 201-SS electrodes with different gap widths in the same NaCl solution. A consistent trend in OCP variation is observed across electrodes with varying gap sizes: the potential shifts negatively and lowers with time. This trend is attributed to the reduction in the concentration of the cathodic reactants and the metal dissolution occurring within the crevice. The dissolution of metal generates metal cations, and their subsequent hydrolysis leads to the acidification of the electrolyte within the fissure. To maintain electroneutrality within the crevice, chloride ions from external environment migrate towards the interior of the crevice, resulting in an increasingly aggressive electrolyte environment. This is responsible for the negative OCP shift observed with extended exposure (Zhang et al., 2022; Li et al., 2016).
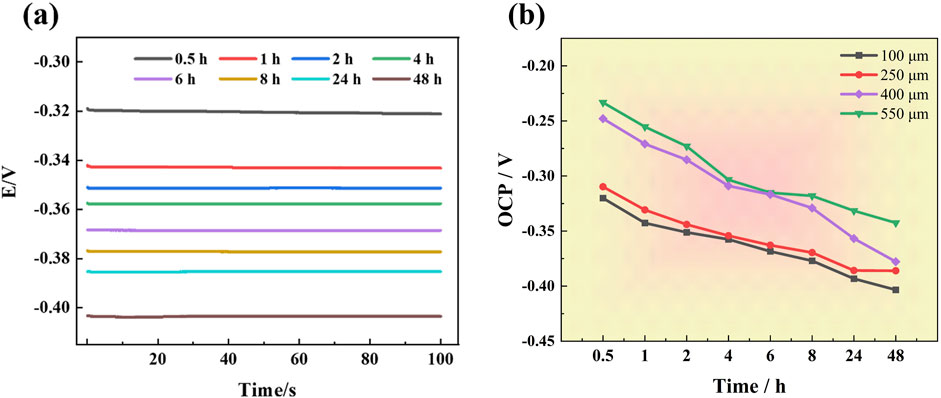
Figure 3. OCP variations over time in 1 M NaCl solution at room temperature: (A) OCP changes over times for the sample with a gap width of 100 μm, (B) OCP changes over time for samples with different gap widths.
Furthermore, the OCP exhibits noticeable changes in response to variations in gap size. The OCP for electrode with narrower gap is more negative compared to those with a wider gap, suggesting that a greater driving force for corrosion is established in crevices with smaller dimensions. It can be deduced that the corrosion propensity of stainless stee is influenced by the gap’s geometric features.
3.2 Polarization curves measurements
Figure 4 presents the polarization curves of 201-SS electrode with different gap widths. Meanwhile, key electrochemical parameters obtained by fitting are provided in Table 2. Observably, the four polarization curves exhibit a striking resemblance in shape. A distinct passivation region is observable for the four samples. As the crevice width diminishes, there is a marked and negative shift observed in the Ecorr values. This trend indicates that stainless steel with a larger gap possesses a reduced propensity for corrosion to take place. These results are in harmonious alignment with the observations from the OCP measurements.
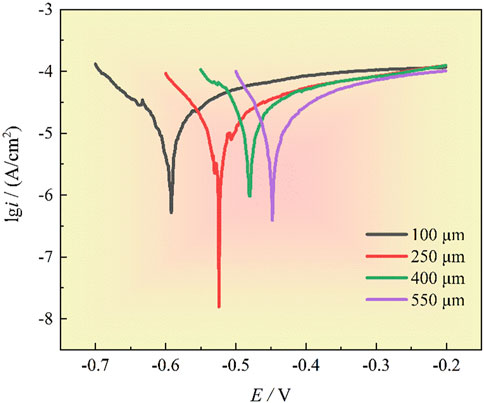
Figure 4. The polarization curves under different gap widths in 1 M NaCl solution at room temperature, scan rate is 1 mV/s.

Table 2. The corrosion potentials estimated from polarization data for 201-SS in 1 M NaCl solution (pH = 4.00) with different crevice width.
3.3 In-situ monitoring in gaps with different widths
3.3.1 pH distribution
Figure 5 illustrates the temporal pH variation at various positions within the crevice under different gap widths. A distinguished radial pH gradient is evident within the crevice for each slit width. The most pronounced pH drop is observed near the mouth of the gap, while the drop is less obvious at the midpoint of crevice. In comparison, the smallest pH decrease trend is monitored at the crevice base. This pH distribution is attributed to the fact that the net anodic metal dissolution and hydrolysis reactions occur predominantly near the gap mouth. In contrast, the pH decrease at the bottom and middle of the crevice is due to proton diffusion.
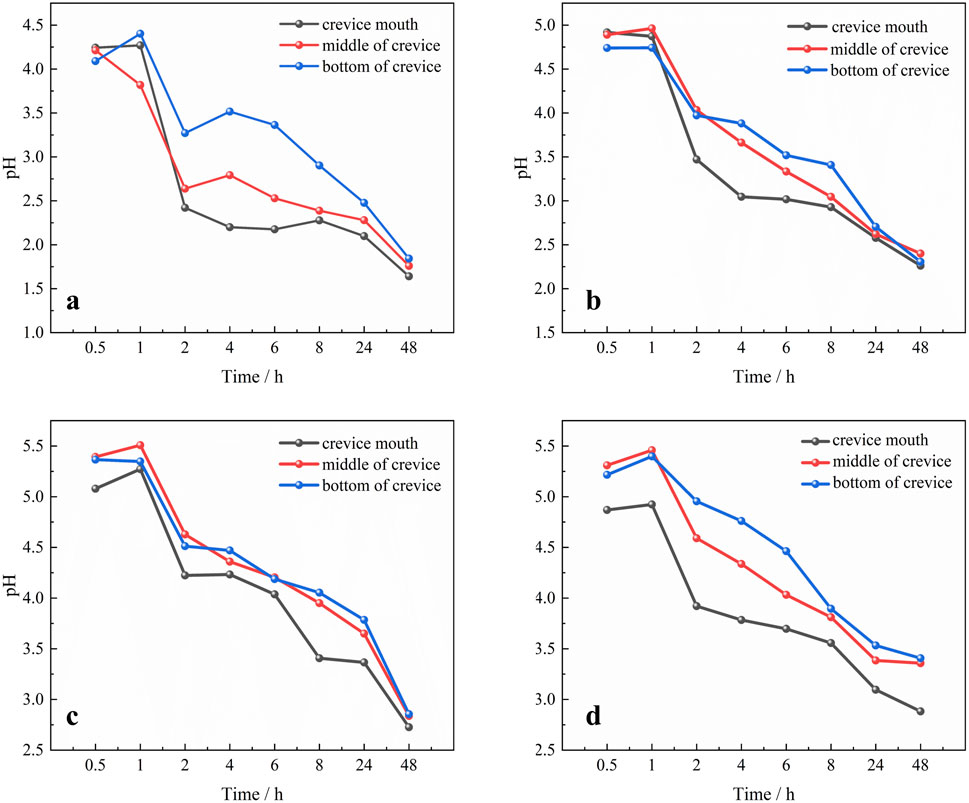
Figure 5. Time-dependent fluctuation of pH values of 201-SS at different locations under different gap widths: (A) 100 μm, (B) 250 μm, (C) 400 μm and (D) 550 μm.
During the immersion period, the dynamic evolution of pH at different locations within the crevice consistently follow a uniform trend across all crevice widths: it begins with a gradual increase, then the pH drops rapidly. As the duration of soaking increases, the rate of pH decrease slows down. Towards the end of the soaking period, the rate of pH drop accelerates again. The period from 0.5 to 1 h, a minor pH elevation was observed. This is believed to stem from reduction reactions involving oxygen or protons. The reactions involved are written as Equations 1, 2:
Subsequently, the pH value precipitously declined as the duration of immersion, signifying the initiation of crevice corrosion. The metal undergoes ongoing dissolution, ceaselessly releasing metal cations into the solution. Simultaneously, the hydrolysis of a portion of these cations leads to the continuous pH drop. As the soaking time increases, a notable portion of hydrogen ions (H+) are consumed by cathodic reduction, which in turn moderates the magnitude of the pH drop. Towards the end of the soaking period, the rate of pH decreases speeds up again, indicative of significant metal dissolution and the consequent generation of a substantial quantity of hydrogen ions (H+).
Although the pH variation trends within the crevice maintain a consistent profile regardless of gap width, there is a marked divergence in the intensity of these changes. Figure 6A illustrates the pH variation with time at the crevice opening for different gap widths. As the crevice width narrows, the pH value at the crevice opening decreases noticeably. Figure 6B presents the pH values at the crevice opening for different gap widths after 48 h immersion. A dotted line is plotted to display the trend of pH variation near the crevice opening. The individual data points in the dotted line graph represent the specific pH values after 48 h immersion for each gap width depicted in the bar chart. As depicted, the pH values at the openings with widths of 100 μm, 250 μm, 400 μm and 550 μm correspond to 1.64, 2.26, 2.73 and 2.88, respectively. There is a clear correlation between the crevice width and pH value: as the gap width decreases, the pH value drops. This implies that as the crevice width diminishes, a more corrosive environment is established.
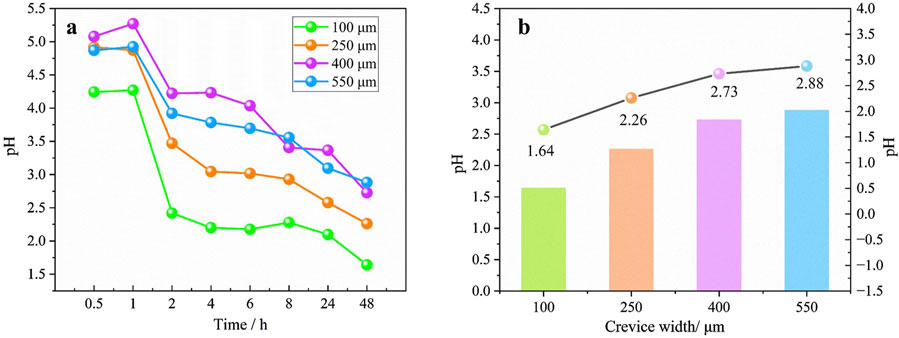
Figure 6. (A) pH variation with time and (B) the pH value after 48 h immersion at the crevice opening for different gap width.
3.3.2 Chloride ion concentration distribution
In addition to pH variations, the alterations in chloride ion concentration within the crevice are intrinsically linked to the initiation and progression of crevice corrosion. Given the heightened corrosion susceptibility at the gap opening, we specifically tracked the evolution of chloride concentration in this particular area. To achieve this, an all-solid-state Ag/AgCl microsensor was used to quantify chloride ions within the gap in real time, utilizing the potentiometric SECM technique.
Figure 7A presents the time-dependent fluctuations in chloride ion concentration at the crevice opening for different gap widths. It can be observed that the fluctuation of Cl− concentrations is relatively small in the first few hours under all four conditions, but a significant surge occurs thereafter. This is primarily due to the rate of metal dissolution within the crevice was quite minimal in the initial period of soaking. After 4 h (for the crevice width of 100 and 250 μm) or 8 h (for the crevice width of 400 μm) mark, the metal at the crevice opening underwent continuous dissolution. The unceasing generation of Fe2+ ions spurred the ongoing electromigration of Cl− ions. As a result, a discernible escalation in Cl− concentration is captured. In addition, the Cl− concentrations at the crevice opening gradually decline as the gap narrows. Figure 7B illustrates the Cl− concentration at the crevice openings after immersion for 48 h. Similarly, a dotted line is plotted to display the trend of Cl− concentrations variation near the crevice opening. The Cl− concentrations corresponding to crevices with widths of 100 μm, 250 μm, 400 μm and 550 μm are 4.38, 3.15, 2.76 and 1.86 M, respectively. This trend is positively correlated with the gap size. Their changes are in agreement with the in situ pH measurement results, demonstrating that the corrosiveness of the solution in the gap gradually increases as the gap width decreases.
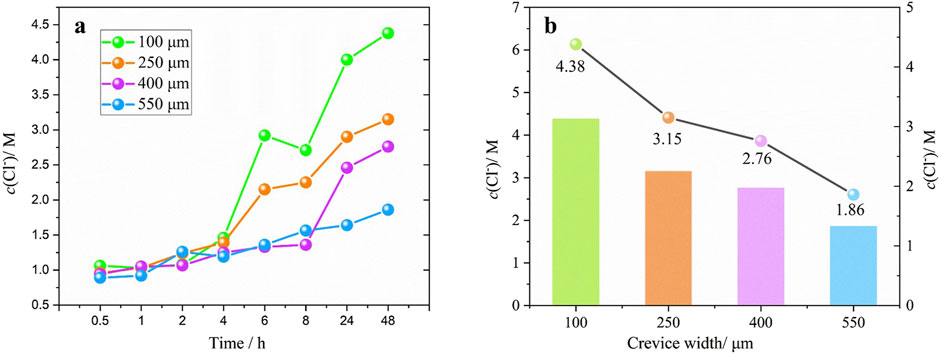
Figure 7. (A) Evolution of chloride ion concentration with time and (B) the chloride ion concentration at the crevice opening after 48 h immersion for different gap width.
3.3.3 Real-time morphology observation
To track the progression of the corrosion phenomenon, real-time observations of the corrosion morphology within the crevice were conducted using optical microscopy (OM). The OM images displayed in Figure 8 are taken at typical positions. A cursory look reveals that the corrosion patterns are similar: the corrosion products migrate from the crevice opening, extending towards the crevice’s center and bottom, across all measured gap widths. The most intense corrosion activity is localized at the crevice mouth, with the middle and lower regions exhibiting only minor erosion.
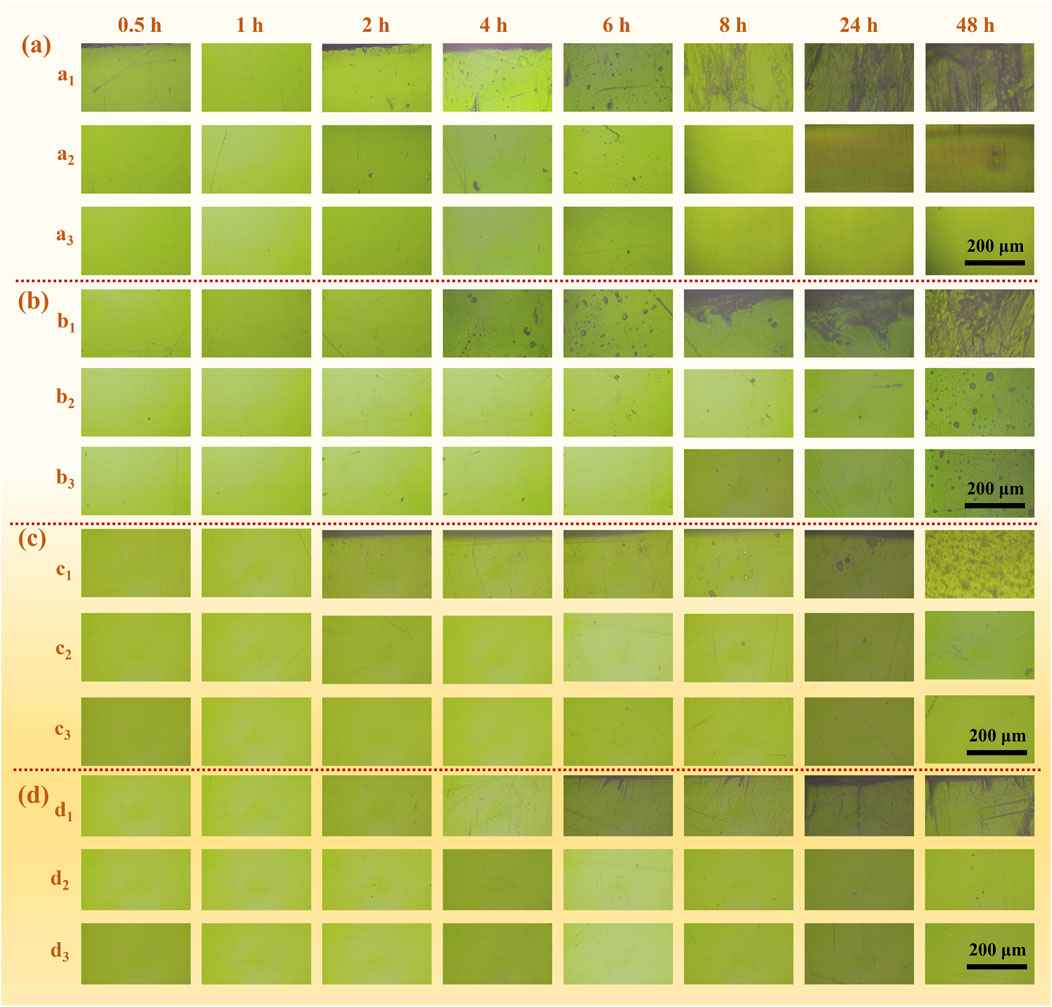
Figure 8. Observation of the radial morphology of the (a1, b1, c1, d1) crevice mouth (a2, b2, c2, d2) the middle and (a3, b3, c3, d3) the bottom of the crevice with gap widths of (A) 100 μm, (B) 250 μm, (C) 400 μm and (D) 550 μm at room temperature over time.
At the initial stage, after just 1 h, no significant morphological alterations are observed across the varying gap widths, due to the stability of the passive film that fosters uniform corrosion both within and beyond the crevice confines. However, as the duration of immersion extends, nascent dark spots, indicative of an embryonic pit-like form, begin to manifest and proliferate near the crevice mouth. These minute spots are pinpointed as the inception points for crevice corrosion. The initiation time for pitting corrosion (ts) is noticed to be contingent upon the crevice width, with narrower crevices exhibiting earlier pitting. Specifically, ts is recorded at 2, 4, 6, and 6 h for crevice widths of 100, 250, 400, and 550 μm, respectively. In the case of 100 and 250 μm crevices, the corrosion zone begins to expand near the crevice opening and subsequently spreads towards the middle region after the 4 h mark. A significant buildup of corrosion products is observed at the opening, which is a consequence of extensive metal dissolution and hydrolysis reactions. Concurrently, the emergence of bubbles at the openings is a conspicuous sign of hydrogen gas evolution. However, for the 400 and 550 μm crevices, the corrosion area does not rapidly expand until after a full 8 h of immersion.
Furthermore, the increase in the gap size resulted in a decrease in the internal corrosion zone, which emphasizes that 201-SS exhibits a more remarkable crevice corrosion tendency under narrower gap conditions. This observation highlights the pivotal role of gap width in the susceptibility and progression of crevice corrosion in 201-SS material.
3.4 Ex-situ observation after corrosion
Figure 9 illustrates the ex-situ surface morphologies of 201-SS at various locations across different gap widths after immersion in a 1 M NaCl solution (pH = 4.00) for 48 h. The corrosion distribution is characterized by a pronounced heterogeneity. The crevice opening is densely packed with a substantial layer of corrosion products. As one moves into the midsection of the crevice, the density of these deposits diminishes, with the sparsest concentration found in the deepest areas. A correlation is observed between the crevice size and corrosion severity: Samples featuring narrower crevices are more prone to exhibit a broader distribution of corrosion products and a more substantial deposit layer. These observations align with the experimental results previously discussed.
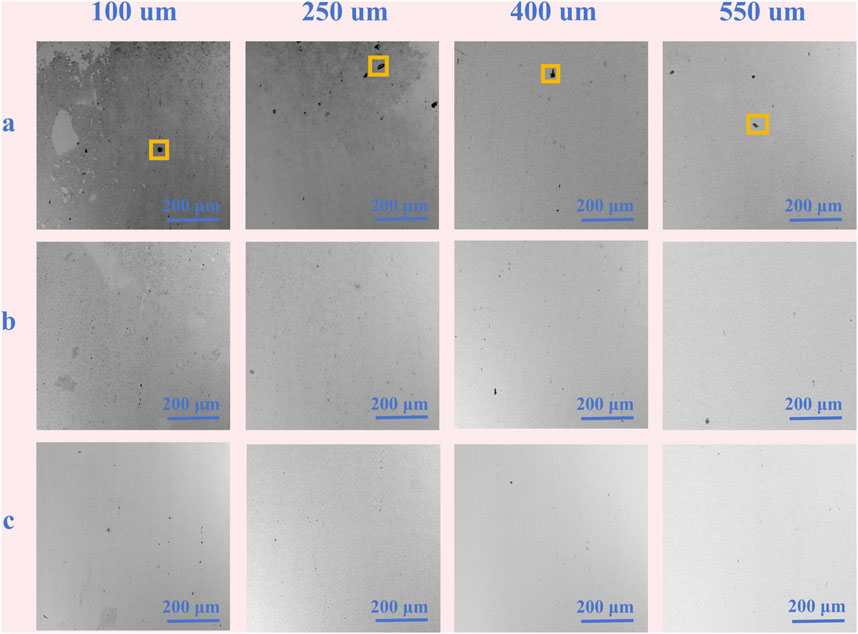
Figure 9. Ex-situ morphology observation of 201 stainless steel after immersion for 48 h under the different gap widths: (A) crevice mouth, (B) the middle and (C) the bottom of crevice.
As shown in Figure 10, the elemental makeup of the corrosion products gathered around the crevice opening was identified by EDX. The elemental analysis points to the presence of iron and chromium, alongside oxygen and chlorine, within the corrosion byproducts, which implies the potential formation of hydroxide or oxide forms of iron or chromium. The presence of chlorine signal can be attributed to the adsorption of electrolyte-based sodium chloride and/or the transient formation of unstable iron oxychloride molecules that momentarily develop during testing. The oxygen signature detected by EDX is particularly intense in the crevice with a narrower width, indicating a substantial of corrosion products was accumulated on the steel surface, a consequence of the enhanced corrosive activity in narrower crevices.
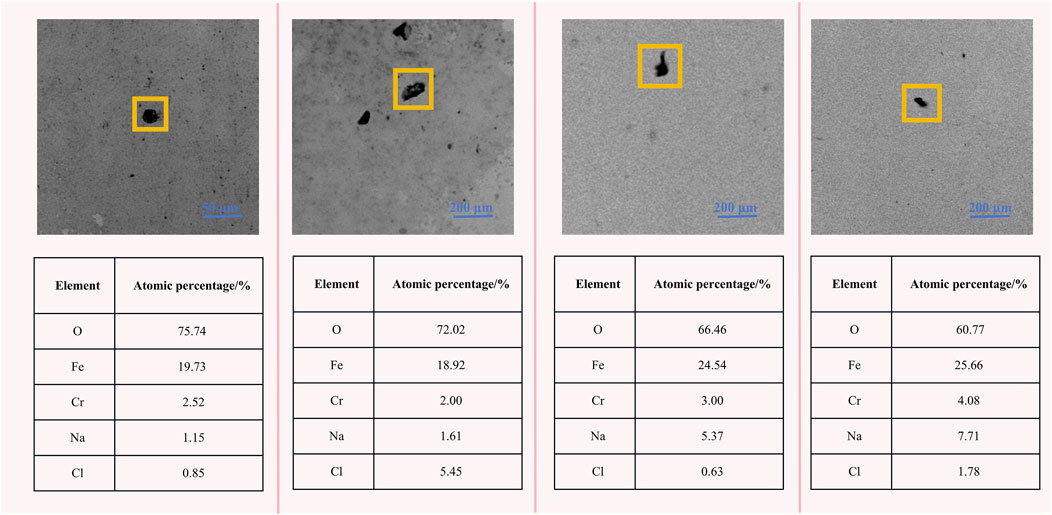
Figure 10. Element analysis of corrosion products gathered around the crevice mouth under the different gap widths after immersion for 48 h.
4 Discussion
4.1 The effect of internal microenvironmental variation on the initiation of crevice corrosion
Figures 3–7 indicate that microenvironmental fluctuations within the crevice substantially influence the start of crevice corrosion. The buildup of hydrogen ions (H+) within the crevice leads to the breakdown of the protective passive film, thereby triggering pit formation. The formation of these pits releases a surge of metal ions, causing a precipitous decline in pH and a rapid rise in chloride ion (Cl−) concentration. This sequence of events paves the way for the self-catalytic proliferation of crevice corrosion.
The schematic representation of the corrosion mechanism for 201-SS is depicted in Figure 11. The first hour of immersion marks the incubation phase for crevice corrosion. The passive film maintained its integrity, with homogeneous corrosion taking place consistently inside and outside the fissure. The pH value increased gradually due to the reduction of oxygen and protons (Figure 5). During this period, no visible morphological changes were observed under varying gap widths (Figure 8). As the soaking time increases, the oxygen within the crevice were exhausted. This signifies that the crevice corrosion has progressed into its secondary phase (activation stage). As a result of limited oxygen diffusion, the cathodic reactions inside the crevice are subsequently obstructed. Despite this, the external cathodic processes continue to sustain the anodic reactions occurring within the crevice. The anodic dissolution process escalates the concentration of metal ions, which undergo hydrolysis, lowers the pH and weakens the protectiveness of passive film (Figure 5).
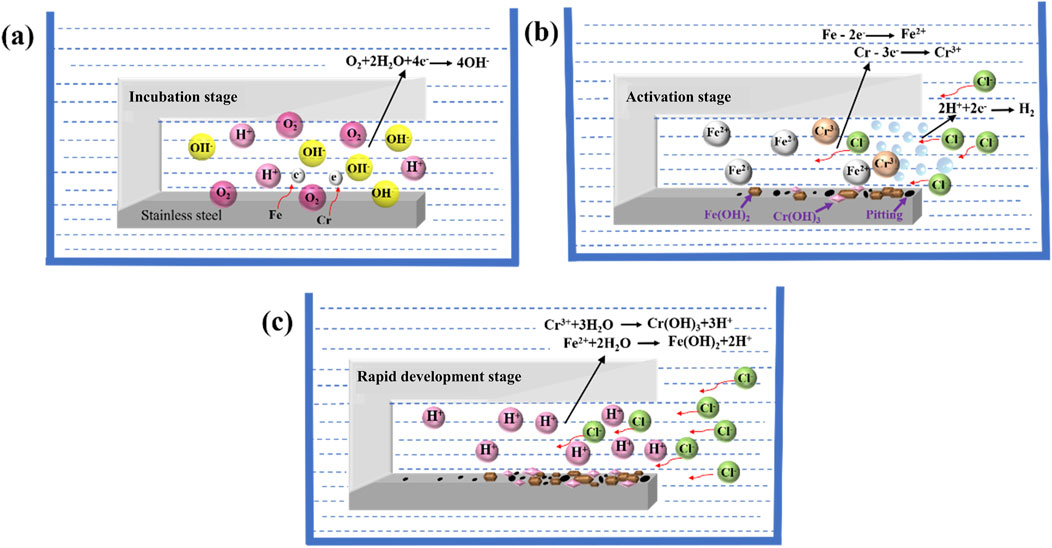
Figure 11. Schematic diagram of the crevice corrosion mechanism of 201-SS in 1 M (pH = 4.00) NaCl solution: (A) Incubation stage; (B) Activation stage; (C) Rapid development stage.
The main description of the anode process involved is written as shown in Equations 3–6:
With the extension of the soaking period, the pH value at the opening declines rapidly while the fluctuation of Cl− ions concentration is relatively small. No discernible morphological alteration is observed at the opening. This indicates the presence of metastable pitting corrosion. Some metals dissolve, and the hydrolysis of some metal ions lead to the decrease in pH. As the duration of immersion, some nascent dark spots, indicative of an embryonic pit-like form, begin to manifest and proliferate near the crevice mouth. This is due to the rapid decline in pH value stimulates the formation of metastable/stable pits, which further aggravates the decrease in pH and results in a gradual increase in the Cl− concentration (the generation of Fe2+/H+ ions intensified the electromigration of Cl− ions).
Upon reaching the critical levels of pH and Cl− concentration in the crevice solution, some tiny dark patches emerged near the gap mouth and increased progressively over time, indicating the occurrence of pitting corrosion. The emergence of pits releases a significant amount of metal ions, leading to the sharp pH drop at the opening. This initiates an autocatalytic chain reaction that intensifies the crevice corrosion. A substantial number of pits rapidly formed at the crevice opening and propagated towards its middle and deepest regions. The ongoing generation of Fe2+ ions intensified the electromigration of Cl− ions. As a result, there was a notable escalation in Cl− concentration. This increase heralded the progression into the third phase, which is distinguished by a rapid development period. Some bubbles were observed during this period in the case of the crevice with a width of 100 μm and 250 μm (Figure 6). This is due to a number of protons were reduced inside owing to the strong acid electrolyte, leading to the decrease slope of pH drop in Figure 5. When the rate of anodic dissolution process exceeds the hydrogen release rate, the slope of pH drops shifts positively. It was observed that no gas bubbles formed within the crevice for gap widths of 400 and 550 μm. This is likely due to the increased alkalinity within the crevice. In the current work, an incubation period followed by an activation phase preceded the onset of crevice corrosion, indicating that the initiation of this corrosion mechanism was not instantaneous. Throughout the experiment, significant alterations in the chemical composition within the crevice were meticulously monitored. Based on these observations, we contend that the CCST model can aptly characterize the metal dissolution processes that occur during the incubation and activation stages. Additionally, the severest corrosion was observed right at the mouth of the crevice. According to the literature, the strongest attack is predicted to occur close to the fissure mouth, based on the IR drop theory (Miller and Lilard, 2019). This theory posits that a remarkable increase in the metal dissolution rate and/or corrosion current leads to a notable potential drop. Upon reaching a critical IR drop value, the site and severity of the corrosion become potential dependent, thus triggering crevice corrosion. These findings are in close alignment with the observed microenvironmental changes (Figures 5, 7). Additionally, the increased acidity and Cl− concentration within the gap throughout the test, appears to be the primary catalyst for the negative shift of OCP and corrosion potential. This correlation implies that the dynamic chemical environment, characterized by increasing aggressive corrosion environment, has a substantial impact on the electrochemical processes at the electrode-electrolyte boundary.
4.2 Influence of the gap size on evolution of crevice corrosion
Based on the findings, the crevice’s geometric properties exert a notable influence on the localized chemical environment within the crevice, which subsequently affects the initiation and spread of crevice corrosion (Figures 6–8). This result aligns with the findings of Luo et al. (2022), demonstrating that the crevice gap’s dimensions significantly influence the microenvironmental fluctuations within the crevice, and also has a substantial impact on the initiation time of crevice corrosion, which is largely due to the volume and diffusion effects.
Firstly, the crevice width influences the time it takes for pitting corrosion to begin. The ts is recorded at 2, 4, 6, and 6 h for crevice widths of 100, 250, 400, and 550 μm, respectively. This means that the pits emerged earlier with a smaller gap. A direct correlation exists between crevice width, pH value, and Cl− concentration. Notably, as the crevice becomes narrower, the pH value at the crevice opening decreases, and the Cl− concentration increases. After 48 h of immersion, the pH values measured at the crevice openings were 1.64, 2.26, 2.73 and 2.88, respectively for widths of 100, 250, 400 and 550 μm, respectively. While the corresponding Cl− concentrations are 4.38, 3.15, 2.76 and 1.86 M, respectively. This pattern suggests that a narrower crevice create a more aggressive corrosive environment, which in turn leads to a negative shift in OCP and corrosion potential of the 201-SS (Figures 3, 4). The significant drop in pH and the concurrent rise in Cl− concentration with decreasing crevice width is likely due to the reduced electrolyte volume and the limited diffusion capacity within the narrower spaces.
Figure 12 illustrates the impact of gap width on the diffusion of ions within the crevice. The term “d” denotes the width of the crevice, while “V” signifies the volume of solution contained within the gap. The reduction in H+ concentration within the crevice is attributed to the hydrolysis of Fe2+ and Cr3+ ions. As the crevice width “d” diminishes, the volume of solution within the gap also decreases, which subsequently limits the diffusion of protons from the crevice to the external solution. Herein, the concentration of H+ increases with the decrease of “d”. This heightened concentration encourages the formation of more corrosion pits and the emission of metal cations. This accelerates the buildup of corrosive ions, leading to a sharper decrease in pH and a higher concentration of Cl− within the crevice solution. As a result, the initiation time for crevice corrosion is reduced with narrower crevices.
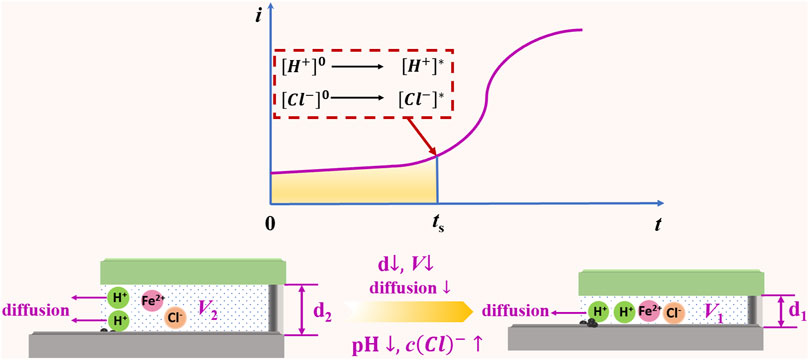
Figure 12. A schematic overview: Influence of gap widths on the ion diffusion process within the crevice.
5 Conclusion
In this research, the behavior of crevice corrosion in 201-SS in 1 M NaCl solution across a range of crevice widths were examined. Drawing from the aforementioned experimental findings, we have formulated the subsequent conclusions.
(1) The crevice corrosion behavior of 201-SS can be categorized into three distinct phases: incubation, activation and rapid development phase.
(2) The real-time microenvironmental variation within the crevice has a significant effect on the start of crevice corrosion. The decrease in pH and an increase in the Cl− concentration within the gap are the pivotal determinant in the incipience of crevice corrosion.
(3) The crevice dimension affects the accumulation rate of erosive ions and the time it takes for pitting corrosion to initiate within the crevice, through the effects of volume and diffusion. The ts is recorded at 2 h, 4 h, 6 h, and 6 h for crevice widths of 100, 250, 400, and 550 μm, respectively.
(4) A direct correlation was found between crevice width, pH value, and Cl− concentration. A narrower crevice creates a more aggressive corrosive environment, resulting in a more negative OCP and corrosion potential for the 201-SS.
Data availability statement
The original contributions presented in the study are included in the article/Supplementary Material, further inquiries can be directed to the corresponding authors.
Author contributions
H-JG: Data curation, Formal Analysis, Investigation, Writing–original draft. Y-HB: Data curation, Methodology, Validation, Writing–review and editing. HZ: Resources, Validation, Visualization, Writing–review and editing. H-RY: Conceptualization, Supervision, Writing–review and editing. Z-JZ: Conceptualization, Funding acquisition, Project administration, Resources, Writing–review and editing. PL: Funding acquisition, Project administration, Resources, Writing–review and editing. Y-XZ: Resources, Writing–review and editing. J-YW: Supervision, Writing–review and editing.
Funding
The author(s) declare that financial support was received for the research, authorship, and/or publication of this article. This study is financially supported by the Zhejiang Provincial Natural Science Foundation of China (No. LY23E010005), National Natural Science Foundation of China (No. 52001301), the Fundamental Research Funds for the Provincial Universities of Zhejiang (No. 2022YW45), and the Japan Society for the Promotion of Science (No. JP24K17166).
Conflict of interest
The authors declare that the research was conducted in the absence of any commercial or financial relationships that could be construed as a potential conflict of interest.
Generative AI statement
The author(s) declare that no Generative AI was used in the creation of this manuscript.
Publisher’s note
All claims expressed in this article are solely those of the authors and do not necessarily represent those of their affiliated organizations, or those of the publisher, the editors and the reviewers. Any product that may be evaluated in this article, or claim that may be made by its manufacturer, is not guaranteed or endorsed by the publisher.
Supplementary material
The Supplementary Material for this article can be found online at: https://www.frontiersin.org/articles/10.3389/fmats.2024.1543536/full#supplementary-material
References
Aoyama, T., and Kato, C. (2023). Introduction of Cu2+ to the inside of the crevice by chelation and its effect on crevice corrosion of Type 316L stainless steel. Corros. Sci. 210, 110850. doi:10.1016/j.corsci.2022.110850
Bai, Y. H., Zhu, Z. J., Zhang, H., Zhang, Q. H., Du, H. W., Wang, J. Y., et al. (2023). In-situ radial pH monitoring inside the crevice of stainless steel combined with potentiometric scanning electrochemical microscopy. Electrochim. Acta. 467, 143109. doi:10.1016/j.electacta.2023.143109
Bryant, M., Farrar, R., Freeman, R., Brummitt, K., Nolan, J., and Neville, A. (2014). Galvanically enhanced fretting-crevice corrosion of cemented femoral stems. J. Mech. Behav. Biomed. Mater. 40, 275–286. doi:10.1016/j.jmbbm.2014.08.021
Chen, Q. H., Zhou, Z. Y., Feng, M. T., He, J. H., Xu, Y. Q., and Liao, B. K. (2025). Unraveling the inhibitive performance and adsorption behavior of expired compound glycyrrhizin tablets as an eco-friendly corrosion inhibitor for copper in acidic medium. J. Taiwan Inst. Chem. Eng. 168, 105913. doi:10.1016/j.jtice.2024.105913
Chen, X., Gao, F. J., Wang, Y. L., and He, C. (2016). Transient numerical model for crevice corrosion of pipelines under disbonded coating with cathodic protection. Mater. Des. 89, 196–204. doi:10.1016/j.matdes.2015.09.047
Ding, J. W., Wang, H. T., and Han, E. H. (2021). A multiphysics model for studying transient crevice corrosion of stainless steel. J. Mater. Sci. Technol. 60, 186–196. doi:10.1016/j.jmst.2020.06.008
Gilbert, J. L., and Zhu, D. (2020). A metallic biomaterial tribocorrosion model linking fretting mechanics, currents, and potentials: model development and experimental comparison. J. Biomed. Mater. Res. B 108, 3174–3189. doi:10.1002/jbm.b.34643
Ha, H. Y., Kim, S. H., Kim, K. W., Lee, T. H., Won, C. H., and Lee, C. H. (2024). Effects of long-term annealing on pitting corrosion behavior of Type 304 borated stainless steels. Corros. Commun. doi:10.1016/j.corcom.2024.08.001
Hornus, E. C., Rodríguez, M. A., Carranza, R. M., and Rebak, R. B. (2019). Crevice corrosion repassivation of Ni-Cr-Mo alloys by cooling. Corrosion 6, 604–615. doi:10.5006/3100
Hu, Q., Zhang, G. A., Qiu, Y. B., and Guo, X. P. (2011). The crevice corrosion behaviour of stainless steel in sodium chloride solution. Corros. Sci. 53, 4065–4072. doi:10.1016/j.corsci.2011.08.012
Jafarzadeh, S., Zhao, J. M., Shakouri, M., and Bobaru, F. (2022). A peridynamic model for crevice corrosion damage. Electrochim. Acta 401, 139512. doi:10.1016/j.electacta.2021.139512
Kamaraj, A., and Erning, J. W. (2020). Susceptibility of 304 stainless steel to crevice corrosion in electrochemically active fluids. Corrosion 76, 424–435. doi:10.5006/3324
Li, H. Z., Cao, J., Gao, L. M., Chen, Q. H., Yang, J. J., Liao, B. K., et al. (2025). Improving the discharge performance of aqueous Mg-air battery using dicarboxylic acid additives. Mater. Res. Bull. 182, 113160. doi:10.1016/j.materresbull.2024.113160
Li, K. J., Sun, L., Cao, W. K., Chen, S., Chen, Z. W., Wang, Y. L., et al. (2022). Pitting corrosion of 304 stainless steel in secondary water supply system. Corros. Commun. 7, 43–50. doi:10.1016/j.corcom.2021.11.010
Li, Y. Z., Xu, N., Guo, X. P., and Zhang, G. A. (2017). The role of acetic acid or H+ in initiating crevice corrosion of N80 carbon steel in CO2-saturated NaCl solution. Corros. Sci. 128, 9–22. doi:10.1016/j.corsci.2017.08.028
Li, Y. Z., Xu, N., Liu, G. R., Guo, X. P., and Zhang, G. A. (2016). Crevice corrosion of N80 carbon steel in CO2-saturated environment containing acetic acid. Corros. Sci. 112, 426–437. doi:10.1016/j.corsci.2016.08.002
Liu, P., Zhang, Q. H., Li, X. R., Hu, J. M., and Cao, F. H. (2021). Insight into the triggering effect of (Al, Mg, Ca, Mn)-oxy-sulfide inclusions on localized corrosion of weathering steel. J. Mater. Sci. Technol. 64, 99–113. doi:10.1016/j.jmst.2020.06.031
Luo, B., Hu, Q., Liu, J., and Huang, F. (2022). Effect of crevice gap on crevice corrosion initiation and development of 2205 duplex stainless steel in NaCl solution. J. Mater. Res. Technol. 21, 2584–2597. doi:10.1016/j.jmrt.2022.10.059
Matsumura, K., Nishimoto, M., Muto, I., and Sugawara, Y. (2022). Sudden pH and Cl-concentration changes during the crevice corrosion of type 430 stainless steel. J. Electrochem. Soc. 169, 101506. doi:10.1149/1945-7111/ac9bda
Miller, D. M., and Lillard, R. S. (2019). An investigation into the stages of alloy 625 crevice corrosion in an ocean water environment: initiation, propagation and repassivation in a remote crevice assembly. J. Electrochem. Soc. 166, C3431–C3442. doi:10.1149/2.0491911jes
Ning, F. Q., Tan, J. B., Zhang, Z. Y., Wang, X. Q., Wu, X. Q., Han, E. H., et al. (2021). Nodular corrosion inside the crevice of Alloy 690 in deaerated high-temperature chloride solution. Corros. Sci. 185, 109442. doi:10.1016/j.corsci.2021.109442
Nose, K., Miyamoto, K. I., and Yoshinobu, T. (2020). Estimation of potential distribution during crevice corrosion through analysis of I-V curves obtained by LAPS. Sensors (Basel) 20, 2873. doi:10.3390/s20102873
Pickering, H. W. (1988). The significance of the local electrode potential within pits, crevices and cracks. Corros. Sci. 29, 325–341. doi:10.1016/0010-938x(89)90039-5
Shojaei, E., Mirjalili, M., and Moayed, M. H. (2019). The influence of the crevice induced IR drop on polarization measurement of localized corrosion behavior of 316L stainless steel. Corros. Sci. 156, 96–105. doi:10.1016/j.corsci.2019.04.030
Tang, B., Wang, W., Yang, H., and Zhu, H. (2024). Study on microstructure and mechanical properties of steel corrosion products in marine environment. Front. Mater. 11, 1474315. doi:10.3389/fmats.2024.1474315
Torres, C., Johnsen, R., and Iannuzzi, M. (2021). Crevice corrosion of solution annealed 25Cr duplex stainless steels: effect of W on critical temperatures. Corros. Sci. 178, 109053. doi:10.1016/j.corsci.2020.109053
Wang, W. H., Shen, J. Y., and Wang, Q. S. (2016). A mathematical model of crevice corrosion for buried pipeline with disbonded coatings under cathodic protection. J. Loss Prev. Proc. Ind. 41, 270–281. doi:10.1016/j.jlp.2016.03.024
Welikala, S., Al-Saadi, S., Gates, W. P., Panter, C., and Singh Raman, R. K. (2024). Sulphate reducing bacteria (SRB) biofilm development and its role in microbial corrosion of carbon steel. Front. Mater. 11, 1360869. doi:10.3389/fmats.2024.1360869
Xiao, Z. H., Hu, S. Y., Luo, J. L., Shi, S. Q., and Henager, C. H. (2018). A quantitative phase-field model for crevice corrosion. Comp. Mater. Sci. 149, 37–48. doi:10.1016/j.commatsci.2018.03.011
Xu, W., Xin, Y. C., Zhang, B., and Li, X. Y. (2022). Stress corrosion cracking resistant nanostructured Al-Mg alloy with low angle grain boundaries. Acta Mater 225, 117607. doi:10.1016/j.actamat.2021.117607
Xu, W. C., Deng, Y., Zhang, B. B., Zhang, J., Peng, Z. B., Hou, B. R., et al. (2022). Crevice corrosion of U75V high-speed rail steel with varying crevice gap size by in-situ monitoring. J. Mater. Res. Technol. 16, 1856–1874. doi:10.1016/j.jmrt.2021.12.116
Yang, Y. Z., Jiang, Y. M., and Li, J. (2013). In situ investigation of crevice corrosion on UNS S32101 duplex stainless steel in sodium chloride solution. Corros. Sci. 76, 163–169. doi:10.1016/j.corsci.2013.06.039
Yeh, C. P., Tsai, K. C., and Huang, J. Y. (2020). Influence of chloride concentration on Stress corrosion cracking and crevice corrosion of austenitic stainless steel in saline environments. Mater. (Basel) 13, 5640. doi:10.3390/ma13245640
Zhang, H., Yuan, H. R., Zhu, Z. J., Zhang, Q. H., Bai, Y. H., Wang, J. Y., et al. (2024). A highly sensitive, long-time stable Ag/AgCl ultra-micro sensor for in situ monitoring chloride ions inside the crevice using SECM. Talanta 274, 126026. doi:10.1016/j.talanta.2024.126026
Zhang, T. S., Wang, J. L., Li, G. F., and Liu, H. F. (2021). Crevice corrosion of X80 carbon steel induced by sulfate reducing bacteria in simulated seawater. Bioelectrochemistry 142, 107933. doi:10.1016/j.bioelechem.2021.107933
Zhang, Z., Li, Z. X., Wu, F., Xia, J. Y., Huang, K., Zhang, B. W., et al. (2022). A comparison study of crevice corrosion on typical stainless steels under biofouling and artificial configurations. NPJ Mater. Degrad. 6, 85. doi:10.1038/s41529-022-00301-w
Zhu, L. Y., Cui, Z. Y., Cui, H. Z., Wang, X., and Li, Y. Z. (2022). The effect of applied stress on the crevice corrosion of 304 stainless steel in 3.5 wt% NaCl solution. Corros. Sci. 196, 110039. doi:10.1016/j.corsci.2021.110039
Zhu, Z. J., Liu, X. Y., Ye, Z. N., Zhang, J. Q., Cao, F. H., and Zhang, J. X. (2018). A fabrication of iridium oxide film pH micro-sensor on Pt ultramicroelectrode and its application on in-situ pH distribution of 316L stainless steel corrosion at open circuit potential. Sens. Actuators B Chem. 255, 1974–1982. doi:10.1016/j.snb.2017.08.219
Zhu, Z. J., Zhang, H., Bai, Y. H., Liu, P., Yuan, H. R., Wang, J. Y., et al. (2024). Crevice corrosion behavior of 201 stainless steel in NaCl solutions with different pH values by in situ monitoring. Materials 17, 1158. doi:10.3390/ma17051158
Keywords: crevice corrosion, gap size, pH, stainless steel, SECM
Citation: Ge H-J, Bai Y-H, Zhang H, Yuan H-R, Zhu Z-J, Liu P, Zeng Y-X and Wang J-Y (2025) Role of crevice size induced microenvironment variation within the gap in initiating crevice corrosion of 201 stainless steel. Front. Mater. 11:1543536. doi: 10.3389/fmats.2024.1543536
Received: 11 December 2024; Accepted: 30 December 2024;
Published: 17 January 2025.
Edited by:
Fahe Cao, Sun Yat-sen University, ChinaReviewed by:
Yangting Sun, Fudan University, ChinaBokai Liao, Guangzhou University, China
Qinhao Zhang, Ningbo University, China
Copyright © 2025 Ge, Bai, Zhang, Yuan, Zhu, Liu, Zeng and Wang. This is an open-access article distributed under the terms of the Creative Commons Attribution License (CC BY). The use, distribution or reproduction in other forums is permitted, provided the original author(s) and the copyright owner(s) are credited and that the original publication in this journal is cited, in accordance with accepted academic practice. No use, distribution or reproduction is permitted which does not comply with these terms.
*Correspondence: Hao-Ran Yuan, bWNkaHlockBjamx1LmVkdS5jbg==; Ze-Jie Zhu, emVqaWV6aHVAY2psdS5lZHUuY24=; Pan Liu, bGl1LnBhbi5hNUB0b2hva3UuYWMuanA=