
95% of researchers rate our articles as excellent or good
Learn more about the work of our research integrity team to safeguard the quality of each article we publish.
Find out more
ORIGINAL RESEARCH article
Front. Mater. , 22 January 2025
Sec. Structural Materials
Volume 11 - 2024 | https://doi.org/10.3389/fmats.2024.1535986
This article is part of the Research Topic Advanced Materials and Technologies for Sustainable Development of Underground Resources View all 43 articles
To explore the interaction between holes and fractures in defective white sandstone, uniaxial compression tests were conducted on samples with varying horizontal distances between holes and fractures. The technique known as Digital Image Correlation (DIC) was employed to analyze the deformation patterns, while CT scanning technology was implemented to elucidate the interior crack propagation features. Discrete Element Method (DEM) simulations were performed to investigate the micro-scale fracture evolution. The findings demonstrate that load-bearing capacity and deformation resistance decreased as the horizontal hole-fracture distance increased. The failure mode transitioned from a mixed tensile-shear failure to a more rapid tensile failure. Tensile wing fractures caused by tensile failure reinforced the merging of rock bridges. Furthermore, the trajectories of fracture propagated from the outside to the inside of the rocks progressively simplify, resulting in accelerated instability and collapse. DEM simulations indicate that the augmentation of horizontal distance between holes and fractures influenced the displacement field and the orientation of micro-fractures inside the samples. The formation of micro-fractures progressively adhered to a “clusteringexpansion-coalescence” sequence along the paths of the hole-fracture structures. The maximum strength of the samples declined in a three-phase pattern: gradual decline, steep decline, and gradual decline. These findings provide valuable insights for engineering applications, such as tunnel excavation and mining operations.
Rock, a naturally heterogeneous substance, is susceptible to various flaws, including fractures, joints, and holes (Misra, 1999). Its mechanical characteristics are significantly influenced by the number, distribution, and morphology of these flaws. Long-term geological tectonic processes, coupled with in-situ stress and construction disturbances from coal mining and tunnel construction, exert significant effects on rock masses. This leads to the propagation and coalescence of internal flaws, deteriorating rock mass performance and potentially causing issues such as surrounding rock instability and tunnel collapse (Zhu et al., 2015). Hence, a comprehensive study of the fracture processes in defective rocks should be conducted to mitigate and manage disasters in underground rock engineering.
Numerous researchers have considerably investigated the significant effect of defective rock mass behavior on the stability and safety of engineering projects. Focusing on the influence of flaw coalescence on the failure modes and strength properties of the samples, Huang and Yang (2016) conducted uniaxial compression tests on brittle sandstone samples with a single defect. Ma et al. (2021) explored the mechanical behavior of square rock samples with two parallel and surface-rough discontinuities under uniaxial compression. Their findings indicate that the mechanical properties of the specimens were significantly weakened by the formation and propagation of flaws before the rocks reached their bearing capacity, with fracture interaction notably affecting strength and modulus. Lu et al. (2021) examined the mechanisms and failure modes of columnar jointed rock masses under various stress conditions and identified that the dip angle of columnar joints was a key factor contributing to rock mass strength anisotropy. Zhao et al. (2014) investigated the cracking behavior of pre-drilled rock samples under uniaxial compression at high in-situ stresses using acoustic emission monitoring. Their data suggest that tensile cracks occurred primarily at the top and bottom of the holes, while compression-shear cracks were more common at the sides. Li et al. (2011) studied the cracking behavior of rocks around deep hard rock chambers under high in-situ stress conditions using granite samples with square holes and compared their experimental results with numerical simulations in FLAC3D.
Advanced technologies such as Digital Image Correlation (DIC) (Ju et al., 2019; Li et al., 2022), Scanning Electron Microscope (SEM) (Wu J. et al., 2020; Wu et al., 2024), Computed Tomography (CT) (Sun et al., 2021), and Discrete Element Method (DEM) simulations (Shi H. et al., 2023; Pan et al., 2024) have been increasingly applied in the study on defective rocks to gain deeper insights into failure characteristics and crack propagation processes. DIC, a non-contact, high-precision full-field measurement technique, estimates the displacement and strain fields of materials by analyzing speckle patterns on their surface before and after deformation. Liu et al. (2024) employed DIC technology to investigate the mechanical response of granite samples with blunt V-shaped notches under varying stress conditions and derive fracture toughness indicators from the displacement field data. Additionally, Lin et al. (2020) combined AE monitoring with DIC technology for uniaxial compression tests to further unveil the mechanical behavior and fracture characteristics of rocks with double circular hole defects. CT scanning technology, a sophisticated non-destructive testing method, provides precise internal structural analysis by reconstructing an object’s three-dimensional structure from multi-angle projections. This technique is widely used in fields such as materials science, medicine, and geology. Jia et al. (2014) analyzed fracture patterns in carbonate rocks after uniaxial compression using CT scanning, demonstrating that the interconnection of microcracks led to macroscopic fractures. Li and Zhang, (2019) developed a novel fracture segmentation approach to accurately analyze fracture networks in CT image sequences of coal rocks. Replicating the mechanical response of defective rock masses under complex loading scenarios through numerical simulations can provide multi-scale information models, bringing about advantages such as improved repeatability and lower costs compared to complex and sophisticated testing. DEM is particularly effective in simulating the mechanical behavior of granular materials under load. With DEM Liu et al. (2017), modeled the effect of crack number, angle, and spacing on the mechanical properties of fractured rocks under uniaxial compression. Huang and Yang (2016) simulated the effect of crack inclination on stress-strain curves, deformation parameters, and crack growth patterns in sandstone with three parallel cracks.
According to the aforementioned studies, several researchers have conducted in-depth analyses of rocks with single flaws, such as holes or fractures, and achieved noteworthy findings. However, many flaws in natural rock masses, such as holes and fractures, are interconnected in various ways that can significantly alter the mechanical properties of the rock (Figure 1). Therefore, examining the interaction between holes and fractures is crucial for deepening our understanding of the instability and fracture processes in defective rocks. White sandstone with three distinct horizontal distances between fissures and holes serves as the study object for this work. Section 2 provides a detailed description of the experimental methodology. With CT scanning and DIC technologies, the internal crack propagation characteristics and the evolution of the rock surface deformation field are analyzed in Section 3. In Section 4, a DEM numerical model is developed to investigate the micro-scale fracture development properties of hole-fracture samples. Section 5 presents the discussion on the construction of nine rock models with varying hole-fracture distances, as well as the analysis of the impact of these variations on microfracture distribution, peak strength, and microfracture quantity.
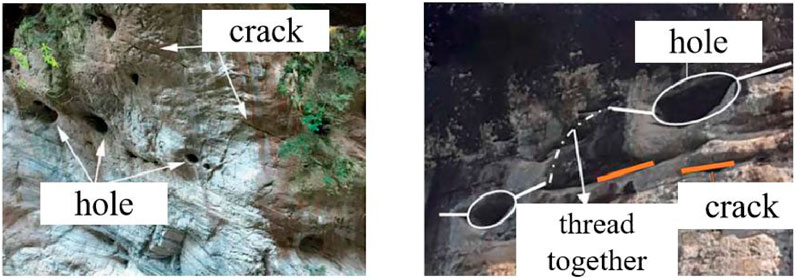
Figure 1. Rock mass with holes and cracks (Yi, 2021).
Based on previous research (Yi, 2021; Wu T. et al., 2020; Liu et al., 2021), this experiment designed three types of hole-fracture distribution structures with varying horizontal spacings. The horizontal distances between the center of the hole and the center of the fracture were set at 0 mm, 5 mm, and 10 mm, respectively, while the vertical distance remained constant at 25 mm. These configurations were labeled as R1, R2, and R3, respectively. The preformed hole, located at the center of the sample, had a diameter of 10 mm. The preformed fracture had a length of 10 mm, a width of 2 mm, and an inclination angle of 45°, as illustrated in Figure 2A.
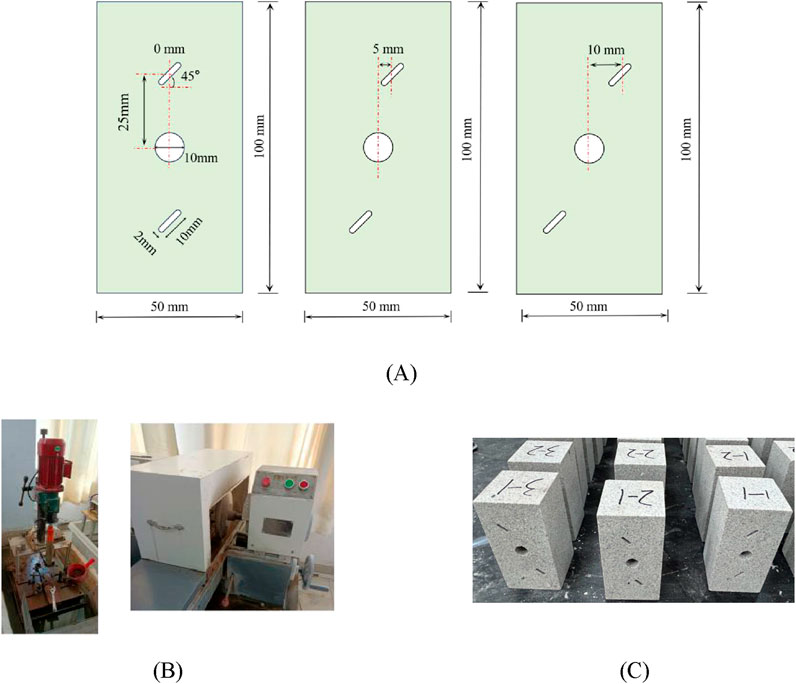
Figure 2. Sample preparation (A) Schematic of hole-fracture distribution (B) Drilling and polishing equipment (C) Fabrication of hole-fracture sandstone sample.
In this study, white sandstone from a mine in Inner Mongolia, China, was selected as the research object. The measured average density of the sandstone is 2.41 g/cm³, and its porosity is 6.04%. The selected sandstone block was drilled and polished (Figure 2B) to produce rectangular rock samples with dimensions of 50 mm*50 mm*100 mm. Preformed fractures and holes were created using a wire cutting method, as shown in Figure 2C.
Samples with similar wave velocities were selected using an ultrasonic velocity meter. The selected samples were then dried in an oven at 105°C for 24 h until they reached a constant weight. Before conducting the uniaxial compression test, the samples were coated with a layer of white paint. After drying, black paint was sprayed to create a speckle pattern, as illustrated in Figures 3A–C.

Figure 3. Sample processing: (A) Measuring wave velocity, (B) Drying samples, (C) Spraying speckle pattern.
The mechanical tests were conducted using the WAW-600 micro-controlled electro-hydraulic servo universal testing system from the School of Civil Engineering and Architecture, Anhui University of Science and Technology. The system has a maximum axial load capacity of 600 kN and is capable of performing both uniaxial compression tests and cyclic loading-unloading tests. Displacement control was used throughout the study, with a unidirectional loading rate of 0.06 mm/min. The testing equipment is shown in Figure 4A.
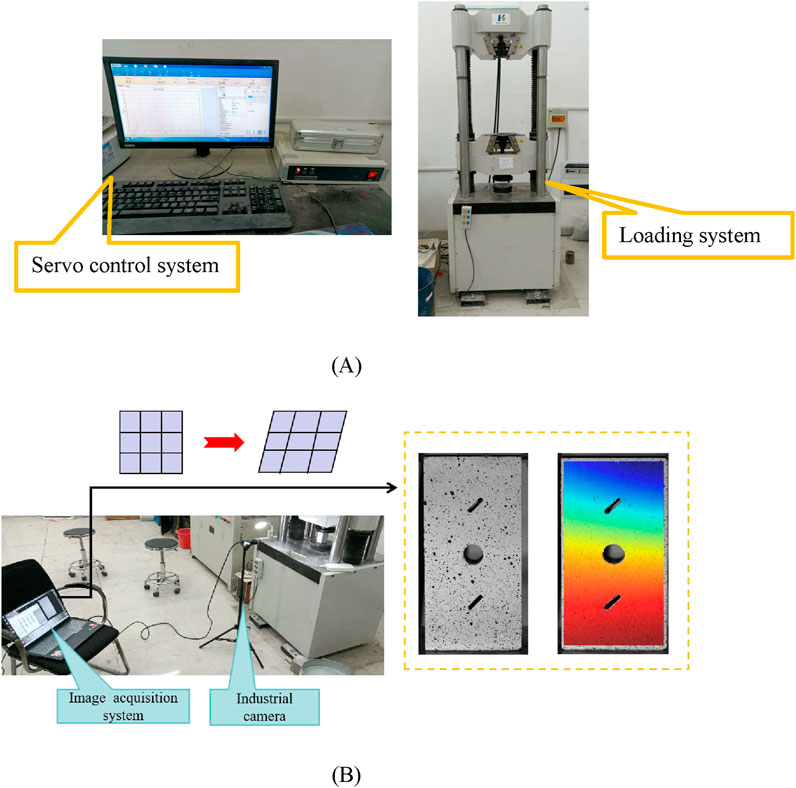
Figure 4. Laboratory tests: (A) WAW-600 universal testing machine, (B) DIC digital imaging monitoring system.
Digital Image Correlation (DIC) is a non-contact, full-field deformation measurement technique based on image processing and computer vision principles. By comparing digital images of an object’s surface before and after deformation, and tracking the positional changes of speckles in the images, the displacements and strains on the object’s surface can be calculated. The DIC digital imaging monitoring system used in this study consists of a 910 w pixel grayscale industrial camera, a specialized lens, and digital image processing software. During the uniaxial compression tests, the DIC system was synchronized with the testing machine, as shown in Figure 4B.
Computed Tomography (CT), as an advanced imaging technique, utilizes X-rays to penetrate rocks, cores, and ores, revealing their internal structures and properties such as cracks, pores, and mineral distributions. Leveraging its high-resolution imaging and non-destructive testing capabilities, CT allows for the three-dimensional reconstruction of rock and mineral samples, uncovering their microscopic structural features. This is of great significance for the study of rock genesis and properties, as well as for mineral exploration and mining. In this study, after the loading tests were completed, the samples were securely wrapped with plastic wrap and scanned using a 450 KV industrial CT detection system, as shown in Figure 5.
A comparative investigation was performed on the mechanical characteristics of the undamaged sample (R0) and the hole-fracture samples. Table 1 lists the statistics of peak stress and elastic modulus for the samples. Figure 6 illustrates the stress-strain curves of the samples.
The peak strength and elastic modulus of the samples exhibited a diminishing trend as the horizontal distance between the hole and the fracture increased, as revealed in Table 1; Figure 6. The mean peak strength of R1 samples was 49.698 MPa when hole-fracture horizontal spacing was set at 0 mm. In comparison to R1, the observed mean strengths of R2 and R3 samples declined by 11.04% and 35.63% to 44.765 MPa and 31.990 MPa, respectively, when the spacing increased to 5 mm and 10 mm. Additionally, 7.025 GPa, 6.330 GPa, and 5.465 GPa were the mean elastic moduli of the R1, R2, and R3 samples, respectively. These phenomena suggest that the rock’s ultimate bearing capacity and resistance to deformation deteriorated as the hole-fracture horizontal space increased.
The horizontal displacement and strain fields of R1, R2, and R3 samples are presented in Figure 7 at 20%, 50%, 80%, and 100% of the peak stress. The ultimate failure conditions of the samples are depicted in Figure 8.
Figures 7, 8 imply that the deformation development features of the loaded rock were influenced by the various hole-fracture horizontal spacings. There was a strain localization zone at the location of the hole-fracture rock bridge and notable horizontal displacement stratification when the R1 sample achieved 80% of its peak stress. The far tip of the lower fracture possessed a larger strain concentration after achieving the peak strength. Meanwhile, the failure condition reflects that a tensile failure zone 1 penetrating the sample was developed there. Eventually, a mixed tensile-shear failure zone 2 was formed by the more prominent localization zone above the hole. The holes and upper and lower fractures in the R2 and R3 samples exhibited concentration zones of tensile strain. The zones of concentration of strain at the rock bridges tended to link as the load level rose. In the R2 sample, the stress fields between the hole and fracture readily impacted one another because of the lessened hole-fracture horizontal spacing. This led to early concentrated deformation in the R2 sample. Antisymmetric tensile wing fractures emerged at the rock bridges of both materials, as observed from the failure condition. With scattered secondary fractures, the major wing crack between the rock bridges in the R2 sample, however, widened less, which hindered the rock’s ability to collapse quickly once it reached its maximum bearing capacity. From another perspective, the R3 sample exhibited a more substantial expansion of the main wing crack between the rock bridges, resulting in a more severe failure and stronger brittle characteristics. This was in contrast to the upper fracture-middle hole-lower fracture, which formed a complete and connected tensile crack zone.
Our research group built the virtual extensometer using the deformation field obtained by DIC technology and identified critical measurement spots via strain concentration zones. Figure 8 illustrates how the fracture process of hole-fracture sandstone was significantly influenced by the spread of wing cracks between the rock bridges. For the purpose of quantitatively describing the propagation of the wing cracks, virtual extensometer measurement sites (A, B, C, and D) were set up at the termini of the upper and lower fractures of the R2 and R3 samples, as presented in Figure 9.
Figure 10 depicts the variations in strain at the measurement locations in the R2 sample (points A and B) and the R3 sample (points C and D). The horizontal axis denotes the percentage of peak strength, with tensile and shear strain data recorded at each 10% stress interval. In Figure 10A, the R2 sample’s tensile strain started to rise after it reached 40% of its maximal strength, signifying the beginning of rock deterioration. The rate of rise peaked at points A and B with values of 0.0222% and 0.0237%, respectively, after first accelerating and then slowing down. After achieving 70% of the peak strength, the tensile strain values of the R3 sample quickly rose, peaking at 0.0306% and 0.0293% at points C and D, respectively. This suggests that the stress field between the rock bridges changed sooner under external pressure because the R2 sample had a lower hole-fracture horizontal spacing. On the other hand, the R3 sample’s greater horizontal spacing between holes weakened the rock’s bearing structure by lessening the effective bearing area of the sample. Lower rock strength and more noticeable brittle qualities appeared because the stress field between the rock bridges changed more drastically and the tensile strain values increased more quickly after reaching a stress threshold. The maximum shear strain at point B, which was 0.0112% at its highest, was only 47.3% of the tensile strain value at point B in Figure 10B, even though the absolute amount of shear strain at the measurement locations rose as load levels increased. This implies that the primary cause of the rock bridge’s through-failure between the hole and fracture was tensile wing fractures. The through-connection of the rock bridge was mostly provoked by tensile failure. In conclusion, an increase in the hole-fracture horizontal spacing delayed the commencement of rock damage but led to lower strength, quicker deformation, and more rapid failure.
CT scanning was conducted on the rock to obtain interior pictures, illustrating the internal fracture progression inside the samples. Four cutting points (A, B, C, D) were consecutively selected from the rock surface towards the center, yielding longitudinal slices from each position, as exhibited in Figure 11.
Figure 11 illustrates how variations in the horizontal distances between holes and fractures impacted the internal and exterior crack propagation pathways in the rock. The R1 sample’s slice at position A had two major fractures from top to bottom, through the hole’s left and right ends, as well as the lower fracture. The primary cracks’ distance from the hole increased as they went closer to the sample’s center, and the angle between them progressively expanded as well. The through-failure was located on the side of the rock instead of at its end. Positions A and B of R2 presented almost identical slices. A reverse wing crack rose from the far end of the lower fracture in the slice at position C, and it had already joined with the end of the rock in the slice at position D. Little variation was observed in the fracture propagation route in R3 from the rock surface to the center. The crack propagation route in white sandstone, from the outside to the interior, became easier and less complicated as the horizontal separation between holes and fractures increased. Additionally, the spatial distribution of new cracks shifted from being tortuous and disordered to being more plain. Consequently, it took less time for fractures to join the rock bridges, causing the rock to become unstable and break more quickly.
In rock slope engineering, holes and cracks are frequent flaws, as demonstrated in Figure 12. It is still necessary to closely monitor the deformation along the rock bridge path and reinforce it promptly, even when there is a certain spacing between holes and fractures, so as to prevent the rock bridge from failing completely due to gravity and other engineering disturbances, which could stimulate the rapid sliding of unstable blocks and more serious engineering disasters (Huang et al., 2023).
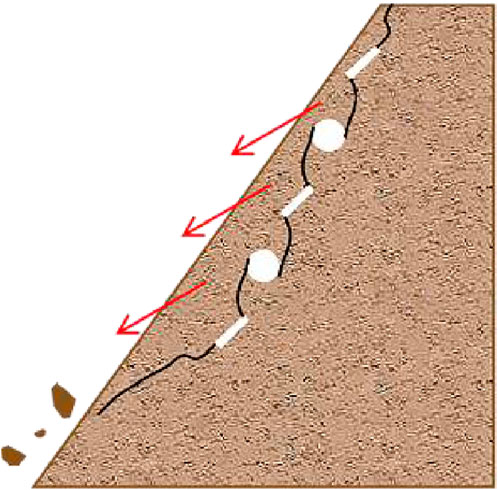
Figure 12. Schematic diagram of rock block sliding on a slope [Modified from Huang et al. (2015), Brideau et al. (2009), and Deng et al. (2020)].
Numerical simulation technology serves as an important means to explore the complex mechanical properties of rocks, opening up new avenues for addressing rock fracture and related challenges (Gu and Zhou, 2017). Currently, the Finite Element Method (FEM) and the Discrete Element Method (DEM) are two primary methods in the field of numerical simulation. The Finite Element Method, constrained by its continuity assumption, often struggles to directly simulate dynamic processes such as the initiation and propagation of rock cracks (Jing, 2003). In contrast, the Discrete Element Method is well-suited for handling discontinuous media problems, including dynamic behaviors such as particle collisions, friction, and contact. In DEM, not only can the interactions between internal particles or elements of the rock be represented, but also the entire process of micro-crack initiation, propagation, and ultimate macroscopic fracture can be captured. This provides a significant advantage in studying the mechanisms of rock fracture.
This section explores the micro-scale fracture evolution characteristics of porous rocks through DEM numerical simulation, aiming to further understand the interaction mechanisms between pores and voids. The constitutive model employed is the parallel bond model, which is suitable for granular cohesive materials such as rocks and concrete. This model was first proposed by Potyondy and Cundall based on DEM theory (Potyondy and Cundall, 2024). The principle is illustrated in Figure 13, where bonded contacts are formed between particles, with both linear elements and parallel bond elements working together to resist forces and moments. When the normal or tangential contact force exceeds the bond strength, the bond breaks, resulting in tensile or shear micro-cracks. At this point, only the linear elements are active, and the parallel bond model degenerates into a linear model. The stress expressions are as follows:
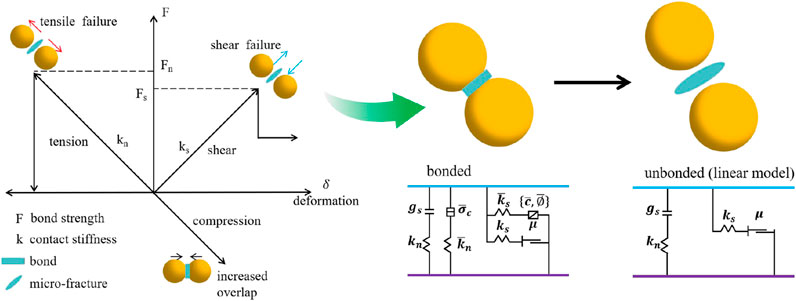
Figure 13. Principle of the parallel bonding model (Sun et al., 2024; Song et al., 2021).
In the equations,
The method used in this study to simulate preformed holes and cracks in the DEM involves generating wall elements in the DEM with the same dimensions as the cracks and holes used in the laboratory experiments. Geometry elements are then embedded within these wall elements, and the ball particles within the range of the geometry elements are deleted using programming language. Subsequently, the wall elements and geometry elements are removed, thereby forming a numerical model of sandstone with preformed holes, cracks, and other features. During the loading process of the model, the loading plate is controlled to apply load at a constant velocity, with a displacement loading rate of 0.01 m/s (due to differences in damping, the loading rate in the simulation differs from that in the laboratory experiments; the selected value falls within the range of quasi-static loading rates). This setup is used to conduct uniaxial compression numerical simulations, as shown in Figure 14.
A comprehensive rock model, identical in size to the laboratory experiment, was constructed, involving 41,813 particles and 187,330 contact bonds. Table 2 displays the results of the “trial and error method” (Tan et al., 2021) used to calibrate the model’s microscopic parameters. In Figure 15A, the stress-strain curves from the simulation and the extensive rock experiment were compared to evaluate the correctness of the microscopic parameters. Furthermore, the maximum strengths and failure modes of the three hole-fracture samples from both the experiment and simulation were compared (Figure 15B).
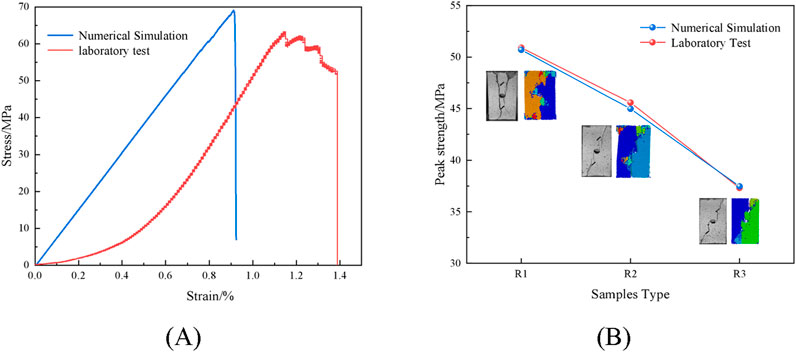
Figure 15. Model validation (A) Stress-strain curve comparison of intact sandstone (B) Comparison of peak strength and failure modes between holes and fractures sandstones.
Figure 15A suggests that reproducing the natural microfractures observed in the rock was challenging because of the way particles in the discrete element model created cohesive forces via extra bonding factors. Accordingly, little variation between the peak stress and elastic modulus of the whole samples occurred in the simulation and experiment when the crack closure step was ignored (Shi Z. et al., 2023; Fan et al., 2022). The simulation and experiment’s hole-fracture samples possessed almost identical peak strengths, and their failure modes were comparable, as demonstrated in Figure 15B. Thus, the microscopic parameters were realistic.
Figures 16, 17 illustrate the distributions of the force chain field and displacement field at 50% pre-peak stress (A), peak stress (B), 75% post-peak stress (C), 50% post-peak stress (D), and 25% post-peak stress (E) for analysis. For a more intuitive representation, a unified scale is adopted during the analysis.
The thickness of the force chains indicates the strength of the contact force distribution in the model, while the force chain field represents the networks and routes via which particles transfer forces through mutual contacts. The displacement field denotes particle mobility and encapsulates the macroscopic deformation of the rock subjected to stress. As the stress was applied from A to B, the force chains around the prefabricated holes and fractures started to concentrate, leading to fluctuations in the displacement fields of samples R2 and R3. As the stress intensified from B to C, the force chains around the holes and cracks grew thicker, whilst those at the rock bridge locations became sparse, reflecting the formation of multiple micro-fractures. The displacement fields of all samples began to oscillate on either side of the hole-fracture rock bridges. From C to E, the force chain fields on each side of the rock bridges diminished progressively. Under stress, the displacement of particles on either side of the rock bridges progressively rose and became more evident as the horizontal distances between the holes and fractures increased.
Micro-fractures may accurately replicate the instability behavior of granular systems, and their emergence signifies the failure of bonding between particles. Figure 18 presents an examination of the micro-fracture distribution features at peak stress, 75% post-peak stress, 50% post-peak stress, and 25% post-peak stress for the samples discussed in the preceding section. During the maximum stress phase, only a limited number of micro-fractures commenced in sample R1. Conversely, samples R2 and R3 exhibited unique fracture zones along the trajectories of their hole-fracture structures. Upon reaching 75% of post-peak stress, many micro-fractures were evident in the hole-fracture rock bridge region of sample R1, while sample R2 demonstrated first damage at its extremities, and the micro-fractures in sample R3 persisted in propagating along the predefined fracture zone trajectories. As unloading progressed from 75% post-peak stress to 25% post-peak stress, the micro-fracture formation pattern in sample R1 revealed increased randomness and broader distribution. Micro-fractures in sample R2 mostly developed inside the fracture zone and the top region of the sample, while the routes of the hole-fracture structures in sample R3 were followed by the micro-fractures. The internal stresses and strains inside the rock may be inferred from the distribution pattern of micro-fracture inclinations in various directions. The micro-fracture inclination distribution for each sample was analyzed, as illustrated in Figure 19. Among them, the number of micro-fractures is represented by the radial direction, the micro-fracture angle is denoted by the circumferential direction, and the tensile and shear micro-fractures are indicated by the blue and green discs, respectively. Tensile failure predominated in the hole-fracture samples, with shear failure as a supplementary feature. Within each sample, the majority of the tensile microfractures occurred between 60° and 120° and 240° and 300°. The quantity of shear micro-fractures in each direction varied very little for sample R1. However, the quantity of shear microfractures for samples R2 and R3 was relatively low in the 60°∼120° and 240°–300°directions. This might be because the increasing space between the fractures and holes brought about a certain conjugate connection between tensile and shear microfractures.
Considering the constraints of laboratory experimental circumstances, nine rock models with varying horizontal spacings between holes and fractures were created in DEM numerical simulations (Figure 20A) to ascertain the distribution of micro-fractures after full failure (Figure 15B). The peak strength and variations in the quantity of micro-fractures for each sample were documented (Figure 16).
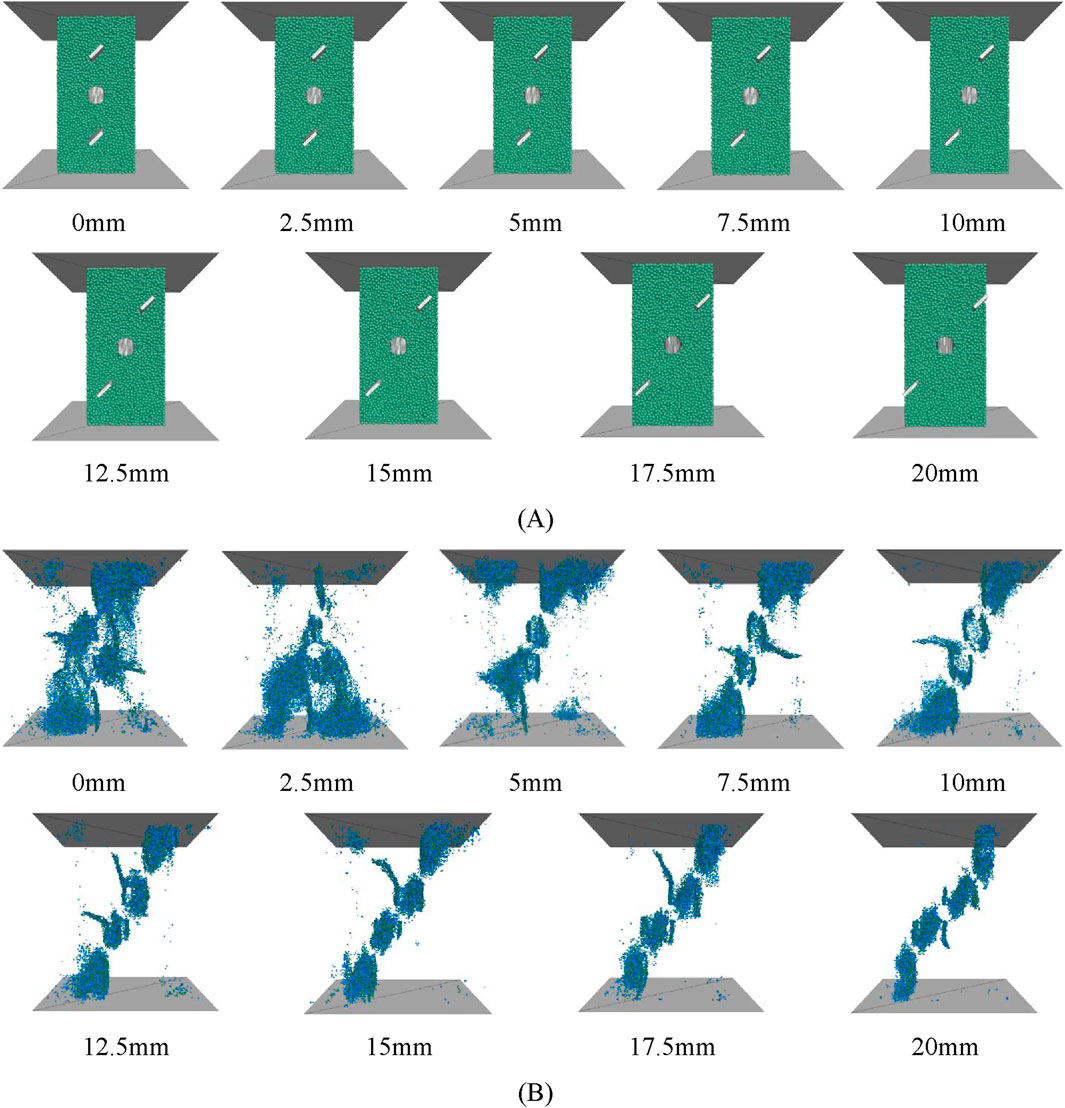
Figure 20. Rock numerical models with different horizontal spacings between holes and fractures (A) Schematic diagram of hole-fracture distribution in the model (B) Distribution of micro-fractures in the model.
Figure 20B specifies that an increase in horizontal spacing between holes and fractures led to a progressive shift in the micro-fracture production pattern from a broad and irregular distribution to a “clustering-expansion-coalescence” configuration along the trajectories of the hole-fracture structures. The augmentation of spacing compromised the load-bearing integrity of the rock, diminished its effective load-bearing surface, and provoked an intensified concentration of micro-fractures along the trajectories of the pre-existing fractures. The resultant macroscopic fracture zones were more prone to interconnect via the rock bridges, contributing to the curtailed final load-bearing capacity of the samples (Figure 21A). The Logistic fitting curve indicates that peak strength presented a pattern of “gradual decrease-steep decrease-gradual decrease” as horizontal spacing increased. With respect to Figure 21B, it is evident that the sample strength entered the “steep decrease” phase, when the spacing was below 10 mm, with notable variations in failure modes and changes in the quantity of micro-fractures. The formation of micro-fractures became more concentrated along the defined trajectory of “upper fracture-medium hole-lower fracture” when the gap surpassed 10 mm, resulting in a more uniform failure mode. Consequently, the quantity of micro-fractures decreased, and the peak strength of the sample shifted into the “gradual decrease” phase.
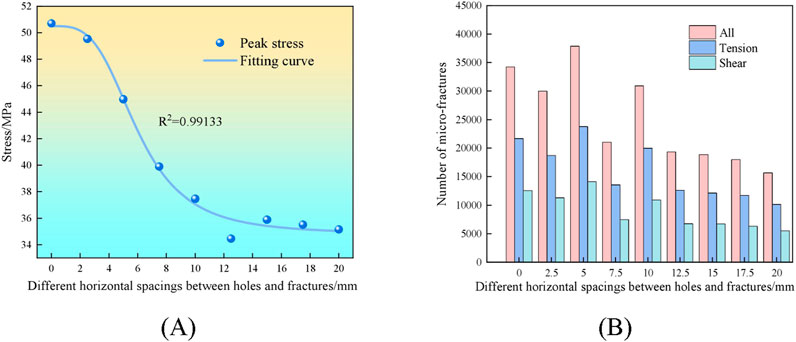
Figure 21. Variation in peak strength and number of micro-fractures of samples with different hole-fracture horizontal spacing (A) Change in peak strength (B) Change in the number of micro-fractures.
This research involved the construction of three kinds of sandstone samples with varying horizontal spacings between holes and cracks. Our research group examined the deformation evolution and fracture propagation features of the samples using DIC and CT methods. A micro-scale investigation was performed through DEM numerical simulations to explore the interaction processes between holes and fractures in faulty rocks. The findings are derived as follows.
(1) As the horizontal spacing between holes and fractures increased from 0 mm to 10 mm, the ultimate load-bearing capacity and deformation resistance of the samples decreased, as evidenced by a reduction in peak strength and elastic modulus.
(2) CT scanning data and surface deformation characteristics suggest that the rock’s failure mode changed from a sluggish mixed tensile-shear failure to a rapid tensile failure when the horizontal separation between holes and fractures increased. The formation of rock bridges was mostly triggered by tensile failure resulting from tensile wing fractures. The simplified pathways of crack propagation from the outside to the interior of the sandstone facilitated the connection of holes and fractures, leading to accelerated instability and failure of the samples.
(3) DEM numerical simulations unveil that an increase in horizontal distance between holes and fractures reinforced particle mobility inside the samples and influenced the inclination distribution of micro-fractures. The production pattern of micro-fractures evolved from a broad, uneven distribution to a process of “clustering-expansion-coalescence” along the paths of the hole-fracture structures. As the spacing increased, the peak strength of the hole-fracture samples demonstrated a pattern of “gradual decrease, steep decrease, gradual decrease.”
The original contributions presented in the study are included in the article/supplementary material, further inquiries can be directed to the corresponding author.
PL: Funding acquisition, Resources, Supervision, Writing–review and editing. LS: Writing–original draft. CP: Funding acquisition, Writing–review and editing. PJ: Writing–review and editing. HL: Writing–review and editing.
The author(s) declare that financial support was received for the research, authorship, and/or publication of this article. This research was funded by the Open Research Fund of the State Key Laboratory of Coal Resources and Safe Mining, CUMT (No. SKLCRSM22KF017), Geological Environment and Underground Space Engineering Research Center of Jiangxi Province (JXDHJJ2022-07), the Scientifc Research Foundation for High-level Talents of Anhui University of Science and Technology (No. 2022yjrc80), the National Natural Science Foundation of China (Nos. 52074006, 52304075), Natural Science Research Project of Anhui Educational Committee (No. 2023AH051227).
Author PL was employed by Postdoctoral Research Station of Shandong Huaning Mining Group Co., Ltd. Author HL was employed by Zhejiang High Energy Blasting Engineering Co., Ltd.
The remaining authors declare that the research was conducted in the absence of any commercial or financial relationships that could be construed as a potential conflict of interest.
The author(s) declare that no Generative AI was used in the creation of this manuscript.
All claims expressed in this article are solely those of the authors and do not necessarily represent those of their affiliated organizations, or those of the publisher, the editors and the reviewers. Any product that may be evaluated in this article, or claim that may be made by its manufacturer, is not guaranteed or endorsed by the publisher.
Brideau, M., Yan, M., and Stead, D. (2009). The role of tectonic damage and brittle rock fracture in the development of large rock slope failures. Geomorphology 103 (1), 30–49. doi:10.1016/j.geomorph.2008.04.010
Deng, Z., Liu, X., Liu, Y., Liu, S., Han, Y., Tu, Y., et al. (2020). Cumulative damage evolution and failure modes of the bedding rock slope under frequent microseisms. Arab. J. Geosci. 13, 384(10). doi:10.1007/s12517-020-05299-6
Fan, X., Yu, H., Deng, Z., He, Z., and Zhao, Y. (2022). Cracking and deformation of cuboidal sandstone with a single nonpenetrating flaw under uniaxial compression. Theor. Appl. Fract. Mech. 119, 103284. doi:10.1016/j.tafmec.2022.103284
Gu, D., and Zhou, D. (2017). Numerical simulation of propagation and coalescence of cracks using peridynamic theory. Rock Soil Mech. doi:10.16285/j.rsm.2017.02.038
Huang, D., Bai, T., and Zhong, Z. (2023). Fracture behavior and size effect in fissure extensiondirection of rock mass containing two intermittent fissures with their strikes in different surfaces. J. Eng. Geol. 31 (06), 1881–1890. doi:10.13544/j.cnki.jeg.2022-0680
Huang, D., Cen, D., Ma, G., and Huang, R. (2015). Step-path failure of rock slopes with intermittent joints. Landslides 12, 911–926. doi:10.1007/s10346-014-0517-6
Huang, Y., and Yang, S. (2016). Particle flow analysis on crack coalescence behavior of sandstonespecimen containing three pre-existing fissures under uniaxial compression. J. Basic Sci. Eng. (6), 1232–1247. doi:10.16058/j.issn.10050930.2016.06.014
Jia, L., Chen, M., and Jin, Y. (2014). 3D imaging of fractures in carbonate rocks using X-ray computed tomography technology. Carbonates Evaporites 29 (2), 147–153. doi:10.1007/s13146-013-0179-9
Jing, L. (2003). A review of techniques, advances and outstanding issues in numerical modelling for rock mechanics and rock engineering rock mechanics and rock engineering. Int. J. Rock Mech. Min. 40 (3), 283–353. doi:10.1016/s1365-1609(03)00013-3
Ju, M., Li, J., Yao, Q., Li, X., and Zhao, J. (2019). Rate effect on crack propagation measurement results with crack propagation gauge, digital image correlation, and visual methods results with crack propagation gauge, digital image correlation, and visual methods. Eng. Fract. Mech. 219, 106537. doi:10.1016/j.engfracmech.2019.106537
Li, D., Li, X., Li, C., and Wang, Y. (2011). Experimental and numerical studies of mechanicalresponse of plate-shape granite samples containing prefabricated holes under uniaxial compression. Chin. J. Rock Mech. Eng. 30 (06), 1198–1206.
Li, J., Yuan, W., Li, H., and Zou, C. (2022). Study on dynamic shear deformation behaviors and test methodology of sawtooth-shaped rock joints under impact load methodology of sawtooth-shaped rock joints under impact load. Int. J. Rock Mech. Min. 158, 105210. doi:10.1016/j.ijrmms.2022.105210
Li, Z., and Zhang, G. (2019). Fracture segmentation method based on contour evolution and gradient direction consistency in sequence of coal rock CT images Direction consistency in sequence of coal rock CT images. Math. Probl. Eng. 2019, 2980747. doi:10.1155/2019/2980747
Lin, Q., Cao, P., Cao, R., Lin, H., and Meng, J. (2020). Mechanical behavior around double circular openings in a jointed rock mass under uniaxial compression. Arch. Civ. Mech. Eng. 20 (1), 19. doi:10.1007/s43452-020-00027-z
Liu, J., Sun, S., Yue, L., Wei, J., and Wu, J. (2017). Mechanical and failure characteristics of rock-like material with multiple crossed joint sets under uniaxial compression. Adv. Mech. Eng. 9, 168781401770871. doi:10.1177/1687814017708710
Liu, W., Cheng, W., Liu, X., Zhang, Z., Yue, Z., Yang, L. Y., et al. (2024). Effects of loading rate and notch geometry on dynamic fracture behavior of rocks containing blunt V-notched defects loading rate and notch geometry on dynamic fracture behavior of rocks containing blunt V-notched defects. Rock Mech. Rock Eng. 57, 2501–2521. doi:10.1007/s00603-023-03693-6
Liu, X., Zhang, K., Li, N., Qi, F., and Ye, J. (2021). Quantitative identification of the failure behavior of the 3D printed rock-like specimen with one hole and two flaws. Rock Soil Mech. Mech. 11 (42). doi:10.16285/j.rsm.2021.0521
Lu, W., Zhu, Z., He, Y., and Que, X. (2021). Strength characteristics and failure mechanism of a columnar jointed rock mass under uniaxial, triaxial, and true triaxial confinement. Rock MechRock Eng. 54 (3), 2439. doi:10.1007/s00603-021-02400-7
Ma, J., Jiang, N., Wang, X., Wang, X., Jia, X., and Yao, D. (2021). Numerical study of the strength and characteristics of sandstone samples with combined double hole and double fissure defects and characteristics of sandstone samples with combined double hole and double fissure defects. Sustainability 13 (13), 7090. doi:10.3390/su13137090
Misra, A. (1999). Micromechanical model for anisotropic rock joints. J. Geophys. Res. Sol. Ea. 104, 23175–23187. doi:10.1029/1999jb900210
Pan, C., Liu, W., Wang, X., Meng, X., Cheng, B., and Sarfarazi, V. (2024). Mechanics and fracture behavior of rocks with triangular holes: experimental and numerical studies. Comput. Part, 1–15. doi:10.1007/s40571-024-00832-w
Potyondy, D., and Cundall, P. (2004). A bonded-particle model for rock. Int. J. Rock Mech. Min. 41 (8), 1329–1364. doi:10.1016/j.ijrmms.2004.09.011
Shi, H., Chen, W., Zhang, H., Song, L., Li, M., Wang, M., et al. (2023). Dynamic strength characteristics of fractured rock mass. Eng. Frac. Mech. 292, 109678. doi:10.1016/j.engfracmech.2023.109678
Shi, Z., Li, J., Wang, J., Chen, J., Lin, H., and Cao, P. (2023). Experimental and numerical study on fracture characteristics and constitutive model of sandstone under freeze-thaw-fatigue fracture characteristics and constitutive model of sandstone under freeze-thaw-fatigue. Int. J. Fatigue 166, 107236. doi:10.1016/j.ijfatigue.2022.107236
Song, Y., Sun, Y., and Li, C. (2021). Study on meso-fracture evolution characteristics of sandstone after freeze-thaw cycles based on discrete element method simulation. Rock Soil Mech. 44 (12), 3602–3616. doi:10.16285/j.rsm.2023.0448
Sun, H., Du, W., and Liu, C. (2021). Uniaxial compressive strength determination of rocks using X-ray computed tomography and convolutional neural networks ray computed tomography and convolutional neural networks. Rock Mech. Rock Eng., 54, 4225–4237. doi:10.1007/s00603-021-02503-1
Sun, L., Lou, P., Pan, C., and Ji, P. (2024). Mechanical properties and DEM-based simulation of double-fractured sandstone under cyclic loading and unloading double-fractured sandstone under cyclic loading and unloading. Sustainability 16, 9000. doi:10.3390/su16209000
Tan, P., Rao, Q., Li, Z., Zhang, Q., and Yi, W. (2021). A new method for quantitative determination of PFC3D microscopic parameters cnsidering fracture toughness. J. Cent. South Univ. (Sci.Technol.) 52 (8), 2849–2866. doi:10.11817/j.issn.1672-7207.2021.08.030
Wu, J., Jing, H., Yin, Q., Yu, L., Meng, B., and Li, S. (2020). Strength prediction model considering material, ultrasonic and stress of cemented waste rock backfill for recycling gangue material, ultrasonic and stress of cemented waste rock backfill for recycling gangue. J. Clean.Prod 276, 123189. doi:10.1016/j.jclepro.2020.123189
Wu, J., Wong, H. S., Zhang, H., Yin, Q., Jing, H., and Ma, D. (2024). Improvement of cemented rockfill by premixing low-alkalinity activator and fly ash for recycling gangue and partially replacing cement replacing cement. Cem. Concr. Compos. 145, 105345. doi:10.1016/j.cemconcomp.2023.105345
Wu, T., Gao, Y., Zhou, Y., and Li, J. (2020). Experimental and numerical study on the interaction between holes and fissures in rock-like materials under uniaxial compression between holes and fissures in rock-like materials under uniaxial compression. Theor. Appl. Fract. Mec. 106, 102488. doi:10.1016/j.tafmec.2020.102488
Yi, H. (2021). Numerical simulation research on mechanical properties of sandstone with combined defects of holes and cracks. Dissertation. DaLian. (LiaoNing): Dalian Maritime University.
Zhao, X., Zhang, H., and Zhu, W. (2014). Fracture evolution around pre-existing cylindrical cavities in brittle rocks under uniaxial compression in brittle rocks under uniaxial compression. Chin. J. Nonferrous Met. 24 (3), 806–815. doi:10.1016/S1003-6326(14)63129-0
Keywords: hole-fracture sandstone, DIC, CT scanning, discrete element method, crack propagation
Citation: Lou P, Sun L, Pan C, Ji P and Liu H (2025) Experimental and discrete element method study on the mechanical properties of hole-fracture sandstone. Front. Mater. 11:1535986. doi: 10.3389/fmats.2024.1535986
Received: 28 November 2024; Accepted: 24 December 2024;
Published: 22 January 2025.
Edited by:
Jiangyu Wu, China University of Mining and Technology, ChinaReviewed by:
Xiaodong Tan, Southwest University, ChinaCopyright © 2025 Lou, Sun, Pan, Ji and Liu. This is an open-access article distributed under the terms of the Creative Commons Attribution License (CC BY). The use, distribution or reproduction in other forums is permitted, provided the original author(s) and the copyright owner(s) are credited and that the original publication in this journal is cited, in accordance with accepted academic practice. No use, distribution or reproduction is permitted which does not comply with these terms.
*Correspondence: Cheng Pan, Y3BhbjE5ODlAMTYzLmNvbQ==
Disclaimer: All claims expressed in this article are solely those of the authors and do not necessarily represent those of their affiliated organizations, or those of the publisher, the editors and the reviewers. Any product that may be evaluated in this article or claim that may be made by its manufacturer is not guaranteed or endorsed by the publisher.
Research integrity at Frontiers

Learn more about the work of our research integrity team to safeguard the quality of each article we publish.