 Zhengfeng He
 Zhuofan Wu2
- 1Cangzhou Qugang Expressway Construction Co., Ltd., Hebei, China
- 2School of Civil Engineering, Tianjin University, Tianjin, China
- 3Fujian Zhanglong Construction Investment Group Co., Ltd., Fujian, China
- 4School of Civil Engineering and Mechanics, Yanshan University, Hebei, China
As demand for sustainable building materials rises, the use of waste rubber in civil engineering is gaining attention. This study proposes a method to modify waste rubber using polyvinyl alcohol (PVA) to enhance its material properties and expand its applications. A dataset was created focusing on the mechanical strength of cementitious materials incorporating PVA-modified waste rubber, and multiple machine learning methods were used to develop regression prediction models, particularly evaluating the support vector regression (SVR) model. Results show that the SVR model outperforms others, achieving mean squared errors of 1.21 and 0.33, and mean absolute errors of 2.06 and 0.15. Analysis indicates a negative correlation between waste rubber content and the water-to-cohesive ratio (w/c) with strength indexes, while a positive correlation exists between curing age and PVA. Notably, waste rubber content significantly affects strength. The mechanical strength of cementitious materials was notably enhanced by PVA-modified waste rubber, likely due to PVA's dispersion and bridging effects. This study presents a novel approach to sustainably recycle waste rubber, highlighting its potential in construction materials.
1 Introduction
The rapid economic development in our country has resulted in it becoming the world’s largest consumer and producer of rubber and rubber products, leading to a significant increase in the generation of waste rubber (Xiao et al., 2009; Ossola and Wojcik, 2014; Thomas and Gupta, 2015; Chen et al., 2019). In the construction field, waste rubber has been proven to be an effective additive for preparing construction materials with specific applications (Lisi et al., 2004; Sukontasukkul, 2009; Richardson et al., 2011). However, the incorporation of waste rubber can impair the mechanical properties of cement-based materials (Eldin and Senouci, 1993; Mendis et al., 2017; Li et al., 2020; Steyn et al., 2021; Mhaya et al., 2021). Recent research has focused on improving rubberized concrete by surface treatments of waste rubber. Dong et al. applied silane coupling agents to enhance performance of rubber (Dong et al., 2013). Kumar et al. found sulfuric acid treatment improved the bonding of rubber with cement paste (Kumar and Dev, 2021), while He et al. validated urea, sulfonation, and NaOH modifications for better bonding (He et al., 2021). Notably, studies have shown that PVA, widely used as a construction adhesive in the building industry, not only adsorbed rubber molecules effectively but was also non-toxic and environmentally friendly (Fan et al., 2019; Yu et al., 2020). Therefore, to further enhance the application of PVA-modified waste rubber in the construction industry, it is crucial to conduct research aimed at improving its mechanical properties.
Additionally, to better guide engineering practices, many researchers are now using machine learning models to develop and analyze regression prediction models (Tu et al., 2022). In the field of civil engineering, the in-depth application of machine learning has greatly advanced the discipline (Papazek et al., 2020; Zhou, 2022). The most frequent research involving machine learning focuses on establishing regression models for the mechanical properties of concrete, such as compressive strength and flexural strength (Konstantopoulos et al., 2020; Cook et al., 2021; Zhang et al., 2021). (Li et al., 2024) used ultra-high performance concrete (UHPC) as the target object and identified cement, silica fume, steel fibers, mineral powder, water-reducing agents, defoamers, and water as the feature factors, then developed a nonlinear regression model to predict the 28-day compressive strength of UHPC. They employed Random Forest Regression (RF), Support Vector Machine Regression (SVR), and Multi-Layer Perceptron Regression (MLP) models, and found that the SVR and MLP models outperformed the RF model, with predictions falling within a 5% confidence interval. Asteris et al. (2021) established a large database considering the age of mortar, water-cement ratio, particle size distribution, plasticizers, and cement grade, and discussed the applicability of SVR, RF, Decision Tree (DT), AdaBoost, and k-Nearest Neighbors (KNN) models in predicting the compressive strength behavior of cement mortar, concluding that RF and AdaBoost models demonstrated the best regression prediction capabilities. Huang et al. (2021) were the first to use machine learning methods to predict the mechanical properties of carbon nanotube (CNT)-reinforced cement-based composites, and they extensively tuned the model parameters to achieve optimal prediction results. Sensitivity analysis using the Jacobian matrix indicated that the length of CNTs had the most significant effect on the compressive strength of the composites, while curing time had the greatest impact on the flexural strength, providing a solid basis for future experimental mix optimization and condition design. Guan et al. (2022) proposed a machine learning framework to predict the hardness, transverse rupture strength, and fracture toughness of WC-Co alloys, analyzing the prediction accuracy of KNN, MLP, RF, SVR, and Stacking Regressor (STK) models. Their report showed that the MLP model outperformed other models in predicting fracture performance. The results reaffirm the remarkable significance of machine learning in guiding the design of new materials (Lunt, 2015).
Therefore, this paper proposed a method utilizing PVA-modified waste rubber to establish a strength index database for cement-based materials filled with PVA-modified waste rubber and used various machine learning methods to develop regression prediction models. It analyzed the robustness of different feature factors on strength, thereby providing theoretical guidance for engineering practice. This research not only achieved the harmless disposal of waste tire rubber but also expanded the application range of waste rubber in civil engineering, carrying substantial practical significance.
2 Materials and methodology
2.1 Materials
2.1.1 Ordinary portland cement (OPC)
The cement used in this study is P.O 42.5 cement produced by Tianjin Jidong Cement Co., Ltd., which conformed to the national standard GB175-2007. The cement exhibited a deep gray granular appearance. The chemical composition was provided in Table 1, and the XRD analysis results were presented in Figure 1.

Table 1. Chemical and mineral composition of OPC.
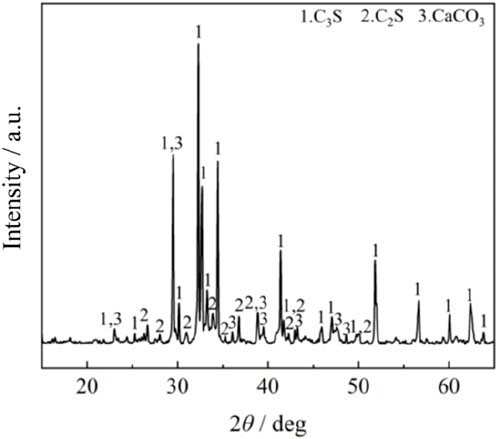
Figure 1. XRD analysis results of OPC.
2.1.2 Waste rubber particles
The waste rubber particles used in this study were produced by Tianjin Kewei Rubber Factory, with an apparent density of 1,050 kg/m3. The maximum particle size of the waste rubber was 2.5 mm, with over 80% of the particles having a size between 1 and 2 mm. Additionally, the chemical composition of the waste rubber particles was detailed in Table 2, and their morphology was shown in Figure 2.

Table 2. Chemical and mineral composition of the waste rubber particles.

Figure 2. The morphology of the waste rubber particles.
2.1.3 Polyvinyl alcohol (PVA) powder
The PVA used in this study was produced by Shandong Yousuo Chemical Technology Co., Ltd. and was characterized by low water solubility. The macroscopic appearance of the PVA was a white powder with a mesh size of 160, while the microscopic morphology exhibited a particulate structure, as shown in Figure 3.
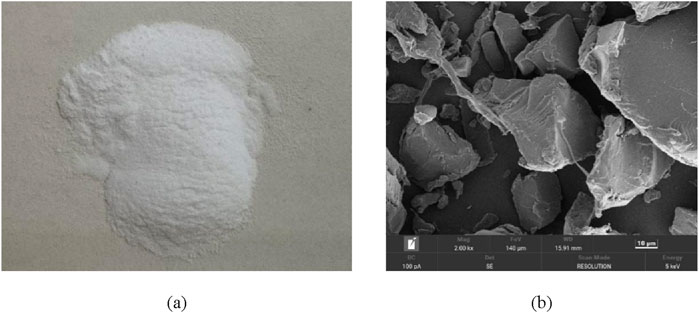
Figure 3. The morphology of PVA: (A) macro-morphology; (B) micro-morphology, ×2000.
2.1.4 Other chemical reagents
The chemical reagent used in this study was primarily isopropanol, employed to terminate the cement hydration process. Detailed information was provided in Table 3.
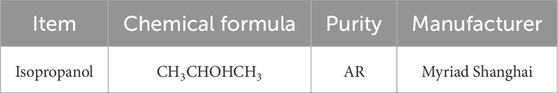
Table 3. Detailed information of the isopropanol.
2.2 Macro-experimental methodology
2.2.1 Preparation of PVA solution
The modifier used in this study was a PVA solution with a mass fraction of 0.1%. However, PVA was not readily soluble in water at room temperature. Therefore, the preparation of the PVA solution was carried out using a constant-temperature magnetic stirrer, with the temperature set at 75°C, as shown in Figure 4.
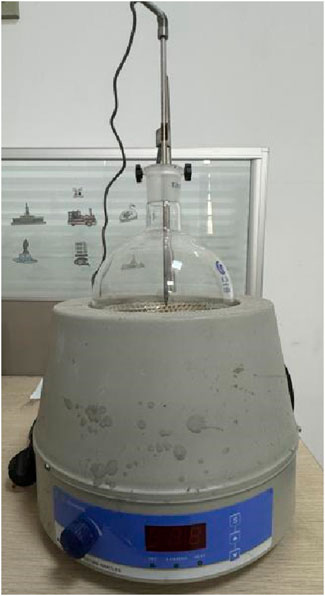
Figure 4. The constant-temperature magnetic stirrer.
2.2.2 Tests for mechanical properties
The fundamental performance of cement-based materials was the mechanical properties. In this study, the mechanical properties of the specimens were tested using a YAW-300C fully automatic compression testing machine produced by Jinan Shidai Test Machine Co., Ltd. The strength indicators obtained from the experiments (compressive strength and flexural strength) were used as the dataset for the machine learning models.
2.3 Machine learning models
2.3.1 Least-squares linear regression
Linear regression (LR) is one of the most basic and straightforward regression models, which considers a linear relationship between the objective function and various influencing factors. The schematic representation of LR regression was shown in Figure 5 (Lunt, 2015; Cai et al., 2020). In the LR algorithm, a series of coefficient values corresponding to different influencing factors were provided to represent the feature values through a linear combination. The mathematical expression is given below:
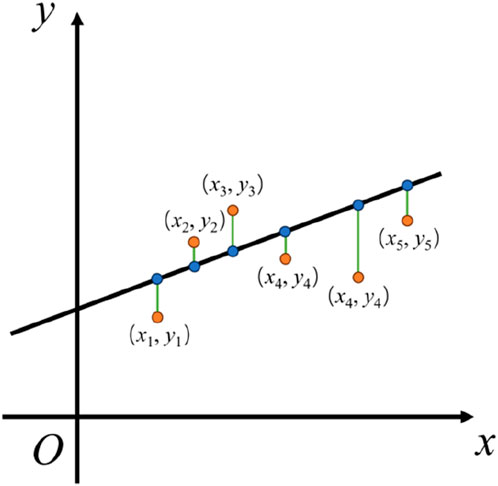
Figure 5. Schematic diagram of LR calculation.
Where, ŷ represents the predicted value, ω0, ω1, ., ωp represent the weight coefficients of different eigenvalues, and x1, ., xp represent the eigenvectors corresponding to different eigenvalues.
In LR algorithms, the least squares method is one of the most common and fundamental approaches. It addresses the following mathematical problem by minimizing the sum of the squared residuals between the observed targets from experimental data and the predicted targets obtained through linear regression:
Where, ω represents the weight coefficients, X represents the eigenvectors and y represents the true values.
2.3.2 Support vector machine regression
Support Vector Machine Regression (SVR) is a supervised learning algorithm that constructs a hyperplane or a set of hyperplanes in a high-dimensional or infinite-dimensional space to perform regression and outlier detection on experimental data (Moguerza and Muñoz, 2006). For a given set of regression data, its computational form was illustrated in Figure 6 (Yu et al., 2018; Biswas et al., 2023). It was generally believed that good separation was achieved by maximizing the margin between the hyperplane and the nearest training data points (known as the functional margin) in any class. Typically, a larger margin resulted in lower generalization error of the classifier.
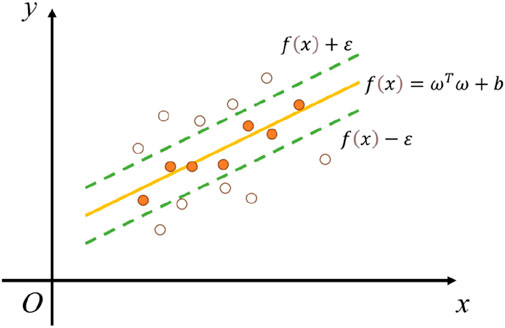
Figure 6. Schematic diagram of SVR calculation.
For a specific set of feature vectors (consisting of experimental data in this study), SVR can solve the following mathematical form of the problem:
With certain restrictions:
Where, ω represents the weight coefficient of the eigenvalues, b represents the deviation coefficient, C represents the penalty factor, ε is the given interval, ξi and ξi*, represents the introduction of slack variables.
In the SVR regression calculation process, the core component is the use of a kernel function for analytical computation. A kernel function is a type of function that takes vectors from the original space as input and returns the dot product of vectors in the feature space (where the transformed data space may be high-dimensional). The choice of kernel function significantly affects the final computation results and prediction accuracy in SVR. Common kernel functions include the Linear kernel function, Polynomial kernel function, Gaussian Radial Basis Function (RBF), and Sigmoid function. Their functional expressions are as follows.
(1) Linear kernel function:
(2) Polynomial function:
Where, γ is the tuning parameter of the polynomial function, r is an optional constant, and d is the highest order term of the polynomial function.
(3) Gaussian radial basis function:
Where, γ is the tuning parameter.
(4) Sigmoid function:
Where, γ is the tuning parameter, r is an optional constant.
2.3.3 Random forest regression
Random Forest Regression (RF) is an averaging algorithm based on random decision trees (Lund et al., 2011; Liu K. et al., 2023). Unlike random decision trees, RF is not determined by specific feature values or combinations, thereby enhancing randomness and achieving better ensemble performance, resulting in lower variance and further mitigating overfitting issues during the fitting process (as shown in Figure 7) (Cook et al., 2021; Surehali et al., 2024). In a random forest, each tree is constructed from samples drawn with replacement (i.e., bootstrap samples) from the training set. When splitting each node, the best split is found from a randomly selected subset of all input features or their sizes. This approach enables RF to handle nonlinear data effectively and provides faster processing speeds. Additionally, RF can assess the interactions between feature factors during training and further analyze the importance of different feature factors, thus offering better guidance for engineering practice.
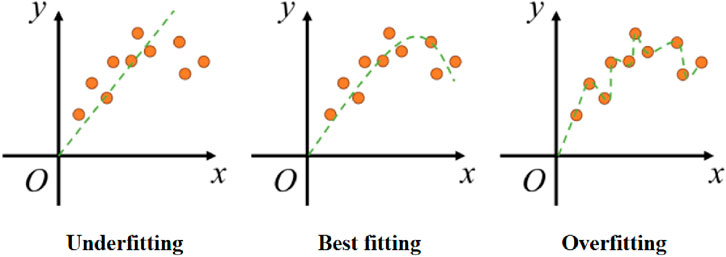
Figure 7. Fitting problems of machine learning models.
2.3.4 Integrated algorithmic regression
The implementation of Ensemble Regression involves combining multiple individual models to enhance machine learning performance, often resulting in better predictive outcomes compared to single models (Nilsen et al., 2019; Yang et al., 2024). In this study, the ensemble method employed involves simultaneously training the aforementioned SVR and RF models using the same training data. The final regression analysis decision is made based on a voting mechanism, where the principle of majority rule is applied to determine the outcome. This approach is used to evaluate the accuracy and effectiveness of the machine learning models under the ensemble regression framework (Han et al., 2020; Lapeyre et al., 2021).
2.3.5 Multilayer prceptron-artificial neural network regression
Artificial Neural Networks (ANNs) represent a category of machine learning models based on the neural synaptic networks of animals, used for distributed parallel information processing algorithms (Zhang, 2016; Kumar et al., 2024). The constructed neural network relies on the complexity of the system and adjusts the connections between internal data to achieve the intended information processing goals (Murthy et al., 2024; Liu et al., 2024).
The Multilayer Perceptron (MLP) is a fundamental type of artificial neural network. As a feedforward neural network, it consists of multiple layers of neurons and is commonly used for solving classification and regression problems. As shown in Figure 8, the most basic structure of an MLP comprises a single input layer, a single hidden layer, and a single output layer, with each layer consisting of one or more neurons. Each neuron performs a weighted sum of input values and produces an output through an activation function. During this process, MLP utilizes a backpropagation algorithm to recalculate the weights and biases between neurons, aiming to minimize the error between the predicted and actual outputs to achieve higher accuracy. During training, the gradient of the loss with respect to the weights is expressed as follows:
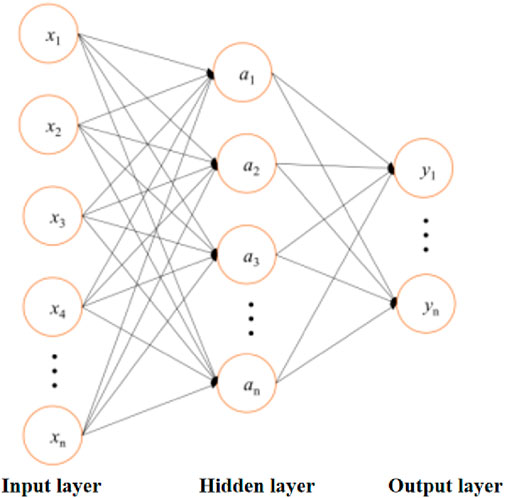
Figure 8. Basic structure of MLP-ANN.
2.4 Machine learning models
The evaluation of different machine learning models can be carried out through various evaluation metrics, including having mean absolute error (MAE), mean square error (MSE), root mean square error (RMSE), and correlation coefficient R2, which are mathematically expressed as follows:
Where, yi represents the true value, ŷi represents the predicted value, ӯi represents the mean of the true value, and n represents the number of samples.
3 Models establishment
3.1 Establishment of data sets
The data used in this study was derived from the compressive strength and flexural strength of cement-based materials filled with PVA-modified waste rubber. The influencing factors, or input features, include rubber content, water-to-cement (w/c) ratio, age, and the presence of PVA. Compressive strength and flexural strength were considered as the output variables. The rubber content values are 0%, 5%, 10%, 15%, 20%, and 25%; the w/c ratio were 0.3, 0.35, and 0.4; the ages were 3, 7, 14, and 28 days; and the presence of PVA was denoted by one and 2, representing 0% PVA and 0.1% PVA, respectively. Table 4 presented the characteristics of the collected data, including units, maximum values, minimum values, and averages. Figures 9, 10 illustrated the distribution of data in the compressive strength and flexural strength datasets, respectively.
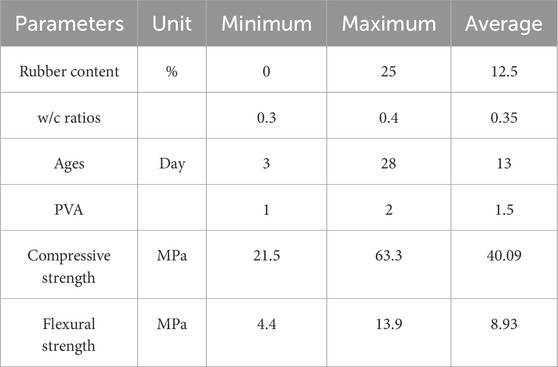
Table 4. Descriptive statistics of dataset characteristics.
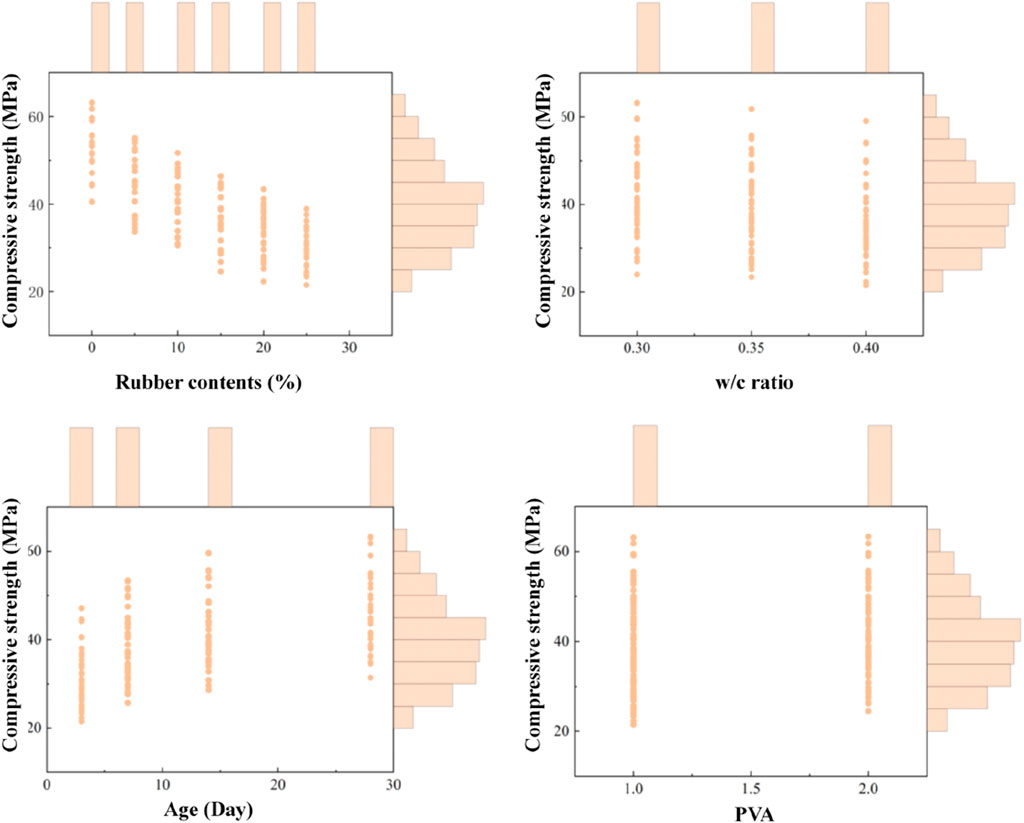
Figure 9. Distribution of data in the compressive strength dataset.
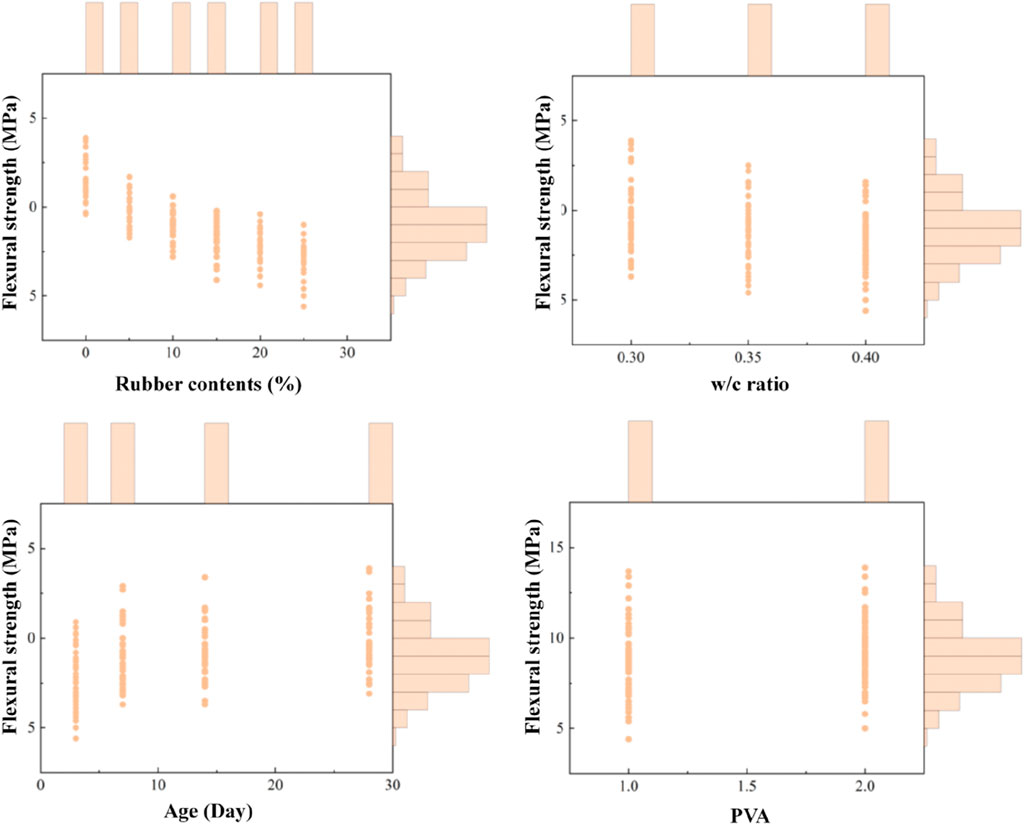
Figure 10. Distribution of data in the flexural strength dataset.
The accuracy of machine learning models is influenced by the input features; thus, it is necessary to conduct a correlation analysis of the influencing factors for both compressive strength and flexural strength models to verify their validity (Serban et al., 2024). In this study, Pearson correlation coefficients were used to analyze the correlations between the influencing factors (input features), with results presented in Figures 11, 12. The Pearson correlation analysis showed that, for both compressive strength and flexural strength models, the correlation coefficients between different influencing factors were close to 0, indicating that there was no significant correlation between the factors and that each factor was necessary and non-negligible (Janiesch et al., 2021).
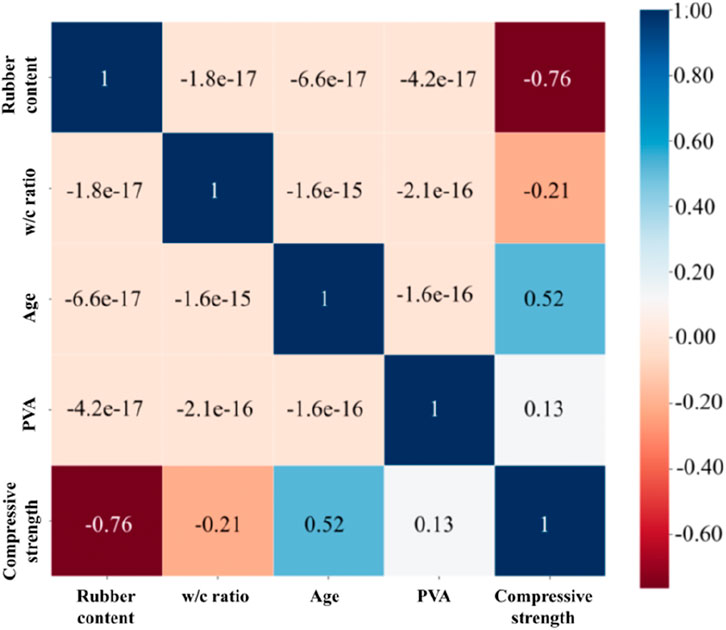
Figure 11. Analysis of Pearson’s correlation coefficient in compressive strength modeling.

Figure 12. Analysis of Pearson’s correlation coefficient in flexural strength modeling.
For both compressive strength and flexural strength, the rubber content was identified as the most influential factor, with correlation coefficients of −0.76 and −0.81, respectively. In contrast, the effect of PVA on compressive strength and flexural strength was relatively minor, with correlation coefficients of 0.13 and 0.17, respectively. Among the four influencing factors, rubber content and w/c ratio were negatively correlated with both compressive strength and flexural strength, while age and PVA exhibited a positive correlation with these properties. Specifically, an increase in rubber content and w/c ratio decreased the mechanical properties of PVA-modified waste rubber-filled cement-based materials, whereas an increase in age and the presence of PVA enhanced the mechanical properties of cement-based materials, consistent with the experimental results discussed earlier.
3.2 Development and tuning of machine learning models
In this study, the model was developed with a ratio of 1:3 between the test set and the training set, using 25% of the compressive strength and flexural strength dataset to evaluate the model’s accuracy and generalization ability.
Furthermore, considering the substantial mean differences among various influencing factors (as shown in Table 4), it was essential to standardize the dataset before training to ensure the effectiveness and accuracy of the machine learning models. The formula for data standardization was as follows:
Where, μ represents the mean of the feature data and σ represents the standard deviation of the feature data.
In each model, some hyperparameters needed to be adjusted to achieve superior predictive performance. In this study, hyperparameters were optimized using learning curves and grid search, considering cross-validation while exploring the given parameter combinations. Ten-fold cross-validation was employed in this study to iteratively adjust the hyperparameters of each model, improving the accuracy of the predictions to meet our requirements.
Figure 13 illustrated the principle of cross-validation. The 10-fold cross-validation used in this study involved randomly dividing the sample dataset into 10 subsets, using one subset as the test set while the remaining subsets were used as the training set. The mean squared error (MSE) of each iteration was averaged to evaluate the parameter adjustments and assess the accuracy of the model under the current hyperparameters, ultimately determining the optimal combination of hyperparameters.
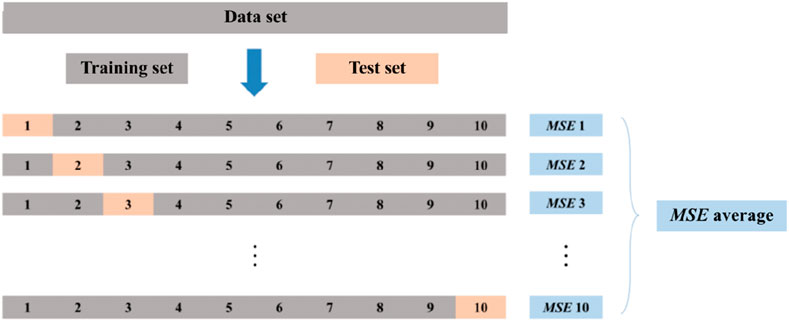
Figure 13. Schematic of 10-fold cross-validation.
In summary, the steps of a complete machine learning model implementation were shown in Table 5.
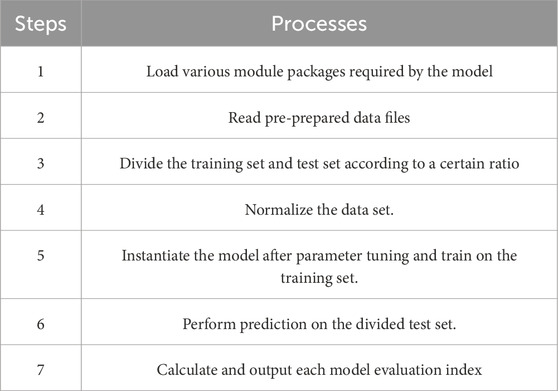
Table 5. Steps in machine learning model establishment.
4 Results and discussion
4.1 Model hyper-parameterization
Based on the results of 10-fold cross-validation, the final model parameters for this study, after multiple adjustments, were summarized in Table 6. The hyperparameters listed in Table 6 were determined using learning curves and grid search, while the hyperparameters for other models and those not listed were set to the default values. Notably, during the hyperparameter tuning of the SVR model, we observed that the gamma value for the compressive strength model was lower than that for the flexural strength model, whereas the C value was higher. This suggested that the SVR model was more prone to overfitting when predicting compressive strength, which adversely affected the prediction accuracy. Indeed, during model validation, overfitting was more prevalent in the predictions of compressive strength compared to flexural strength. Nevertheless, the issue was effectively addressed by 10-fold cross-validation.
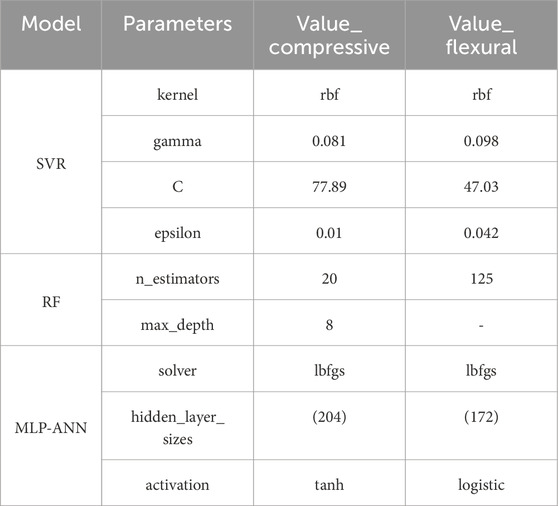
Table 6. Machine learning model hyper-parameterization.
4.2 Comparison of actual and predicted values
The actual values from the test set were compared with the predicted values generated by each model to visually assess the accuracy of the machine learning models’ predictions. Figures 14, 15 showed that, whether in the compressive strength regression prediction model or the flexural strength regression prediction model, all machine learning models exhibited excellent regression prediction capabilities. Specifically, all predicted values in the test set fall within ±20% of the actual values, with no outliers detected, indicating that the machine learning models demonstrated excellent regression prediction performance and were suitable for application and promotion in engineering practice.
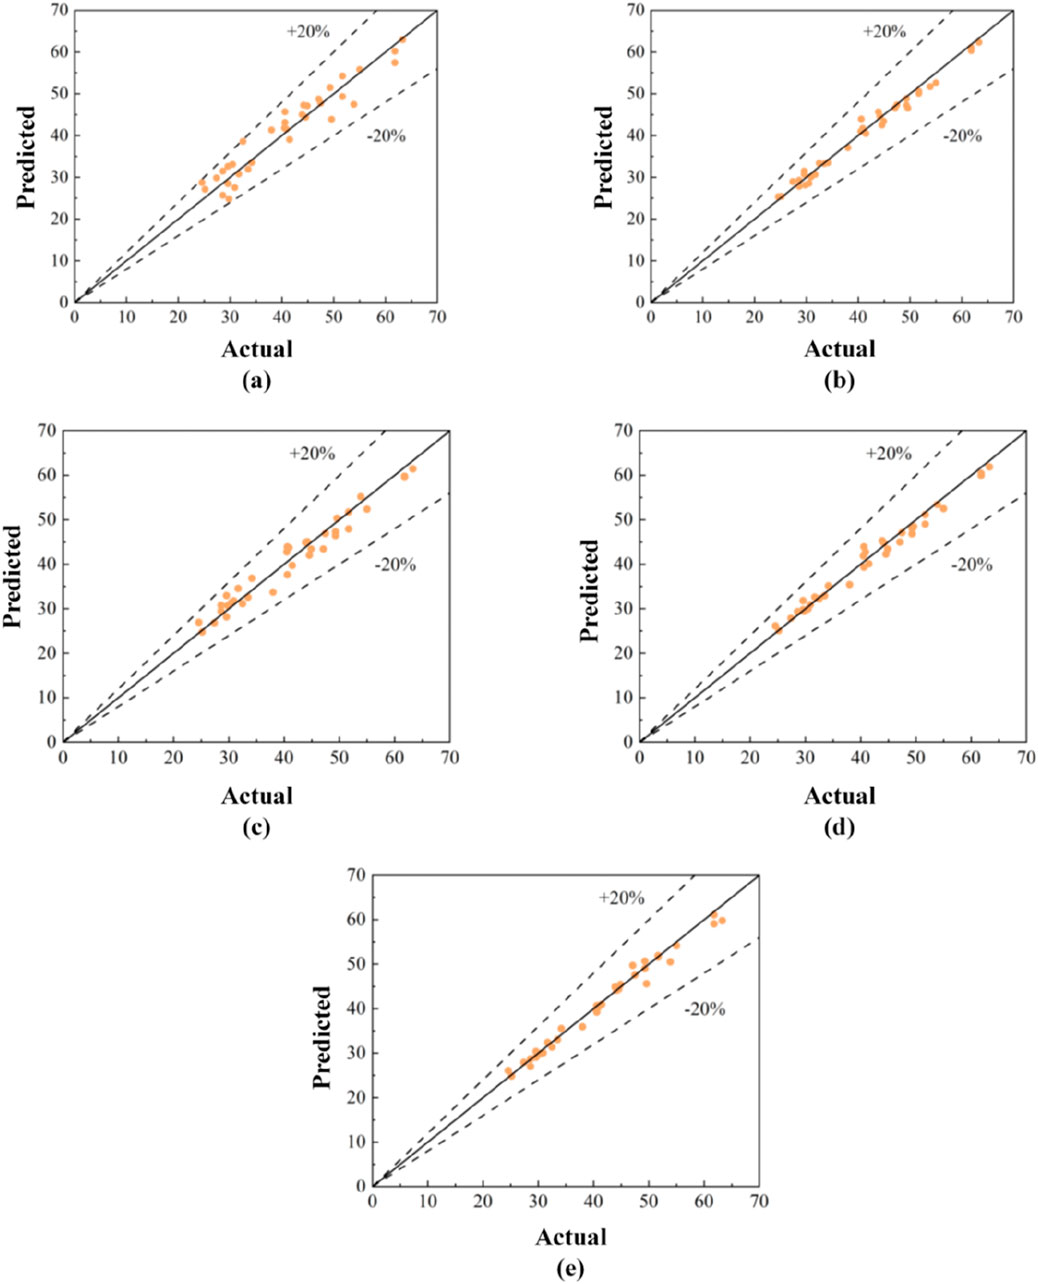
Figure 14. Comparison of actual and predicted values in the regression prediction model of compressive strength: (A) LR; (B) SVR; (C) RF; (D) Ensemble; (E) MLP-ANN.
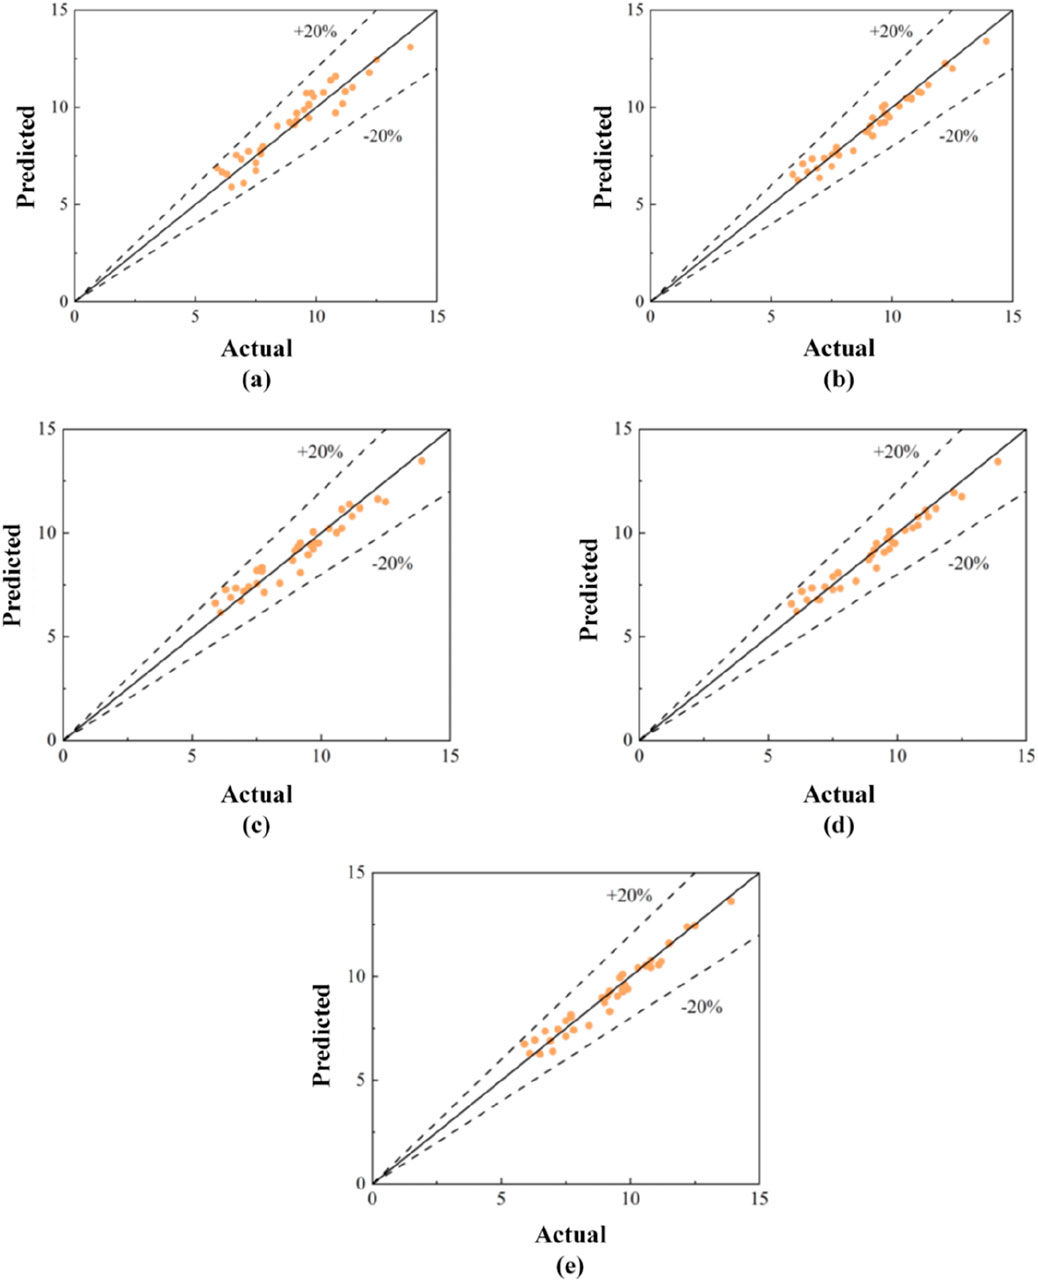
Figure 15. Comparison of actual and predicted values in the regression prediction model of flexural strength: (A) LR; (B) SVR; (C) RF; (D) Ensemble; (E) MLP-ANN.
4.3 Evaluation metrics analysis
Table 7 summarized the final evaluation metrics for the compressive strength and flexural strength regression prediction models to clearly analyze the regression prediction capabilities of different models.
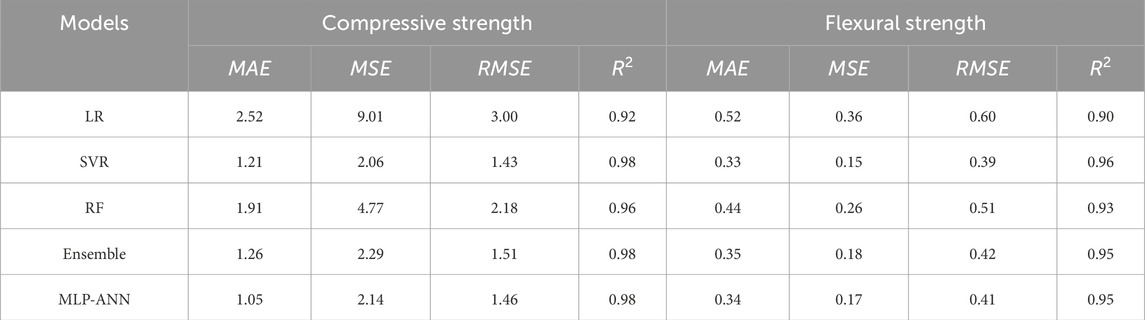
Table 7. Summary of machine learning model evaluation metrics.
For the compressive strength regression prediction model, the SVR, Ensemble, and MLP-ANN models exhibited high R2 values of 0.98 on the test set, indicating excellent accuracy and generalization ability in predicting compressive strength. Among these, SVR and MLP-ANN models performed the best, with the smallest MAE, MSE, and RMSE, and the highest R2. Specifically, the evaluation metrics for the SVR model were 1.21, 2.06, 1.43, and 0.98, respectively, while those for the MLP-ANN model were 1.05, 2.14, 1.46, and 0.98, showing clear superiority over other models.
In the flexural strength regression prediction model, the SVR, Ensemble, and MLP-ANN models also stood out, with R2 values exceeding 0.95 in the flexural strength test set. The SVR model performed the best, with the smallest MAE, MSE, and RMSE, and the highest R2 values of 0.33, 0.15, 0.39, and 0.96, respectively, which indicated that the SVR model achieved the highest prediction accuracy and generalization ability in the flexural strength regression model.
Conversely, the LR model performed the worst in both the compressive strength and flexural strength regression prediction models. This may be due to the dataset exhibiting more non-linearity, making simple linear fitting less effective in capturing the relationships between influencing factors and output features. Nevertheless, the LR model’s R2 values were still greater than 0.90, reflecting its reasonably good regression prediction capability in an absolute sense. Therefore, the LR calculation results were retained in this study and used for the robustness analysis of the influencing factors in subsequent sections.
4.4 Characteristic importance analysis
Feature importance analysis in machine learning models can effectively assess the impact of different influencing factors (input features) on the dependent variable (output feature). In the LR model, a series of fitting coefficients for the influencing factors were provided, where the magnitude of these coefficients’ absolute values could directly reflect the level of influence of each factor. In the RF model, feature importance was evaluated based on how frequently different influencing factors were used in the tree model or their importance in splitting decisions. Figure 16 presented the normalized importance values of these factors. In both the compressive strength and flexural strength regression prediction models, the feature importance rankings given by the LR and RF models were consistent. The importance rankings for the influencing factors were as follows: rubber content > age > w/c ratio > PVA. The results indicated that rubber content and age were the two most significant variables affecting the compressive and flexural strengths of PVA-modified waste rubber-filled cement-based materials, while the w/c ratio and PVA have relatively smaller effects. The predictions aligned with the findings of Zvonarić et al. (2024) and Liu L. et al. (2023). This served to validate the reliability of the model.
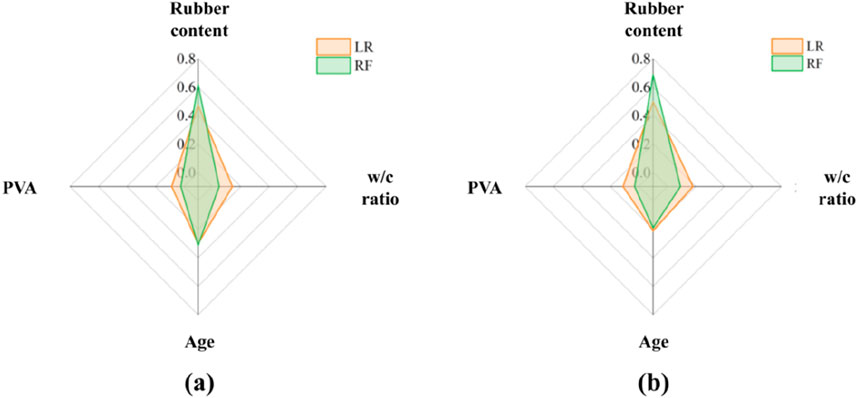
Figure 16. Characteristic importance analysis based on line model (LR) and tree model (RF): (A) compressive strength; (B) flexural strength.
However, not all machine learning models provided self-ranking of features like LR and RF models. Therefore, it was necessary to introduce a special calculation method applicable to any model. In this study, SHAP values were used for additional feature importance analysis. SHAP, which stood for SHapley Additive exPlanations, originated from cooperative game theory (Wang et al., 2024). For each sample to be predicted, the model generated a prediction value, and SHAP values represented the contribution of each feature to this prediction for each sample. The key advantage of SHAP was its ability to reflect the degree of influence of each feature on every sample and to indicate the direction of the feature’s effect (positive or negative).
Figure 17 presented the SHAP value analysis for the compressive strength and flexural strength regression models, respectively. For PVA-modified waste rubber-filled cement-based materials, rubber content and age were identified as the two most significant factors, consistent with the feature importance results from the LR and RF models. Additionally, the SHAP values for rubber content and w/c ratio were negative, while age and PVA had positive impacts on the output features. The results suggested that increasing rubber content and w/c ratio negatively affected the mechanical properties of PVA-modified waste rubber-filled cement-based materials, whereas increasing age and adding PVA significantly positively influence the mechanical properties of the materials. The positive effects of PVA were encouraging. Lotfy et al. (2024) observed that the enhancement in mechanical properties may be attributed to the function of the modified material as a dispersant, which improved the wettability of cement-based materials and accelerated the hydration rate. Conclusions similar to those presented here were reached by Zhu et al. (2024). These findings indicated that the application of PVA represents a novel approach for the modification of rubber-cement-based materials. Indeed, prior research conducted by Niu and colleagues demonstrated that PVA can enhance the toughness of rubber-cement-based materials through a “bridging effect,” as substantiated by digital image correlation (DIC) technology (Zhang et al., 2023).
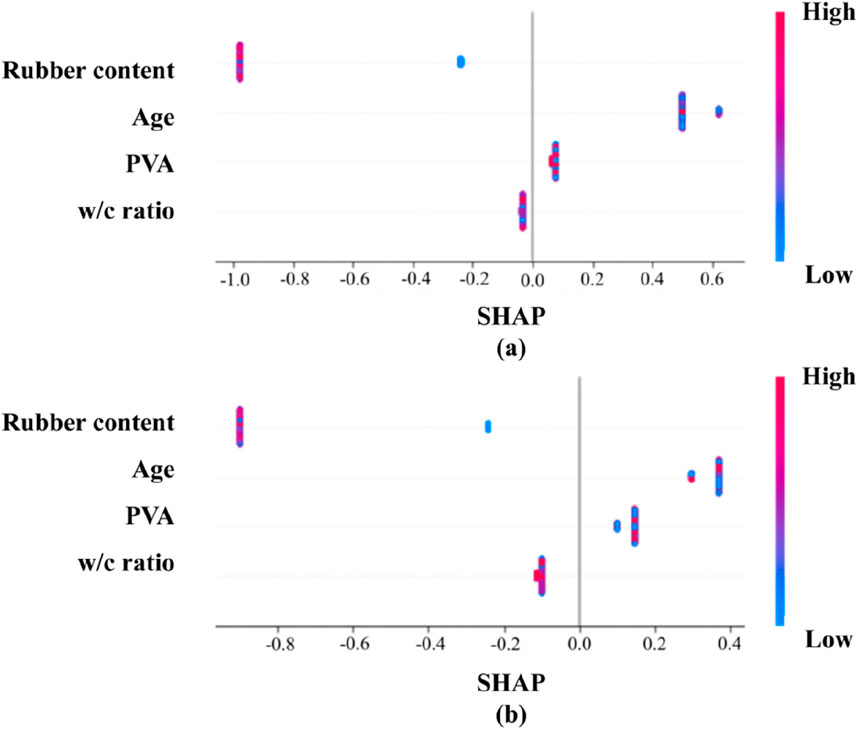
Figure 17. Summary charts for SHAP interpretation: (A) Compressive strength; (B) Flexural strength.
5 Conclusion
Based on experimental data, this study investigated the compressive and flexural strength of cement-based materials filled with PVA-modified waste rubber. The following main conclusions were drawn from the construction and evaluation of various machine learning regression prediction models.
(1) All employed machine learning models demonstrated good performance in predicting the compressive and flexural strength of cement-based materials modified with waste rubber and PVA. Specifically, the Support Vector Regression (SVR) model exhibited superior performance with a mean squared error (MSE) of 1.21 and 0.33, and a mean absolute error (MAE) of 2.06 and 0.15 on the test set. The prediction errors for this model were consistently within 20%. Overall evaluation metrics indicated that the SVR model achieved the best prediction accuracy and generalization ability compared to other models.
(2) The use of PVA-modified waste rubber significantly enhanced the mechanical strength of cement-based materials. This modification approach provides a means to enhance material performance in practical engineering applications, while also effectively utilizing waste rubber resources, thereby reducing environmental impact. Economically, the application of modified waste rubber can lower material costs and improve the overall performance of the materials.
(3) Analysis using model-internal evaluation metrics and SHAP values revealed that rubber content and water-to-cement ratio negatively correlated with both compressive and flexural strength, while curing age and PVA showed positive correlations with these strength indicators. Among all influencing factors, rubber content had the most significant impact. Our study indicates that the application of PVA-modified waste rubber in cement-based materials has significant engineering implications and practical value. The SVR model excelled in predicting these effects but attention should be given to the model’s sensitivity to certain conditions.
It is worth noting that the model presented in this study may have certain limitations, such as potential overfitting and biases due to hyperparameter tuning, a dataset that may not be sufficiently large due to computational constraints, and a more comprehensive sensitivity analysis of hyperparameters. These limitations will be addressed in future work.
Data availability statement
The original contributions presented in the study are included in the article/supplementary material, further inquiries can be directed to the corresponding author.
Author contributions
ZhH: Writing–original draft, Writing–review and editing. ZW: Investigation, Writing–review and editing. WN: Data curation, Validation, Writing–original draft. FW: Formal Analysis, Investigation, Writing–review and editing. SZ: Data curation, Resources, Writing–original draft. ZeH: Methodology, Validation, Writing–review and editing. QZ: Methodology, Resources, Validation, Writing–review and editing.
Funding
The author(s) declare that no financial support was received for the research, authorship, and/or publication of this article.
Acknowledgments
Financial support from the National Natural Science Foundation of Tianjin under the grant of 21JCZDJC00410 is gratefully acknowledged.
Conflict of interest
Authors ZH, FW, and ZH were employed by Cangzhou Qugang Expressway Construction Co., Ltd.
Author SZ was employed by Fujian Zhanglong Construction Investment Group Co., Ltd.
The remaining authors declare that the research was conducted in the absence of any commercial or financial relationships that could be construed as a potential conflict of interest.
Publisher’s note
All claims expressed in this article are solely those of the authors and do not necessarily represent those of their affiliated organizations, or those of the publisher, the editors and the reviewers. Any product that may be evaluated in this article, or claim that may be made by its manufacturer, is not guaranteed or endorsed by the publisher.
References
Asteris, P. G., Koopialipoor, M., Armaghani, D. J., Kotsonis, E. A., and Lourenço, P. B. (2021). Prediction of cement-based mortars compressive strength using machine learning techniques. Neural Comput. Appl. 33 (19), 13089–13121. doi:10.1007/s00521-021-06004-8
Biswas, R., Kumar, M., Singh, R. K., Alzara, M., El Sayed, S. B. A., Abdelmongy, M., et al. (2023). A novel integrated approach of Runge Kutta optimizer and ANN for estimating compressive strength of self-compacting concrete. Case Stud. Constr. Mater. 18, e02163. doi:10.1016/j.cscm.2023.e02163
Cai, R., Han, T., Liao, W., Huang, J., Li, D., Kumar, A., et al. (2020). Prediction of surface chloride concentration of marine concrete using ensemble machine learning. Cem. Concr. Res. 136, 106164. doi:10.1016/j.cemconres.2020.106164
Chen, Z., Li, L., and Xiong, Z. (2019). Investigation on the interfacial behaviour between the rubber-cement matrix of the rubberized concrete. J. Clean. Prod. 209, 1354–1364. doi:10.1016/j.jclepro.2018.10.305
Cook, R., Han, T., Childers, A., Ryckman, C., Khayat, K., Ma, H., et al. (2021). Machine learning for high-fidelity prediction of cement hydration kinetics in blended systems. Mater. and Des. 208, 109920. doi:10.1016/j.matdes.2021.109920
Dong, Q., Huang, B., and Shu, X. (2013). Rubber modified concrete improved by chemically active coating and silane coupling agent. Constr. Build. Mater. 48, 116–123. doi:10.1016/j.conbuildmat.2013.06.072
Eldin, N. N., and Senouci, A. B. (1993). Observations on rubberized concrete behavior. Cem. Concr. Aggregates 15 (1), 74–84. doi:10.1520/cca10590j
Fan, J., Li, G., Deng, S., and Wang, Z. (2019). Mechanical properties and microstructure of polyvinyl alcohol (PVA) modified cement mortar. Appl. Sci. 9 (11), 2178. doi:10.3390/app9112178
Guan, Z., Li, N., Zhang, W., Wang, J., Wang, C., Shen, Q., et al. (2022). A multiple loops machine learning framework to predict the properties of WC–Co based cemented carbides. Int. J. Refract. Metals Hard Mater. 104, 105798. doi:10.1016/j.ijrmhm.2022.105798
Han, T., Siddique, A., Khayat, K., Huang, J., and Kumar, A. (2020). An ensemble machine learning approach for prediction and optimization of modulus of elasticity of recycled aggregate concrete. Constr. Build. Mater. 244, 118271. doi:10.1016/j.conbuildmat.2020.118271
He, L., Cai, H., Huang, Y., Ma, Y., Van Den Bergh, W., Gaspar, L., et al. (2021). Research on the properties of rubber concrete containing surface-modified rubber powders. J. Build. Eng. 35, 101991. doi:10.1016/j.jobe.2020.101991
Huang, J. S., Liew, J. X., and Liew, K. M. (2021). Data-driven machine learning approach for exploring and assessing mechanical properties of carbon nanotube-reinforced cement composites. Compos. Struct. 267, 113917. doi:10.1016/j.compstruct.2021.113917
Janiesch, C., Zschech, P., and Heinrich, K. (2021). Machine learning and deep learning. Electron. Mark. 31 (3), 685–695. doi:10.1007/s12525-021-00475-2
Konstantopoulos, G., Koumoulos, E. P., and Charitidis, C. A. (2020). Testing novel portland cement formulations with carbon nanotubes and intrinsic properties revelation: nanoindentation analysis with machine learning on microstructure identification. Nanomater. (Basel) 10 (4), 645. doi:10.3390/nano10040645
Kumar, R., and Dev, N. (2021). Mechanical and microstructural properties of rubberized concrete after surface modification of waste tire rubber crumb. Arabian J. Sci. Eng. 47 (4), 4571–4587. doi:10.1007/s13369-021-06154-w
Kumar, S., Kumar, R., Rai, B., and Samui, P. (2024). Prediction of compressive strength of high-volume fly ash self-compacting concrete with silica fume using machine learning techniques. Constr. Build. Mater. 438, 136933. doi:10.1016/j.conbuildmat.2024.136933
Lapeyre, J., Han, T., Wiles, B., Ma, H., Huang, J., Sant, G., et al. (2021). Machine learning enables prompt prediction of hydration kinetics of multicomponent cementitious systems. Sci. Rep. 11 (1), 3922. doi:10.1038/s41598-021-83582-6
Li, X., Ling, T.-C., and Hung Mo, K. (2020). Functions and impacts of plastic/rubber wastes as eco-friendly aggregate in concrete – a review. Constr. Build. Mater. 240, 117869. doi:10.1016/j.conbuildmat.2019.117869
Li, Y., Shen, J., Li, Y., Wang, K., and Lin, H. (2024). The data-driven research on the autogenous shrinkage of ultra-high performance concrete (UHPC) based on machine learning. J. Build. Eng. 82, 108373. doi:10.1016/j.jobe.2023.108373
Lisi, R. D., Park, J. K., and Stier, J. C. (2004). Mitigating nutrient leaching with a sub-surface drainage layer of granulated tires. Waste Manag. 24 (8), 831–839. doi:10.1016/j.wasman.2004.03.012
Liu, K., Zhang, L., Wang, W., Zhang, G., Xu, L., Fan, D., et al. (2023a). Development of compressive strength prediction platform for concrete materials based on machine learning techniques. J. Build. Eng. 80, 107977. doi:10.1016/j.jobe.2023.107977
Liu, L., Wang, C., Liang, Q., Chen, F., and Zhou, X. (2023b). A state-of-the-art review of rubber modified cement-based materials: cement stabilized base. J. Clean. Prod. 392, 136270. doi:10.1016/j.jclepro.2023.136270
Liu, W., Liu, G., and Zhu, X. (2024). Applicability of machine learning algorithms in predicting chloride diffusion in concrete: modeling, evaluation, and feature analysis. Case Stud. Constr. Mater. 21, e03573. doi:10.1016/j.cscm.2024.e03573
Lotfy, V. F., Basta, A. H., and Shafik, E. S. (2024). Assessment of the effect of different pulping by-products on enhancing the reuse of rubber waste in producing of cement-mortar. Int. J. Biol. Macromol. 256 (Pt 1), 128205. doi:10.1016/j.ijbiomac.2023.128205
Lund, B. C., Abrams, T. E., Gravely, A. A., Carlson, K., and Spoont, M. (2011). Validity of PTSD diagnoses in VA administrative data: comparison of VA administrative PTSD diagnoses to self-reported PTSD Checklist scores. J. Rehabil. Res. Dev. 48 (1), 21–30. doi:10.1682/jrrd.2009.08.0116Available at: http://www.rehab.research.va.gov/jour/11/481/pdf/gravely.pdf.
Lunt, M. (2015). Introduction to statistical modelling: linear regression: fig. 1. Rheumatol. Oxf. 54 (7), 1137–1140. doi:10.1093/rheumatology/ket146
Mendis, A. S. M., Al-Deen, S., and Ashraf, M. (2017). Behaviour of similar strength crumbed rubber concrete (CRC) mixes with different mix proportions. Constr. Build. Mater. 137, 354–366. doi:10.1016/j.conbuildmat.2017.01.125
Mhaya, A. M., Fahim Huseien, G., Faridmehr, I., Razin Zainal Abidin, A., Alyousef, R., and Ismail, M. (2021). Evaluating mechanical properties and impact resistance of modified concrete containing ground Blast Furnace slag and discarded rubber tire crumbs. Constr. Build. Mater. 295, 123603. doi:10.1016/j.conbuildmat.2021.123603
Moguerza, J. M., and Muñoz, A. (2006). Support vector machines with applications. Stat. Sci. 21 (3). doi:10.1214/088342306000000493
Murthy, Y. I., Meena, K. B., and Patel, N. (2024). Machine learning for predicting the half cell potential of cathodically protected reinforced cement concrete slabs subjected to chloride ingress. Eng. Appl. Artif. Intell. 137, 109090. doi:10.1016/j.engappai.2024.109090
Nilsen, V., Pham, L. T., Hibbard, M., Klager, A., Cramer, S. M., and Morgan, D. (2019). Prediction of concrete coefficient of thermal expansion and other properties using machine learning. Constr. Build. Mater. 220, 587–595. doi:10.1016/j.conbuildmat.2019.05.006
Ossola, G., and Wojcik, A. (2014). UV modification of tire rubber for use in cementitious composites. Cem. Concr. Compos. 52, 34–41. doi:10.1016/j.cemconcomp.2014.04.004
Papazek, P., Schicker, I., Plant, C., Kann, A., and Wang, Y. (2020). Feature selection, ensemble learning, and artificial neural networks for short-range wind speed forecasts. Meteorol. Z. 29 (4), 307–322. doi:10.1127/metz/2020/1005
Richardson, A., Coventry, K., Dave, U., and Pienaar, J. (2011). Freeze/thaw performance of concrete using granulated rubber crumb. J. Green Build. 6 (1), 83–92. doi:10.3992/jgb.6.1.83
Serban, A., van der Blom, K., Hoos, H., and Visser, J. (2024). Software engineering practices for machine learning — adoption, effects, and team assessment. J. Syst. Softw. 209, 111907. doi:10.1016/j.jss.2023.111907
Steyn, Z. C., Babafemi, A. J., Fataar, H., and Combrinck, R. (2021). Concrete containing waste recycled glass, plastic and rubber as sand replacement. Constr. Build. Mater. 269, 121242. doi:10.1016/j.conbuildmat.2020.121242
Sukontasukkul, P. (2009). Use of crumb rubber to improve thermal and sound properties of pre-cast concrete panel. Constr. Build. Mater. 23 (2), 1084–1092. doi:10.1016/j.conbuildmat.2008.05.021
Surehali, S., Han, T., Huang, J., Kumar, A., and Neithalath, N. (2024). On the use of machine learning and data-transformation methods to predict hydration kinetics and strength of alkali-activated mine tailings-based binders. Constr. Build. Mater. 419, 135523. doi:10.1016/j.conbuildmat.2024.135523
Thomas, B. S., and Gupta, R. C. (2015). Long term behaviour of cement concrete containing discarded tire rubber. J. Clean. Prod. 102, 78–87. doi:10.1016/j.jclepro.2015.04.072
Tu, P., Li, X., Cao, L., Zhong, M., Xie, Z., and Wu, Z. (2022). Machine learning and BP neural network revealed abnormal B cell infiltration predicts the survival of lung cancer patients. Front. Oncol. 12, 882018. doi:10.3389/fonc.2022.882018
Wang, Z., Liu, H., Amin, M. N., Khan, K., Qadir, M. T., and Khan, S. A. (2024). Optimizing machine learning techniques and SHapley Additive exPlanations (SHAP) analysis for the compressive property of self-compacting concrete. Mater. Today Commun. 39, 108804. doi:10.1016/j.mtcomm.2024.108804
Xiao, F., Wenbin Zhao, P. E., and Amirkhanian, S. N. (2009). Fatigue behavior of rubberized asphalt concrete mixtures containing warm asphalt additives. Constr. Build. Mater. 23 (10), 3144–3151. doi:10.1016/j.conbuildmat.2009.06.036
Yang, S., Sun, J., and Zhifeng, X. (2024). Prediction on compressive strength of recycled aggregate self-compacting concrete by machine learning method. J. Build. Eng. 88, 109055. doi:10.1016/j.jobe.2024.109055
Yu, J., Wang, N., Wang, M., Zhang, J., and Hou, D. (2020). Recyclable rubber-cement composites produced by interfacial strengthened strategy from polyvinyl alcohol. Constr. Build. Mater. 264, 120541. doi:10.1016/j.conbuildmat.2020.120541
Yu, Y., Li, W., Li, J., and Nguyen, T. N. (2018). A novel optimised self-learning method for compressive strength prediction of high performance concrete. Constr. Build. Mater. 184, 229–247. doi:10.1016/j.conbuildmat.2018.06.219
Zhang, J., Niu, W., Yang, Y., Hou, D., and Dong, B. (2023). Research on the mechanical properties of polyvinyl alcohol-modified waste rubber-filled cement paste using digital image correlation technology. Compos. Struct. 320, 117164. doi:10.1016/j.compstruct.2023.117164
Zhang, W., Lee, D., Lee, J., and Lee, C. (2021). Residual strength of concrete subjected to fatigue based on machine learning technique. Struct. Concr. 23 (4), 2274–2287. doi:10.1002/suco.202100082
Zhang, Z. (2016). A gentle introduction to artificial neural networks. Ann. Transl. Med. 4 (19), 370, Oct. doi:10.21037/atm.2016.06.20
Zhou, Z. H. (2022). Open-environment machine learning. Natl. Sci. Rev. 9 (8), nwac123. doi:10.1093/nsr/nwac123
Zhu, Z., Zhou, M., Wang, B., and Xu, X. (2024). Enhancing permeability and mechanical properties of rubber cement-based materials through surface modification of waste tire rubber powder. Constr. Build. Mater. 425, 136098. doi:10.1016/j.conbuildmat.2024.136098
Keywords: waste rubber, PVA, mechanical strength, machine learning, robustness
Citation: He Z, Wu Z, Niu W, Wang F, Zhong S, Han Z and Zhao Q (2024) A machine learning model for predicting the mechanical strength of cement-based materials filled with waste rubber modified by PVA. Front. Mater. 11:1490006. doi: 10.3389/fmats.2024.1490006
Received: 02 September 2024; Accepted: 19 September 2024;
Published: 08 October 2024.
Edited by:
Biao Hu, Shenzhen University, ChinaReviewed by:
Amir Ali Shahmansouri, Washington State University, United StatesZeyu Lu, University of Macau, China
Copyright © 2024 He, Wu, Niu, Wang, Zhong, Han and Zhao. This is an open-access article distributed under the terms of the Creative Commons Attribution License (CC BY). The use, distribution or reproduction in other forums is permitted, provided the original author(s) and the copyright owner(s) are credited and that the original publication in this journal is cited, in accordance with accepted academic practice. No use, distribution or reproduction is permitted which does not comply with these terms.
*Correspondence: Qingxin Zhao, U3VibWlzc2lvbl90anVAMTI2LmNvbQ==