 Zongquan Ying
 Jiamin Li
 Juan Zhao1,2,3,4
- 1CCCC Fourth Harbor Engineering Institute Co., Ltd., Guangzhou, China
- 2Key Laboratory of Hydraulic Structure Durability Technology for Transportation Industry, Guangzhou, China
- 3Key Laboratory of Construction Material, CCCC, Guangzhou, China
- 4Observation and Research Base of Transport Industry of Long-term Performances of Marine Infrastructure, Ministry of Transport, Guangzhou, China
The residual cross-sectional areas of corroded rebars and their uniformity are the main indexes to evaluate the safety and durability of concrete structures in the marine environment. To evaluate corrosion characteristics of naturally corroded rebars, nineteen corroded rebars were extracted from the prototype components of a high-pile wharf with 35 years of service. The apparent morphology characteristics of corroded rebars were obtained using 3D scanning. The results indicate that the corrosion is non-uniform along both the longitudinal and cross-sectional directions of the corroded rebars. In the marine environment, the residual cross-sectional areas of corroded rebars along the length adhere to a three-parameter Weibull distribution; however, no specific probability distribution model or clear correlation with the distribution pattern exists for rebars with varying corrosion degrees. The spatial heterogeneity factors of the rebars are characterized by a three-parameter Frechet distribution.
Highlights
• Rebars have been corroded in the marine environment for 35 years.
• The corrosion is non-uniform along the length direction and cross-section direction of rebars.
• The residual cross-sectional areas follow a three-parameter Weibull distribution.
• The spatial heterogeneity factors obey a three-parameter Frechet distribution.
1 Introduction
Reinforcement corrosion is one of the main factors leading to the degradation of durability (Bazant, 1979; Costa and Appleton, 2002) and a decline in the bearing capacity (Bhargava et al., 2007; Xia et al., 2016) of reinforced concrete members. To quantitatively evaluate the influence of the degree of steel corrosion on the bearing capacity of components, numerous scholars have investigated its impact on mechanical properties (Du et al., 2005; Zhang et al., 2012; Francois et al., 2013). However, these studies did not account for the non-uniform corrosion of rebars, and instead used the average corrosion rate of rebars (average mass loss or average cross-sectional area loss) to describe the degree of corrosion. Studies (Almusallam, 2001; Maslehuddin et al., 1990) have found that for non-uniform corrosion, the nominal tensile strength of corroded rebar is significantly lower than that of uncorroded rebar. Moreover, the elongation of corroded rebar decreases obviously with increasing corrosion degree, and tends to brittle failure gradually. Apostolopoulos et al. (2013) observed that compared with uniform corrosion, pitting corrosion led to significantly greater plastic degradation of rebars. Furthermore, non-uniform corrosion of reinforcement may induce failure in non-critical section of components, with the failure probability of reinforced concrete beams increasing by 200% under non-uniform corrosion condition (Stewart and Al-Harthy, 2008).
Chloride ion erosion causes the corrosion of rebars in concrete structures to be both uneven and time-dependent. Due to the uneven external environment and material properties, the apparent morphology of corroded rebar exhibits significant randomness and complexity. Currently, the primary methods for measuring the corrosion rate and apparent morphological characteristics of corroded rebars include the weighing method (Yi et al., 2010; Zhang et al., 2010; Malumbela et al., 2010; Zhu et al., 2013), vernier caliper method (Torres-Acosta and Castro-Borges, 2013), drainage method (Du et al., 2005), X-ray imaging method (Xi and Yang, 2019), CT imaging method (Lim et al., 2017; Fernandez et al., 2018) and 3D scanning method (Kashani et al., 2013; Zhang J. Z. et al., 2021; Tang et al., 2014). The parameters used to characterize non-uniform corrosion of reinforcement include maximum loss rate of cross-sectional area (Gao et al., 2019), maximum pit depth (Zhao et al., 2020), and the non-uniform coefficient of corrosion (ratio of average cross-sectional area to minimum cross-sectional area) (Zhang et al., 2014). Studies (Kashani et al., 2013; Stewart and Rosowsky, 1998; Zhang W. P. et al., 2021; Caleyo et al., 2009; Gu et al., 2018; Reshvanlou et al., 2022; Jin et al., 2020) have found that the residual cross-sectional areas of corroded rebars follows a normal distribution, lognormal distribution or Weibull distribution, and the ratio of minimum cross-sectional area to maximum cross-sectional area follows an extreme value type I (Gumble) distribution. The inhomogeneity coefficient R (average cross-sectional area to minimum cross-sectional area) approximately follows a Gumble distribution, generalized extreme value distribution or Frechet distribution. The pitting factor follows a lognormal distribution or an extreme value type I distribution. It is important to note that the aforementioned studies on the non-uniform corrosion characteristics of corroded rebars primarily rely on electrochemical accelerated corrosion tests and different researchers have reached varying conclusions regarding the distribution of non-uniform characterization parameters of corroded rebars.
Electrochemical accelerated corrosion tests can quickly produce corroded rebar samples, the non-uniform corrosion of which is different from that found in natural corroded components in the marine environment, leading to differences in the corrosion distribution characteristics of rebar surface (Otieno et al., 2013; Yuan et al., 2007; Ou et al., 2016). This paper investigates the apparent morphology characteristics of naturally corroded rebars in concrete under marine environmental conditions. Corroded rebars were extracted from actual engineering concrete structures, and their precise morphology parameters were obtained using 3D scanning technology. The probability distribution models of residual cross-sectional areas and non-uniformity coefficient of naturally corroded rebars were studied to analyze the distribution and variation of these characteristic parameters under different corrosion levels.
2 Extraction of apparent morphology of corroded rebar
2.1 Samples of corroded rebar
Corroded rebar specimens were taken from the hollow beams of the approach bridge in a coastal pier, where the reinforced concrete members have been in service for 35 years, as shown in Figure 1. Field inspection indicates that nearly all the concrete cover of the bridge bottom surface show rust expansion, hollow bulging, spalling, exposed reinforcement and other deterioration, indicating serious rebar corrosion. The chloride ion content in the design depth of concrete cover has reached 0.15%, which far exceeds the critical threshold of rebar corrosion (ACI Committee 318, 1989). Nineteen HBR335 rebar samples with varying degrees of corrosion were extracted from the hollow beam, including nine rebars with a diameter of 20 mm and ten rebars with a diameter of 25 mm. Due to the difficulty of extracting longer specimens without causing damage and the time constraints during demolition, each rebar sample was cut into lengths of 450–500 mm.
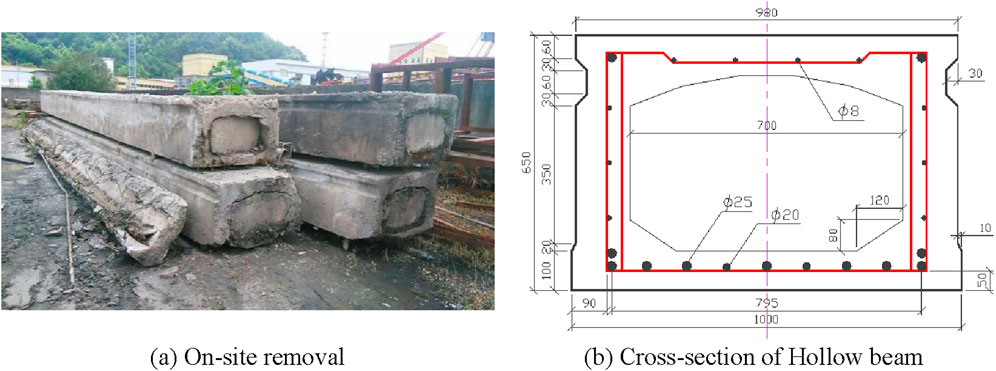
Figure 1. Hollow beams of approach bridge of a coastal pier with 35 years of service. (A) On-site removal (B) Cross-section of Hollow beam.
2.2 Determination of corrosion rate and morphology
The corroded rebars were cleaned with dilute hydrochloric acid solution, neutralized with lime water solution, rinsed with clean water, and dried in a dryer for more than 4 h 3D scanning was performed on two uncorroded rebars and nineteen corroded rebars to obtain their 3D models (Figure 2). Additionally, cross-section of the 3D rebars models was taken at 1 mm intervals along the length of each rebar. In this paper, the average corrosion degree, or mass loss
where
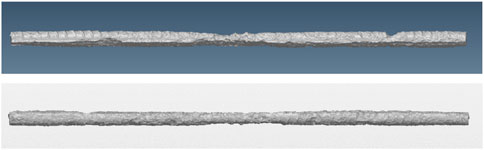
Figure 2. 3D scanning results of a corroded rebar.
The maximum pitting depth of corroded rebars was measured using a micrometer gauge, which has an accuracy of 0.01 mm. Two uncorroded rebars with diameters of 20 and 25 mm were selected as comparison samples, and numbered N20 and N25, respectively. Corroded rebars with different diameters are numbered 20-1 through 20-9 and 25-1 through 25-10 according to the average corrosion degree from smallest to largest. Table 1 lists the mass loss, maximum cross-sectional loss and maximum pitting depth of each corroded rebar. The mass loss

Table 1. Mass loss, maximum cross-section loss and maximum pitting depth of rebars.
3 Analysis of corrosion characteristics
3.1 Variation of the residual cross-sectional areas and pitting depth along the length
The residual cross-sectional areas of corroded rebars are a critical factor in determining their mechanical properties (Zeng et al., 2020). The non-uniform distribution of residual cross-sectional areas along the length of corroded rebars greatly increases the risk of structural failure. The current specification “Standard for durability assessment of existing concrete structures: GB/T 51355-2019” (GB/T 51355-2019, 2019), considers the cross-sectional loss rate and uniformity of corrosion as necessary conditions for determining the yield strength of corroded rebars.
The distribution of the residual cross-sectional areas along the length of the 20 mm rebars with varying corrosion levels is shown in Figure 3. Compared to the cross-sectional areas of the uncorroded rebar (N20), the residual cross-sectional areas of corroded rebars shows an obvious non-uniform distribution along their length. When the mass loss is less than 10%, the residual cross-sectional areas of the rebars fluctuates around the average residual cross-sectional area, and the longitudinal and transverse ribs can be clearly identified on the rebars surface. When the mass loss exceeds 10%, the fluctuation amplitude of the residual cross-sectional areas increases with the corrosion rate, intensifying the non-uniform corrosion along the rebar’s length. When the mass loss exceeds 15%, particularly when it surpasses 20%, the longitudinal and transverse ribs of the rebar nearly disappear on the rebars surface. The distribution of residual cross-sectional area in the 25 mm rebars is similar to that of the 20 mm rebars, and will not be repeated here.
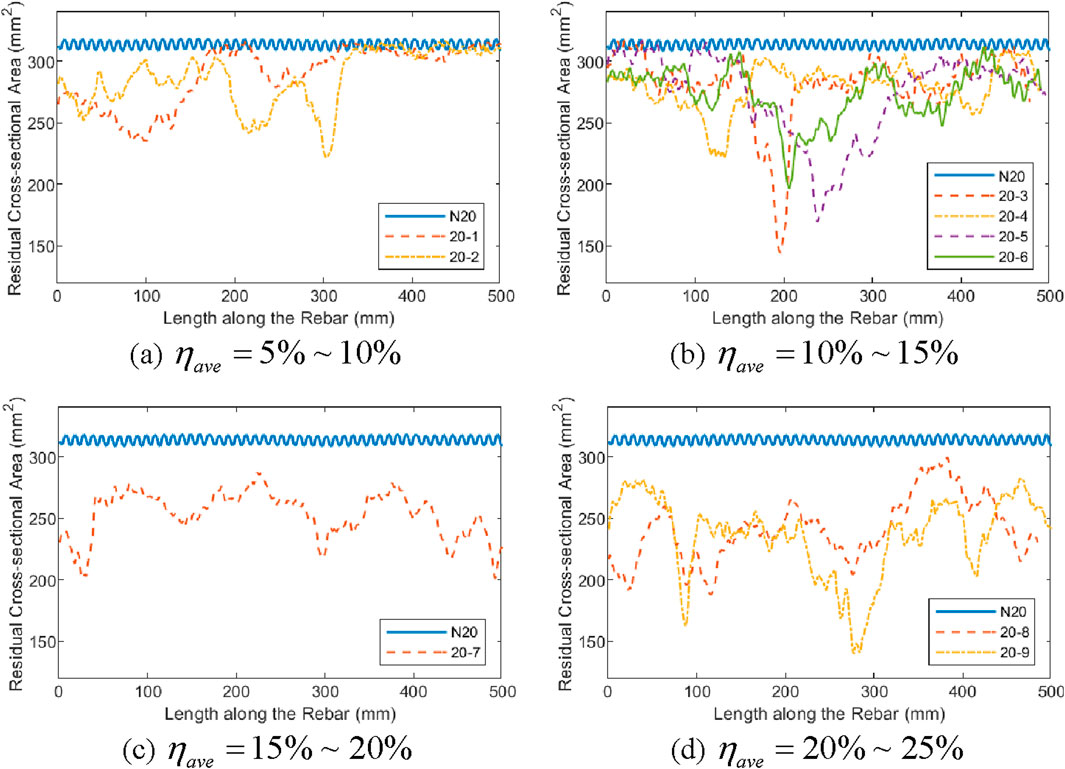
Figure 3. Variation of the residual cross-sectional areas along the length of 20 mm rebars. (A)
The decrease in the residual cross-sectional areas of rebars typically corresponds to the formation of new corrosion pits or an increase in pitting depth. Figure 4 presents the distribution of pitting depth along the length of four corroded rebars with different corrosion rates. It is evident that as the corrosion rate increases, the pitting depth becomes more irregular along the length of the rebar, with pits becoming larger and deeper.
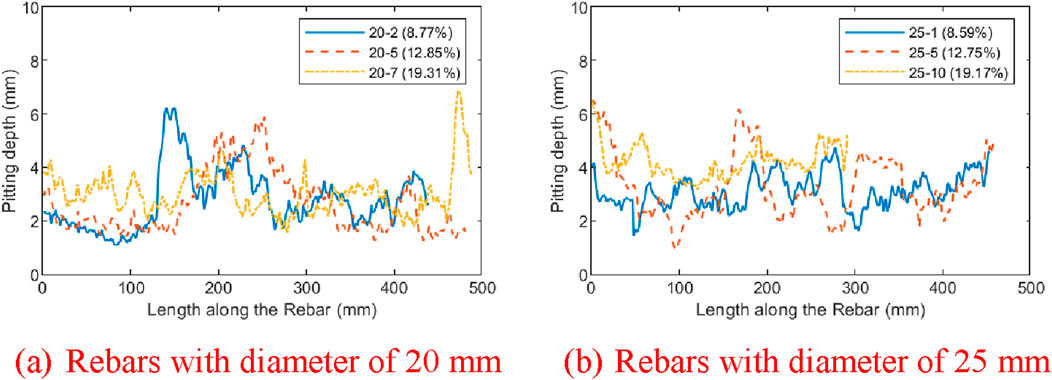
Figure 4. Variation of the pitting depth along the length of rebars. (A) Rebars with diameter of 20 mm (B) Rebars with diameter of 25 mm.
3.2 Appearance of rebars after natural corrosion
To better understand the corrosion morphology characteristics of the rebar after natural corrosion, the longitudinal direction of the rebar is assumed to be the z-axis and the cross-section is represented in polar coordinates as the
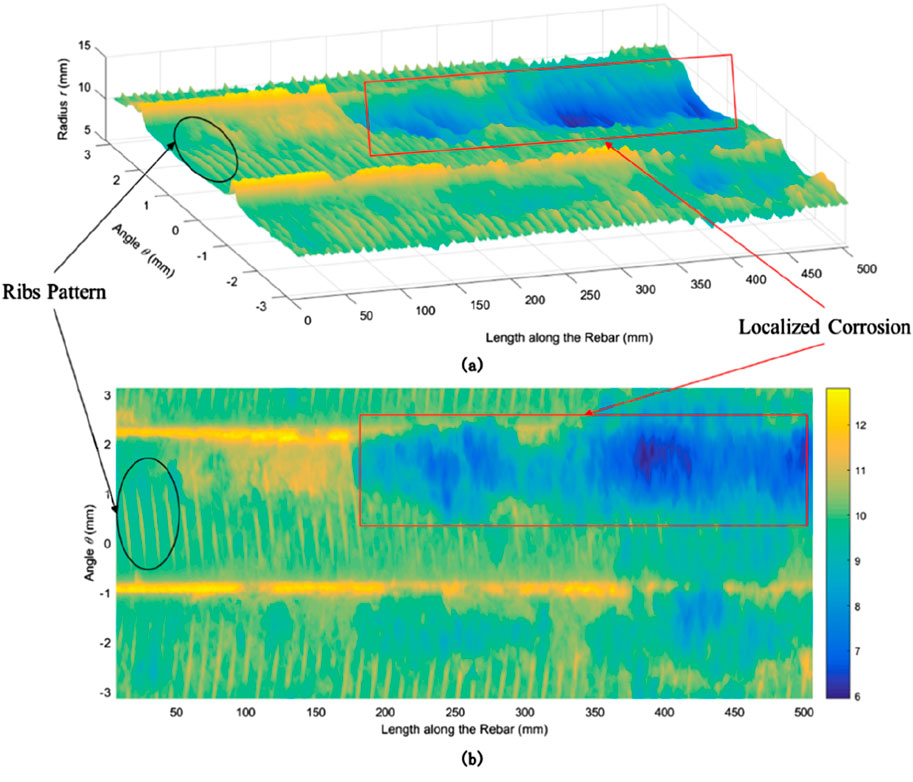
Figure 5. Corrosion morphology of a corroded rebar: (A) 3D surface plot and (B) overhead view of 3D surface.
Figures 6, 7 depict the non-uniform corrosion of corroded rebar 20-6 with 12.85% mass loss and the pitting corrosion of corroded rebar 25-2 with 9.91% mass loss. The red square and black circular wireframes highlight the corresponding corrosion characteristics as seen from the perspective of 3D scanning model and the maximum pit depth cross-section, respectively. The variations of cross-sections along the rebars, as shown in Figures 6A, 7A, illustrate that the residual cross-sectional shapes of corroded rebars are directly related to their position within concrete members. The corrosion zones of rebars predominantly occur on the side adjacent to the concrete cover, displaying noticeable uneven corrosion characteristics in the residual cross-sectional shape of the rebars.
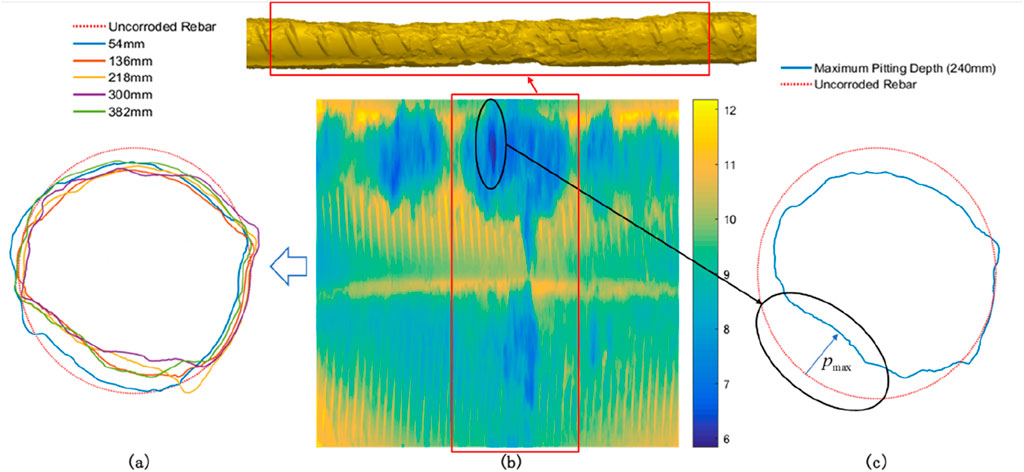
Figure 6. Non-uniform corrosion of corroded rebar 20-6 with 12.85% mass loss: (A) variation of cross-sections along the rebar, (B) overhead of 3D surface plot and (C) cross-section of the maximum pitting depth.
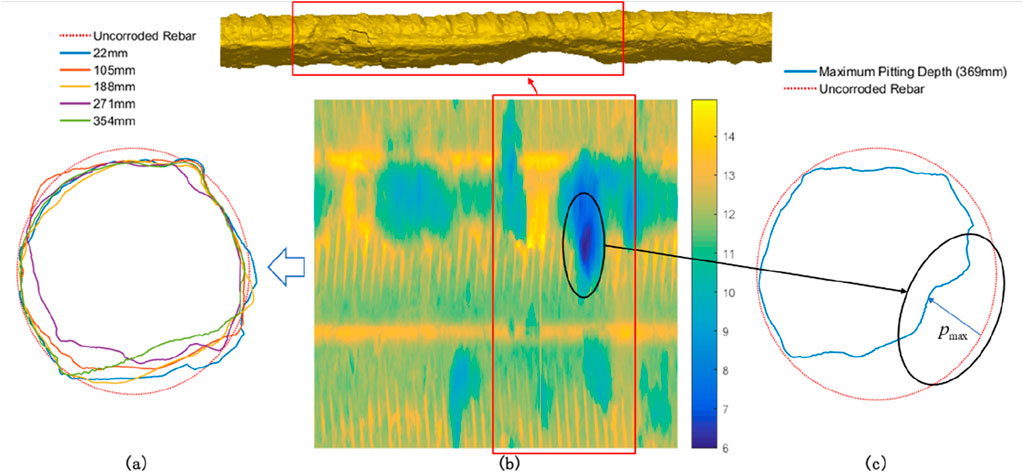
Figure 7. Pitting corrosion of corroded bar 25-2 with 9.91% mass loss: (A) variation of cross-section cuts along the bar, (B) overhead view of 3D surface plot and (C) cross-section of the maximum pitting depth.
4 Characteristics of residual cross-sectional areas
4.1 Probability distribution of residual cross-sectional areas of a single rebar
The probability distribution model of the residual cross-sectional areas is crucial for predicting the load-carrying capacity of corroded reinforced concrete (Maslehuddin et al., 1990). To facilitate comparative analysis, the residual cross-sectional areas of each rebar are normalized to their corresponding nominal areas. The residual cross-sectional areas of 19 corroded rebar specimens were statistically analyzed to further quantify their distribution characteristics, and several common probability distribution models were selected to fit the test data. These models include normal distribution, lognormal distribution, generalized extreme value (GEV) distribution. Based on the value of shape parameter, GEV distribution can be categorized into type I, type II and type III extreme value distribution (Millington et al., 2011). When the shape parameter is non-zero, the probability density function (PDF) and Cumulative distribution function (CDF) for the GEV distribution are, respectively, expressed as Equations 3 and 4:
Where
Figure 8 displays the statistical histogram plot of the normalized areas and optimal distribution of the residual cross-sections for typical specimens. The histograms of the residual cross-sectional areas under varying corrosion degrees predominantly exhibit an asymmetric negative skew distribution, as illustrated in Figures 8A, B. Notably, the histogram of rebar 20-3 (Figure 8C) shows a pronounced left-skewed tail that is heavier than that of a normal distribution. This phenomenon suggests the presence of localized, unusually severe pitting in the rebar. The histogram characteristics of rebar 25-6 are similar to those of rebar 20-3 (Figure 8D). Under the condition of low mass loss (10%∼13%), the maximum cross-sectional loss of rebars 20-3 and 25-6 exceeds 50%, rendering these cross-sections the weakest points in the rebars. The distribution of the cross-sections along the length of a corroded rebar is highly uneven, and the average corrosion loss of rebars taken from different positions within the same concrete structure varies significantly. A similar conclusion was reached by Zhang J. Z. et al. (2021). Therefore, assessing the durability of a concrete structure solely by examining a section of rebar may not be reliable.
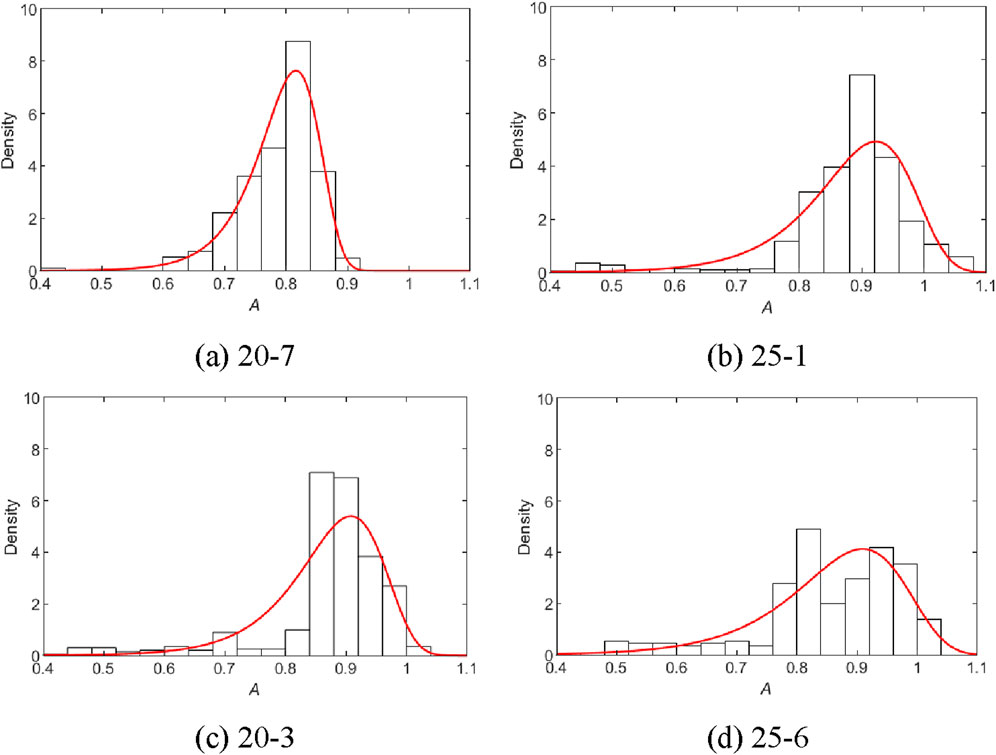
Figure 8. Statistical histogram plots for normalized areas of typical specimens. (A) 20-7 (B) 25-1 (C) 20-3 (D) 25-6.
The Kolmogorov-Smirnov (K-S) test (Fasano and Franceschini, 1987) was conducted at a 95% confidence level to preliminarily estimate the appropriate distribution model for the cross-sectional areas of corroded rebars. Table 2 presents the results of K-S test and maximum likelihood estimates of the parameters for the GEV distribution, revealing that 68% of the corroded rebar samples conform to the GEV distribution, 16% conform to both the lognormal and normal distribution, and 32% do not conform to any distribution examined in this study. For corroded rebars with a truncated length of 500 mm, the residual cross-sectional areas do not follow any specific distribution, and there is no apparent correlation between the corrosion rate and its distribution pattern. Based on the proportions of samples fitting each probability distribution model, GVE distribution with
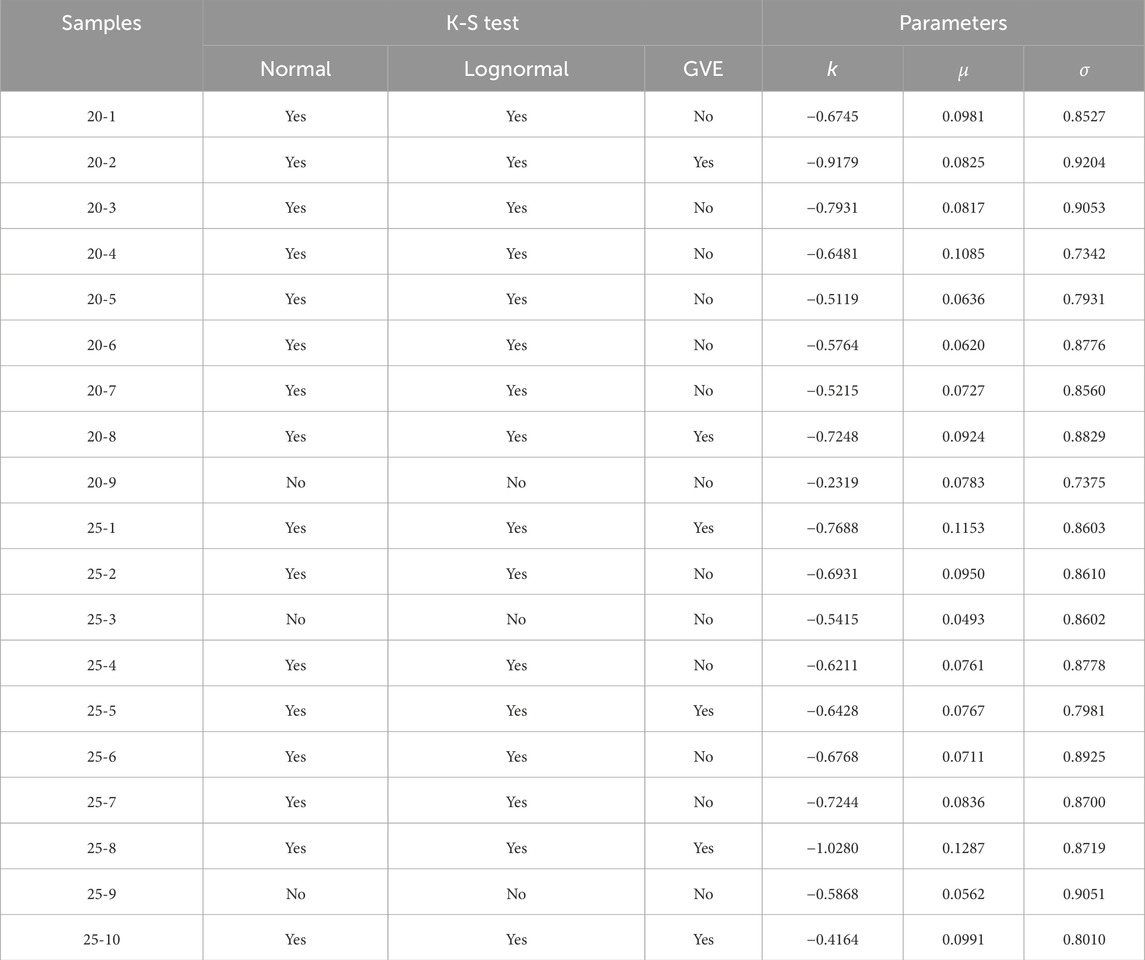
Table 2. Results of K-S test and maximum likelihood estimates of the parameters for the GEV distribution.
4.2 Influence of different diameters on corrosion of rebars
The average mass losses for 20 and 25 mm corroded rebar samples are 14.66% and 13.51%, respectively, while the maximum cross-sectional losses are 55.62% and 50.14%. Figure 9 presents the graphic analysis of the residual cross-sectional areas of the rebars with diameter of 20 and 25 mm, including histogram, quantile-quantile (Q-Q) and cumulative distribution function plots. Various probability distribution models are compared for the residual cross-sectional areas of 20 and 25 mm corroded rebar samples, as illustrated by the histogram plots in Figure 9. It can be concluded that GVE distribution with
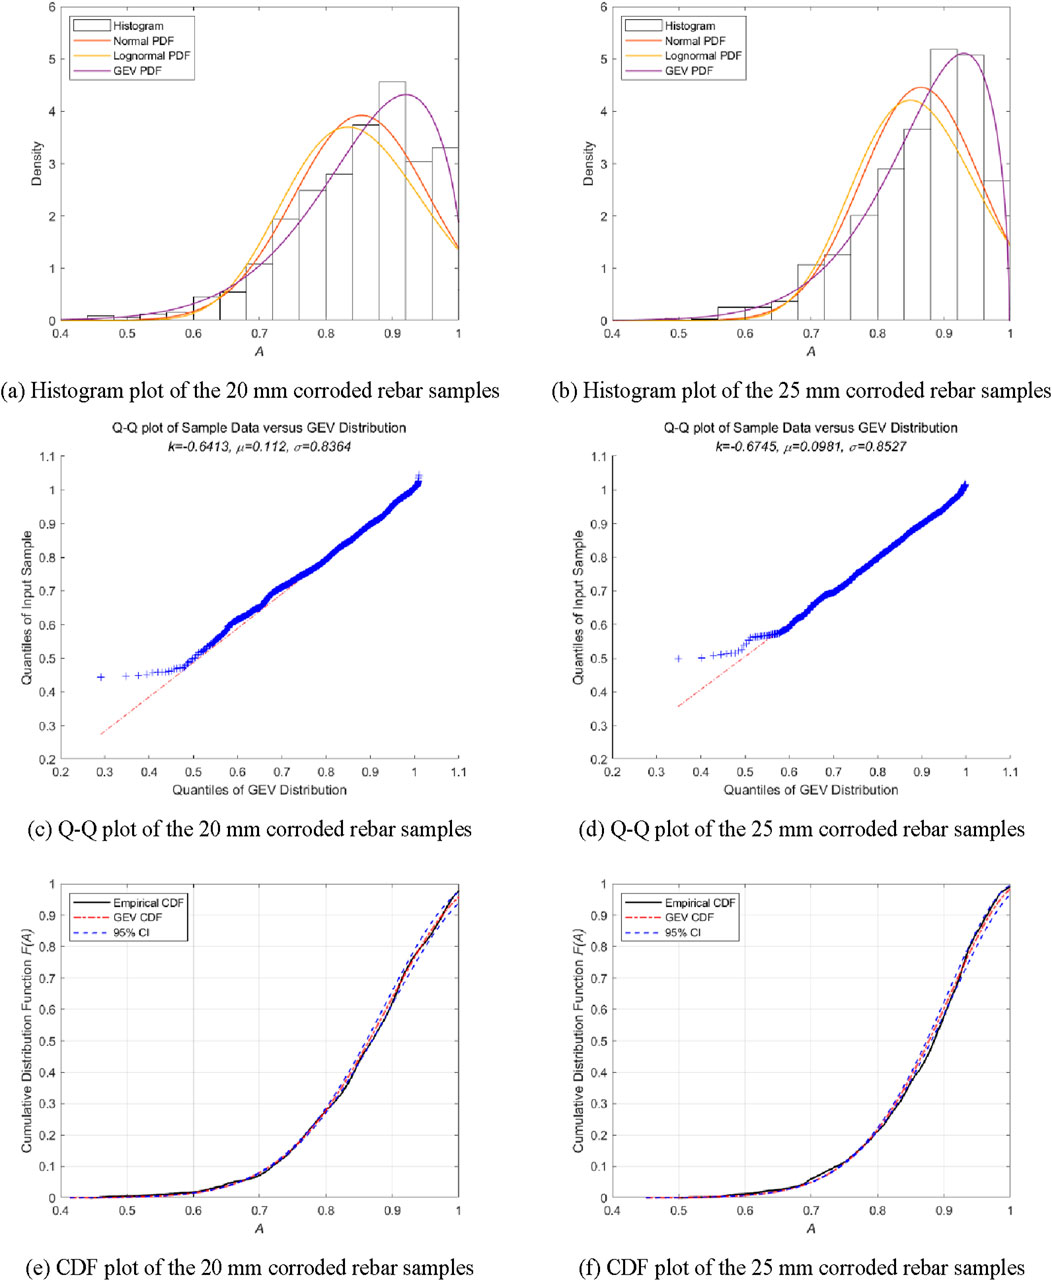
Figure 9. Graphic analysis of the probability distributions for the residual cross-sectional areas of corroded rebars with diameter of 20 and 25 mm. (A) Histogram plot of the 20 mm corroded rebar samples (B) Histogram plot of the 25 mm corroded rebar samples (C) Q-Q plot of the 20 mm corroded rebar samples (D) Q-Q plot of the 25 mm corroded rebar samples (E) CDF plot of the 20 mm corroded rebar samples (F) CDF plot of the 25 mm corroded rebar samples.
After normalizing the residual cross-sectional areas of corroded rebar samples with different diameters, all the data still conform to the GVE distribution model with shape parameter
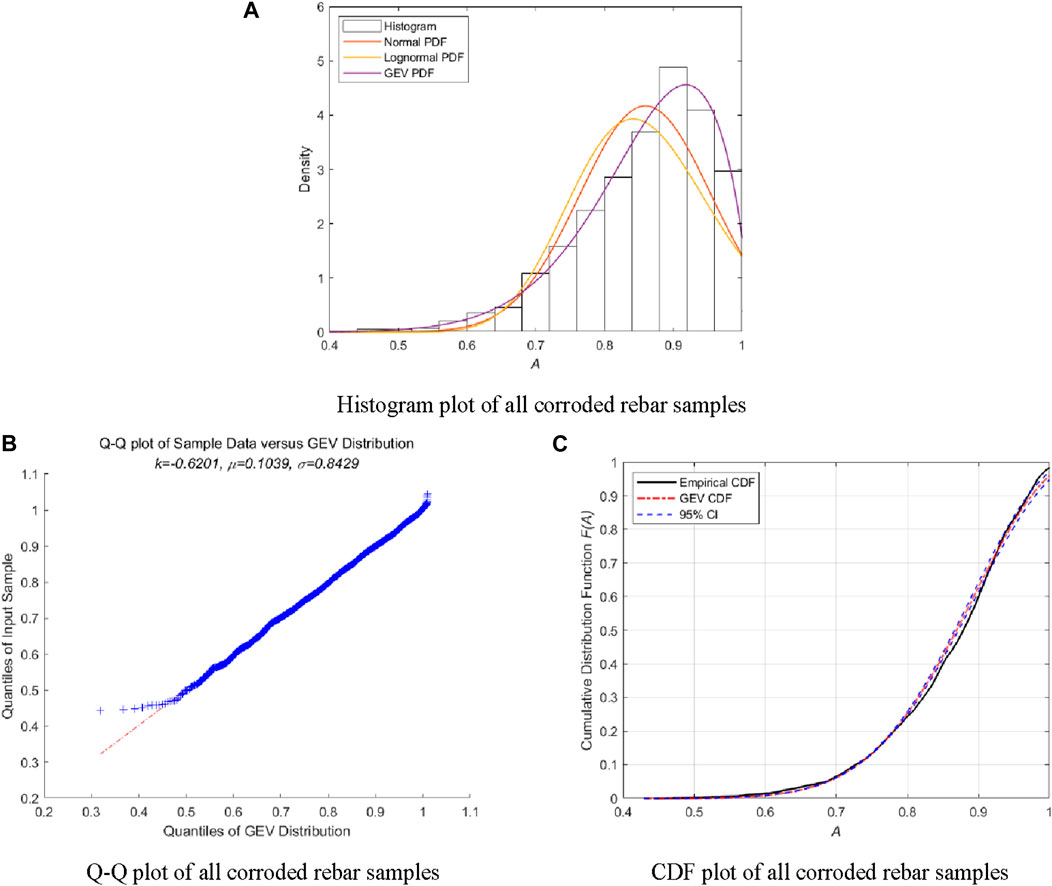
Figure 10. Graphic analysis of the probability distributions for the residual cross-sectional areas of all corroded rebar samples. (A) Histogram plot of all corroded rebar samples (B) Q-Q plot of all corroded rebar samples (C) CDF plot of all corroded rebar samples.
Indeed, the effect of rebar diameter on corrosion remains inconclusive. On one hand, using larger diameter rebars with the same reinforcement ratio can decrease the specific surface area of the bars exposed to corrosion, thereby reducing both the degree and non-uniformity of corrosion under the same environmental and temporal conditions (Gu et al., 2018). On the other hand, a larger reinforcement diameter increases the risk of cracking in the concrete cover, which causes premature cracking and accelerates the corrosion process of the reinforcement (Chen et al., 2019). However, these conclusions are primarily based on samples of corroded steel bars obtained from accelerated laboratory tests, rather than the naturally corroded prototype members analyzed in this paper.
5 Spatial heterogeneity factor
5.1 Definition of spatial heterogeneity factor
Currently, the ratio of average cross-sectional area to the minimum cross-sectional area of a corroded rebar is commonly used to define the spatial heterogeneity factor
where
5.2 Probability distribution of spatial heterogeneity factors
The probability distribution of spatial heterogeneity factors can be applied to time-varying reliability analysis of corroded reinforced concrete beams. The Gumbel distribution has been reported to be the best fit to the spatial heterogeneity factors of accelerated corroded rebars (Zhang et al., 2014; Zhang W. P. et al., 2021; Gu et al., 2018). However, the mechanism of the accelerated corrosion differs from natural corrosion in that it imposes a higher corrosion rate, which does not correspond to the equilibrium mixed potential found under typical service conditions (Gonzalez et al., 1995). There remains a lack of in-depth research on the probability distribution of spatial heterogeneity factors in naturally corroded rebars.
Given that the actual statistical length of each rebar sample is approximately 450–500 mm, these corroded rebar samples can be divided into equal-length units of 50 mm to meet the data volume requirements for parameter fitting and account for the actual length of the rebars. Based on different corrosion levels, the inverse cumulative distribution function (CDF−1) plot, commonly known as the quantile plot (Rosenkrantz, 2000; Xiao, 2015), is employed to fit probability distributions, such as normal distribution, lognormal distribution, and GEV distribution, to the data of the spatial heterogeneity factors
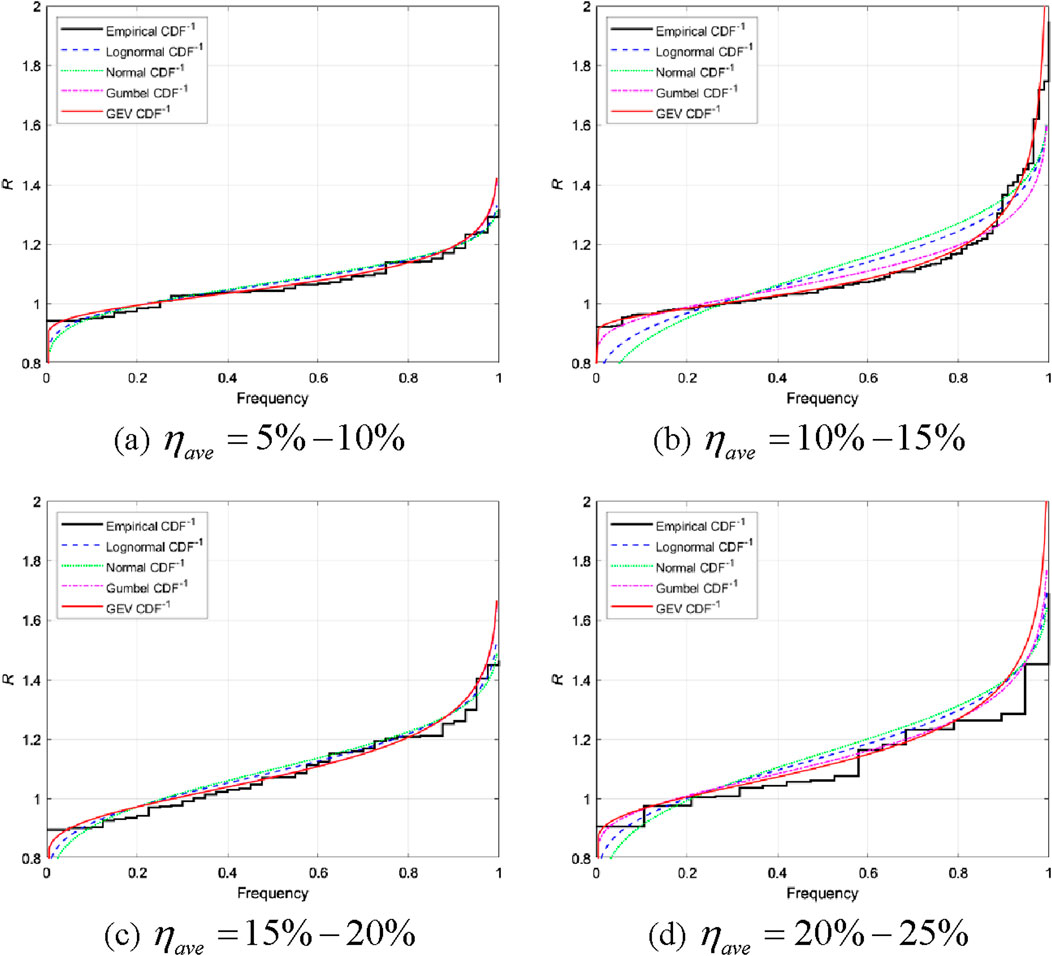
Figure 11. Inverse cumulative distribution function plot for spatial heterogeneity factors at different corrosion levels. (A)
5.3 Relationship between spatial heterogeneity factors and corrosion levels
The deterioration of mechanical properties in corroded rebars, influenced by longitudinal non-uniformity, should be treated as a time-dependent factor to accurately reflect the impact of different corrosion levels (Zhang W. P. et al., 2021). As corrosion progresses over time, the non-uniform loss of material along the length of the rebar significantly alters its load-bearing capacity and structural integrity, emphasizing the need for establishing the relationship between spatial heterogeneity factors and corrosion levels.
Table 3 lists the estimated parameters of GEV distribution for spatial heterogeneity factor
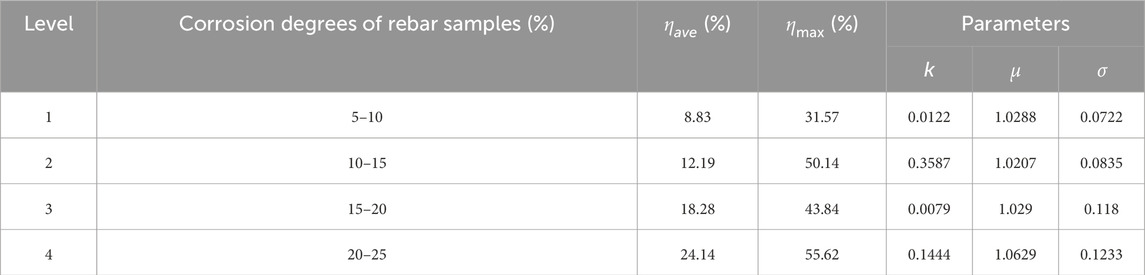
Table 3. Parameters estimation of GEV distribution under different corrosion levels.
To facilitate comparison with previous studies, the corresponding probability distribution function curves are presented in Figure 12. In these figures, the statistical histograms and blue solid lines represent the sample data and the corresponding GEV distributions of naturally corroded deformed rebars from this study. The red dotted lines represent the fitting results of Zhang et al. (2014) for accelerated corroded plain round rebars with a diameter of 20 mm, while the purple dotted lines represent the fitting results of Gu et al. (2018) for accelerated corroded deformed rebars with a diameter of 16 mm. Figure 12 illustrates that the spatial heterogeneity factors for different types of rebars in various environments exhibit distinct distribution patterns. For deformed rebars naturally corroded in the marine environment, the three-parameter Frechet distribution, more effectively characterizes probability density distributions for spatial heterogeneity factors under different corrosion levels.
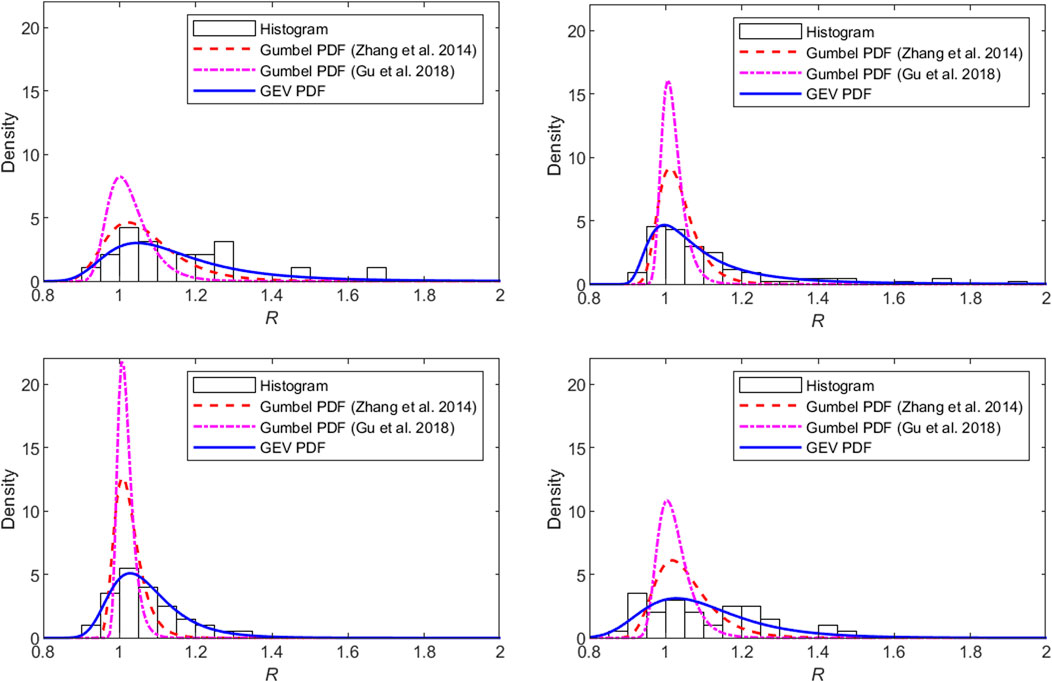
Figure 12. Comparison of probability density distribution curves for spatial heterogeneity factors under different corrosion levels. (A) Level 1 (B) Level 2 (C) Level 3 (D) Level 4.
6 Conclusion
(1) In the marine environment, corrosion of a rebar primarily occurs on the side adjacent to the concrete surface, predominantly in the form of non-uniform or pitting corrosion along the length and cross-section direction of rebars. Thus, evaluating structural durability based on a single section of rebar is unreliable.
(2) The residual cross-sectional areas of naturally corroded rebars in concrete structures generally follow a type III extreme value distribution, or a three-parameter Weibull distribution. However, no specific probability distribution model or clear correlation with the distribution pattern exists for rebars with varying corrosion levels.
(3) A comparison of the corrosion characteristics of rebars with different diameters in the same concrete member reveals that, in the same service environment, rebar diameter has minimal influence on the corrosion degree and form of corrosion in marine concrete members.
(4) In the marine environment, the spatial heterogeneity factors of naturally corroded rebars follow a type II extreme value distribution, or a three-parameter Frechet distribution. As corrosion progresses, both the position and scale parameters of the distribution function exhibit an increasing trend.
Data availability statement
The data that support the findings of this study are available from the corresponding authors upon reasonable request.
Author contributions
ZY: Conceptualization, Supervision, Validation, Writing–review and editing. JL: Investigation, Methodology, Writing–original draft, Writing–review and editing. JZ: Project administration, Validation, Writing–review and editing.
Funding
The authors declare that financial support was received for the research, authorship, and/or publication of this article. The authors gratefully acknowledge the support of the National Key Research and Development Program of China (grant number 2022YFB2603000).
Conflict of interest
Authors ZY, JL, and JZ were employed by CCCC Fourth Harbor Engineering Institute Co., Ltd.
Publisher’s note
All claims expressed in this article are solely those of the authors and do not necessarily represent those of their affiliated organizations, or those of the publisher, the editors and the reviewers. Any product that may be evaluated in this article, or claim that may be made by its manufacturer, is not guaranteed or endorsed by the publisher.
References
ACI Committee 318 (1989). Building code requirements for reinforced concrete and commentary (ACI 318-89/ACI 318R-89). Detroit: American Concrete Institute.
Almusallam, A. A. (2001). Effect of degree of corrosion on the properties of reinforcing steel bars. Constr. Build. Mater 15, 361–368. doi:10.1016/s0950-0618(01)00009-5
Apostolopoulos, C. A., Demis, S., and Papadakis, V. G. (2013). Chloride-induced corrosion of steel reinforcement – mechanical performance and pit depth analysis. Constr. Build. Mater 38AD, 139–146. doi:10.1016/j.conbuildmat.2012.07.087
Bazant, Z. P. (1979). Physical model for steel corrosion in concrete sea structures - application. J. Struct. Div. 105, 1155–1166. doi:10.1061/jsdeag.0005169
Bhargava, K., Ghosh, A. K., Mori, Y., and Ramanujam, S. (2007). Corrosion-induced bond strength degradation in reinforced concrete - analytical and empirical models. Nucl. Eng. Des. 237, 1140–1157. doi:10.1016/j.nucengdes.2007.01.010
Caleyo, F., Velázquez, J. C., Valor, A., and Hallen, J. M. (2009). Probability distribution of pitting corrosion depth and rate in underground pipelines: a Monte Carlo study. Corros. Sci. 51, 1925–1934. doi:10.1016/j.corsci.2009.05.019
Chen, J., Zhang, W., and Gu, X. (2019). Modeling time-dependent circumferential non-uniform corrosion of steel bars in concrete considering corrosion-induced cracking effects. Eng. Struct. 201, 109766. doi:10.1016/j.engstruct.2019.109766
Costa, A., and Appleton, J. (2002). Case studies of concrete deterioration in a marine environment in Portugal. Cem. Concr. Compos 24, 169–179. doi:10.1016/s0958-9465(01)00037-3
Du, Y. G., Clark, L. A., and Chan, A. H. C. (2005). Residual capacity of corroded reinforcing bars. Mag. Concr. Res. 57, 135–147. doi:10.1680/macr.2005.57.3.135
Fasano, G., and Franceschini, A. (1987). A multidimensional version of the Kolmogorov–Smirnov test. Mon. Not. R. Astron Soc. 225, 155–170. doi:10.1093/mnras/225.1.155
Fernandez, I., Lundgren, K., and Zandi, K. (2018). Evaluation of corrosion level of naturally corroded bars using different cleaning methods, computed tomography, and 3D optical scanning. Mater Struct. 51, 78. doi:10.1617/s11527-018-1206-z
Francois, R., Khan, I., and Dang, V. H. (2013). Impact of corrosion on mechanical properties of steel embedded in 27-year-old corroded reinforced concrete beams. Mater Struct. 46, 899–910. doi:10.1617/s11527-012-9941-z
Gao, X., Pan, Y., and Ren, X. (2019). Probabilistic model of the minimum effective cross-section area of non-uniform corroded steel bars. Constr. Build. Mater 216, 227–238. doi:10.1016/j.conbuildmat.2019.05.012
GB/T 51355-2019 (2019). Standard for durability assessment of existing concrete structures: GB/T 51355-2019. Beijing: China Architecture and Building Press.
Gonzalez, J. A., Andrade, C., Alonso, C., and Feliu, S. (1995). Comparison of rates of general corrosion and maximum pitting penetration on concrete embedded steel reinforcement. Cem. Concr. Res. 25 (2), 257–264. doi:10.1016/0008-8846(95)00006-2
Gu, X., Guo, H., Zhou, B., Zhang, W., and Jiang, C. (2018). Corrosion non-uniformity of steel bars and reliability of corroded RC beams. Eng. Struct. 167, 188–202. doi:10.1016/j.engstruct.2018.04.020
Jin, N. G., He, J. H., Fu, C. Q., and Jin, X. Y. (2020). Study on experimental method and morphology of accelerated non-uniform corrosion of steel bars. J. Zhejiang Univ. Eng. Sci. 54, 8. doi:10.3785/j.issn.1008-973X.2020.03.008
Kashani, M. M., Crewe, A. J., and Alexander, N. A. (2013). Use of a 3D optical measurement technique for stochastic corrosion pattern analysis of reinforcing bars subjected to accelerated corrosion. Corros. Sci. 73, 208–221. doi:10.1016/j.corsci.2013.03.037
Lim, S., Akiyama, M., Frangopol, D. M., and Jiang, H. (2017). Experimental investigation of the spatial variability of the steel weight loss and corrosion cracking of reinforced concrete members: novel X-ray and digital image processing techniques. Struct. Infrastruct. Eng. 13, 118–134. doi:10.1080/15732479.2016.1198397
Malumbela, G., Alexander, M., and Moyo, P. (2010). Variation of steel loss and its effect on the ultimate flexural capacity of RC beams corroded and repaired under load. Constr. Build. Mater 24, 1051–1059. doi:10.1016/j.conbuildmat.2009.11.012
Maslehuddin, M., Allam, I. A., and Ai-Sulainmani, G. J. (1990). Effect of rusting of reinforcing steel on its mechanical properties and bond with concrete. Mag. J. 87, 496–502. doi:10.14359/1902
Millington, N., Das, S., and Simonovic, S. P. (2011). The comparison of GEV, log-pearson type 3 and Gumbel distributions in the upper thames river watershed under global climate models. Water Resour. Res. Rep. no. 077.
Otieno, M., Beushausen, H., and Alexander, M. (2013). Prediction of corrosion rate in reinforced concrete structures – a critical review and preliminary results. Mater Corros. 63, 777–790. doi:10.1002/maco.201106282
Ou, Y. C., Susanto, Y. T. T., and Roh, H. (2016). Tensile behavior of naturally and artificially corroded steel bars. Constr. Build. Mater 103, 93–104. doi:10.1016/j.conbuildmat.2015.10.075
Reshvanlou, B. A., Nasserasadi, K., and Ahmadi, J. (2022). An innovative location-dependent stochastic model for prediction steel bars area under chloride ion attack in the presence of transverse rebars. Constr. Build. Mater 333, 127390. doi:10.1016/j.conbuildmat.2022.127390
Rosenkrantz, W. A. (2000). Confidence bands for quantile functions: a parametric and graphic alternative for testing goodness of fit. Am. Statistician 54 (3), 185–190. doi:10.2307/2685588
Stewart, M. G., and Al-Harthy, A. (2008). Pitting corrosion and structural reliability of corroding RC structures: experimental data and probabilistic analysis. Reliab Eng. Syst. Saf. 93, 373–382. doi:10.1016/j.ress.2006.12.013
Stewart, M. G., and Rosowsky, D. V. (1998). Time-dependent reliability of deteriorating reinforced concrete bridge decks. Struct. Saf. 20, 91–109. doi:10.1016/s0167-4730(97)00021-0
Tang, F., Lin, Z., Chen, G., and Yi, W. (2014). Three-dimensional corrosion pit measurement and statistical mechanical degradation analysis of deformed steel bars subjected to accelerated corrosion. Constr. Build. Mater 70, 104–117. doi:10.1016/j.conbuildmat.2014.08.001
Torres-Acosta, A. A., and Castro-Borges, P. (2013). Corrosion-induced cracking of concrete elements exposed to a natural marine environment for five years. Corrosion 69, 1122–1131. doi:10.5006/0844
Xi, X., and Yang, S. (2019). Investigating the spatial development of corrosion of corner-located steel bar in concrete by X-ray computed tomography. Constr. Build. Mater 221, 177–189. doi:10.1016/j.conbuildmat.2019.06.023
Xia, J., Jin, W., and Li, L. (2016). Performance of corroded reinforced concrete columns under the action of eccentric loads. J. Mater Civ. Eng. 28 (1), 04015087. doi:10.1061/(asce)mt.1943-5533.0001352
Xiao, Q. (2015). A method for calculating quantile function and its further use for data fitting. arXiv Prepr. doi:10.48550/arXiv.1508.06125
Yi, W., Kunnath, S. K., Sun, X., Shi, C., and Tang, F. (2010). Fatigue behavior of reinforced concrete beams with corroded steel reinforcement. ACI Struct. J. 107, 526–533.
Yuan, Y., Ji, Y., and Shah, S. P. (2007). Comparison of two accelerated corrosion techniques for concrete structures. ACI Struct. J. 104, 344–347. doi:10.14359/18624
Zeng, C., Zhu, J. H., Xiong, C., Li, Y., Li, D., and Walraven, J. (2020). Analytical model for the prediction of the tensile behaviour of corroded steel bars. Constr. Build. Mater 258, 120290. doi:10.1016/j.conbuildmat.2020.120290
Zhang, J. Z., Huang, J., Fu, C. Q., Huang, L., and Ye, H. L. (2021). Characterization of steel reinforcement corrosion in concrete using 3D laser scanning techniques. Constr. Build. Mater 270, 121402. doi:10.1016/j.conbuildmat.2020.121402
Zhang, R., Castel, A., and Francois, R. (2010). Concrete cover cracking with reinforcement corrosion of RC beam during chloride-induced corrosion process. Cem. Concr. Res. 40, 415–425. doi:10.1016/j.cemconres.2009.09.026
Zhang, W., Song, X., Gu, X., and Li, S. (2012). Tensile and fatigue behavior of corroded rebars. Constr. Build. Mater 34, 409–417. doi:10.1016/j.conbuildmat.2012.02.071
Zhang, W. P., Chen, J. P., Yu, Q. Q., and Gu, X. L. (2021). Corrosion evolution of steel bars in RC structures based on Markov chain modeling. Struct. Saf. 88, 102037. doi:10.1016/j.strusafe.2020.102037
Zhang, W. P., Zhou, B. B., Gu, X. L., and Dai, H. C. (2014). Probability distribution model for cross-sectional area of corroded reinforcing steel bars. J. Mater Civ. Eng. 26, 822–832. doi:10.1061/(asce)mt.1943-5533.0000888
Zhao, Y., Xu, X., Wang, Y., and Dong, J. (2020). Characteristics of pitting corrosion in an existing reinforced concrete beam exposed to marine environment. Constr. Build. Mater 234, 117392. doi:10.1016/j.conbuildmat.2019.117392
Keywords: corrosion level, rebar, apparent morphology, non-uniformity, probability distribution model
Citation: Ying Z, Li J and Zhao J (2024) Statistical analysis of apparent morphology and characteristics of corroded rebars of concrete in the marine environment. Front. Mater. 11:1478186. doi: 10.3389/fmats.2024.1478186
Received: 09 August 2024; Accepted: 30 September 2024;
Published: 21 October 2024.
Edited by:
Facundo Almeraya-Calderón, Autonomous University of Nuevo León, MexicoReviewed by:
Ricardo Orozco-Cruz, Universidad Veracruzana, MexicoCitlalli Gaona-Tiburcio, Autonomous University of Nuevo León, Mexico
Copyright © 2024 Ying, Li and Zhao. This is an open-access article distributed under the terms of the Creative Commons Attribution License (CC BY). The use, distribution or reproduction in other forums is permitted, provided the original author(s) and the copyright owner(s) are credited and that the original publication in this journal is cited, in accordance with accepted academic practice. No use, distribution or reproduction is permitted which does not comply with these terms.
*Correspondence: Zongquan Ying, MjgzODgyMTI4M0BxcS5jb20=