 Hongming Wang
 Zhikui Liu1*
- 1College of Civil Engineering and Architecture, Guilin University of Technology, Guilin, China
- 2Department of Construction Engineering, Guizhou Light Industry Technical College, Guiyang, China
Soil caves collapse are typical geological hazards in karst areas. The disintegration of red clay is one of the important mechanisms leading to soil caves collapse. The pH of the soil pore solution has changed due to acid rains and the overuse of fertilizers. This study conducted disintegration tests to observe the disintegration rate of red clay in solutions with different pH values by a self-made disintegration apparatus. The inductively coupled plasma mass spectrometer (ICP-MS) and Zeta potential analyzer were used to test the cations concentration in the solutions and the electric potential (ζ potential) of red clay, analyzing the effect of pH on the physicochemical properties and the disintegration rate of red clay, providing a scientific basis for evaluating and preventing soil caves collapse. The results show that the disintegration rate in solutions with different pH values follows the order of pH = 11 > pH = 9 > pH = 3 > pH = 5 > pH = 7. When pH < 7, the cations concentration and the cations charges density in the soil solutions increased as the pH decreases. The electric potential changed from negative to positive as the pH decreases, with the potential value first decreasing and then increasing. When pH > 7, the cations concentration, cations charges density in the soil solutions, and the electric potential increased with the pH increased. The ratio of charges density to electric potential increased under both acidic and alkaline conditions, the thickness of the clay diffusion layer decreased, short-range gravitational decayed and repulsion increased, ultimately leading to the disintegration of red clay.
1 Introduction
Red clay is widely distributed in the southern region of China, containing a large amount of clay minerals such as kaolinite, montmorillonite, and illite. It easily disintegrates when exposed to water, leading to various engineering geological problems such as soil caves collapse, karst collapse, and soil erosion (Zhang et al., 2013; Pradhan and Kim, 2015; Abad et al., 2016). The disintegration of red clay was considered to be an important cause of soil cave collapse (Liu et al., 2004; Klimchouk and Andrejchuk, 2005; Haji and Kamal, 2010; Jiang et al., 2018).
The discharge of a large amount of “wastewater, waste gas, and waste residue” has changed the pH of soil pore solution. The CO2 and sulfides emitted from petrochemical fuels have caused severe acid rain and environmental issues (Chen et al., 2021). Qian et al. reported the monthly average pH value of rain in Guilin City ranges from 3.84 to 5.38, with an annual frequency of acid rain reaching 81% (Qian et al., 2012). In agricultural production, fertilizers such as excessive use of sodium nitrate fertilizer caused soil solutions to become alkaline, while an excess of urea leaded the soil solution becoming acidic (Shi et al., 2016).
In the process of clay minerals forming in red clay, the Si4+ in the silicon-oxygen tetrahedral sheets and the Al3+ in the aluminum-hydroxide octahedral sheets were replaced by Al3+ and Mg2+, respectively, resulting the red clay exhibiting negative charges. It formed a double layer with the hydrated cations in the pore solution under the action of electrostatic attraction (Tang et al., 1999; Mitchell and soga, 2005; Mdlalose et al., 2019). Clay minerals in red mud can adsorb Pb2+、Cd2+、Cu2+ ions in contaminated water and alter the structural properties of red mud (Bai et al., 2022). The physical and chemical properties also underwent significant changes when the pH value of the pore solution varied (Penner and Lagaly, 2001; Erguler and Shakoor, 2009; Su et al., 2020). The strength of geopolymer formed by mixing red mud with fly ash increased first and then decreased with the pH value under alkaline conditions (Bai et al., 2023). Researchers conducted a large number of leaching tests on rock-soil samples by changing the pH of the solution and summarized the relationship between the disintegration rate and pH value (Deng et al., 2014; Ghobadi and Mousavi, 2014; Chen et al., 2015; Zhang et al., 2016; Jin et al., 2017; Xia et al., 2019; Li et al., 2021). The dissolution of free oxides such as Fe2O3 and Al2O3 was an important disintegration mechanism of red clay (Deshpande et al., 1968; Gupta and Singh, 1997; Sunil et al., 2006). The siloxane and alumina hydroxyl groups on the surface of clay minerals reacted chemically with H+ or OH−, changing the number or nature of charges on the surface of clay particles, enhancing surface chemical activity, and significantly altering the double layer structure of clay particles, which was one of the reasons for disintegration (Abate and Masini, 2005; Abollino et al., 2008; Adewuyi and Oderinde, 2019). Al Mahrouqi pointed that the surface charges of clay minerals varied significantly in pore solutions, and their control ability on hydration cations also varied (Al Mahrouqi et al., 2017). The electric potential of clay minerals gradually became more negative as the pH value increased (Thompson and Pownall, 1989; Pierre et al., 1990; Cicerone et al., 1992; Vdović, 2001; Eriksson et al., 2007). There were also reported that clay minerals carried unsaturated charges in different pH solutions, which could be either positive or negative charges (Siffert and Fimbel, 1984; Mahani et al., 2017).
Currently, acid rains and soil solution pollution are widespread. In order to understand the disintegration characteristics of red clay under different pH and provide a scientific basis for predicting and preventing soil caves collapse. This study focused on Guilin red clay, the self-made disintegration apparatus was used to observe the variation of disintegration rate in solutions with different pH values. ICP-MS and Zeta potential analyzer were used respectively to test the main cations concentrations of red clay particles in solutions with different pH and the variation of the electric potential of the soil particles. The double layer theory was used to analyze the mechanism of pH value on the disintegration characteristics of red clay.
2 Experimental materials
The red clay from the foundation pit of Guilin University of Technology’s new teaching building (Yanshan Campus) was air-dried, purified, dried, and crushed. The specific gravity of red clay particles was tested by the specific gravity bottle method after passing through a standard sieve of 0.075 mm for dried red clay. The liquid limit and plastic limit of the red clay were determined using a combined liquid and plastic limit device after passing through a standard sieve of 0.5 mm for dried red clay, and the plasticity index was calculated, the basic physical properties are shown in Table 1. The mineral composition of the dried red clay after passing through a standard sieve of 0.075 mm was analyzed using the German Bruker D8 Advance X-ray powder diffractometer. The X-ray diffraction (XRD) testing conditions were as follows: Cu target [Kα radiation (0.15418 nm)], tube voltage of 40 kV, tube current of 25 mA, scanning speed of 2°/min, scanning angle from 5° to 90°. The test results are shown in Figure 1.
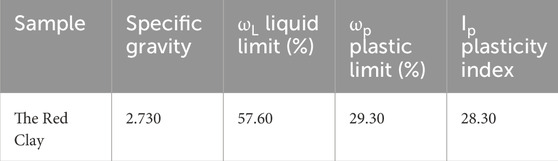
Table 1. Physical properties of Guilin red clay.
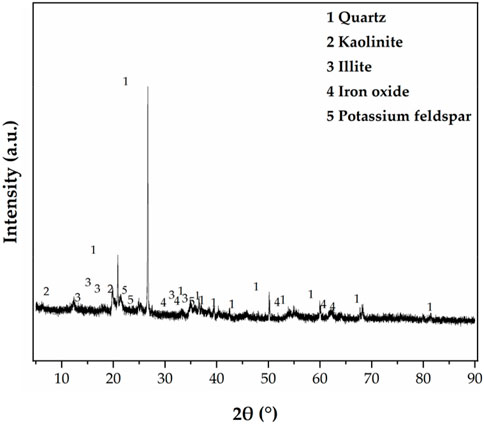
Figure 1. XRD diffraction results.
Figure 1 shows that quartz (SiO2) had the highest reflection and the largest content, accounting for 44.8% of the total mass; The clay minerals components were mainly illite (27.3%) and kaolinite (18.4%), with no montmorillonite observed. The clay minerals account for 45.7% of the total mass, and free iron oxide accounts for 5.6%.
Kaolinite is composed of several kaolinite unit cells, each kaolinite unit cell is formed by the connection of silicon-oxygen tetrahedral sheets and aluminum hydroxide octahedral sheets in a 1:1 ratio, with oxygen ions and hydroxyl ions exposed on both sides of the mineral surface. Illite is formed by the connection of several illite units crystal cells through K+ ion bonds. Each illite crystal cell is composed of silicon-oxygen tetrahedral sheets and aluminum hydroxide octahedral sheets in a 2:1 ratio. Therefore, the chemical bonds exposed on the surface of illite are all oxygen ions of siloxane.
The dried Guilin red clay passing through a 0.075 mm standard sieve was dissolved, and the leachate was extracted for determining the contents of major elements using an ICP. The test method is as follows: Approximately 0.07 g of red clay was weighed on a balance with an accuracy of 0.0001 g and placed in a Polytetrafluoroethylene (PTFE) digestion beaker. Subsequently, 3 mL HNO3 (69%), 3 mL HClO4 (70%), 3 mL HCl (37%), and 0.5 mL HF (40%) were added to the digestion beaker in sequence. After standing for 30 min, the digestion beaker was placed on a heating plate digestion instrument. The temperature was gradually increased and finally continuously digested at 200°C for about 180 min until the digestion solution remains 1–2 mL and no white smoke escaped. The digestion beaker was then placed in a ventilated hood to cool naturally to room temperature.
The prepared digestion solution was transferred to a 10 mL volumetric flask and rinsed with deionized water after washing the digestion cup, then made up to volume. The cations contents of the digestion solution were tested using an ICP-MS(Agilent 7800). The tuning solution for ICP-MS contained elements Ce, Co., Li, Mg, Ti, and Y at a concentration of 1 mg/L. The results are shown in Table 2.
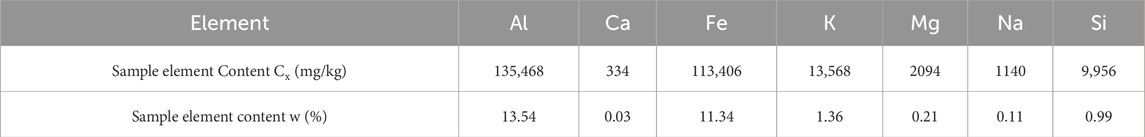
Table 2. Main cations contents of Guilin red clay.
3 Disintegration tests
3.1 Experimental design
According to the collected geotechnical investigation reports, the natural moisture content of Guilin red clay ranges from 24% to 31%, and the void ratio ranges from 0.98 to 1.15. Nine initial reshaped samples were prepared with three initial moisture contents of 26%, 28%, and 30%, and three void ratios of 1.0, 1.1, and 1.15, by combining the two indicators. The reshaped red clay sample was cylindrical, with a diameter of 60 mm, a height of 106 mm, and a volume of 300.0 cm3. The method for making samples is as follows: The dried red clay was sieved through a 2 mm standard sieve, and a suitable amount of pure water was added to it, ensuring its moisture content reached 26%, 28% and 30% respectively, and then sealed and allowed to stand for 24 h. The masses of red clay required for each sample was calculated according to Formula 1, and then the red clay was weighed and divided into four equal parts and added to the mold one by one. The surface of each layer of compacted soil was scarified to improve the connection between each layer of samples. The self-made disintegration apparatus is shown in Figure 2.
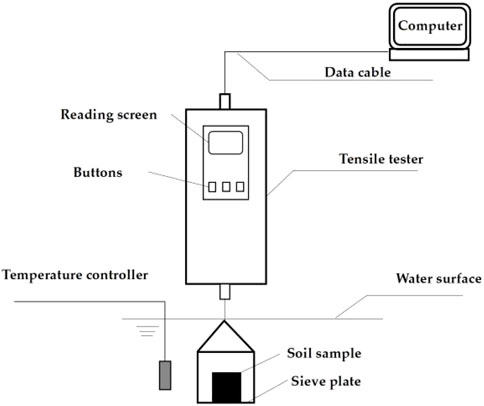
Figure 2. Self-made disintegration apparatus.
where ms represents the mass(g) of red clay required; Gs represents the specific gravity of red clay; V represents the volume (cm3) of the sample; ω represents the initial moisture content (%) of red clay; e represents the void ratio of the sample.
The disintegration tests were conducted under indoor conditions at a temperature of 20°C and a humidity of 60%. The probe of the temperature controller was inserted into the middle of the water tank to test the temperature of the dissolution solution. If the temperature was below 20°C, the temperature compensation device will start automatically. If the temperature of the dissolution solution was above 20°C, the solution will be naturally cooled to 20°C. The tensile tester was zeroed after being started, and the soil sample was placed on the sieve plate. The change in soil sample mass was recorded every second with an accuracy of 1 g.
The disintegration rate and disintegration resistance index were calculated according to Formulas 2, 3 respectively.
υ represents the disintegration rate (g/s) of the soil sample between ti and ti+1; Ai t, Ai+1 t represent the mass (g) of the sample at time ti and ti+1, respectively; ti, ti+1 represent the time (s); The disintegration solution was prepared using pure water and acidic or alkaline solutions with pH values of 3, 5, 9, and 11, respectively. According to the measurements, the pH of the pure water was between 6.8 and 7.1, so pure water was used to simulate a solution with pH = 7. Pure water was prepared by the YAZD-5 electrically heated purified water sterilizer in the on-campus laboratory, and its quality meets the third-level water standard specified by the People’s Republic of China. The solutes used in preparing acidic and alkaline solutions were all from China National Pharmaceutical Group Chemical Reagent Co., Ltd. Solid particles of sodium hydroxide, with a purity of 99.5%, and liquid concentrated hydrochloric acid, with a concentration of 36.0%. The disintegration tests scheme is shown in Table 3.
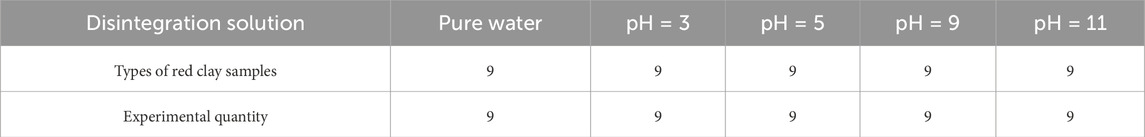
Table 3. Disintegration tests scheme.
3.2 Red clay disintegration tests results
The disintegration curves of red clay under different pH conditions are shown in Figure 3. The 26% red clay slowly disintegrated or did not disintegrate in pure water. The 26% red clay with e = 1.0, after soaking for 2000 s, there was no debris falling off, and the weight of the soil sample increased by 8g, indicating that the soil mass increased in moisture content. The 26% red clay with e = 1.1 and e = 1.15, the samples disintegrated slowly with disintegration rates of 0.055 g/s and 0.974 g/s respectively, the disintegration solution was relatively clear, and no bubbles were observed overflowing. The 28% red clay with e = 1.0 did not disintegrate in pure water. The 28% red clay with e = 1.1 and e = 1.15, exhibited a small amount of fragmentation and peeling off, with disintegration rates of 0.029 g/s and 0.047 g/s, respectively, slightly lower than that of the 26% case. The 30% red clay with e = 1.0 did not disintegrate in pure water. The 30% red clay with e = 1.1 and e = 1.15, disintegrated very slowly at rates of 0.002 g/s and 0.045 g/s, respectively, slightly lower than that of the 28% case.
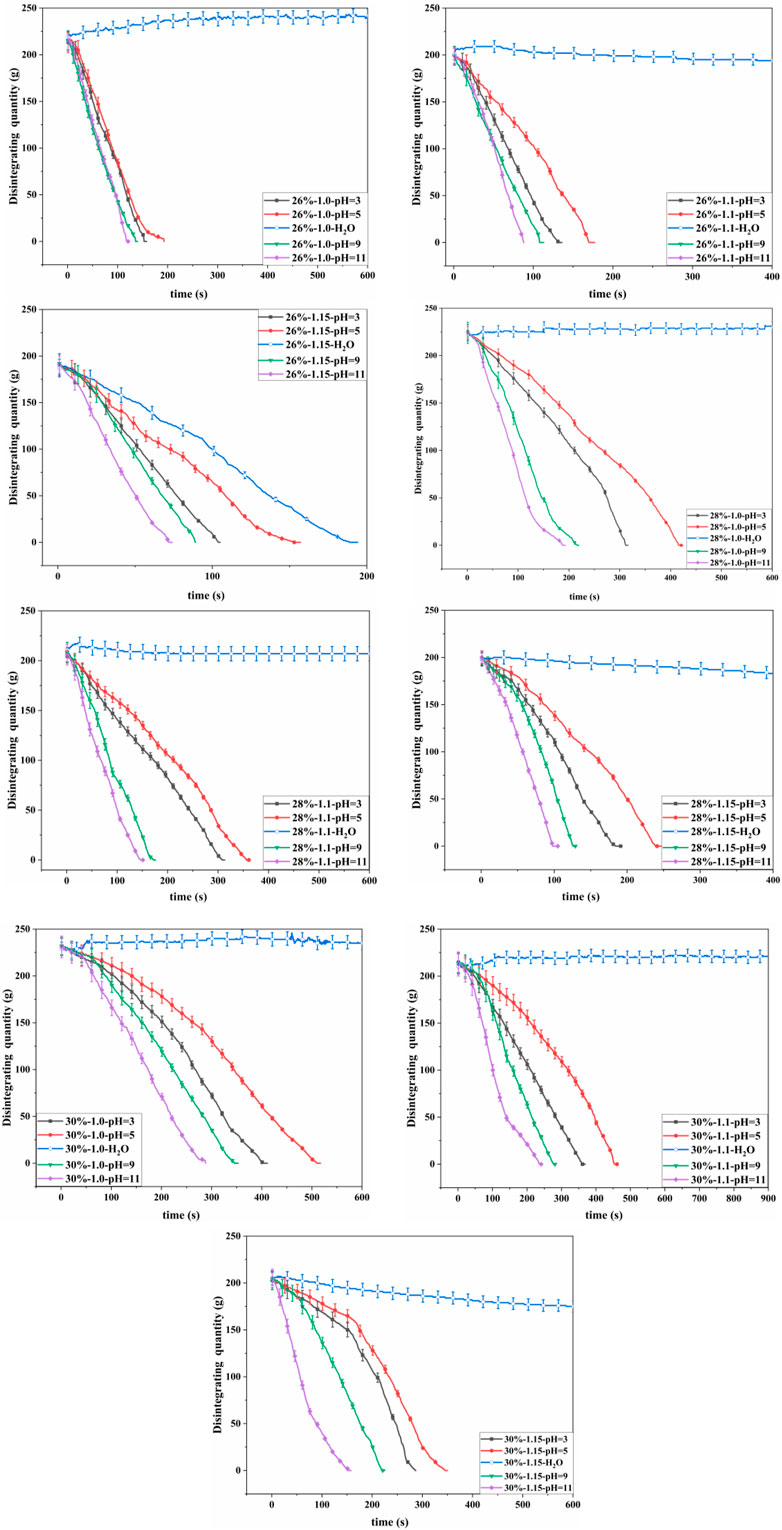
Figure 3. Disintegration curves of various red clays in solutions with different pH values.
The disintegration rates of the 26% red clay with e = 1.0 in solutions with pH = 3, 5, 9, 11 were 1.387 g/s, 1.092 g/s, 1.558 g/s, 1.775 g/s respectively. The disintegration rate of the 26% red clay with e = 1.1 in various acidic and alkaline solutions ranged from 1.157 g/s to 2.211 g/s, with an increase in disintegration rate ranged from 3205.7% to 6217.1% compared to pure water. The disintegration rate of the 26% red clay with e = 1.15 in various acid and alkaline solutions ranged from 1.232 g/s to 2.581 g/s, with an increase in disintegration rate ranged from 26.5% to 164.9% compared to pure water. The disintegration rate of the 26% red clay in acidic and alkaline solutions followed the order of pH = 11 > pH = 9 > pH = 3 > pH = 5 > pH = 7. The disintegration rate of other red clay samples in acidic and alkaline solutions was consistent with that of the 26% red clay. Contrary to the previous studies that the disintegration rate of red clay increases with decreasing pH. However, experiments proved that the disintegration rate of red clay was stronger in alkaline solutions than in acidic solutions, the disintegration rate increased with increasing pH in alkaline solutions and decreased with decreasing pH in acidic solutions.
4 The impact of pH on the physicochemical properties of red clay
To test the cations concentrations of red clay particles in solutions with different pH values, the dried red clay was sieved through a 0.075 mm standard sieve. Samples of 5 g each were accurately weighed using an electronic balance with an accuracy of 0.1 g. Each piece red clay, with a soil-to-water ratio of 1:5, was placed in pure water and solutions of various pH values. After stirring with a glass rod and allowing to stand for 30 min, the cations concentrations were measured using an ICP-MS (Agilent 7800). The indoor temperature was kept constant at 20°C with a humidity of 60% during the experiment. The test results are shown in Table 4.
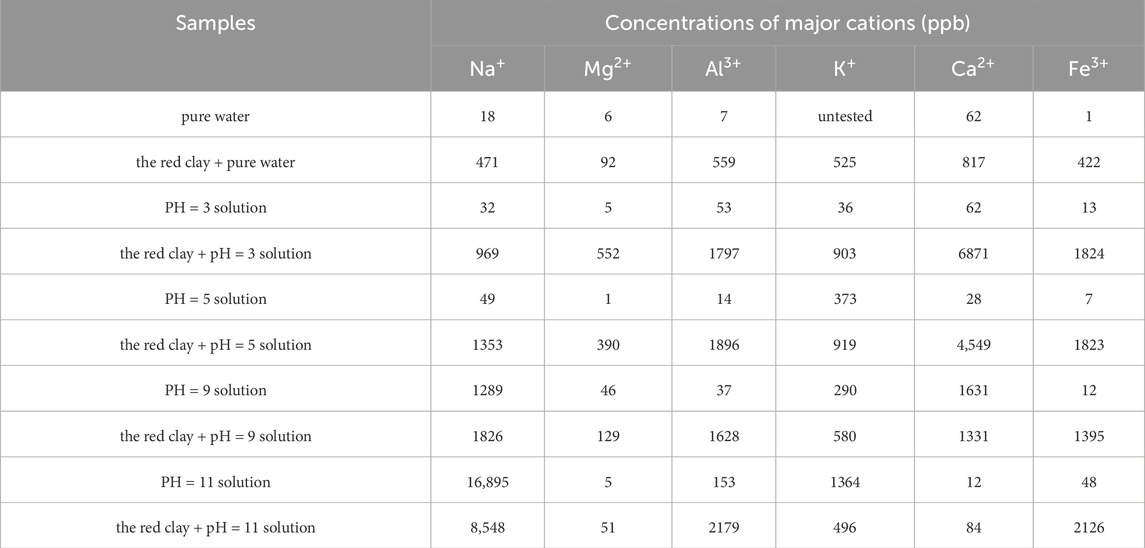
Table 4. Concentrations of major cations in various solutions.
The cations concentration in the soil-water mixture solution of red clay and pure water increased significantly to 2886 ppb. This was mainly due to the soluble salts releasing a large number of cations and anions when they encountered water, as well as the hydrolysis of substances like free iron oxide and silicon dioxide, with reaction equations from Equations 3–6:
The siloxane groups on the outer surface of kaolinite, illite, and at the edges of crystal lattice fractures are similar to silicon dioxide, hydrolysis leaded to the clay particles carrying unsaturated negative charges. The alumina hydroxyl groups on the outer surface of kaolinite are similar to aluminum trioxide, hydrolysis leaded to the clay particles carrying unsaturated positive charges, with reaction Equations 7, 8:
The cations concentration in the mixed solution of red clay in acidic environment increased significantly. The free Fe2O3 in red clay was dissolved by H+, resulting in a significant increase in Fe3+ concentration compared to pure water. However, due to the relatively low content of Fe2O3, the Fe3+ concentration was comparable in solutions with pH of five and pH of 3. The reaction Equation 9. The Ca2+ concentration increased by 456.66% in a solution at pH = 5 compared to pure water, and by 740.87% in a solution at pH = 3. The Mg2+ concentration increased by 320.55% in a solution at pH = 5 compared to pure water, and by 494.98% in a solution at pH = 3. This is because minerals containing Ca2+ and Mg2+ were dissolved in acidic environments, and the lower the pH value, the greater the degree of dissolution. The cations concentration of the mixed solution increases significantly as the pH decreases under acidic conditions. The increase in H+ can greatly enhance the cations concentration, providing more adsorbable ions for colloidal particles.
According to reaction Equations 5–8, it can be seen that the siloxane groups on the outer surface of clay minerals were basically not hydrolyzed in acidic environments, while the alumina hydroxyl groups on the outer surface of kaolinite were hydrolyzed to a greater extent as the pH decreases. The positive charge on the surface of clay minerals gradually increased, and can even change the charge properties of the colloid surface.
The cations concentration in the mixed solution of red clay increased significantly in an alkaline environment. In alkaline conditions, Fe2O3 in red clay underwent hydrolysis, as shown in Equation 9. The higher the pH value, the stronger the hydrolysis degree, leading to an increase in Fe3+ concentration in the solution. As a result, the unsaturated negative charge of Fe2O3 colloids increases, enhancing the adsorption capacity of red clay for cations. The alumina hydroxyl groups on the surface of kaolinite underwent hydrolysis in alkaline environment, and the reaction equation is as follows Equation 10. The higher the pH value, the greater the hydrolysis degree. The Al3+ concentration increased by 190.92% and 289.32% compared to pure water. According to reaction Equation 6, the hydrolysis of siloxane groups on the surfaces of kaolinite and illite was enhanced, leading to an increase in unsaturated negative charges on the clay surfaces. The cations concentration in the soil-water mixture gradually increases with the rise of pH in an alkaline environment.
The charges density of each mixed solution was calculated according to Formula 11, and the results are shown in Table 5.
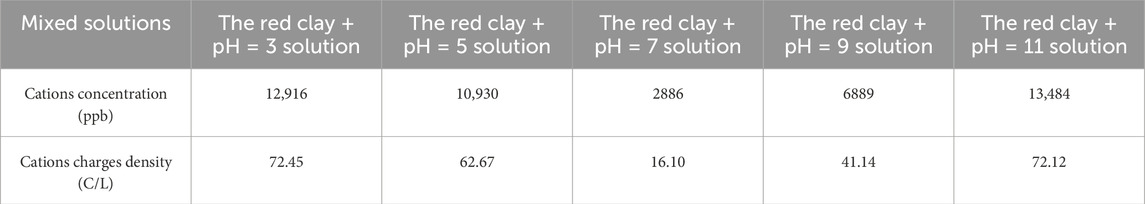
Table 5. Cations concentration and charges density of red clay in solutions at various pH values.
where ρ represents the charges density in system (C/L); zi is the charge number of the i ion; Ci is the mass fraction of the i ion (% or ppb); Mi is the molar mass of the i ion (g/mol); NA is Avogadro’s constant (6.02×10²³).
Table 5 reveals that a decrease in pH of the pore solution of red clay to below seven leaded to a remarkable increase in both cations concentration and charges density. Conversely, an increase in pH above seven resulted in an increase in both cations concentration and charges density. The pH value directly controled the ions concentration and charges density in the pore solution, H+ (or OH−) determined the cations composition of the red clay solutions.
5 The impact of pH value on the electrical potential and disintegration characteristics of red clay
The kaolinite and illite of exhibit isomorphic substitution, and the hydrolysis of siloxane and alumina hydroxyl groups on the external surface of clay particles imparts a certain degree of unsaturated charges. This leads to form a double layer with the counterions in the pore solution. The counterions adjacent to the clay surface is strongly attracted, known as the fixed layer. The attractive force on the counter ions decreases as the distance between the surfaces of the clay particles increases, leading to an outward diffusion tendency, known as the diffuse layer. Due to the difference in ions concentrations between the fixed layer and the diffusion layer, there is a certain potential between the layers, known as the electric potential (ζ potential). The changes in pH affect the charge properties, quantity, and electrokinetic potential of clay particles.
The dried red clay with particle size less than 0.075 mm was dispersed in pure water and solutions of various pH to achieve a mass fraction of 0.1%. Each mixed solution was sonicated for 3 min at 20°C and placed in the test chamber of zeta potential analyzer (British Marwin Instruments Company, ZS-90). The electric potential of each solution was tested three times, and the average value was taken. The indoor temperature was kept constant at 20°C with a humidity of 60%.The results are shown in Table 6.

Table6. The Zeta potential of red clay in solutions with different pH values.
As shown in Table 6, The hydrolysis of free oxides and alumina hydroxyl groups in solution at pH = 7 did not change the charge properties of clay minerals, and the zeta potential of the red clay mixed solution was −10.30 mV. The hydrolysis degree of alumina hydroxyl and free Fe2O3 in a mixed solution at pH = 5 increased, the positive charge on the surface of clay particles increased significantly, anions in the solution were adsorbed, and the electric potential was +1.21 mV. The degree of hydrolysis further increased as the pH decreased to 3, and the electric potential increased to +18.80 mV. Under acidic conditions, the electric potential of red clay gradually changed from negative to positive, and the adsorbed counter ions changed from cations to anions, with the potential value first decreasing and then increasing.
The hydrolysis of siloxane, alumina hydroxyl groups in clay minerals, and free Fe2O3 were enhanced in a mixed solution at pH = 9, with an electric potential of −22.07 mv. The concentration of Ca2+ in a solution at pH = 9 was 1631 ppb, while the concentration of Ca2+ leached from red clay after contact with water was 817 ppb. The theoretical value of Ca2+ concentration in a mixed solution of red clay + pH = 9 was 2448 ppb, but the measured concentration was 1331 ppb, indicating significant adsorption of Ca2+. The variation pattern of ions such as K+ and Mg2+ was similar to that of Ca2+. On the contrary, the Na+ concentration in the pH = 9 solution was 1289 ppb, and the Na+ concentration leached in water was 471 ppb. The theoretical Na+ concentration was 1760 ppb. However, the measured Na+ concentration in the mixed solution of red clay with pH = 9 was 1826 ppb, indicating that some Na+ were desorbed. The hydrolysis became more active in a solution with a pH of 11, the negative charges on the clay particle surface increased, the electric potential was −32.40 mV, the adsorption capacity for cations was enhanced, and the concentrations of Na+, K+, Mg2+, and Ca2+ were significantly reduced. Under alkaline conditions, the electric potential of red clay was always negative, and the potential increased with the increase of pH value. The pH value directly controled the dissolution and hydrolysis reactions of red clay, changing the electric potential properties and magnitude of red clay. The H+ ions determined the electric potential of red clay.
In the past, the disintegration mechanism of red clay was mostly based on the theory of double layers theory. Most studies only focused on the changes in cations charges density or the electric potential of red clay caused by mineral dissolution or hydrolysis in acidic or alkaline solutions. It was found that both the cations charges density and the electric potential of red clay changed in acidic or alkaline solutions. In this study, a semi-empirical formula relating charge density and electric potential to diffusion layer thickness was established using the scaling method to explain the mechanism of red clay disintegration in complex situations.
Assuming that the counterions in the diffuse layer are point charges following the Boltzmann distribution and that there is only one type of symmetric electrolyte in the system, the concentrations of positive and negative ions, n+ and n-, within the double layer per unit volume can be calculated using Equations 12, 13.
n is the ion concentration (Number of ions/cm3); z is the valence of the ion; e is the charge of an electron (1.6 × 10−19.C); k is the Boltzmann constant; zeψ is the potential energy (J), the work done in moving a charge from infinity to position x; T is the temperature of the medium (K).
Let ρ denote the volume charges density within the double layer, then it follows that.
Order
Given
Suppose that the surface of the colloids are infinite flat planes, with diffusion occurring only in the x-axes, and ψ remaining constant in the y- and z-axes, then
Substitute Equation 16 into Equation 17 to obtain Equation 18.
Where ε is the dielectric constant of the mixed solution.
Given that the electric potential of clay colloids is generally low, it follows that:
Thus, the potential decreases exponentially with distance, the center of gravity of the diffusion layer is located at a distance
Substitute Equation 17 into Equation 19, then
Let
According to Equation 21, the thickness of diffusion layer is inversely proportional to the parameter M1/2. The counterions concentration in the diffusion layers gradually decreased until they are the same as the concentrations in the pore solution. The counterions concentration in the diffusion layer was greater than that in the pore solution. Applying the scaling method to reduce the counterions concentration in diffusion layers to pore solution, the changes in the thickness of the diffusion layer in various solution environments can be readily determined. Although scaling the concentration of cations does not provide the absolute thickness of the diffusion layer, it can qualitatively analyze the variation of the diffusion layer thickness with pH value.
The electric potential of red clay in solutions with pH = 3 and five was positive, and the counterions were anions. When determining the thickness of the diffusion layer, the anion charges density should be used, but since the pore solution is electrically neutral, the cation charges density can be instead. The results are shown in Table 7.

Table 7. Changes in thickness of red clay diffusion layer.
According to Equation 21 and Table 7, it can be seen that the ratio of charges density to electric potential of Guilin red clay gradually increased in various acid or alkaline solutions, while κ−1 continuously decreases, indicating that the thickness of the diffuse layer of each clay particle decreased to varying degrees. The diffusion layer of clay particles gradually decreased, the distance between adjacent clay particles increased, the interparticle attraction significantly decreased, the concentration of like-charged ions increased in the diffusion layer, the interparticle repulsion increased, and red clay was more prone to disintegration.
6 Conclusion
1. The disintegration rate of Guilin red clay varies with pH, follows the order: pH = 11 > pH = 9 > pH = 3 > pH = 5 > pH = 7. Experimental results show that the disintegration rate of red clay in alkaline environments is higher than that in acidic environments, which is not completely consistent with the disintegration law of soft rocks.
2. The soluble minerals in the Guilin red clay dissolve in water, and the clay minerals and free oxides hydrolyze, increasing the concentration of cations such as Na+, K+, Mg2+, Ca2+, Al3+, Fe3+ in the mixed solution. The cations concentration reaches 2886 ppb, and the cations charges density is 16.10 C/L. The cations composition and cations charges density of the solution are altered when red clay dissolved in pure water, promoting various physicochemical reactions and altering its engineering properties.
3. The poorly soluble minerals in red clay and alumina hydroxyl groups on the surface of clay minerals undergo dissolution and hydrolysis in acidic environments, and hydrolysis reactions in alkaline environments, leading to an increase in caions concentration and charges density in mixed solution. Therefore, H+ is the determining ion for the composition of the mixed solutions.
4. Under acidic conditions, the electric potential of red clay gradually changes from negative to positive, with its value decreasing and then increasing as the pH decreases. Under alkaline conditions, the electric potential of red clay remains negative, and its value increases with increasing pH. H+ (or OH−) is the defining ion for the electric potential of red clay, which can change the hydrolysis process of clay minerals and the variable charge quantity, causing the electric potential of red clay to change.
5. In acidic or alkaline conditions, H+ (or OH−) changes the composition and potential of the mixed solutions, and the ratio of charges density to electric potential is higher than that in pure water, the diffusion layers shrink, the short-range interparticle attraction rapidly decays, ultimately leading to the disintegration of red clay. To suppress the disintegration of red clay and prevent soil caves collapse, the charges density and pH value of soil solution should be controlled, such as reducing the use of chemical fertilizers and pesticides, treating industrial wastewater before discharge, and planting green plants extensively.
Data availability statement
The original contributions presented in the study are included in the article/supplementary material, further inquiries can be directed to the corresponding author.
Author contributions
HW: Conceptualization, Data curation, Investigation, Writing–original draft, Writing–review and editing. ZL: Conceptualization, Funding acquisition, Methodology, Project administration, Writing–review and editing. YX: Data curation, Formal Analysis, Investigation, Writing–original draft. SL: Data curation, Funding acquisition, Investigation, Writing–original draft.
Funding
The author(s) declare that financial support was received for the research, authorship, and/or publication of this article. This research was funded by the National Natural Science Foundation of China (Grant No. 41867039 and Grant No. 52268055), the Guangxi Key Laboratory of Geomechanics and Geotechnical Engineering (Grant No. 20-Y-XT-03), the Foundation Engineering of Technical Innovation Center of Mine Geological Environmental in Southern Area (Grant No. CXZX2020002), and the Guangxi Science and Technology Program (Grant No. 2022JJB160082).
Conflict of interest
The authors declare that the research was conducted in the absence of any commercial or financial relationships that could be construed as a potential conflict of interest.
Publisher’s note
All claims expressed in this article are solely those of the authors and do not necessarily represent those of their affiliated organizations, or those of the publisher, the editors and the reviewers. Any product that may be evaluated in this article, or claim that may be made by its manufacturer, is not guaranteed or endorsed by the publisher.
References
Abad, S. A. N. K., Tugrul, A., Gokceoglu, C., and Armaghani, D. J. (2016). Characteristics of weathering zones of granitic rocks in Malaysia for geotechnical engineering design. Eng. Geol. 200, 94–103. doi:10.1016/j.enggeo.2015.12.006
Abate, G., and Masini, J. C. (2005). Sorption of atrazine, propazine, deethylatrazine, deisopropylatrazine and hydroxyatrazine onto organovermiculite. J. Braz. Chem. Soc. 16, 936–943. doi:10.1590/s0103-50532005000600008
Abollino, O., Giacomino, A., Malandrino, M., and Mentasti, E. (2008). Interaction of metal ions with montmorillonite and vermiculite. Appl. Clay Sci. 38 (3-4), 227–236. doi:10.1016/j.clay.2007.04.002
Adewuyi, A., and Oderinde, R. A. (2019). Chemically modified vermiculite clay: a means to remove emerging contaminant from polluted water system in developing nation. Polym. Bull. 76, 4967–4989. doi:10.1007/s00289-018-2643-0
Al Mahrouqi, D., Vinogradov, J., and Jackson, M. D. (2017). Zeta potential of artificial and natural calcite in aqueous solution. Adv. colloid interface Sci. 240, 60–76. doi:10.1016/j.cis.2016.12.006
Bai, B., Bai, F., Li, X., Nie, Q., Jia, X., and Wu, H. (2022). The remediation efficiency of heavy metal pollutants in water by industrial red mud particle waste. Environ. Technol. Innov. 28, 102944. doi:10.1016/j.eti.2022.102944
Bai, B., Fan, B., Nie, Q., and Jia, X. (2023). A high-strength red mud–fly ash geopolymer and the implications of curing temperature. Powder Technol. 416, 118242. doi:10.1016/j.powtec.2023.118242
Chen, Q., Li, J., and Zhao, L. (2015). Experimental research on disintegration characteristics of weathered granite in nanyue region. Chin. J. Undergr. Space Eng. 11, 119–124.
Chen, X., Shan, X. R., Shi, Z. J., Zhang, J., Qin, Z., Xiang, H. M., et al. (2021). Analysis of the spatio-temporal changes in acid rain and their causes in China (1998-2018). J. Resour. Ecol. 12 (5), 593–599. doi:10.5814/j.issn.1674-764x.2021.05.002
Cicerone, D. S., Regazzoni, A. E., and Blesa, M. A. (1992). Electrokinetic properties of the calcite/water interface in the presence of magnesium and organic matter. J. Colloid Interface Sci. 154 (2), 423–433. doi:10.1016/0021-9797(92)90158-i
Deng, T., Zhan, J. W., Huang, M., and Fan, F. T. (2014). Disintegration characteristics test of red-bed soft rock argillaceous shale in acid and alkali environment. J. Eng. Geol. 22 (2), 238–243.
Deshpande, T. L., Greenland, D. J., and Quirk, J. P. (1968). Changes in soil properties associated with the removal of iron and aluminium oxides. J. Soil Sci. 19 (1), 108–122. doi:10.1111/j.1365-2389.1968.tb01525.x
Erguler, Z. A., and Shakoor, A. (2009). Relative contribution of various climatic processes in disintegration of clay-bearing rocks. Eng. Geol. 108 (1-2), 36–42. doi:10.1016/j.enggeo.2009.06.002
Eriksson, R., Merta, J., and Rosenholm, J. B. (2007). The calcite/water interface: I. Surface charge in indifferent electrolyte media and the influence of low-molecular-weight polyelectrolyte. J. colloid interface Sci. 313 (1), 184–193. doi:10.1016/j.jcis.2007.04.034
Ghobadi, M. H., and Mousavi, S. (2014). The effect of pH and salty solutions on durability of sandstones of the Aghajari Formation in Khouzestan province, southwest of Iran. Arabian J. Geosciences 7, 641–653. doi:10.1007/s12517-012-0741-0
Gupta, A. K., and Singh, D. N. (1997). Interaction of contaminants with soils: a review. Indian Geotechnical J. 27, 75–87.
Haji, K., and Kamal, T. (2010). Hazards and mechanism of sinkholes on kabudar ahang and famenin plains of hamadan. Iran. Nat. Hazards. 55, 481–499. doi:10.1007/s11069-010-9541-6
Jiang, F., Li, L., and Chen, H. (2018). Study on the critical conditions of karst collapse development in Guiyang Yongwen Middle School. Chin. J. Karst 37 (02), 294–299.
Jin, X., Xiong, C. X., and Zhong, F. L. (2017). Experimental study on disintegration characteristics of granite residual soil under acid pollution. J. Water Resour. Archit. Eng. 15, 194–198.
Klimchouk, A., and Andrejchuk, V. (2005). Karst breakdown mechanisms from observations in the gypsum caves of the Western Ukraine: implications for subsidence hazard assessment. Environ. Geol. 48, 336–359. doi:10.1007/s00254-005-1279-1
Li, S. M., Liu, Z. K., and Meng, J. P. (2021). Disintegration effect of saturated red clay under the action of (NH4) 2CO3. J. Yangtze River Sci. Res. Inst. 38 (11), 115.
Liu, Z., Liang, J., and Zhou, J. (2004). Analysis of the development mechanism of soil caves in karst areas. J. Eng. Geol. 12, 45–49.
Mahani, H., Keya, A. L., Berg, S., and Nasralla, R. (2017). Electrokinetics of carbonate/brine interface in low-salinity waterflooding: effect of brine salinity, composition, rock type, and pH on ζ-potential and a surface-complexation model. Spe J. 22 (01), 53–68. doi:10.2118/181745-pa
Mdlalose, L., Balogun, M., Setshedi, K., Chimuka, L., and Chetty, A. (2019). Adsorption of phosphates using transition metals-modified bentonite clay. Sep. Sci. Technol. 54 (15), 2397–2408. doi:10.1080/01496395.2018.1547315
Mitchell, J. K., and Soga, K. (2005) Fundamentals of soil behavior, 3. New York: John Wiley and Sons.
Penner, D., and Lagaly, G. (2001). Influence of anions on the rheological properties of clay mineral dispersions. Appl. Clay Sci. 19 (1-6), 131–142. doi:10.1016/s0169-1317(01)00052-7
Pierre, A., Lamarche, J. M., Mercier, R., Foissy, A., and Persello, J. (1990). Calcium as potential determining ion in aqueous calcite suspensions. J. dispersion Sci. Technol. 11 (6), 611–635. doi:10.1080/01932699008943286
Pradhan, A. M. S., and Kim, Y. T. (2015). Application and comparison of shallow landslide susceptibility models in weathered granite soil under extreme rainfall events. Environ. Earth Sci. 73, 5761–5771. doi:10.1007/s12665-014-3829-x
Qian, J., Zhang, L., Chi, Z., and Meng, S. (2012). Time-space distribution and merucry pollution of the acid rain in Guilin. Adv. Earth Sci. 27 (S1), 390–392.
Shi, C., Guo, Y., and Zhu, J. (2016). Evaluation of excessive application of chemical fertilizers in China's grain production and its influencing factors. Mod. Agric. Res. 37 (04), 671–679.
Siffert, D., and Fimbel, P. (1984). Parameters affecting the sign and magnitude of the eletrokinetic potential of calcite. Colloids Surfaces 11 (3-4), 377–389. doi:10.1016/0166-6622(84)80291-7
Su, X., Tang, H., Huang, L., Shen, P., and Xia, D. (2020). The role of pH in red-stratum mudstone disintegration in the Three Gorges reservoir area, China, and the associated micromechanisms. Eng. Geol. 279, 105873. doi:10.1016/j.enggeo.2020.105873
Sunil, B. M., Nayak, S., and Shrihari, S. (2006). Effect of pH on the geotechnical properties of laterite. Eng. Geol. 85 (1-2), 197–203. doi:10.1016/j.enggeo.2005.09.039
Tang, D. X., Liu, Y. R., Zhang, W. S., and Wang, Q. (1999). Geotechnical engineering. China. Beijing: Geological Publishing House.
Thompson, D. W., and Pownall, P. G. (1989). Surface electrical properties of calcite. J. colloid interface Sci. 131 (1), 74–82. doi:10.1016/0021-9797(89)90147-1
Vdović, N. (2001). Electrokinetic behaviour of calcite—the relationship with other calcite properties. Chem. Geol. 177 (3-4), 241–248. doi:10.1016/s0009-2541(00)00397-1
Xia, J. W., Cai, C. F., Wei, Y. J., and Wu, X. L. (2019). Granite residual soil properties in collapsing gullies of south China: spatial variations and effects on collapsing gully erosion. Catena 174, 469–477. doi:10.1016/j.catena.2018.11.015
Zhang, X., Fan, H., and Yang, X. (2013). Study on the influence of bulk density and moisture content on the rate of static water erosion of sandy clay loam. Acta Pedol. Sin. 50, 214–218.
Keywords: pH value, disintegration, dissolution, hydrolysis, electric potential
Citation: Wang H, Liu Z, Xie Y and Li S (2024) Experimental study on the disintegration behavior of red clay under different pH conditions. Front. Mater. 11:1477269. doi: 10.3389/fmats.2024.1477269
Received: 07 August 2024; Accepted: 30 August 2024;
Published: 20 September 2024.
Edited by:
Bing Bai, Beijing Jiaotong University, ChinaReviewed by:
Chen Peipei, Beijing University of Civil Engineering and Architecture, ChinaMing Zhang, Nanjing Forestry University, China
Copyright © 2024 Wang, Liu, Xie and Li. This is an open-access article distributed under the terms of the Creative Commons Attribution License (CC BY). The use, distribution or reproduction in other forums is permitted, provided the original author(s) and the copyright owner(s) are credited and that the original publication in this journal is cited, in accordance with accepted academic practice. No use, distribution or reproduction is permitted which does not comply with these terms.
*Correspondence: Zhikui Liu, MTk5ODAwOUBnbHV0LmVkdS5jbg==