 Jinglu Zhang1
 Yu Liu
 Shao-Bo Kang
- 1SWJTU-Leeds Joint School, Southwest Jiaotong University, Chengdu, China
- 2School of Civil Engineering, Southwest Jiaotong University, Chengdu, China
- 3MOE Key Laboratory of High-speed Railway Engineering, Southwest Jiaotong University, Chengdu, China
- 4School of Civil Engineering, Chongqing University, Chongqing, China
This paper presents experimental and numerical studies on compression behaviour of equal-leg steel angles with bolted connection and subjected to local defect at the bolt hole. To simulate corrosion, a mechanical cutting method was used in the experimental test to increase the diameter of bolt holes, and a total of 18 steel angles were investigated in the study. The parameters considered included the slenderness and the diameter of bolt holes. The slendernesses of steel angles were 80 and 140, and the diameter of bolt holes ranged from 21.5 to 27.5 mm. Additionally, numerical models were established for the steel angles. The accuracy of the numerical model was verified by comparing experimental data with numerical results. Based on the validated numerical model, a parametric analysis was conducted to quantitatively assess the influences of the slenderness and the diameter of bolt holes on the load capacity of specimens against global buckling. Experimental and numerical results showed that the defect at the bolt hole affected the load capacity of specimens when the diameter of the bolt hole was increased to 27.5 mm and the slenderness was not greater than 100.
1 Introduction
Equal-leg steel angles are widely used in the structures of transmission towers due to their diverse sectional dimensions, ease of fabrication, and convenient connection options. In the towers, steel angles connected with bolts at one leg are often used as inclined compression or tension members. The overall buckling behaviour of these steel angles has become the focus of research studies (Adluri and Madugula, 1996; Bathon et al., 1993; Shi et al., 2011; Wakabayashi and Nonaka, 1965; Cao et al., 2017; Chen, 2012; Liu et al., 2021).
Since transmission towers operate outdoors in the service life and they are frequently subjected to various weathering conditions, making the steel angle highly susceptible to varying degrees of corrosion (Huang et al., 2023). Corrosion alters the chemical and physical properties of steel, thereby reducing the behaviour and resistance of components. For corroded steel angles, it is essential to carefully assess their residual load capacities to ensure safety. Researchers have conducted various compression tests to quantify the overall buckling load of steel angles with corrosion. Beaulieu et al. (2010) considered the corrosion of 16 steel angles by immersing them in saturated copper sulphate solution, followed by compression testing. They investigated the influence of slenderness, width-to-thickness ratio, and degree of corrosion on the compressive behaviour of steel angles. Zhang et al. (2014) investigated the influence of acid rain corrosion models on the seismic behaviour of Q355 equal-leg steel angle through quasi-static tests and established corresponding degradation models. Gao et al. (2020) quantitatively analysed the effects of four common types of corrosion, including uniform corrosion, pitting corrosion, localized corrosion, and corrosion at the edge, on the performance of steel angles by numerical modelling. Additionally, researchers have developed calculation methods to predict the load capacity of steel angles. Ye et al. (2016) established a conversion relationship between artificial accelerated corrosion tests and the corrosion status of Q235 steel components under marine atmospheric conditions. They also proposed a practical calculation method to analyse the mechanical behaviour degradation of pitted steel components. Oszvald et al. (2016) simulated corrosion by reducing the thickness of steel angles using mechanical cutting. They conducted compression tests and numerical simulations on corroded equal-leg steel angles and developed a simplified design method to predict the residual compressive resistance of corroded components. Wang (2021) studied the influence of pit thickness, corrosion range, corrosion location, and slenderness of components on the mechanical properties of Q420 locally corroded steel angles through numerical simulations. Based on the research results, they proposed calculation formulae to evaluate the ultimate tensile and compressive load-bearing capacities. In summary, most studies have focused on the influence of corrosion on the mechanical properties of steel or a single component in specific environments. However, there is a lack of sufficient experimental data regarding the residual compression resistance of steel angles with bolted connections on one leg after corrosion.
This study aims to provide experimental and numerical data on the compression load capacity of equal-leg steel angles with bolted connections after simulated corrosion. The corrosion of steel angles was simulated using mechanical cutting methods and the diameter of bolt holes and slenderness was varied in the experimental tests and numerical study. The influences of slenderness and bolt hole diameter on its buckling behaviour of steel angles were quantified in the experimental and numerical results.
2 Experimental programme for steel angles in compression
2.1 Specimen design
Q355 steel angles with equal legs were selected for compression tests. Figure 1 displays an image of steel angles. The steel angles had a cross-sectional dimension of 75 mm × 6 mm, with total lengths of 1,092 mm and 1,986 mm respectively. Based on the distance between the top and bottom hinged supports (measured as 2,086 mm for long angle steel and 1,192 mm for short angle steel), the slendernesses of steel angles with regard to its minor axis were calculated to be 80 and 140, respectively. Figure 2 shows the detailed dimension of specimens. A steel plate was connected to one leg of each angle using three bolts at each end, representing a typical form of connection in transmission towers. To simulate corrosion, mechanical cutting can be adopted to reduce the thickness of steel plates (Oszvald et al., 2016). Site investigations before testing showed that the connection of steel angles might be subjected to severe corrosion. To simulate the corrosion, the diameter of bolt holes was enlarged by mechanical cutting, but the thickness of steel angles remained unchanged. It should be pointed out that mechanical cutting would not affect the compression behaviour of steel angles, as the compression capacity of steel angles is only sensitive to changes in the cross-sectional area of steel angles rather than the different levels of stress concentration. However, the residual stress distribution may be affected due to the heat generated in the cutting process. In this study, a total of 6 sets of steel angles were tested in compression, with three steel angles with the same parameter in each set. Table 1 lists the specific parameter of steel angles. In the table, the symbols are defined as follows: L and S represent the long and short steel angles, respectively; H indicates the defect at the bolt hole. For example, L-H23.5 indicates that the bolt hole diameter of the long angle steel is 23.5 mm. The steel angles used in the compression tests could be categorized into two groups. The first group consisted of 2 sets of control specimens without damage (Huang et al., 2024). The second group included 4 sets of specimens with enlarged bolt holes, namely, the diameter of the bolt hole was increased from 21.5 mm to 23.5 and 27.5 mm, respectively. The cross-section and slenderness of steel angles were selected based on the widely used dimension of steel angles in transmission towers in China. Note that the diameter of bolt holes was affected by the service life and environmental conditions of transmission towers.
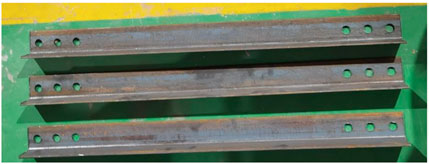
Figure 1. Steel angles used in the experimental tests.
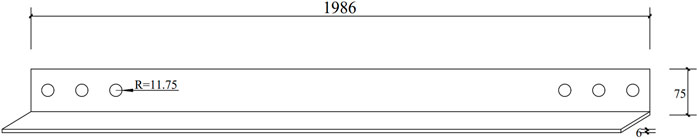
Figure 2. Dimensions of steel angles and bolt holes (unit in mm).
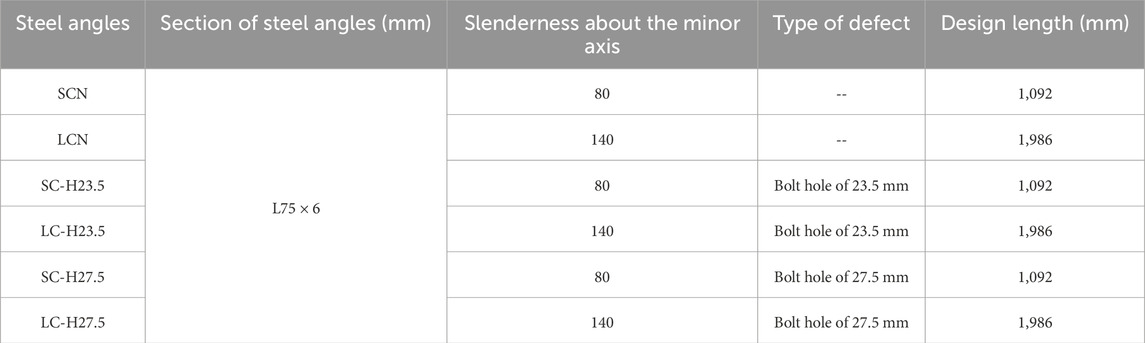
Table 1. Summary of geometric dimensions of steel angles.
2.2 Mechanical properties of steel angles
According to GB/T 228.1-2010 (Management Committee for National Standards, 2010), three samples were cut from the steel angle and tested in tension. The sample thickness was 6 mm, the same as the steel angle, and the gauge length was 96 mm. Figure 3 shows the stress-strain curve obtained from the tension test (Huang et al., 2024). It is evident that the curves for all three samples were close to one another, each consisting of an elastic stage, a yield plateau and a hardening stage. Experimental data showed that the elastic modulus of the steel angle was 201,172 MPa, the yield strength was 380.3 MPa, and the ultimate strength was 555.9 MPa.
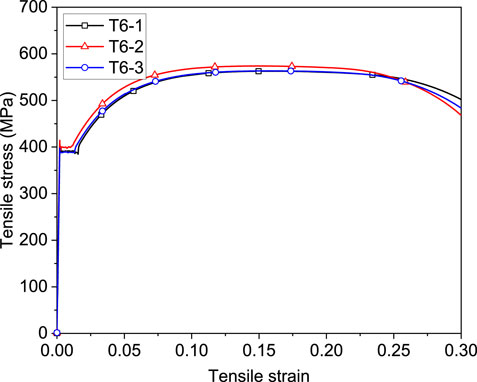
Figure 3. Tensile test results of steel angles.
2.3 Testing method
A compression machine was used to load the steel angle in compression, as illustrated in Figure 4. In the test setup, each end of the loaded leg was connected to a hinge using three Grade R8.8 high-strength steel bolts. In practice, the steel angle is subjected to an eccentric compressive load. Thus, a unidirectional knife-edge support was used for the hinge to ensure that the steel angle would bend about its weak axis in compression. A 50-tonne load cell was installed between the end plate and the support. In the testing process, the top of the testing machine remained fixed, while the bottom support moved upwards to apply the vertical load.

Figure 4. Test setup for steel angles in compression.
During loading, the compressive load was measured using the load cell. Two linear variable differential transducers (LVDTs) were installed at the bottom of the testing device to measure the vertical displacement of the steel angle. Additionally, two more LVDTs were erected in the middle of specimens to measure its lateral deformation perpendicular to the two legs. To further analyse the strain development across different sections of the steel angle under vertical loads, strain gauges with a gauge length of 5 mm were attached on the face at the mid-height and ends of the steel angle. These strain gauges could measure the variation of strain when buckling occurred during testing.
According to the DL/T 5486-2020 (Management Committee for National Standards, 2020b), a vertical load was applied at a loading rate of 2 kN/s up to 80% of the calculated theoretical ultimate load. When the applied load exceeded 80% of the theoretical ultimate load, the loading rate was adjusted to 1 kN/s. The loading was stopped when the load decreased to 70% of the peak value after the failure of specimens.
3 Discussions on test results
3.1 Load-deflection relationship of steel angles
Figure 5 plots the typical load-in-plane deflection curve for steel angle without local defects (Huang et al., 2024). The measured deflection represents that of steel angles about the minor axis. It can be observed from Figure 5A that when the load was less than 120 kN, the curves of SCN-2 and SCN-3 were almost the same, without any lateral deflections measured. However, the curve of SCN-1 differed from the other two. As the load increased to 120 kN, the deflection of SCN-1 continued to increase linearly with the applied load. The differences in the curves during the initial loading phase might originate from different initial geometric imperfections of the steel angles in the same group. SCN-2 and SCN-3 had smaller geometric imperfections, resulting in a slower increase in the in-plane deflection upon loading. In contrast, SCN-1 had larger initial geometric imperfections, leading to the rapidly increasing deflection during the initial loading phase. As the load approached the peak value, the load-deflection curve became flatter, with the rapid increasing in the deflection. It should be noted that SCN-1 developed the same load capacity with SCN-2 and SCN-3. As the length of steel angles increased, the associated compression capacity reduced significantly, but the overall trend of the load-deflection curves remained consistent, as shown in Figure 5B.
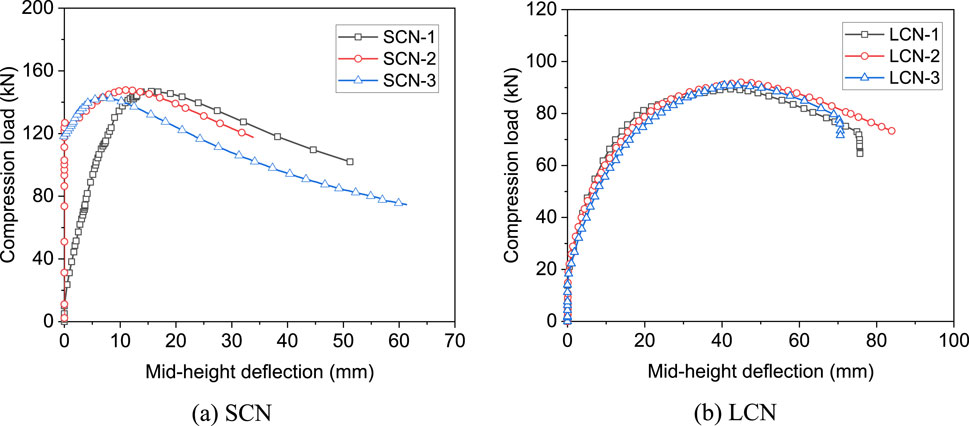
Figure 5. Variation of load with mid-height deflection of intact steel angles (Huang et al., 2024).
Figure 6 shows the curves of steel angles with enlarged bolt holes. The curves in general were similar to those without local defects. The compression capacity decreased with increasing bolt holes. However, the reduction of the compression capacity was insignificant when the diameter of the bolt hole was increased from 21.5 mm to 27.5 mm. It can also be observed from the figure that the deflection associated with the compression capacity decreased with the increasing diameter of the bolt hole.
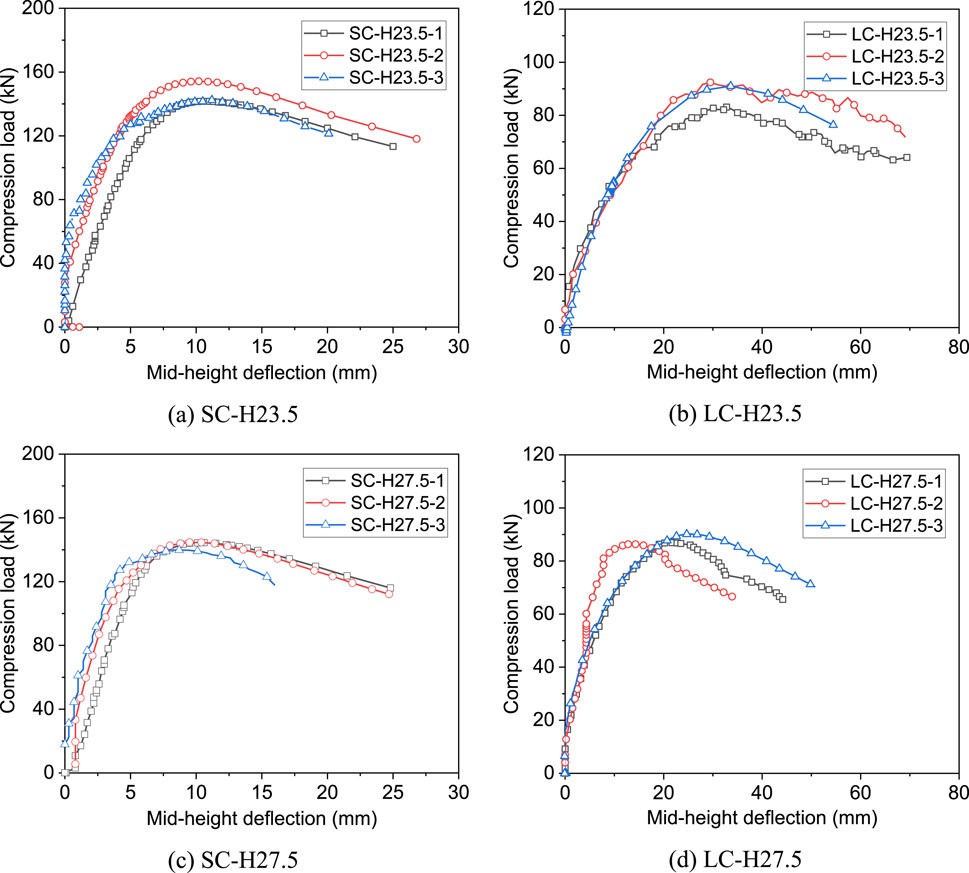
Figure 6. Variation of load with deflection of steel angles with enlarged bolt holes.
3.2 Failure modes of steel angles
Figure 7 illustrates the typical failure modes of steel angles under compression. In the initial phase of loading, the steel angle underwent deflection about its weak axis, which rapidly increased after the attainment of the peak load and was accompanied by torsion. As a result of the similarity in the failure mode of specimens, only those of SC-H27.5 and LC-H27.5 are displayed in the figure. The final modes of failure of specimens were global buckling, displaying a clear sinusoidal half-wave form along the longitudinal axis. Besides, noticeable torsional deformations were observed for both long and short steel angles. Therefore, the actual failure mode observed in the tests was combined flexural and torsional buckling.
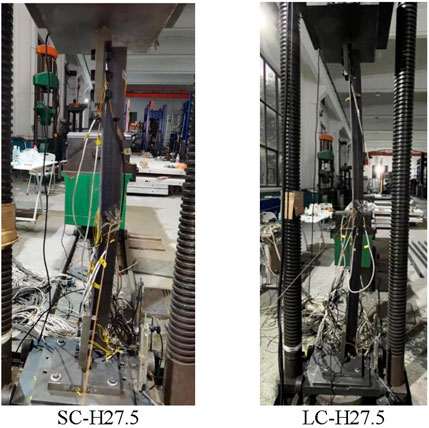
Figure 7. Typical modes of failure of specimens in compression.
3.3 Load-strain curves
Figures 8, 9 present the typical load-strain curves of steel angles in compression. To clearly show the variation of strains at the end and middle of steel angles, curves from two specimens SC-H27.5 and LC-H27.5 were analysed in the study. Figure 8A shows the load-strain curve of the steel angle SC-H27.5. The strains at positions T-3, T-4, and T-5 near the loading leg developed compressive values, while positions T-1 and T-2 on the unloaded leg showed tensile strains. Notably, the strain at position T-4 exceeded that at positions T-3 and T-5 with increasing compression, and the strain at position T-3 started decreasing, suggesting that the specimen might have experienced twisting at the end. At the attainment of the load capacity, the strains at positions T-3 and T-4 were significantly greater than the yield strain measured in the coupon test. Figure 8B plots the load-strain curve at the mid-height of SC-H27.5. It is visible that strains at M-3 and M-4 remained compressive during the whole loading phase and gradually increased. Particularly, at positions M-5 and M-6, the strain varied from compressive to tensile after the steel angle reached its ultimate load. Meanwhile, positions M-1 and M-2 at the unloaded leg consistently generated tensile strains, with M-1 almost the same as M-2. This observation suggested that noticeable twisting also occurred at the end of the steel angle during compression. The peak strains exceeded the yield stress measured in the coupon test, indicating that inelastic buckling occurred for specimens.
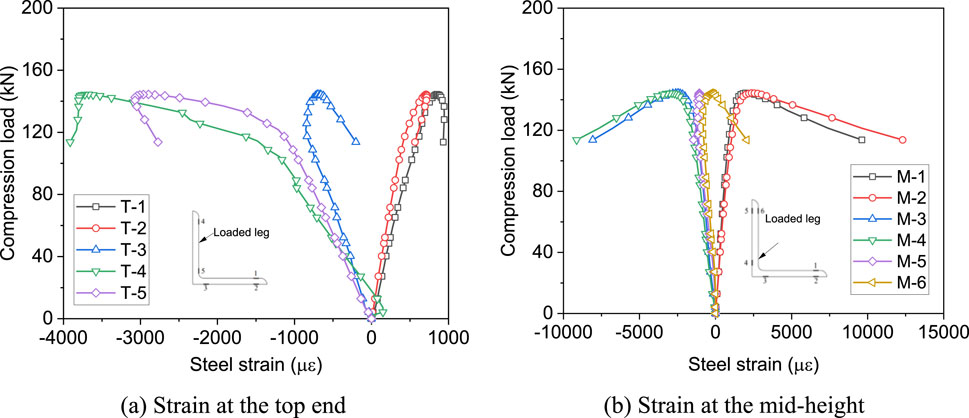
Figure 8. Variation of steel strain with compression for angle SC-H27.5.

Figure 9. Variation of steel strain with compression for angle LC-H27.5.
Figure 9A provides a detailed view of the load-strain curves at the top end of steel angle LC-H27.5 with defect at the bolt hole. Similar to the undamaged specimen LC-H23.5, positions T-1 and T-2 on LC-H27.5 consistently exhibited tensile strains throughout the compression process, while positions T-3 to T-5 developed compressive strains. However, compared to LC-H23.5, the compressive strains of LC-H27.5 at T-3 and T-5 showed a clear decreasing trend after the specimen reached the compression capacity, and the peak value of compressive strains at these points were also significantly lower than those at T-4. This phenomenon indicated that twisting occurred at the upper end of the steel angle. Figure 9B displays the strain development in the middle of LC-H27.5. There were no significant differences between the strains at positions M-1 and M-2 in the middle of LC-H27.5, suggesting that no significant torsional deformations occurred in the middle. This observation indicated that even though LC-H27.5 showed twisting at the top end, it did not significantly affect the strain measured in the middle.
3.4 Discussions on test results
Figure 10 shows the influence of bolt hole diameters on the compression capacity of steel angles under compression. Experimental results indicated that, despite an increase in the bolt hole diameter, the change in the load capacity was minimal, typically within 3%, for specimens with the same slenderness. However, the increase in the bolt hole diameter might change the strain variation in the middle. When the diameter of the bolt hole increased, the strain measured in the middle did not indicate significant torsional deformations, as the steel section at the end was significantly reduced which eventually led to localised torsional deformation at the end.
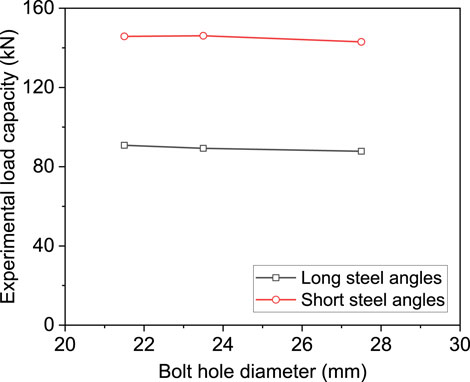
Figure 10. Effect of bolt hole diameters on compression capacity of long and short steel angles.
4 Finite element simulations of steel angles in compression
4.1 Development of finite element models
To study the influence of defect at the bolt hole on the compressive behaviour of steel angles, numerical models were developed using finite element software ABAQUS. In the model, bolts, steel angle, connection plates, and end plates were all modelled using C3D8R (eight-node linear hexahedral, reduced integration elements) solid elements, as shown in Figure 11. To optimize computational efficiency while ensuring the accuracy of the numerical model, a mesh sensitivity analysis was conducted to investigate the influence of mesh size on the compressive behaviour of steel angles. Preliminary results showed that when the mesh sizes in longitudinal, width and thickness directions were determined to be 10, 5 and 2 mm, respectively, the influence of mesh size on the ultimate load could be neglected. Therefore, the mesh size was set to 10 mm × 5 mm×2 mm. Additionally, global and local seeds were appropriately placed within the model to optimize the distribution of the mesh.
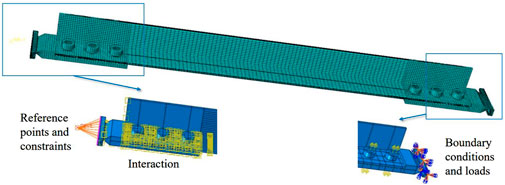
Figure 11. Numerical models for steel angles in compression.
In this study, a point-to-surface restraint was defined to couple the loading end plate with the reference point RP1. Considering the experimental conditions of the steel angle and the use of a hinge connection at the edge of the connection plate, the boundary conditions for reference point RP-1 were set to U1 = U2 = U3 = 0 and UR2 = UR3 = 0. As the bottom end plate was fixed, its restraints were set to U1 = U2 = U3 = UR1 = UR2 = UR3 = 0. Moreover, seven types of surface-to-surface contact interactions were defined between the steel angle, connection plates, bolts, and end plates in the model. A bolt preload was applied by defining the bolt load; then, the bolt load was adjusted to keep the present length constant, and the boundary conditions for reference point RP1 were reset. A Load was applied along the longitudinal axis through a displacement-control method.
4.2 Mechanical properties of steel
In this numerical model, the material properties of the steel, such as elastic modulus, yield strength, and ultimate strength, were determined based on the results of tensile tests on steel coupons. A Poisson’s ratio of 0.3 was used, and the mechanical properties were averaged across three test specimens. The stress-strain curve obtained from the experiments showed a distinct yield plateau, and thus the model employed an elastic-plastic model that incorporates the yield plateau and hardening stage, as depicted in the Figure 12 (Huang et al., 2024). The model also assumed that the materials of the connection plates, end plates, and bolts remain elastic. Their elastic properties were consistent with those of the steel angle.
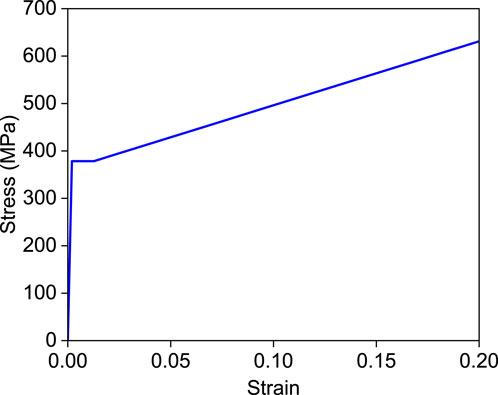
Figure 12. Stress-strain model for steel angles in the finite element model.
The residual stress in the steel angle was not measured before testing, but the simplified distribution proposed by Wang (Wang, 1981a; Wang, 1981b) was defined in the finite element model. Note that even though the residual stress may be affected by mechanical cutting, it was not considered in the numerical model due to the lack of test data. Residual stresses were applied longitudinally to the steel angle model through a prestress field. Based on the recommendation of GB50017-2017 (Management Committee for National Standards, 2020a), the initial bending of the steel angle in the model was set at 1/1,000 of its length to simulate the geometric imperfection.
4.3 Validation of finite element models
In this study, finite element analyses were conducted for all specimens in compression, and typical specimens, including SC-23.5, LC-23.5, SC-H27.5 and LC-27.5, were selected to analyse and compare the load-deflection curves obtained from experiments and numerical simulations. In general, the trends obtained in the numerical simulations closely match the curves obtained from the experimental tests, as shown in Figure 13. During the initial loading phase, the numerical simulation shows a rapid increase in the deflection of the steel angle. When the steel angle is close to buckling, the experimental and simulation curves match well. The difference between the experimental and numerical curves may be due to that the initial bending of the steel angle in the experiments was not 1/1,000 of the angle length as assumed in the model.
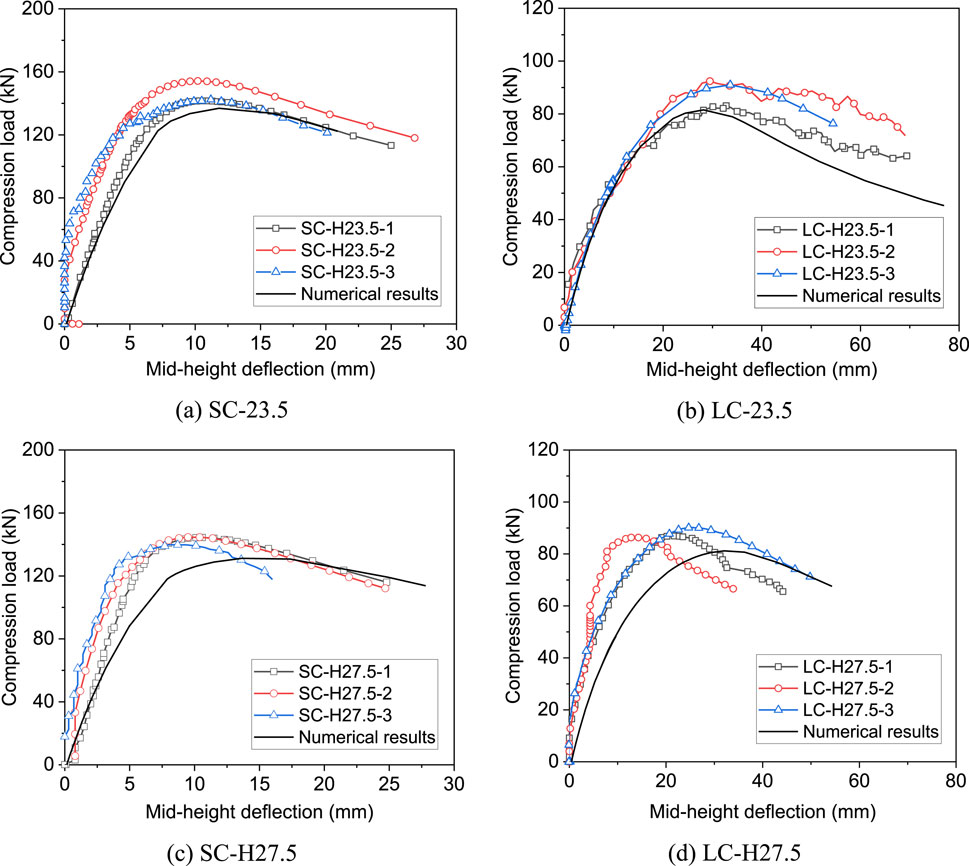
Figure 13. Comparisons of numerical load-deflection curves with experimental results.
In addition to the load-deflection curve, the peak loads obtained from numerical simulations and experimental tests were also compared, as shown in the Table 2. The average numerical to experimental load ratio is 0.92, with a coefficient of variation of 3.6%, indicating that the numerical model can accurately calculate the ultimate load of the specimens. For instance, the experimental value of SCN was 145.8 kN, while the simulated value is 140.9 kN, 3.4% less than the experimental value. This shows that the numerical value is generally lower than the experimental value. The underestimation of the load capacity might result from the neglecting of the friction between the hinge and the end plate and the assumed residual stress and initial bending in the numerical model.
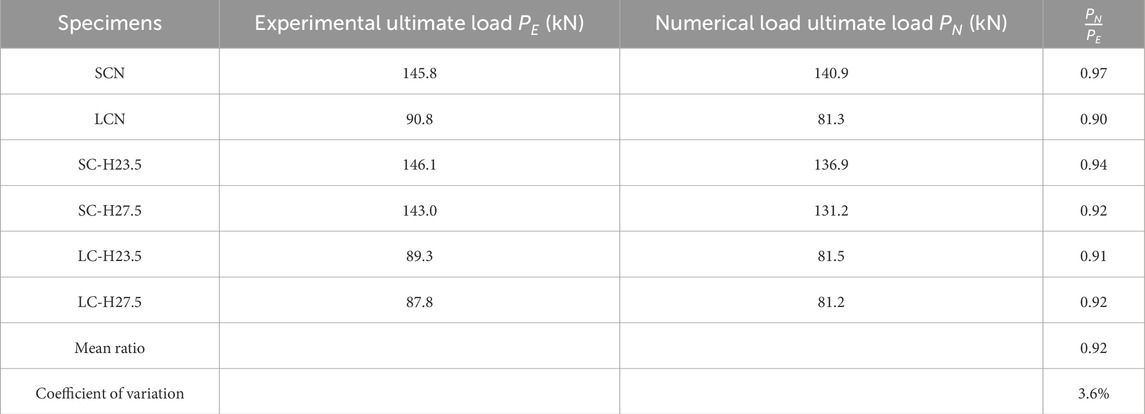
Table 2. Comparison of numerical ultimate loads with experimental values.
Figure 14 shows the deflection and stress distribution in the numerical simulation when the steel angle reaches yielding and compare with the failure modes observed in the experimental tests. It can be observed that the simulation and experimental results exhibit good agreement in terms of the failure mode, displaying combined bending and torsional buckling. The maximum stress in SC-H27.5 is primarily concentrated at the middle of the unloaded leg, with a value of 459.8 MPa. However, when the slenderness is increased to 140, the maximum stress occurs at the end of the steel angle, with a value of 537.5 MPa. The increase in the stress at the end is mainly induced by the increased diameter of bolt holes and the associated reduced net section area of the steel angle.

Figure 14. Comparisons of numerical and experimental failure modes of specimens.
5 Parametric study
In accordance with the verified finite element model, a parametric study was performed to study the effects of slenderness on the compression capacity of specimens with different diameters of bolt holes, as shown in Figure 15. In the parametric study, three different bolt hole diameters, namely, 21.5, 23.5 and 27.5 mm, are determined based on the experimental result. Steel angles with various slendernesses, namely, 80, 100, 120, and 140, are selected to investigate the combined effect of bolt hole diameter and slenderness. It can be observed that the ultimate load of steel angles with the same diameter of bolt holes decreases with the increasing slenderness. For example, when the bolt hole diameter is 23.5 mm, the load capacity of the steel angle with a slenderness of 80 is 136.9 kN, but the value decreases by 40.5%–81.5 kN when the slenderness increases to 140. The figure also shows the influences of the diameter of bolt holes on the compression capacity of specimens. It is apparent the diameter of bolt holes on the compression capacity is significant if the bolt hole diameter is 27.5 mm and the slenderness of specimens does not exceed 100. Otherwise, the reduction in the ultimate load induced by the bolt hole is less than 4% as compared with the undamaged steel angle. Thus, numerical results imply that under certain conditions, the influence of the bolt hole diameter on the load capacity of steel angles can be neglected, even though the presence of the bolt hole can reduce the restraint stiffness provided by the end plate and lead to localised twisting at the end.
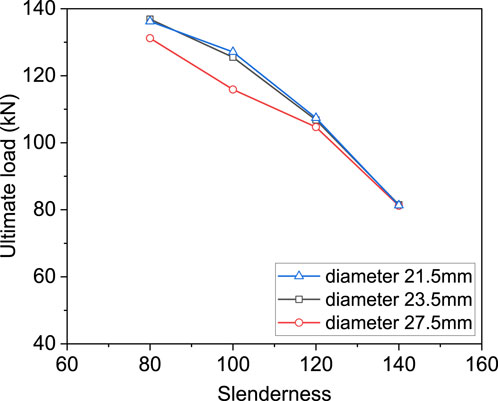
Figure 15. Influence of bolt hole diameters and slenderness on the compression capacity of specimens.
6 Conclusion
This paper presents experimental and finite element studies on the global buckling behaviour of steel angles with defect at the bolt hole and subjected to compression. The compression capacity and global buckling failure of steel angles were examined through compression tests and numerical modelling. The influences of the slenderness and bolt hole diameter on the buckling load of specimens were also analysed in the parametric study. The following conclusions can be found as follows.
(1) When the diameter of the bolt hole was increased from 21.5 to 27.5 mm, the compression capacity of specimens with a slenderness of 80 was slightly reduced by 3.0%, whereas that with a slenderness of 120 remained almost unchanged. The effects of the diameter of bolt holes were insignificant for steel angles with a slenderness greater than 120 and can be neglected in design.
(2) Steel angles developed combined bending and twisting failure when they were loaded in compression on one leg. The presence of bolt holes led to localised twisting of steel angles near the end, but the twisting effect in the middle became insignificant.
(3) Parametric analysis through the numerical model indicates that as the slenderness ratio increases, the load-bearing capacity of steel angles with different diameters of bolt holes decreases, but the effect is only significant when the diameter of bolt holes is 27.5 mm and the slenderness is not greater than 100. Thus, when the slenderness of steel angles is less than 100, the effect of enlarged bolt holes on the compression capacity of steel angles should be reduced in design.
It should also be pointed out that the present study only focuses on the effect of corrosion at the bolt hole. In fact, corrosion may occur at the bolt hole and the connection at the same time. In that case, the conclusion of the present study is not applicable, and further experimental tests or numerical simulations are necessary to evaluate the influence of corrosion at the connection.
Data availability statement
The raw data supporting the conclusions of this article will be made available by the authors, without undue reservation.
Author contributions
JZ: Formal Analysis, Investigation, Writing–original draft. AH: Methodology, Writing–review and editing. YL: Funding acquisition, Supervision, Writing–review and editing. S-BK: Supervision, Writing–review and editing.
Funding
The author(s) declare that no financial support was received for the research, authorship, and/or publication of this article.
Conflict of interest
The authors declare that the research was conducted in the absence of any commercial or financial relationships that could be construed as a potential conflict of interest.
Publisher’s note
All claims expressed in this article are solely those of the authors and do not necessarily represent those of their affiliated organizations, or those of the publisher, the editors and the reviewers. Any product that may be evaluated in this article, or claim that may be made by its manufacturer, is not guaranteed or endorsed by the publisher.
References
Adluri, S. M. R., and Madugula, M. K. S. (1996). Flexural buckling of steel angles: experimental investigation. J. Struct. Eng. 122 (3), 309–317. doi:10.1061/(asce)0733-9445(1996)122:3(309)
Bathon, L., Mueller, W. H., and Kempner, L. (1993). Ultimate load capacity of single steel angles. J. Struct. Eng. 119 (1), 279–300. doi:10.1061/(asce)0733-9445(1993)119:1(279)
Beaulieu, L. V., Legeron, F., and Langlois, S. (2010). Compression strength of corroded steel angle members. J. Constr. Steel Res. 66 (11), 1366–1373. doi:10.1016/j.jcsr.2010.05.006
Cao, S. S., Zhang, D. C., and Gao, Z. P. (2017). Experiemental and analytical research on axial bearing capacity of single steel angles. J. NANJING TECH Univ. Nat. Sci. Ed. 39 (03), 108–113.
Chen, S. F. (2012). Elastic and inelastic stability capacity of single angle under axial compression. J. Build. Struct. 33 (10), 134–141.
Gao, C., Liu, J., Zheng, Y., Wu, B., and Chu, Z. (2020). Effect of corrosion on mechanical properties of transmission tower angle steel. Corros. and Prot. 41 (8), 32–38.
Huang, X., He, S.-Y., Liu, X.-Y., Han, D.-G., Pu, F., Yan, H.-Q., et al. (2024). Compression behaviour of Q355 steel equal-leg angles with simulated local defects at the mid-height. J. Constr. Steel Res. 217, 108673. doi:10.1016/j.jcsr.2024.108673
Huang, Y., Su, Z. G., Zhu, B. R., Chen, Y. X., Wan, T., and Tuo, Z. X. (2023). The influence of corrosion on the bearing capacity characteristics of overhead transmission line tower. Nonferrous Metals Sci. Eng., 1–11.
Liu, H. Y., Li, Z. L., and Huang, Z. L. (2021). A study on the bearing capacity of angle steel members in transmission towers. Prog. Steel Build. Struct. 23 (12), 47–55.
Management Committee for National Standards, Metallic materials-Tensile testing Part 1: method of test at room temperature,GB/T 228.1-2010, Beijing, 2010.
Management Committee for National Standards, Standard for design of steel structures, GB50017-2017, Beijing, 2020a.
Management Committee for National Standards (2020b). Technical specification for the design of steel supporting structures of overhead transmission line. Beijing. DL/T5486-2020.
Oszvald, K., Tomka, P., and Dunai, L. (2016). The remaining load-bearing capacity of corroded steel angle compression members. J. Constr. Steel Res. 120, 188–198. doi:10.1016/j.jcsr.2016.01.003
Shi, G., Liu, Z., Zhang, Y., Shi, Y. J., and Wang, Y. Q. (2011). Study on the local buckling behavior of steel equal angle members under axial compression with the steel strength variation. Adv. Mater. Res. 374-377, 2430–2436. doi:10.4028/www.scientific.net/amr.374-377.2430
Wakabayashi, M., and Nonaka, T. J. B. o.t.D. P. R. I. (1965) On the buckling strength of angles in transmission towers, 15, 1–18.
Wang, G. Z. (1981a). The influence of residual stress on the bearing capacity of steel tie rods: overview and theoretical analysis(1). Metall. Constr. 8, 15–19.
Wang, G. Z. (1981b). The influence of residual stress on the bearing capacity of steel tie rods: overview and theoretical analysis(2). Metall. Constr. 9, 31–36.
Wang, X. (2021). Study on the bearing performance of Q420 equal angle steel subjected to local corrosion. Wuhan, Hubei: Wuhan University.
Ye, J. H., Shen, H. Q., and Xue, S. D. (2016). Simplified analytical method of mechanical property degradation for steel members with pitting corrosion. J. Harbin Inst. Technol. 48 (12), 70–75.
Keywords: Q355 steel angles, bolted connections, buckling failure, load capacity, numerical simulations
Citation: Zhang J, He A, Liu Y and Kang S-B (2024) Compression behaviour of Q355 steel angles with local defect at bolt holes. Front. Mater. 11:1467087. doi: 10.3389/fmats.2024.1467087
Received: 19 July 2024; Accepted: 28 August 2024;
Published: 05 September 2024.
Edited by:
Abdelmoumen Anis BOUSAHLA, University of Sidi-Bel-Abbès, AlgeriaReviewed by:
Shan Gao, Harbin Institute of Technology, ChinaJiadi Liu, Tianjin University, China
CHENG CHEN, Southwest Petroleum University, China
Copyright © 2024 Zhang, He, Liu and Kang. This is an open-access article distributed under the terms of the Creative Commons Attribution License (CC BY). The use, distribution or reproduction in other forums is permitted, provided the original author(s) and the copyright owner(s) are credited and that the original publication in this journal is cited, in accordance with accepted academic practice. No use, distribution or reproduction is permitted which does not comply with these terms.
*Correspondence: Yu Liu, bGl1eXVAc3dqdHUuZWR1LmNu