 Ye-yang Chun
 Zhengquan Liu4,5
 Yong He
94% of researchers rate our articles as excellent or good
Learn more about the work of our research integrity team to safeguard the quality of each article we publish.
Find out more
ORIGINAL RESEARCH article
Front. Mater. , 24 July 2024
Sec. Structural Materials
Volume 11 - 2024 | https://doi.org/10.3389/fmats.2024.1447496
This article is part of the Research Topic Physico-Mechanical Properties and Treatment Technology of Hazardous Geomaterials-Volume III View all 7 articles
To elucidate the time-dependent swelling behavior of landfill sand-bentonite mixture liners under the effect of organic pollutants, an no loading swelling ratio test was conducted on mixtures with varying sand and diesel content. The evolution characteristics of the swelling time curve morphology were investigated. The micro-mechanisms underlying the swelling time effect evolution were explored. The results indicated that the sand-diesel interaction significantly altered the swelling time curve morphological characteristics of the mixture. As the sand content increased, the swelling coefficient at the stable state decreased. However, during the rapid swell phase, diesel-contaminated mixed soil does not exhibit the increase-then-decrease pattern in swell coefficient seen in unpolluted mixed soil. The duration of both the slow swelling phase and the time to reach a stable state were longer. Mechanistic analysis revealed that cation exchange capacity is insufficient to effectively analyze the evolution characteristics of the swelling time curve. Instead, the initial swelling potential of bentonite is the true indicator of the mixture’s swelling properties. The particle size distribution influences the changes in the swelling coefficient during the rapid swelling phase, but diesel alters the particle size distribution, mitigating its impact. The oil sealing effect within intra-aggregate and inter-aggregate pores not only weakened the swelling characteristics of the mixture at all stages but also increased the permeability resistance, thereby reducing the duration of the rapid swelling phase and extending the slow swelling and stable swelling phases.
Pollution isolation is a technique for controlling the spread of contaminants from landfill sites through groundwater and soil into the surrounding environment (Sun M. et al., 2020; Shaqour, 2024). This technique has been widely applied in the treatment and remediation of site contaminants. The pollution isolation technology primarily consists of the vertical barrier wall and compacted liner (Lemos et al., 2023; Shaqour, 2024). The compacted liner, located at the landfill base, plays a crucial role in the effectiveness of pollution isolation due to its blocking performance and stability (Beck-Broichsitter et al., 2018; Park, 2021). Currently, numerous types of materials with excellent performance characteristics are used for compacted liners, such as bentonite series (Hedayati-Azar and Sadeghi, 2022; Zhan et al., 2023), cement concrete series (Zhang et al., 2023), and steel sheet pile series. Among them, the bentonite series is the most widely used due to its strong water absorption and expansion properties. These properties can enhance the liner density to achieve the low permeability requirements for pollution isolation (k ≤ 10−9 m/s). Additionally, it is easy to construct and cost-effective. Sand-bentonite mixed soil is the most frequently used liner filling material (Mahallei and Badv, 2021). However, the expansion properties of sand-bentonite mixed soil are highly susceptible to environmental changes and can lead to uneven settlement of the liner, threatening the pollution isolation capability of the compacted liner (Tang et al., 2019; Xiang and Ye, 2020). Therefore, understanding the swelling characteristics of bentonite series liner filling materials is of practical significance.
Previous research has primarily focused on the effects of heavy metals and other inorganic substances on the swelling characteristics of sand-bentonite mixtures. Scholars generally believe that the infiltration of heavy metals can significantly weaken the swelling properties of sand-bentonite mixtures. They have provided detailed results, such as systematic investigations into the mechanisms underlying swelling evolution characteristics (Ouhadi et al., 2011; Murtaza et al., 2020). However, studies on the effect of organic pollutants on swelling characteristics of soil-bentonite (sand-bentonite) mixtures are scarce. Fu X L (Fu et al., 2023) found that the swelling index of sand-bentonite decreases with increasing acetic acid content, and attributed this to the contraction of diffuse double layer on the surface of montmorillonite caused by acetic acid. Through experiments, Rahman and Sharma (2023) revealed that the swelling index of the sand-bentonite mixture decreases with increasing sand content and methanol/ethanol content. The reduction in the dielectric constant of pore fluid leads to the contraction of the diffuse double layer on the montmorillonite surface, which ultimately weakens the swelling performance of the sand-bentonite mixture. Ishimori et al. (2020) observed that significant changes in swelling characteristics only occurred when the concentrations of 1,4-dioxane and bisphenol A exceeded 10,000 mg/L. These findings indicate that current studies have systematically revealed the mechanisms underlying the swelling evolutions of soil-bentonite mixtures under the influence of organic pollutants and have conducted in-depth studies on the swelling mechanisms. Unfortunately, these studies only focused on the swelling characteristics of mixtures in a stable state, completely neglecting the entire water absorption and swelling process. The water absorption and swelling of soil-bentonite is a prolonged process highly susceptible to environmental changes, which affects the barrier performance of liners. Therefore, it is essential to understand the temporal effect of organic pollutants on the swelling of soil-bentonite mixtures.
Scholars generally believe that shape changes in the swelling time curve of sand-bentonite mixed soil are mainly influenced by the water absorption and swelling characteristics of bentonite and the interlocking type of soil particles (Estabragh et al., 2020; Yuan et al., 2023). The water absorption and swelling characteristics of bentonite are usually related to the contained quantity and properties of the montmorillonite. The higher the quantity and the stronger the hydration capacity of montmorillonite, the greater the swelling characteristics of the mixed soil (Dananaj et al., 2005; Reddy et al., 2021; Su et al., 2022). The composition of soil and bentonite significantly affects the particle composition of the mixed soil (Pandian et al., 1995; Sun et al., 2015). Specifically, the swelling rate is positively correlated with the compactness of particle interlocking. The more compact the interlocking, the faster the swelling rate. However, the final swelling amount is related to the bentonite content. Under the influence of organic pollutants, the water absorption and swelling of montmorillonite change (Rahman and Sharma, 2023), and the arrangement and combination patterns between bentonite particles and those between bentonite and sand also vary. Consequently, the density of the mixed soil differs compared with that of the uncontaminated mixed soil, and the shape of the swelling time curve also changes (Li and Denham, 2000; Li et al., 2019). Moreover, the combined effect of organic pollutants and particle gradation significantly affects the swelling time of the mixed soil. Therefore, it can be concluded that previous theories cannot serve as a robust basis for explaining the swelling time evolution of the organic-polluted sand-bentonite mixed soil.
Therefore, in this paper, taking the mixed soil of sand and bentonite as the research object, with sand content and diesel content as influencing factors, unloaded expansion tests were conducted to study the expansion history effect of the mixed soil cushion material under an organic matter pollution environment. Additionally, tests such as cation exchange capacity (CEC), particle size distribution (PSD), mercury intrusion porosimetry (MIP), scanning electron microscopy (SEM), and gas chromatography were also undertaken to explore the evolution mechanisms of the swelling time-course curve. The research findings provide a basis for the design and performance evaluation of liners in contaminated sites.
The bentonite used in the experiment was sourced from Zhengzhou, Henan. It contains 99.6% montmorillonite, with minor amounts of illite, gypsum, quartz, and albite. The natural moisture content of this bentonite is 10.3%, and it contains 100% fine particles (smaller than 325/45 µm). Its liquid limit (LL) is 186.96%, plastic limit (PL) is 49.78%, and plasticity index (PI) is 137.18%. The specific gravity (Gs) is 2.58. The quartz sand used was sourced from Suzhou, Jiangsu. It is off-white and primarily composed of SiO2, with a particle-specific gravity of 2.65. Before testing, the quartz sand was subjected to acid washing and neutralization treatment.
In the experiment, the test diesel is the No. 0 diesel sold on the market in mainland China. It is light green, has a relative density of 0.856, and a viscosity of 3.95 mPa s at 20°C.
The extremely low permeability (<10−9 cm/s) of landfill liner materials is the key to their barrier performance, therefore, the compactness of the cushion material becomes a key control indicator. Previous studies have shown that when the sand content is between 30% and 40%, the compaction of mixed soil barrier materials is maximized and the permeability coefficient is minimized (Gökalp et al., 2011; Sobti and Singh, 2019). However, due to the inevitable occurrence of uneven mixing of sand and bentonite during preparation, local aggregation of sand within the liner material is very common. Therefore, this study expands the sand content range from 0% to 50% to enhance the practical value of the research results. Additionally, the diesel incorporation range in the experiments is set from 0 to 8.0 wt.%. To highlight the main research focus, a uniform dry density and moisture content of the remolded soil was maintained. Detailed information is provided in Table 1.

Table 1. Design of experimental influencing factors.
The preparation of diesel-contaminated sand-bentonite mixed soil requires two key steps, namely, the preparation of diesel-contaminated mixed loose soil and the preparation of reshaped sand-bentonite mixed soil. Firstly, the preparation of diesel-contaminated mixed loose soil is carried out using a stratification method. The specific operational steps are as follows: first, according to the requirements of the experimental plan, thoroughly mix the dried bentonite and sand in proportion, as shown in Figures 1A,B; then weigh a certain amount of soil and place it in a flat-bottomed iron pan; next, weigh the deionized water and diesel required for the sample and water is sprayed on the mixed soil before oil is sprayed on the mixed soil; repeat the above steps until the desired amount of test soil is reached (Chun et al., 2022; Chun et al., 2023a). After curing the contaminated loose soil in a light-free sealed environment for 7 days, a reshaped soil sample with a certain dry density can be prepared using the static compaction method, with a loading rate of 0.2 mm/s (Li and Zhang, 2009). The prepared reshaped soil sample needs to be further placed in a shaded sealed humidification tank for continued curing for 30 days. During this period, it is necessary to regularly flip the soil column samples to prevent the occurrence of diesel secretion.
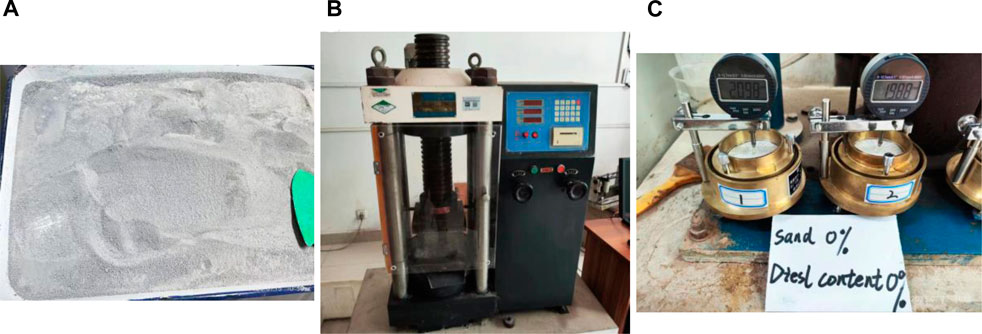
Figure 1. Preparation of diesel-contaminated soil mixtures and no-load swell test setups. (A) sand bentonite mixed sample; (B) sample preparation and loading device; (C) expansion test process.
A No loading swelling ratio test was conducted according to the standard of the People’s Republic of China - Test methods for soil engineering “GB/T 50123-2019” (Fan et al., 2020; Ma et al., 2020), and the experimental device is shown in Figure 1C. The main experimental steps are as follows: Install the specimen, ensuring the permeability of the porous stone before installation, and the tight fit between the specimen and the equipment; Conduct the unloaded test, zero the displacement meter before installation, inject distilled water into the tank, and record the displacement meter readings at time points of 5, 10, 20, 30 min, 1, 3, 6, 12 h … The experiment is considered complete when the displacement meter readings have changed by less than 0.01 mm within 24 h; Measure the height and other parameters of the test sample, and calculate the no-loaded swell coefficient at different time points according to Eq. 1 (Song et al., 2021).
Where δt represents the swell coefficient of the mixed soil at a certain moment, %. Ht represents the swell height of the mixed soil at a certain moment, mm; H0 represents the initial height of the specimen, which is 20 mm.
The adsorption capacity of diesel in mixed soil with different sand contents was determined using gas chromatography-mass spectrometry combined with different method testing calculations (Omagari et al., 2021).
The cation exchange capacity of mixed soil was tested using the Forest Soil Cation Exchange Capacity Method “LY/T 1245-1999” of the People’s Republic of China forestry industry standard (Henríquez et al., 2005). The experimental procedure involves treating the mixed soil with a 1 mol/L ammonium acetate solution at pH 7.0 to saturate it with
Using a laser particle size analyzer, the particle size distribution of mixed soils with different diesel and sand content was tested. The instrument model used was Brookhaven/90Plus, with a measurement accuracy range of 0.3 nm–10 µm. During particle size distribution testing, ultrasonic treatment was not allowed, and the testing time for each condition was kept the same (Fei et al., 2019; Wei et al., 2020).
The MIP Pore Structure Test Method utilizes the AutoPore IV 9500, a fully automatic mercury piezometer manufactured by Mack Instruments, United States. This test instrument has a maximum inlet pressure of 414 MPa and can measure pore sizes ranging from 0.003 to 360 μm with an accuracy of 1/200,000 of the inlet and outlet volume of mercury (Sun H. et al., 2020).
The principle of the MIP test is that a non-infiltrating liquid can only enter a solid pore when pressure is applied and that the pore size invaded by the introduced liquid is a function of the pressure used under constant pressure increase. The pores measured by the MIP test are therefore connected pores within the specimen (Wang et al., 2020). For cylindrical pores, the relationship between pore size and pressure can be calculated according to Washburn’s formula (Washburn, 1921).
Where P is the applied pressure; γ is the surface tension of the introduced liquid, taken as 485.0 mN/m in the test; θ is the contact angle between the introduced liquid and the solid material, taken as 140° in the test; r is the radius of the cylindrical pore.
At the same time, scanning electron microscopy was used to study the microstructure of the remolded soil sample. The testing equipment was Hitachi Scanning Electron Microscope from Japan, model S-3400N.
The MIP and SEM test samples need to undergo liquid nitrogen freezing and vacuum extraction treatment before MIP testing can be conducted. The specific steps are as follows: first, the sample to be tested is cut into a rectangular shape with dimensions of 10 mm × 5 mm × 5 mm, and then the sample is dried using the freeze-drying method. The operation process of the freeze-drying method is as follows: the cut sample is placed in a container filled with liquid nitrogen, allowing the sample to be completely immersed in liquid nitrogen for rapid cooling to −196°C, with a freezing time of 1–2 h. The vacuum freeze dryer is pre-cooled for about 1 h in advance, then the frozen sample is quickly placed into the drying tray of the vacuum freeze dryer, the quick inflation valve is removed, the vacuum pump is turned on, and the sample is continuously vacuum dried at −56°C for 24 h. After drying is complete, the mercury intrusion sample is quickly placed in a sealed bag containing silica gel desiccant and labeled with a tag number for later use (Hashemi et al., 2015).
The impact of sand content and diesel content on the expansive characteristics of mixed soil was analyzed using SPSS 26. Origin 8.0 was utilized for graph plotting and analysis (Jin et al., 2016; Ren et al., 2020).
Figure 2 shows the variations in the swell coefficient of the mixed soil under the influence of diesel and sand over time. As shown, the presence of diesel and sand does not vary the three-phase expansion process of the soil, which includes the rapid swell phase, the slow swell phase, and the stable swell phase. However, it significantly alters the duration of each phase, as illustrated in Figure 3. For the uncontaminated bentonite (0-0), the rapid swell phase occurs within the first 0–54 h, exhibiting a linear variation in the swell coefficient, with a maximum of 36.24%. The slow swell phase spans 54–114 h, where the swell coefficient changes non-linearly and finally reaches a stable value of 38.28%. As the sand content increases in the uncontaminated mixed soil, both the duration and swell coefficient in the rapid and slow swell phases decrease. For instance, with the sand content (0-30) of 30%, the rapid and slow swell phases occur within 0–24 h and 24–66 h, respectively. The maximum swell coefficient is 20.04% and the stable value is 27.31%. Despite this, the swell coefficient still changes linearly versus time during the rapid swell phase across different sand contents, as shown in Figure 3. Moreover, during the rapid swell phase, the swell coefficient of the uncontaminated mixed soil does not exhibit a monotonic decrease with the increasing sand content. The local magnification in Figure 2 a reveals that before the 2-hour, the swell coefficient initially increases and then decreases. For example, at the 1-hour, as the sand content increases from 0% to 40%, the swell coefficient first rises from 3.08% to 4.01% and then decreases to 3.57% at the maximum sand content (50%). This experimental phenomenon aligns with the results from Gökalp et al. (2011), although the time interval and duration differ.
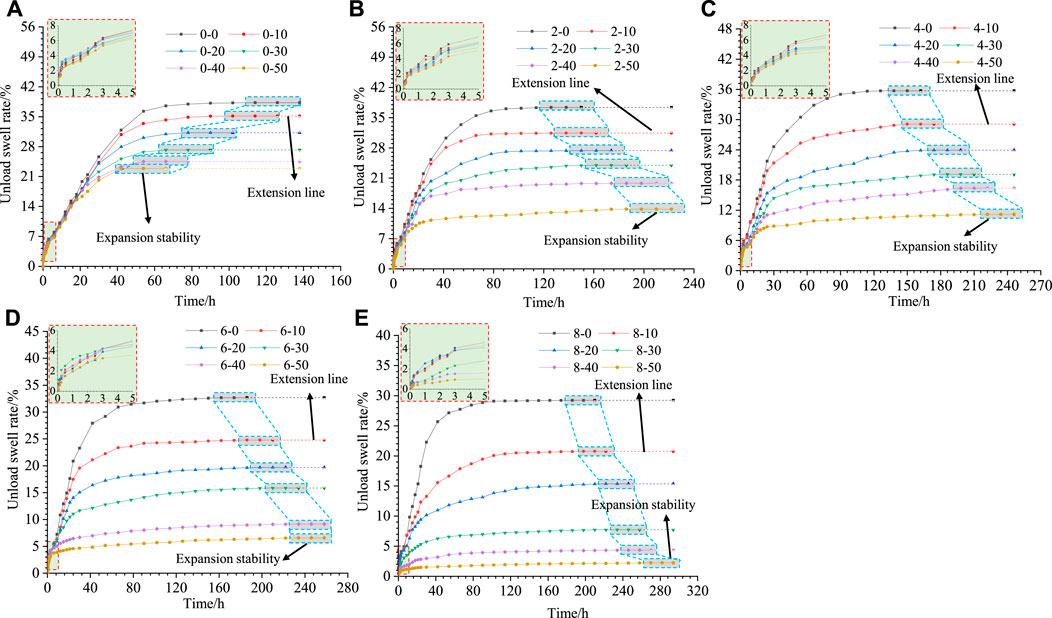
Figure 2. The swelling history curve of bentonite-sand mixed soil with varied diesel and sand content. (A–E) are the diesel content for 0.0wt.%, 2.0wt.%, 4.0wt.%, 6.0wt.% and 8.0wt.%, respectively.
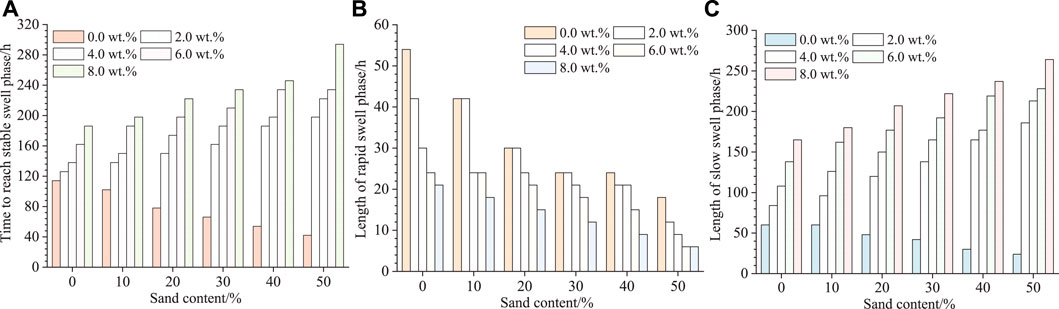
Figure 3. Durations of reaching the stable swell stage and experiencing different swell phase. (A) time to reach expansion steady state; (B) time required for rapid expansion phase; (C) time required for slow expansion phase.
With varying sand content, the swell coefficient of the diesel-contaminated mixed soil decreases with an increase in sand content. However, the time required to reach the stable swell phase and the slow expansion phase increases, while the duration of the rapid expansion phase shortens. When the diesel content remains at 6.0 wt.%, the stable swell coefficient of the diesel-contaminated mixed soil decreases from 32.67% (6-0) to 6.57% (6-50) with an increase in the sand content. The time required to reach the stable expansion phase increases from 162 to 234 h. The duration of the rapid expansion phase decreases from 24 to 6 h, and the maximum swell coefficient in this phase reduces from 20.47% to 3.75%. However, the duration of the slow expansion phase increases from 138 to 228 h. Additionally, during the rapid expansion phase, no increase in swell coefficient was observed with an increase in the sand content.
Simultaneously, the differences in the reduction of swelling coefficient for mixed soils with 0.0 and 6.0 wt.% diesel incorporation under varying sand content analyzed, as shown in Figure 4. It can be observed that the change in permeability coefficient differs between the two soil types as the sand content increases. Generally, the variation in the permeability coefficient of the diesel-contaminated mixed soil is greater than that of the uncontaminated mixed soil, with differences of 4.76%, 1.19%, −0.22%, 4.03%, and 0.93%, respectively. This indicates that diesel increases the weakening effect of sand on the swelling characteristics of the mixed soil.
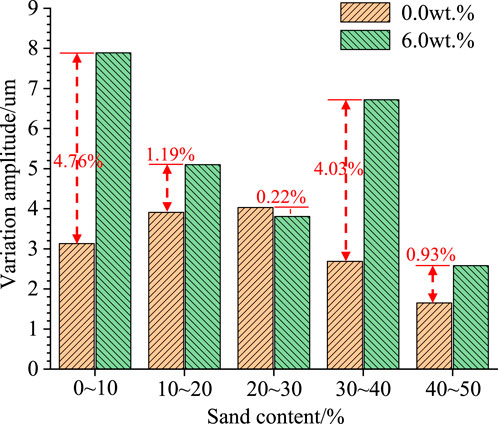
Figure 4. Variation amplitude of swell coefficient in different sand content ranges of mixed soil with diesel content of 0.0 and 6.0 wt.%.
With constant sand content, the variation in the swell-time curve of the contaminated mixed soil under the influence of diesel incorporation is consistent with that observed under the influence of sand content. For instance, when the sand content is 40%, increasing the diesel incorporation from 0.0 to 8.0 wt.% results in a decrease in the stabilized swell coefficient of the mixed soil from 24.52% (0-40) to 4.35% (8-40), while the duration extends from 54 to 246 h. The interval of the rapid expansion phase shortens from 0–24 to 0–9 h, and the maximum swell coefficient within this phase decreases from 19.15% to 2.36%. Meanwhile, the slow expansion phase interval extends from 24–54 h to 9–246 h. Additionally, during the rapid expansion phase, no increase occurs in the swell coefficient as the sand content increases. Therefore, the influence mechanism of diesel and sand on the swell-time curve of the contaminated mixed soil is identical. It is also found that sand and diesel not only independently affect the expansion characteristics of the mixed soil, but there is also a coupling effect between sand and diesel that jointly influences the swell-time effect of the mixed soil.
Referring to the research of Wang Y. et al. (2021) and Zeng et al. (2019), the correlation analysis between the stable expansion coefficient of polluted mixed soil and sand content was found (results shown in Figure 5) reveals that the variation in the swell coefficient with increasing sand content can be divided into two phases. For the uncontaminated mixed soil, these two phases are distributed within the 0%–40% and 40%–50% intervals. In the first stage, a strong linear negative correlation occurs between the sand content and the swell coefficient (R2 = 0.9960). In the second phase, the decreasing rate in the swell coefficient slows down. When the diesel content is 2.0 wt.%, the phases of variation in the swell coefficient of the contaminated mixed soil are also distributed within the 0%–40% and 40%–50% intervals. However, within the 40%–50% interval, the decreasing rate in the swell coefficient for the diesel-contaminated mixed soil accelerates. When the diesel content is 4.0, 6.0, and 8.0 wt.%, the distribution of the variation phases changes, with the second phase extending to the 30%–50% interval, and the decreasing rate in the swell coefficient significantly accelerates.
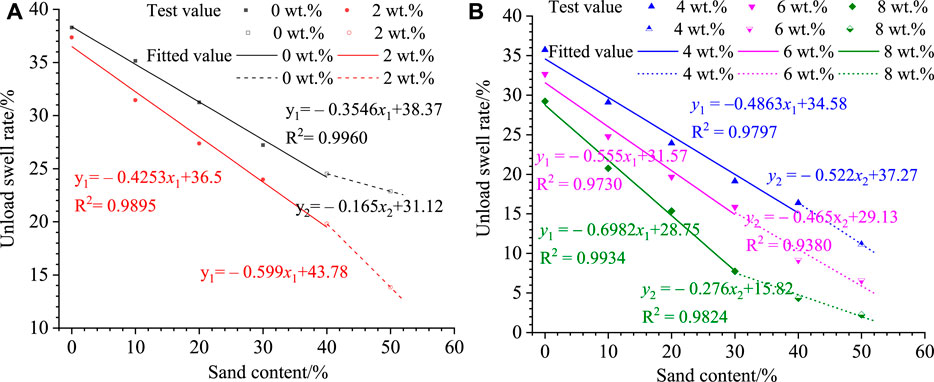
Figure 5. Correlation between swell coefficient and sand content. (A) Diesel content of 0.0 wt.%, 2.0 wt.% and 4.0 wt.% sand in relation to expansion coefficient; (B) Diesel content of 6.0 wt.% and 8.0 wt.% sand in relation to expansion coefficient.
Using the logistic mathematical model and the hyperbolic mathematical model to fit the swell time curve, the fittings are listed in Table 2. Although the logistic mathematical model
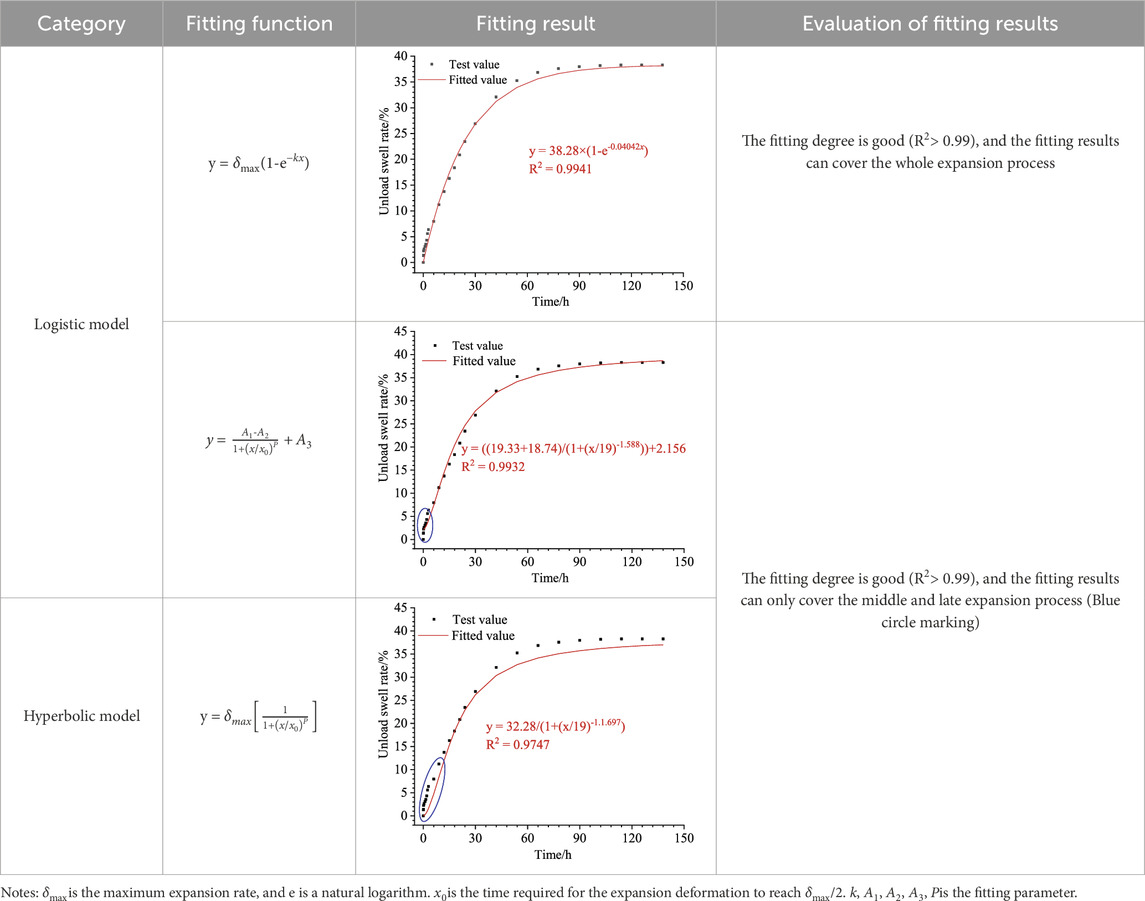
Table 2. Numerical fitting results of swell time history curve.
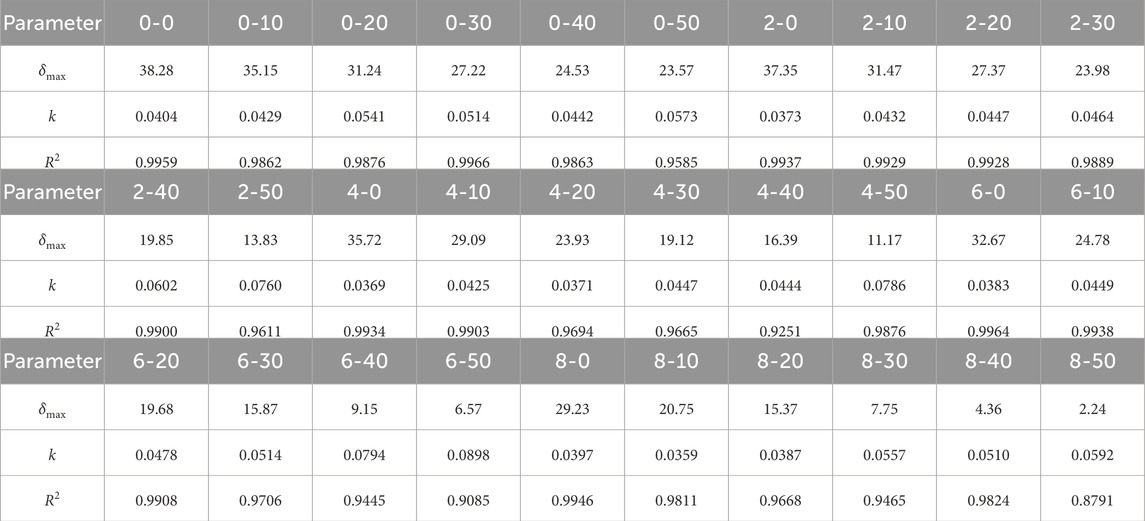
Table 3. Parameter fitting results of logistic mathematical model for swell time history curve.
To elucidate the individual and combined effects of sand and diesel on the swell characteristics of mixed soils, a two-way ANOVA was employed. The effect was measured using parameters such as steady-phase swell coefficient, time required to reach steady-phase swell, duration of the rapid swell phase, and duration of the slow swell phase, as presented in Table 4. The proportion of each factor’s influence is calculated using Eq. 3. These findings indicate that the diesel, sand, and their interaction significantly affect the unconfined expansion characteristics of mixed soils and the time required to reach steady-phase swell, with the statistical model accounting for nearly 100% of the observed variation. Specifically, the effects of sand content on the steady-state swell coefficient, the time to reach steady-state swell, the duration of the rapid swell phase, and the duration of the slow expansion phase were 58.62%, 89.44%, 63.96%, and 47.17%, respectively. The effects of the diesel content were 37.98%, 10.41%, 16.26%, and 9.35%, respectively, while the combined effects of sand and diesel were 3.31%, 0.14%, 19.24%, and 43.43%, respectively. Clearly, in this experiment, the sand content had the greatest influence on the swell characteristics of mixed soils, followed by the diesel content, and the combined effect of sand and diesel was the least.
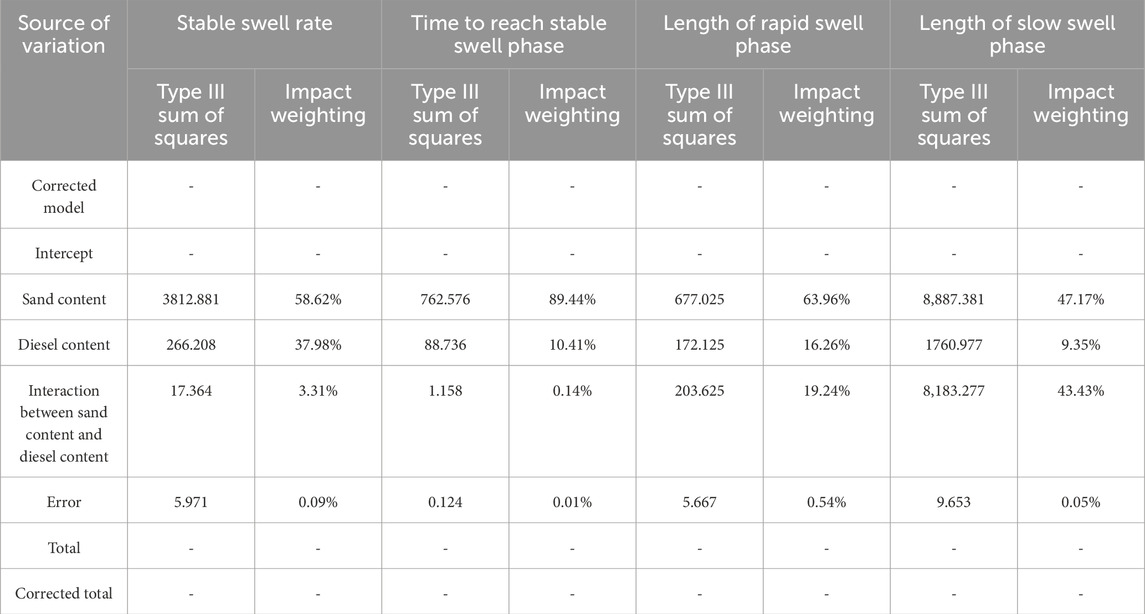
Table 4. Double factor swell coefficient under the influence of sand and diesel.
Where:
Previous studies have shown that the water absorption and swelling characteristics of soil particles determine the soil volume swell rate and affect the temporal variation of the soil swell coefficient. Therefore, studying the swelling characteristics of mixed soil particles is crucial to understanding the morphological characteristics in the swelling time curve under the influence of sand and diesel. It is known that soil water absorption and swelling involve two aspects. First, the hydration reaction increases the water adsorption of soil particles, which directly causes an outward expansion of the particle surfaces. Second, an increase in the internal bound water content “inflates” the internal volume of the soil particles. The combined effect of these two factors leads to the swelling of soil particles and ultimately results in soil volume swell. The hydration capacity of soil particles is an indicator of soil swelling (Huang et al., 2021). Typically, scholars evaluate the hydration capacity of soil particles using their cation exchange capacity (CEC).
This study conducted tests on the CEC of the mixed soil with various sand and diesel contents. The experimental scheme is shown in Table 5, and the test results are presented in Figure 6. Figure 6A shows that the unpolluted bentonite (0-0) has the highest CEC (98.75 mmol/100 g). As the sand content increases, the CEC decreases and reaches the minimum of 70.32 mmol/100 g (0-50) when the sand content is 50%. When the diesel content is 6.0 wt.%, the CEC of the polluted mixed soil also decreases with the increasing sand content, dropping from 83.37 mmol/100 g (6-0) to 49.77 mmol/100 g (6-50). Figure 6B shows the variations in CEC of the polluted mixed soil with different diesel contents when the sand content is 40%. As the diesel content increases, the CEC decreases from 74.57 mmol/100 g (0-40) to 45.53 mmol/100 g (8-40). Both sand and diesel reduce the CEC of mixed soil particles. This implies that both sand and diesel can weaken the hydration capacity of the mixed soil particles, leading to a reduction in the swelling of the mixed soil.
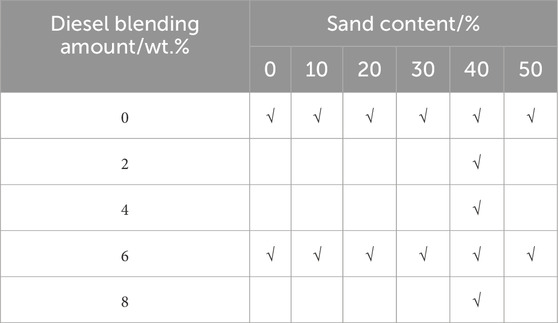
Table 5. Experimental scheme for CEC.
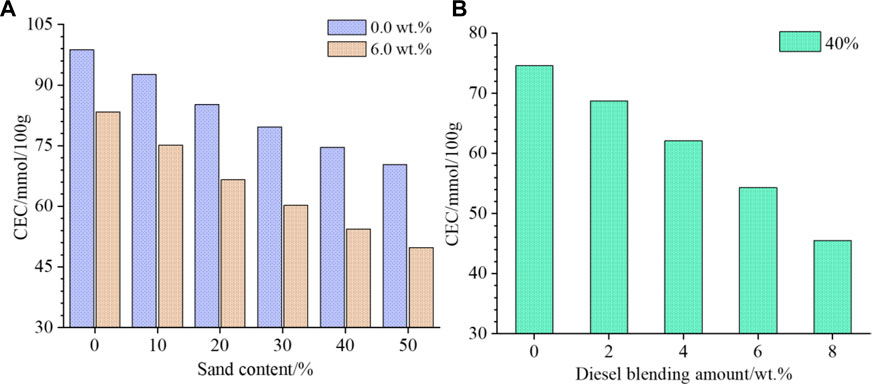
Figure 6. The CEC of mixed soil with different sand and diesel contents. (A) change characteristics of CEC with increasing sand content; (B) change characteristics of CEC with increasing diesel content.
However, with an in-depth study of swell properties of the mixed soil, researchers have found that swell characteristics are not only related to the hydration capacity of soil particles, but also are significantly influenced by the initial state of soil particles, the internal microstructure of soil particles, and the pore structure formed by the soil particles (Manca et al., 2016; Chen et al., 2023; Zeng et al., 2023). Therefore, studying the CEC of soil particles alone cannot elucidate the mechanism behind the changes in the shape of the swell-time curve. Based on this, considering both the initial state of soil particles and the soil structure, this paper further investigates the evolution mechanism of the swell-time curve shape under the influence of sand and diesel in combination with the characteristics of the swell test results.
The preparation of the uncontaminated mixed soil is not only a thorough mixing of sand and bentonite but also a uniform distribution of moisture throughout the soil matrix. However, in practice, moisture distribution is highly uneven. Moisture typically accumulates near bentonite areas, presenting a strong adsorption capacity. In contrast, only a small amount of moisture is distributed around quartz particles. Consequently, the uniformity of moisture distribution in the mixed soil varies with changes in sand content (or bentonite content) (She et al., 2013; Gou et al., 2021).
This study aims to define the heterogeneity of water spatial distribution within the soil by examining the adsorption capacity of bentonite and quartz sand. The dry density (ρ), water content (ω), and volume (V) of the swell test ring knife of the remolded samples remain constant. Thus, the mass (m) and water content (mw) of the mixed soil are the same under each condition, and only the content of bentonite (mb) and sand (ms) varies. Before remolded sample preparation, the sand undergoes acid washing and neutralization treatment. This ensures that it neither reacts chemically with the bentonite nor alters the properties of water. For ease of calculation, the adsorption rate of sand (n) is defined as a constant value (n is the amount of water adsorbed by 1 g of sand). Tests have shown that the absorption rate of the tested quartz sand is approximately 1%. Therefore, the distribution of water in the mixed soil with different sand contents can be calculated using Eqs 7–9. Figure 7A shows the water content in the bentonite region for different sand contents. As the sand content increases, the water content in the bentonite region of the uncontaminated mixed soil increases from 30% (0-0) to 59% (0-50). Hence, it can be concluded that, in the uncontaminated mixed soil, the initial water content in the bentonite region varies and shows an increasing trend with an increase in sand content.
where
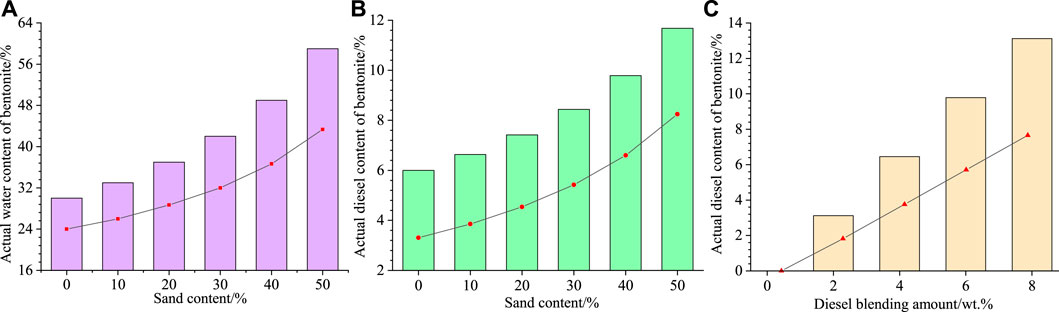
Figure 7. Actual diesel content in the bentonite area of mixed soil under the influence of sand and diesel. (A) change characteristics of actual water content in the bentonite area with increasing sand content; (B) change characteristics of actual diesel content with increasing sand content in the bentonite area; (C) change characteristics of actual diesel content in the bentonite area with increasing diesel content.
As indicated by She, D. (Chen et al., 2023), the initial water content of bentonite significantly influences its degree of hydration. Higher initial water content results in a greater degree of bentonite hydration. This phenomenon can be observed at the microscopic level (see Figure 8). Comparing Figures 8A,B, it is evident that the cell size of the bentonite (indicated by the red circles) in mixtures with 40% sand content is smaller than that in the pure bentonite, while the interlayer spacing of montmorillonite plates (indicated by green circles and arrows) is wider. More water induces a stronger hydration reaction in the montmorillonite, which increases the number of interlayer water layers and thus increases the interlayer spacing. It also means that the expansion potential of bentonite is consumed before the swelling test, which reduces its contribution to the swelling coefficient during subsequent tests. Therefore, the reduced swell characteristics of unpolluted mixed soils with decreasing sand content are not only due to the direct reduction in swelling substances but also to the diminished initial expansion potential of the bentonite. Note that the hydration capacity of the bentonite does not change.

Figure 8. Microscopic morphology montmorillonite. (A) 0% sand content; (B) 40% sand content.
The difference in the adsorption of diesel between sand and bentonite is also one of the main reasons for the reduced swelling characteristics of the contaminated mixed soil. For the same amount of diesel incorporation, the diesel content in the mixed soil remains similar under different sand contents, but the difference in adsorption of diesel between sand and bentonite leads to an uneven diesel distribution. This paper also analyzes the diesel distribution in sand and bentonite under different sand contents through calculations, based on the assumption that water and diesel do not interfere with each other on the surfaces of sand and bentonite. Following Eqs 1–6 and combined with experimental analyses, the diesel adsorption rate of quartz sand (0.32%) can be used to calculate the diesel distribution in the mixed soil with different sand contents. A diesel incorporation amount of 6.0 wt.% and mixed soil with different sand contents was taken as an example for analysis. The diesel content in the bentonite region is shown in Figure 7B. Similarly, as the sand content increases, the actual diesel content in the bentonite region of the contaminated mixed soil continues to increase from 6.00% (6-0) to 11.68% (6-50). The more diesel is distributed, the more diesel is adsorbed on the surface of bentonite particles. In addition, the thicker the oil film, the stronger the ability to resist pressure water approaching the particle surface. Therefore, as the sand content increases, the weakened swelling characteristics of the diesel-contaminated mixed soil are not only due to the reduction of bentonite content in the mixed soil but also the reduced initial hydration ability of bentonite particles.
When the sand content is 40%, the diesel contents in the bentonite region of the contaminated mixed soil are 0.0% (0-40), 3.12% (2-40), 6.45% (4-40), 9.78% (6-40), and 5.12% (8-40). Compared with the set incorporation levels, these values are increased by 0.0%, 1.12%, 2.45%, 3.78%, and 5.12%, respectively, as shown in Figure 7C. Therefore, it can be concluded that the bentonite in the contaminated mixed soil adsorbs more diesel under actual conditions. This adsorption significantly weakens the barrier effect on the swell properties of the mixed soil, resulting in a greater reduction in the swell characteristics of the contaminated mixed soil (Li and Denham, 2000; Vidal and Volzone, 2012; Chun et al., 2022).
Accordingly, the reasons for the reduction in swell properties of the mixed soil by sand and diesel were further explored. However, this analysis can only reveal the evolution mechanism of the swell coefficient during the stable swell phase on the swell time curve. The evolution mechanism of the swell coefficient during the rapid swell phase and the slow swell phase remains unclear.
Changes in sand content and diesel blending not only alter the initial state of bentonite but also affect the pore structure of the mixed soil (Li et al., 2019; Wang et al., 2024). The variation in pore structure has a significant influence on the shape of swell time curves (Bian et al., 2019). The mixed soil is a porous medium composed of soil particles of different sizes, and the internal pore structure can change due to variations in the particle composition. Changes in the sand content and diesel blending directly lead to changes in the particle composition, resulting in a variation in the pore structure (Chun et al., 2023b). In this study, according to the experimental scheme in Table 6, tests and analyses were conducted on the particle size distribution and pore structure of the mixed soil with different sand contents and diesel blending levels, as presented in Figure 9 and Table 7.
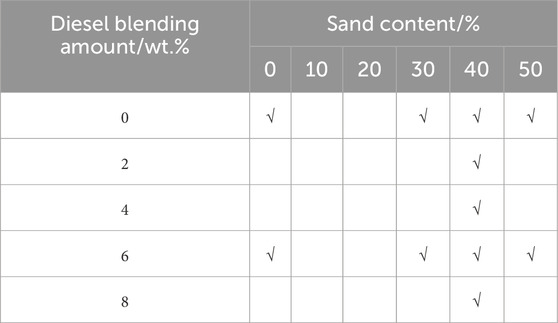
Table 6. Experimental scheme for particle size distribution and pore structure.
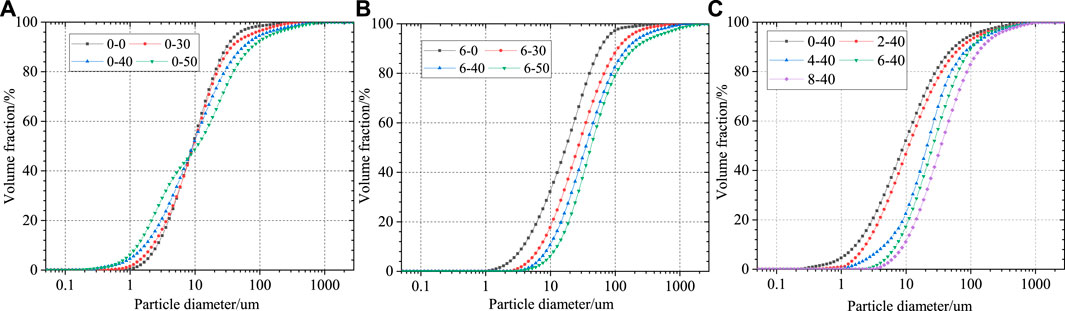
Figure 9. Particle size distribution of mixed soil with different sand and diesel contents. (A) changes characteristics in particle size distribution of 0.0 wt.% diesel content specimens with increasing sand content; (B) changes characteristics in particle size distribution of 6.0 wt.% diesel content specimens with increasing sand content; (C) changes characteristics in particle size distribution of 40% sand content specimens with increasing diesel content.
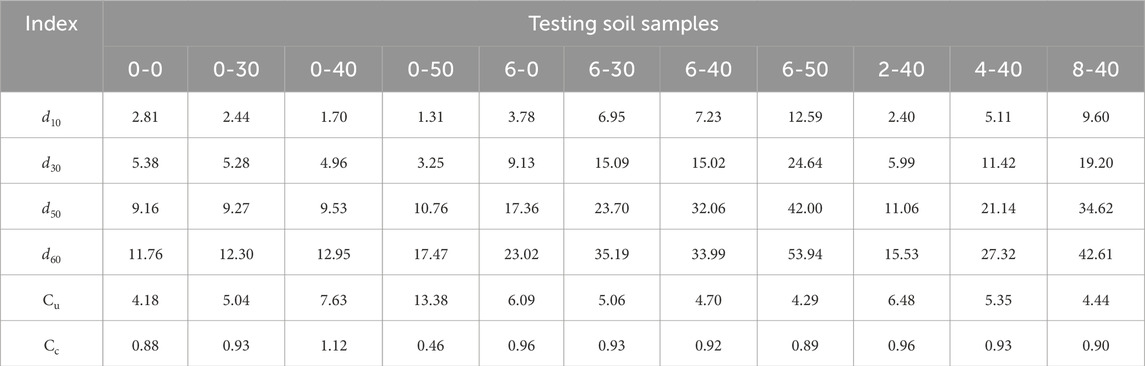
Table 7. Characteristic parameters of particle size distribution in the mixed soil with different sand and diesel contents.
Figure 9A shows the changes in the particle size distribution of the uncontaminated mixed soil under the influence of sand when the diesel content is 0.0 wt.%. As the sand content increases, the particle size range of the mixed soil expands from 0.767 to 310 um (0-0) to 0.146–1,110 um (0-50), and the particle size range span increases from 309.33 to 1,109.854 um. The increase in sand content increases the coarse particle content of uncontaminated mixed soil and the fine particle content. The changes in particle size distribution can be obtained through the characteristic parameters of particle size distribution. Table 7 shows that with an increase in sand content, the effective particle size (d10) and median particle size (d30) decrease from 2.81 um (0-0) to 1.31 um (0-50) and 5.38 um (0-0) to 3.25 um (0-50), respectively, whereas the limiting particle size (d60) increases from 11.76 um (0-0) to 17.47 um (0-50). Combining the characteristic parameters of particle size distribution, the particle size distribution of the uncontaminated mixed soil was evaluated. With an increase in sand content, the coefficient of uniformity (Cu) increases from 4.18 (0-0) to 13.38 (0-60), while the curvature coefficient (Cc) first increases from 0.88 (0-0) to 1.12 (0-40), and then decreases to 0.46 (0-50). In general, the particle distribution of the uncontaminated mixed soil is the most uneven when the sand content is 40% (Cu = 7.63 > 5, Cc = 1.12 > 1). The particle size distribution of the contaminated mixed soil gradually evolves from poor to good gradation. When the sand content exceeds 40%, the particle size distribution changes back to poor gradation.
It is known that the addition of large-diameter quartz sand and the breakage of bentonite aggregates contribute to the increase of both coarse and fine particles in the mixed soil. Their changes directly affect the chain-filling effect between soil particles and alter the pore structure of the soil. As shown in Figure 10, the porosity of the unpolluted mixed soil first decreased from 35.23% (0-0) to 30.05% (0-40) and then increased to 43.57% (0-50). The porosity of interaggregate pores also showed a similar changing pattern, namely, it first decreases from 9.22% to 6.38%, and then increases to 13.42%. The porosity of intraaggregate pores first increases from 19.05% to 22.01% and then decreases to 18.17%. Such changes in pore structure have an impact on the evolution mechanism of the swell coefficient in the rapid phase.
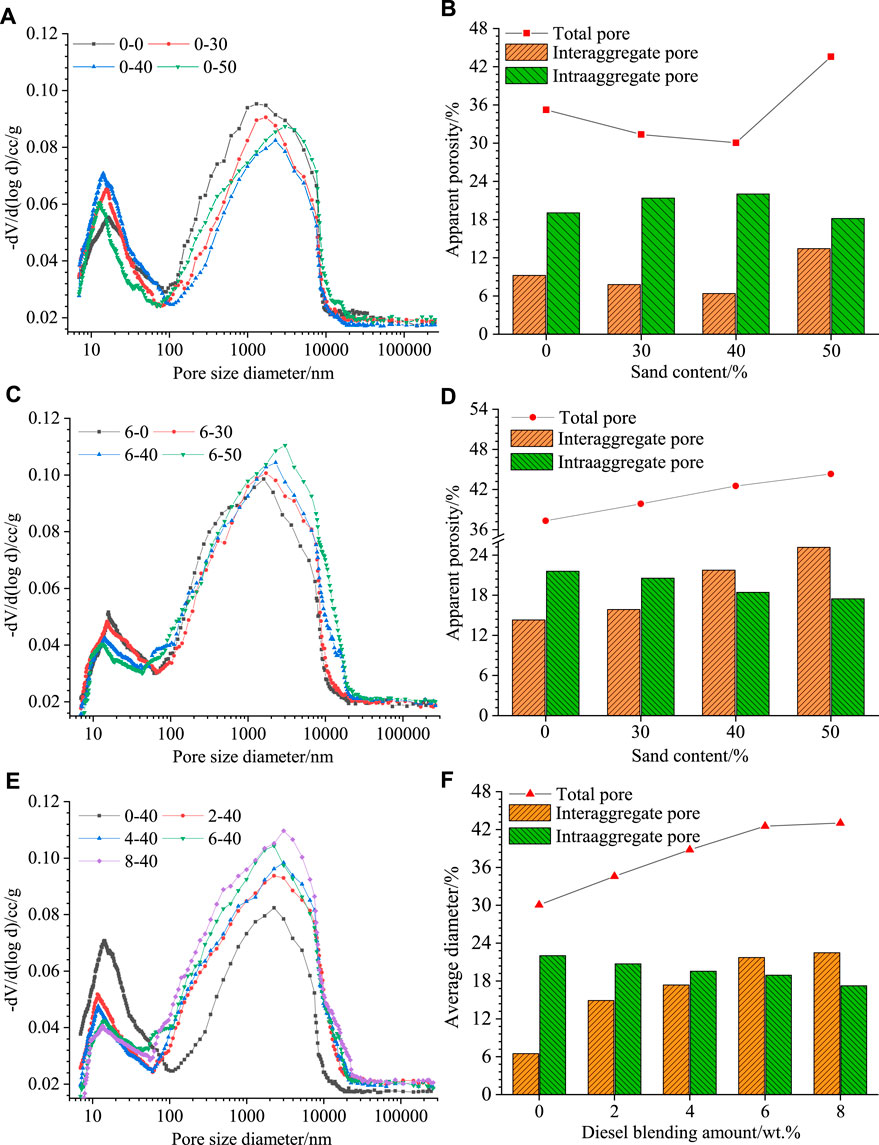
Figure 10. Pore structure of the mixed soil under the influence of sand and diesel. (A) and (B) are the variation of pore structure with increasing sand content for 0.0 wt.% diesel content specimens; (C) and (D) are the variation of pore structure with increasing sand content for 6.0 wt.% diesel content specimens; (E) and (F) are the changes in pore structure with increasing diesel content for 40% sand content specimens.
According to related research conclusions, when soil undergoes water absorption and swelling, the smaller the internal voids, the less the swelling potential, and the faster the soil volume swell rate (Chun et al., 2022). Therefore, in the early phases of the swelling test, when the pressurized water infiltrates the bottom of the unpolluted soil sample, the swell coefficient of the unpolluted soil with smaller porosity increases the fastest. Based on the aforementioned mechanism of pore structure change, it can be understood that, as the sand content increases from 0% to 40%, the swell coefficient gradually increases and then decreases. This is consistent with the swelling test results. Simultaneously, when the bottom layer of the soil sample undergoes water absorption and swelling, it fills and blocks the pores. As a result, a dense soil layer that obstructs the upward seepage of pressurized water was generated, and the further expansion of soil was delayed. However, as the test progresses, the dense soil layer is eventually penetrated by the pressurized water, infiltrating the middle and upper layers of the soil sample. The greater the porosity, especially, the more interaggregate pores, the more conducive it is to the seepage of pressurized water. The faster the rising pressurized water, and the higher the rising height within the soil sample, the more contacted soil particles. This further facilitates soil swell (Saba et al., 2014; Sun et al., 2015; Zeng et al., 2022). Therefore, in the later stages of the rapid expansion phase, the swelling characteristics of the mixed soil revert to the form where the higher the sand content, the smaller the swell coefficient. Additionally, the higher the sand content in the mixed soil, the less bentonite available for hydration reactions, resulting in less energy storage during soil volume expansion. Consequently, the growth rate of the expansion characteristics in the middle and later stages of the swelling test decreases (Zhao et al., 2023), and the duration is shorter, as shown in Figures 11, 12. Figure 9B illustrates the particle size distribution of the contaminated soil mixture with a diesel content of 6.0 wt.% under various sand contents. As the sand content increases, the distribution range of the contaminated soil shifts from 0.991 to 454 μm (6-0) to 1.88–1850 μm (6-50), and the span increases from 453.009 to 1848.12 μm. The d60, d30, and d10 all increase with the sand content, rising from 3.78 μm (6-0) to 12.59 μm (6-50), 9.13 μm (6-0) to 24.64 μm (6-50), and 23.02 μm (6-0) to 53.94 μm (6-50), respectively. The uniformity coefficient (Cu) and curvature coefficient (Cc) gradually decrease, from 6.09 (6-0) to 4.29 (6-50) and from 0.96 (6-0) to 0.89 (6-50), respectively. It is observed that the particle size distribution of the contaminated soil mixture continuously moves towards a poorly graded distribution. The incorporation of sand into the contaminated soil is a direct cause of the increase in coarse particle content within the soil. Additionally, the viscous effect of diesel serves as a significant influencing factor. Under the viscous action of diesel, small-diameter soil particles aggregate and adhere, producing larger-diameter soil particles. This directly increases the coarse particle content and reduces the fine particle content within the contaminated soil mixture (Kaya and Fang, 2005; Izdebska-Mucha and Trzciński, 2021).
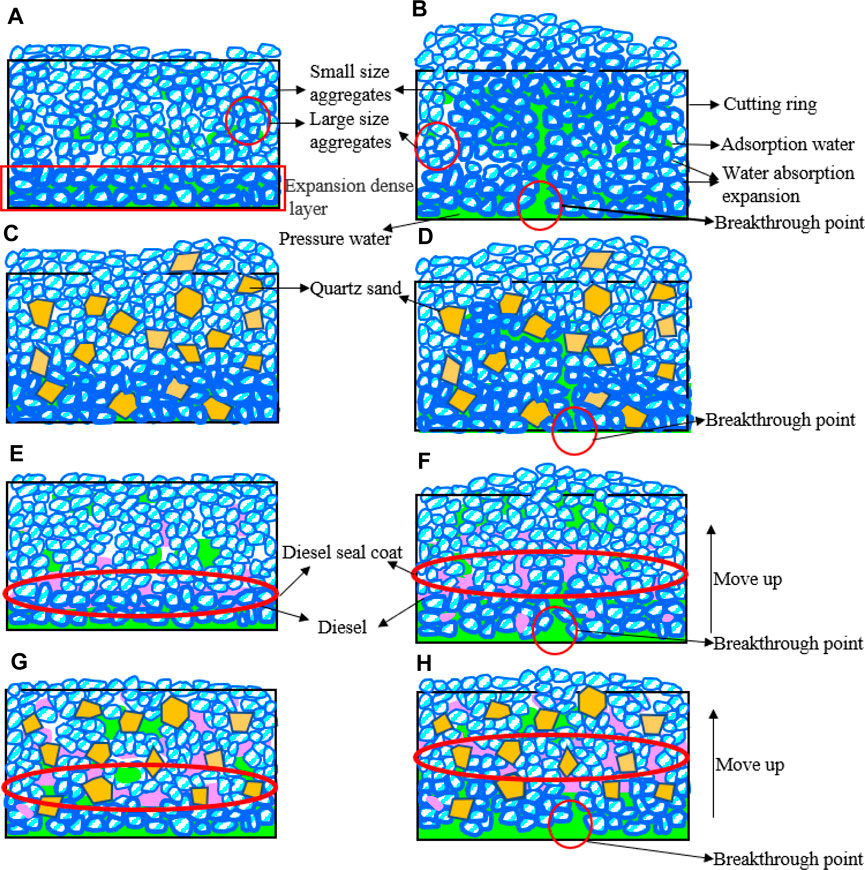
Figure 11. Process of the no-load swell of mixed soil under the effect of sand and diesel. (A) and (B) bentonite water absorption and expansion process; (C) and (D) well-graded sand-bentonite water absorption and expansion process; (E) and (F) diesel pollution bentonite water absorption and expansion process; (G) and (H) well-graded diesel contaminated sand-bentonite water absorption and expansion process.
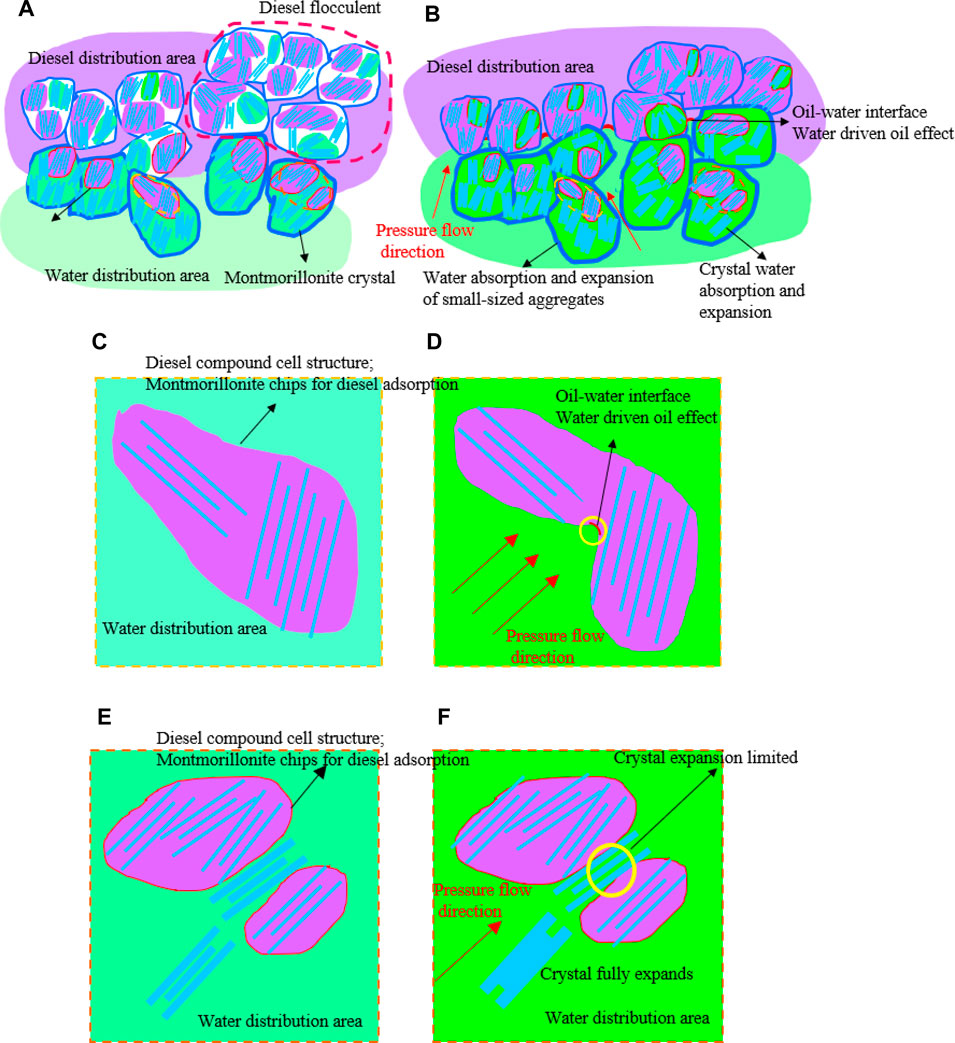
Figure 12. Oil seal phenomenon during the water absorption and expansion process of mixed soil. (A) and (B) interaggregate pore water oil repulsion process; (C–F) intra-aggregate pore water oil repulsion process.
Using the average particle size (d50), the sand-diesel coupling effect on particle size distribution was further analyzed, as shown in Figure 13. It indicates that when the sand content is within the ranges of 0%–30%, 30%–40%, and 40%–50%, the differences in the increments of the average particle size (d50) between unpolluted mixed soil and diesel-contaminated mixed soil are 6.23, 8.10, and 8.71 μm, respectively. Clearly, with an increase in sand content, the difference in the increments of the average particle size (d50) becomes larger. Therefore, it can be concluded that, although the diesel content remains constant, the changes in particle size distribution due to the addition of diesel differ from those in the unpolluted soil as the sand content increases. The higher the sand content, the greater the influence of the sand-diesel coupling effect on the particle size distribution. As mentioned previously, an increase in coarse particle content and a decrease in fine particle content can increase the pore space within the soil. Through the MIP test, the changes in the pore structure of diesel-contaminated mixed soil with the increasing sand content can be detailed in Figures 10C,D. The pore size distribution of diesel-contaminated mixed soil remains typically bimodal, but the total apparent porosity, interaggregate porosity, and intraaggregate porosity of the soil differ under the influence of sand content. The porosity increases from 30.05% (0-40) to 43.02% (8-50), the interaggregate porosity increases from 6.5% (0-40) to 22.49% (8-40), and the intra-aggregate porosity decreases from 22.01% (0-40) to 17.25% (8-40). Hence, it is evident that the density of diesel-contaminated soil does not undergo a phased change like that of the unpolluted mixed soil, but decreases gradually with an increase in the sand content. Based on the theory that larger pore spaces within the soil consume more swelling potential of bentonite (Zhao et al., 2023), the swelling coefficient of the contaminated mixed soil during the rapid swelling phase decreases gradually with a reduction in density and does not increase with the sand content.
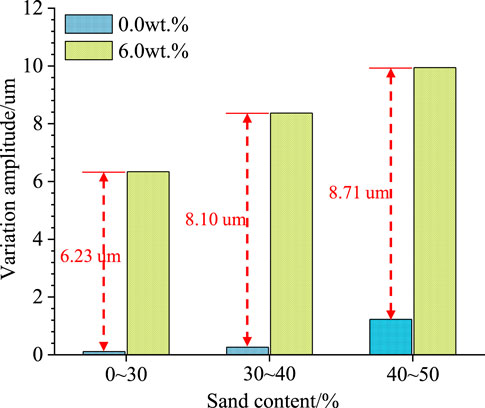
Figure 13. Variation amplitude of average particle diameter (d50) in different sand content ranges of the mixed soil with diesel contents of 0.0 and 6.0 wt.%.
An increase in the pore space within the soil not only directly reduces the swell characteristics of the contaminated soil, but also shortens the duration of each swell phase, accelerating the completion of the swell process (Souza and Pejon, 2020; Wang D. et al., 2021). However, on the swell time curve of the contaminated soil, only the duration of the rapid swell phase is shortened, while the duration of the slow swell phase and the time to reach expansion stability increase, which indicates that this is related to the diesel within the contaminated soil. Through the known regional distribution of diesel under different sand contents in Section 4.2, it is found that the higher the sand content, the more diesel is present in the bentonite region. The more diesel is distributed, the more and larger diesel bentonite flocs are generated due to the viscosity effect of diesel (Figures 11, 12) (Izdebska-Mucha and Trzciński, 2021; Rahman and Sharma, 2023). In the flocs, diesel is trapped between soil particles, adsorbed on the surface of bentonite particles, and immersed in the pores of soil (montmorillonite intergranular pores) (Habib-ur-Rehman et al., 2007). When the pressure water approaches the floccules, the surface-adsorbed diesel not only hinders the pressure water from approaching the outer surface of the floccules and slowing down the swell process but also hinders the infiltration of pressure water into the interior of the floccules, which further slows down the swell process. The more diesel clogging in the pores, the greater the difficulty of pressure water displacing the clogged diesel. This results in a stronger delaying effect on the expansion process. The diesel immersed in soil particles wraps around the montmorillonite crystals, forming a diesel-coated crystal structure that hinders the short-range (interlayer) swell of the crystals. Meantime, due to the presence of adsorbed diesel, the growth of water layers bound to the montmorillonite crystals not completely enveloped by diesel is also limited, which to some extent hinders the development of short-range (interlayer) swell. Therefore, it can be concluded that in the diesel-contaminated soil, the rate of water absorption and swell of bentonite aggregates can be significantly slowed down with an increase in the sand content, leading to a substantial extension of the time required to complete the entire expansion process (Xu et al., 2014; Zhu et al., 2016).
As mentioned earlier, when the swell soil undergoes the volume swell, it is accompanied by the process of pressure water infiltration, and the rate of swell is influenced by the infiltration characteristics. Furthermore, it can be noted that, when soil undergoes infiltration, water mainly passes through the interaggregate pores in the soil skeleton (aggregated pores), and is hindered by the filled fine particles (Fei et al., 2019). Therefore, the evolution of volume swell is not only affected by the interaggregate pores of the soil skeleton but also by the filling materials in the pores. Porosity structure tests show that, with an increase in the sand content, the aggregated pores in the diesel-contaminated swell soil also increase. This provides more permeation channels for the pressure water, which is conducive to enhancing the infiltration characteristics and accelerating the water absorption and swell process of the diesel-contaminated soil (Cheon et al., 2021). However, with an increase in the sand content, the diesel content in the region where the swell soil is located also increases. The additional diesel not only weakens the water absorption and swelling characteristics of the swell soil (short-range expansion) but also delays the long-range swell. Since diesel and water are not miscible, they are not evenly distributed in the mixed soil and are interlaced in pores (Rahman and Sharma, 2023). When the pressure contacts the bottom of the soil cake, the phenomenon of water displacing oil l immediately occurs in the interaggregate pores of the mixed soil. At this time, the infiltrating pressure water is not only hindered by the swell soil particles but also by the blocking effect of the diesel. Moreover, the more diesel content in the distribution area of the swell soil, the stronger the oil-sealing effect (Javanbakht et al., 2017; Verma et al., 2018; Selem et al., 2021). Simultaneously, the infiltration of pressurized water alters the internal pH of the soil, making it more acidic, which enhances the adsorption and precipitation of diesel on soil particles and within pores, thereby increasing the oil-sealing effect (Bai et al., 2024). Consequently, the water absorption and swelling rate of diesel-contaminated mixed soil is significantly reduced due to the added resistance. Furthermore, as the experiment progresses, the free diesel in the upper part of the soil sample gradually accumulates in the oil-sealing layer, directly increasing the resistance to the upward movement of pressurized water (Bai et al., 2020). This restricts the evaporation and capillary action induced by temperature effects, thereby extending the time required to complete the entire permeation process (see Figures 11, 12).
In summary, the influence of sand content on the swell characteristics of the diesel-contaminated soil includes two opposing aspects. However, according to the experimental results, the dominant effect of the increase in the sand content on the sealing effect of diesel oil caused by swelling is not only to reduce the strength of the water absorption and swelling characteristics of the expansive clay aggregates, prolonging the water absorption and swelling process, but also to hinder the infiltration of pore water, significantly delaying the long-term swelling process. In addition, due to the influence of immersion in diesel oil, the water absorption and swelling capacity of soil particles are no longer affected by their own hydration capacity and aggregate structure, and the infiltration process is no longer affected by the pore structure. Under the influence of many factors, the evolution process of the swell coefficient is complex, and its linear relationship with time changes. Therefore, the duration of linear change in the rapid swell phase on the swell time curve decreases.
With a constant sand content, an increase in the diesel content can enhance the viscous effect of bentonite in the mixed soil. The more diesel content absorbed on the surface of bentonite particles, the more significant the increase in the number and size of aggregates. Therefore, the water absorption and swelling strength of bentonite aggregates continue to weaken, and the water absorption and swelling process is significantly prolonged. However, the adsorption capacity of the bentonite for diesel is always limited. Therefore, the more diesel content is added, the freer diesel content is present in the pores between the aggregates of the mixed soil, and its hindrance to the permeation pressure of water is stronger (Akhlaghi Amiri and Hamouda, 2014; Junjie et al., 2014; Afshari et al., 2019). Therefore, on the swell coefficient curve, the swell coefficient is smaller, the time required to complete the entire swell process is prolonged, the slow swell phase is also longer, and the linear change process of the swell coefficient in the rapid swell phase continues to shorten.
The main conclusions are as follows.
(1) Changes in sand content did not affect the three-phase swelling characteristics of unpolluted mixed soil. As sand content increased, the stable phase swell coefficient and the duration of each swelling phase decreased. During the rapid swell phase, the swell coefficient increased with sand content from 0% to 40% but decreased beyond 40%.
(2) The swelling curve of diesel-contaminated mixed soil also exhibited a three-phase pattern. Increased sand content reduced swell characteristics in each phase, extended the slow and stable swell phases, and shortened the rapid swell phase.
(3) Cation exchange capacity (CEC) defines water absorption swell characteristics but cannot fully explain the swelling history curve. Changes in soil particle size distribution, affecting soil compaction, primarily cause variations in the swell coefficient with increasing sand content during the rapid swelling phase. Diesel infiltration alters the particle size distribution and compaction (porosity structure), influencing the swell coefficient variation during the rapid swell phase.
(4) Increased sand content reduces the material undergoing water absorption swell and affects the initial swell potential of bentonite, impacting the swell coefficient in each phase. Diesel adsorption by montmorillonite changes bentonite composition and creates an oil-sealing effect in pores, increasing permeation resistance, shortening the rapid swell phase, and lengthening the slow and stable swell phases.
The raw data supporting the conclusions of this article will be made available by the authors, without undue reservation.
Y-yC: Methodology, Funding acquisition, Formal Analysis, Conceptualization, Writing–review and editing, Writing–original draft. ZL: Writing–review and editing, Funding acquisition. YH: Writing–review and editing, Funding acquisition, Conceptualization. HW: Writing–review and editing, Visualization. DS: Writing–review and editing, Visualization.
The author(s) declare that no financial support was received for the research, authorship, and/or publication of this article.
The authors are grateful to the Postdoctoral Fellowship Program of CPSF (GZC20233149) and the National Natural Science Foundation of China (Projects No. 42372333 and 42072318). The authors also thank Central South University Innovation-Driven Research Programme (Project No. 2023CXQD044) and 2021 Guangxi University Young and Middle-aged Teachers Scientific Research Basic Ability Improvement Project (Project No. 2021KY1098).
The authors declare that the research was conducted in the absence of any commercial or financial relationships that could be construed as a potential conflict of interest.
All claims expressed in this article are solely those of the authors and do not necessarily represent those of their affiliated organizations, or those of the publisher, the editors and the reviewers. Any product that may be evaluated in this article, or claim that may be made by its manufacturer, is not guaranteed or endorsed by the publisher.
Afshari, S., Hejazi, S. H., and Kantzas, A. (2019). Pore-level modeling of effective longitudinal thermal dispersion in non-isothermal flows through granular porous media. Chem. Eng. Sci. 199, 451–462. doi:10.1016/j.ces.2019.01.028
Akhlaghi Amiri, H. A., and Hamouda, A. A. (2014). Pore-scale modeling of non-isothermal two phase flow in 2d porous media: influences of viscosity, capillarity, wettability and heterogeneity. Int. J. Multiphas Flow. 61, 14–27. doi:10.1016/j.ijmultiphaseflow.2014.01.001
Bai, B., Chen, J., Bai, F., Nie, Q., and Jia, X. (2024). Corrosion effect of acid/alkali on cementitious red mud-fly ash materials containing heavy metal residues. Environ. Technol. Inno 33, 103485. doi:10.1016/j.eti.2023.103485
Bai, B., Xu, T., Nie, Q., and Li, P. (2020). Temperature-driven migration of heavy metal pb2+ along with moisture movement in unsaturated soils. Int. J. Heat. Mass Tran 153, 119573. doi:10.1016/j.ijheatmasstransfer.2020.119573
Beck-Broichsitter, S., Gerke, H., and Horn, R. (2018). Shrinkage characteristics of boulder marl as sustainable mineral liner material for landfill capping systems. Sustainability-Basel 10, 4025. doi:10.3390/su10114025
Bian, X., Cui, Y., and Li, X. (2019). Voids effect on the swelling behaviour of compacted bentonite. Geotechnique 69, 593–605. doi:10.1680/jgeot.17.P.283
Chen, B., Peng, F., Zhang, L., and Sun, D. (2023). Investigation on swelling characteristics of gmz bentonite with different initial water contents. Ann. Nucl. Energy 181, 109565. doi:10.1016/j.anucene.2022.109565
Cheon, D. S., Takahashi, M., and Kim, T. (2021). Permeability differences based on three-dimensional geometrical information of void spaces. J. Rock Mech. Geotech. 13, 368–376. doi:10.1016/j.jrmge.2020.04.008
Chun, Y., Du, J., Zhou, D., Liu, Z., Liang, T., Qin, J., et al. (2022). Effect of thermal treatment on the expansion characteristics of the diesel-contaminated soil and its mechanism. B Eng. Geol. Environ. 81, 159. doi:10.1007/s10064-022-02651-w
Chun, Y., Liu, Z., Liu, C., Zhou, D., Huang, Z., Su, J., et al. (2023b). Evolution of the pore structure and permeability of thermally desorbed diesel-contaminated soils. Acta Geotech. 18, 6529–6557. doi:10.1007/s11440-023-01894-5
Chun, Y., Zhou, D., Liu, Z., Liu, C., Liang, T., Su, D., et al. (2023a). Analyzing the characterization of pore structures and permeability of diesel contaminated clays under different aging conditions. Front. Struct. Civ. Eng. 17, 1264–1280. doi:10.1007/s11709-023-0921-x
Dananaj, I., Frankovská, J., and Janotka, I. (2005). The influence of smectite content on microstructure and geotechnical properties of calcium and sodium bentonites. Appl. Clay Sci. 28, 223–232. doi:10.1016/j.clay.2004.02.006
Estabragh, A. R., Amini, M., and Soltanian, M. R. (2020). Aging effects on the swelling behavior of compacted bentonite. B Eng. Geol. Environ. 79, 2341–2352. doi:10.1007/s10064-019-01708-7
Fan, Q. Y., Liang, X., and Han, J. S. (2020). Experimental study on saturation and swelling-shrinkage characteristics of unsaturated expansive rocks. J. Rock Mech. Eng. 39, 45–56. doi:10.13722/j.cnki.jrme.2019.0579
Fei, Y., She, D., Gao, L., and Xin, P. (2019). Micro-ct assessment on the soil structure and hydraulic characteristics of saline/sodic soils subjected to short-term amendment. Soil Tillage Res. 193, 59–70. doi:10.1016/j.still.2019.05.024
Fu, X. L., Jiang, Z. Y., Reddy, K. R., Ruan, K., and Du, Y. J. (2023). Hydraulic conductivity, microstructure, and compositional changes of sand–bentonite backfill in cutoff walls exposed to organic acids. J. Geotech. Geoenviron 149 (8), 04023060. doi:10.1061/jggefk.gteng-11321
Gökalp, Z., Başaran, M., and Uzun, O. (2011). Compaction and swelling characteristics of sand-bentonite and pumice-bentonite mixtures. Clay Min. 46, 449–459. doi:10.1180/claymin.2011.046.3.449
Gou, Q., Zhu, Q., Li, Y., Tian, X., Wang, P., Xin, Y., et al. (2021). Deep profile soil moisture distribution characteristics for different micro-topographies on the semi-arid loess plateau, China. J. Mt. Sci-Engl 18, 2688–2697. doi:10.1007/s11629-020-6624-z
Habib-ur-Rehman, A., Abduljauwad, S. N., and Akram, T. (2007). Geotechnical behavior of oil-contaminated fine-grained soils. Electron. J. Geotechnical Eng. 12. doi:10.1016/j.enggeo.2013.08.004
Hashemi, M. A., Massart, T. J., Salager, S., Herrier, G., and François, B. (2015). Pore scale characterization of lime-treated sand–bentonite mixtures. Appl. Clay Sci. 111, 50–60. doi:10.1016/j.clay.2015.04.001
Hedayati-Azar, A., and Sadeghi, H. (2022). Semi-empirical modelling of hydraulic conductivity of clayey soils exposed to deionized and saline environments. J. Contam. Hydrol. 249, 104042. doi:10.1016/j.jconhyd.2022.104042
Henríquez, M., Pérez, J., Gascó, J. M., and Rodríguez, O. (2005). Cation exchange capacity in sand and kaolin using ammonium acetate, sodium acetate, and ammonium chloride. Bioagro 17 (1), 59–62.
Huang, W., Feng, Z., Fu, H., and Xiang, W. (2021). Evolution of pore characteristics for bentonite modified by an ionic soil stabilizer during hydration processes. Adsorpt. Sci. Technol. 2021, 1–14. doi:10.1155/2021/7777091
Ishimori, H., Endo, K., Ishigaki, T., and Yamada, M. (2020). Effects of 1,4-dioxane and bisphenol a on the hydraulic barrier performance of clay bottom liners for waste containment facilities. Soils Found. 60, 767–777. doi:10.1016/j.sandf.2020.04.009
Izdebska-Mucha, D., and Trzciński, J. (2021). Clay soil behaviour due to long-term contamination by liquid petroleum fuels: microstructure and geotechnical properties. B Eng. Geol. Environ. 80, 3193–3206. doi:10.1007/s10064-020-02084-3
Javanbakht, G., Arshadi, M., Qin, T., and Goual, L. (2017). Micro-scale displacement of napl by surfactant and microemulsion in heterogeneous porous media. Adv. Water Resour. 105, 173–187. doi:10.1016/j.advwatres.2017.05.006
Jin, J., Li, Y., Zhang, J., Wu, S., Cao, Y., Liang, P., et al. (2016). Influence of pyrolysis temperature on properties and environmental safety of heavy metals in biochars derived from municipal sewage sludge. J. Hazard Mater 320, 417–426. doi:10.1016/j.jhazmat.2016.08.050
Junjie, Z., Xilai, Z., Lei, C., and Sun, Y. (2014). Effect of residual oil saturation on hydrodynamic properties of porous media. J. Hydrology (Amsterdam) 515, 281–291. doi:10.1016/j.jhydrol.2014.04.067
Kaya, A., and Fang, H. (2005). Experimental evidence of reduction in attractive and repulsive forces between clay particles permeated with organic liquids. Can. Geotech. J. 42, 632–640. doi:10.1139/t04-099
Lemos, M. A. C., Baran, C. T., Cavalcante, A. L. B., and Palmeira, E. M. (2023). A semi-analytical model of contaminant transport in barrier systems with arbitrary numbers of layers. Sustainability-Basel 15, 16299. doi:10.3390/su152316299
Li, L. Y., and Denham, W. T. (2000). The hydraulic conductivity and adsorptivity of organoclay in a sand-bentonite barrier to hydrophobic organic chemicals. Environ. Technol. 21, 1429–1443. doi:10.1080/09593332208618176
Li, L. Y., Zhang, H., Gorgy, T., and Grace, J. R. (2019). Effect of polybrominated diphenyl ethers on sand-bentonite liner material. Waste Manage 89, 73–82. doi:10.1016/j.wasman.2019.03.064
Li, X., and Zhang, L. M. (2009). Characterization of dual-structure pore-size distribution of soil. Can. Geotech. J. 46, 129–141. doi:10.1139/T08-110
Ma, G. L., Zhang, H. Y., Ji, Z. 1, and Tan, Y. (2020). Swelling and seepage characteristics of loosely packed bentonite pellet-contained materials. Chin. J. Rock Mech. Eng. 39, 3607–3614. doi:10.13722/j.cnki.jrme.2020.0372
Mahallei, H., and Badv, K. (2021). The study of diffusion characteristics of soil bentonite to control contaminant transport. World J. Eng. 18, 379–388. doi:10.1108/WJE-01-2020-0003
Manca, D., Ferrari, A., and Laloui, L. (2016). Fabric evolution and the related swelling behaviour of a sand/bentonite mixture upon hydro-chemo-mechanical loadings. Geotechnique 66, 41–57. doi:10.1680/jgeot.15.P.073
Murtaza, M., Kamal, M. S., Hussain, S. M. S., and Mahmoud, M. (2020). Clay swelling inhibition using novel cationic gemini surfactants with different spacers. J. Surfactants Deterg. 23, 963–972. doi:10.1002/jsde.12420
Nel, T., Bruneel, Y., and Smolders, E. (2023). Comparison of five methods to determine the cation exchange capacity of soil. J. Plant Nutr. Soil S. C. 186 (3), 311–320. doi:10.1002/jpln.202200378
Omagari, R., Nakayama, T., Miyawaki, T., Yagishita, M., Hashimoto, S., Kadokami, K., et al. (2021). Evaluation of identification accuracy using aiqs for gc-ms for measuring heavily contaminated samples. Chemosphere 285, 131401. doi:10.1016/j.chemosphere.2021.131401
Ouhadi, V. R., Yong, R. N., Rafiee, F., and Goodarzi, A. R. (2011). Impact of carbonate and heavy metals on micro-structural variations of clayey soils. Appl. Clay Sci. 52, 228–234. doi:10.1016/j.clay.2011.02.020
Pandian, N. S., Nagaraj, T. S., and Raju, P. S. R. N. (1995). Permeability and compressibility behavior of bentonite-sand/soil mixes. Geotech. Test. J. 18, 86–93. doi:10.1520/gtj10124j
Park, J. (2021). Evaluation of changes in the permeability characteristics of a geotextile–polynorbornene liner for the prevention of pollutant diffusion in oil-contaminated soils. Sustainability-Basel 13, 4797. doi:10.3390/su13094797
Rahman, S. K., and Sharma, B. (2023). Swelling behavior of bentonite-sand mixtures in the presence of organic pore fluids. Soil Sediment. Contam. 32, 179–193. doi:10.1080/15320383.2022.2066626
Rance, S. J., Cameron, D. M., Williams, E. R., and Gosper, C. R. (2024). Fertilisation with P, N and S requires additional Zn for healthy plantation tree growth on low fertility savanna soils. Soil Res. 62 (1), SR23128. doi:10.1071/SR23128
Reddy, P. S., Mohanty, B., and Rao, B. H. (2021). Investigations for chemical parameters effect on swelling characteristics of expansive soils. Ksce J. Civ. Eng. 25, 4088–4105. doi:10.1007/s12205-021-1532-5
Ren, J., Song, X., and Ding, D. (2020). Sustainable remediation of diesel-contaminated soil by low temperature thermal treatment: improved energy efficiency and soil reusability. Chemosphere 241, 124952. doi:10.1016/j.chemosphere.2019.124952
Saba, S., Delage, P., Lenoir, N., Cui, Y. J., Tang, A. M., and Barnichon, J. (2014). Further insight into the microstructure of compacted bentonite-sand mixture. Eng. Geol. 168, 141–148. doi:10.1016/j.enggeo.2013.11.007
Selem, A. M., Agenet, N., Gao, Y., Raeini, A. Q., Blunt, M. J., and Bijeljic, B. (2021). Pore-scale imaging and analysis of low salinity waterflooding in a heterogeneous carbonate rock at reservoir conditions. Sci. Rep. 11 (1), 15063. doi:10.1038/s41598-021-94103-w
Shaqour, F. (2024). Mineralogy and geotechnical properties of alkaline-activated kaolin with zeolitic tuff and cement kiln dust as landfill liners. Front. Mater 11, 1368618. doi:10.3389/fmats.2024.1368618
She, D., Liu, D., Peng, S., and Shao, M. A. (2013). Multiscale influences of soil properties on soil water content distribution in a watershed on the Chinese loess plateau. Soil Sci. 178, 530–539. doi:10.1097/SS.0000000000000021
Sobti, J., and Singh, S. K. (2019). A critical evaluation of the suction and swelling characteristics of sand–bentonite–coal ash mixes. Geotech. Geol. Eng. 37, 4229–4249. doi:10.1007/s10706-019-00902-4
Song, C., Yang, L., Xia, W., Ji, W., and Zhang, Y. (2021). Experimental study on relationship between free load swelling rate and water content of medium expansive soil. Adv. Civ. Eng. 2021, 1–7. doi:10.1155/2021/8871694
Souza, R. F. C., and Pejon, O. J. (2020). Pore size distribution and swelling behavior of compacted bentonite/claystone and bentonite/sand mixtures. Eng. Geol. 275, 105738. doi:10.1016/j.enggeo.2020.105738
Su, H. Y., Xiao, H. B., Li, H. Y., Tian, X. W., Luo, S. P., Yu, X. P., et al. (2022). Experimental study on microstructure evolution and fractal features of expansive soil improved by MICP method. Front. Mater 9, 842887. doi:10.3389/fmats.2022.842887
Sun, H., Masin, D., Najser, J., NedEla, V., and Navratilova, E. (2020b). Fractal characteristics of pore structure of compacted bentonite studied by esem and mip methods. Acta Geotech. 15, 1655–1671. doi:10.1007/s11440-019-00857-z
Sun, M., He, K., and Shu, S. (2020a). Numerical evaluation and management suggestions for heavy metal pollution risks in a sludge landfill: a case study from fuyong landfill, shenzhen, China. Adv. Civ. Eng. 1-8–10. doi:10.1155/2020/8854313
Sun, W., Wei, Z., Sun, D., Liu, S., Fatahi, B., and Wang, X. (2015). Evaluation of the swelling characteristics of bentonite–sand mixtures. Eng. Geol. 199, 1–11. doi:10.1016/j.enggeo.2015.10.004
Tang, C., Li, S., Wang, D., Chen, Z., Shi, B., and Inyang, H. (2019). Experimental simulation of boundary condition effects on bentonite swelling in hlw repositories. Environ. Earth Sci. 78, 135. doi:10.1007/s12665-019-8132-4
Verma, R., Icardi, M., and Prodanovic, M. (2018). Effect of wettability on two-phase quasi-static displacement: validation of two pore scale modeling approaches. J. Contam. Hydrol. 212, 115–133. doi:10.1016/j.jconhyd.2018.01.002
Vidal, N., and Volzone, C. (2012). Influence of organobentonite structure on toluene adsorption from water solution. Mater. Res. 15, 944–953. doi:10.1590/S1516-14392012005000126
Wang, B., Zhao, X., Zhou, W., Chang, B., and Xu, H. (2020). Quantitative characterization of pore connectivity and movable fluid distribution of tight sandstones: a case study of the upper triassic chang 7 member, yanchang formation in ordos basin, China. Geofluids 2020, 1–13. doi:10.1155/2020/5295490
Wang, D., Zhu, C., Tang, C., Li, S., Cheng, Q., Pan, X., et al. (2021b). Effect of sand grain size and boundary condition on the swelling behavior of bentonite–sand mixtures. Acta Geotech. 16, 2759–2773. doi:10.1007/s11440-021-01194-w
Wang, F., Li, B., Cao, S., Zhang, J., Xu, Q., and Sang, Q. (2024). Experimental study of the fluid contents and organic/inorganic hydrocarbon saturations, porosities, and permeabilities of clay-rich shale. Energies 17 (2), 524. doi:10.3390/en17020524
Wang, Y., Wang, Z., Zhao, Y., Yi, F., and Zhu, B. (2021a). Swelling properties and permeability of gmz bentonite-sand mixtures during different solutions infiltration. Sustainability-Basel 13, 1622. doi:10.3390/su13041622
Washburn, E. W. (1921). Note on a method of determining the distribution of pore sizes in a porous material. Proc. Natl. Acad. Sci. 7, 115–116. doi:10.1073/pnas.7.4.115
Wei, Y., Han, J., Wang, Y., Wang, H., Sun, Y., and Yan, B. (2020). Effects of oil pollution on water movement in soils with different textures. Water, Air, and Soil Pollut. 231, 148. doi:10.1007/s11270-020-04475-4
Xiang, G., and Ye, W. (2020). Swelling of bentonite-sand mixtures after long-term dissolution in alkaline solution. Clay Clay Min. 68, 491–498. doi:10.1007/s42860-020-00090-w
Xu, W., Ok, J. T., Xiao, F., Neeves, K. B., and Yin, X. (2014). Effect of pore geometry and interfacial tension on water-oil displacement efficiency in oil-wet microfluidic porous media analogs. Phys. Fluids 26, 9. doi:10.1063/1.4894071
Yuan, J., Wang, T. J., Chen, J., and Huang, J. A. (2023). Microscopic mechanism study of the creep properties of soil based on the energy scale method. Front. Mater 10, 1137728. doi:10.3389/fmats.2023.1137728
Zeng, Z., Cui, Y., and Talandier, J. (2022). Investigating the swelling pressure of highly compacted bentonite/sand mixtures under constant-volume conditions. Acta Geotech. 17, 2573–2580. doi:10.1007/s11440-021-01352-0
Zeng, Z., Cui, Y., and Talandier, J. (2023). Evaluation of swelling pressure of bentonite/claystone mixtures from pore size distribution. Acta Geotech. 18, 1671–1679. doi:10.1007/s11440-022-01676-5
Zeng, Z., Cui, Y., Zhang, F., Conil, N., and Talandier, J. (2019). Investigation of swelling pressure of bentonite/claystone mixture in the full range of bentonite fraction. Appl. Clay Sci. 178, 105137. doi:10.1016/j.clay.2019.105137
Zhan, L., Cao, L., Zhao, R., Ding, Z., Xie, S., and Chen, Y. (2023). Performances of the soil–bentonite cutoff wall composited with geosynthetic clay liners: large-scale model tests and numerical simulations. Sustainability-Basel 15, 1886. doi:10.3390/su15031886
Zhang, Y., Ye, C., Tang, W., Wen, L., Yu, B., Tao, W., et al. (2023). Study on the anti-corrosion and barrier ability of modified sulfoaluminate cement mortar cutoff wall against sulfate. Constr. Build. Mater 409, 134035. doi:10.1016/j.conbuildmat.2023.134035
Zhao, Y., Wang, H., Chen, X., and Fu, Y. (2023). New insights into the swelling of black soil aggregates. Geoderma 439, 116698. doi:10.1016/j.geoderma.2023.116698
Keywords: sand bentonite barrier material, expansion temporal effect, initial expansion potential, oil seal effect, permeability resistance
Citation: Chun Y-y, Liu Z, He Y, Wei H and Su D (2024) Temporal effect and evolution mechanism of sand-bentonite mixture liner swelling under the influence of sand and diesel. Front. Mater. 11:1447496. doi: 10.3389/fmats.2024.1447496
Received: 11 June 2024; Accepted: 21 June 2024;
Published: 24 July 2024.
Edited by:
Bing Bai, Beijing Jiaotong University, ChinaReviewed by:
Ming Zhang, Zhengzhou University of Aeronautics, ChinaCopyright © 2024 Chun, Liu, He, Wei and Su. This is an open-access article distributed under the terms of the Creative Commons Attribution License (CC BY). The use, distribution or reproduction in other forums is permitted, provided the original author(s) and the copyright owner(s) are credited and that the original publication in this journal is cited, in accordance with accepted academic practice. No use, distribution or reproduction is permitted which does not comply with these terms.
*Correspondence: Yong He, aGV5b25nMThAY3N1LmVkdS5jbg==
Disclaimer: All claims expressed in this article are solely those of the authors and do not necessarily represent those of their affiliated organizations, or those of the publisher, the editors and the reviewers. Any product that may be evaluated in this article or claim that may be made by its manufacturer is not guaranteed or endorsed by the publisher.
Research integrity at Frontiers
Learn more about the work of our research integrity team to safeguard the quality of each article we publish.