 Bettina Heise1*
 Ivan Zorin1
 Kristina Duswald1Verena Karl1Dominik Brouczek2Julia Eichelseder2
 Martin Schwentenwein2
- 1Research Center for Non-Destructive Testing (RECENDT) GmbH, Linz, Austria
- 2Lithoz GmbH, Vienna, Austria
Introduction: In this paper, recent developments in non-destructive testing of 3D-printed ceramics and monitoring of additive manufacturing of ceramics are presented.
Methods: In particular, we present the design and use of an inline mid-infrared optical coherence tomography (MIR-OCT) system to evaluate printed and micro-structured specimens in lithography-based ceramic manufacturing (LCM).
Results: The proposed system helps with the detection of microdefects (e.g., voids, inclusions, deformations) that are already present in green ceramic components, thereby reducing the energy and costs incurred.
Discussion: The challenges during integration are discussed. Especially, the prospects for MIR-OCT imaging combined with machine learning are illustrated with regard to inline inspection during LCM of printed ceramics.
1 Introduction
Additive ceramic manufacturing (ACM) has witnessed considerable progress in recent years as it allows microfabrication of systems with complex morphologies (Abdelkader et al., 2024; Nohut et al., 2023). Another reason for the popularity of ACM is that ceramics represent a broad category of materials with specific sets of unique properties, including greater bending and tensile strengths, high densities, good electrical insulation, as well as enhanced resistances to corrosion, chemicals, and temperature (Kollenberg, 2018; Senthooran et al., 2024). These diverse material characteristics along with high-precision manufacturing capabilities have spurred significant interest in three-dimensional ACM technology for various applications (Chen et al., 2019; He et al., 2021). ACM systems have been widely commercialized and adopted in biomedicine (implant printing and bone tissue engineering) (Buj-Corral and Tejo-Otero, 2022; Ly et al., 2022), electronics, automotive and aerospace industries, and developing optical components for terahertz technology (Jang et al., 2023). Although ACM is a mature technology, misprints or defects still occur owing to several factors, such as inconsistencies in the material properties, fluctuations in the processing conditions, and limitations in the current manufacturing techniques. Therefore, ACM techniques necessitate control monitoring to enhance the dimensional accuracy and minimize the risk of defects, such as cracks, contamination, delamination, surface and subsurface inhomogeneities, surface quality issues, and shrinkage.
Various quality control and inspection methods have been employed to study ceramic materials and optimize the ACM process. The main approaches include scanning electron microscopy (SEM), X-ray imaging (microcomputed tomography), and optical microscopy (Sun et al., 2008). SEM provides ultrahigh resolutions for assessing the surface quality, roughness, and average pore size but is limited to surface examination applications. X-ray tomography provides high-resolution volumetric images but requires lengthy processing times and is limited to small samples owing to the size of the imaging chamber and ionizing nature of X-rays. SEM and radiography are expensive and technically complex methods, which make them unsuitable for inline inspections. Although optical microscopy is simple and cost-effective, its applications are limited to surface analyses with low spatial resolutions and depths of field. Conventional porosity analysis methods, such as the Archimedean method, provide the average porosity without spatial localization (Wits et al., 2016).
Non-destructive testing (NDT) techniques, which mainly involve optical and acoustical imaging and sensing methods (Ramírez et al., 2023), are advantageous as they cause no damages or alterations to the specimens. Among them, optical coherence tomography (OCT) enables volumetric imaging of subsurface structures in a non-destructive manner (Heise et al., 2020; Heise et al., 2019). The performances of state-of-the-art OCT systems (Kopycinska-Müller et al., 2023) in the near-infrared and visible ranges often suffer from light scattering (Su et al., 2014). Mid-infrared OCT (MIR-OCT) has thus emerged as a promising tool for at-line and inline volumetric imaging, inspection, materials research, and quality assurance in 3D ceramic printing; it needs no special sample preparations and has been demonstrated (Israelsen et al., 2019; Zorin et al., 2018) and experimentally validated for at-line monitoring (Zorin et al., 2022; Zorin et al., 2020) in additive manufacturing (AM), with feasibility to be used under field conditions as there are no specific requirements beyond laser safety precautions.
Nowadays, another essential technology in various applications is artificial intelligence (AI), which has been suggested in ACM for classification between accurately 3D-printed and ceramics specimens with failures at the micron scale. Specifically, deep learning (DL) methods involving convolutional neural networks (CNNs) or residual neural networks (so-called ResNets) that have enabled easy training and model generation for (OCT) image data are chosen. Similar approaches have already been demonstrated for medical OCT use cases in the past (del Amor et al., 2020; Lee et al., 2016).
The present work highlights the potential of MIR-OCT coupled with AI-based identification methods for inline process monitoring and quality control in ACM machinery. The form factor of the system was modified to integrate the OCT measurement head in a 3D ceramic printer, which offered several advantages. The inline inspection enables direct layer growth monitoring, geometry verification (e.g., thickness and CAD compliance), and real-time defect development monitoring, providing immediate user alerts when misprints are produced. Such monitoring enhances production efficiency by promptly detecting potential defects, reducing the time and cost commitments, and minimizing resource consumption.
2 Methods
2.1 Lithography-based ceramic manufacturing (LCM) printing
The LCM process is a 3D printing technology belonging to the family of vat photopolymerization techniques. In this process, a photocurable ceramic suspension based on a ceramic powder dispersed in a light-sensitive matrix comprising methacrylate and acrylate monomers is selectively exposed to light to trigger photopolymerization in the illuminated areas (Stampfl et al., 2023). The schematic setups of the 3D printer and printing machinery are shown in Figures 1A, B. Upon selective exposure to light, the ceramic suspension hardens in the exposed areas; by repeating this process sequentially, the so-called green part (a composite of ceramic particles dispersed in a polymer matrix) is formed layerwise (Schwentenwein and Homa, 2015).
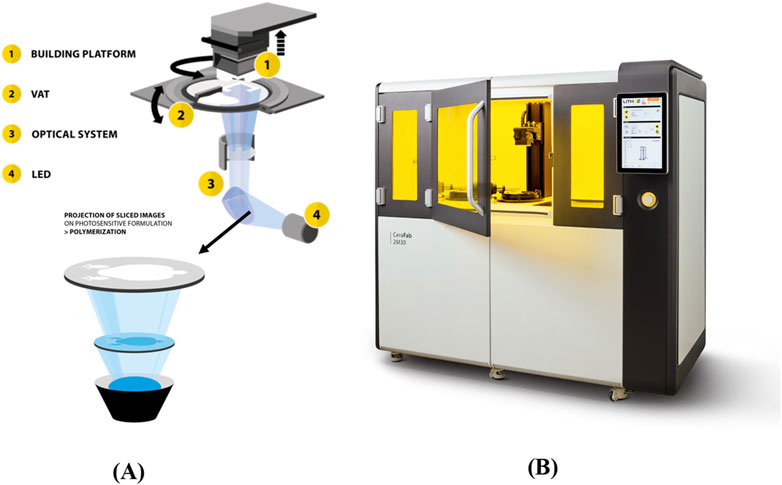
Figure 1. (A) Schematic setup of the 3D printer with a structured illumination unit by applying a digital micromirror device for patterning; (B) 3D printer for lithography-based ceramic manufacturing (LCM) CeraFab 2M30.
At-line or inline inspections assist with monitoring the quality and integrity of the green part and optimizing the process conditions. Flaws occurring during manufacturing can be detected, and the affected parts can be eliminated. This is especially important because the material and green parts can be recycled easily after the 3D printing step. In addition, the subsequent thermal process can be avoided for components that are found to have defects after the printing process, thereby conserving energy and time.
2.2 MIR-OCT
OCT is a type of short coherence interferometric technique that typically involves spectrally broadband but spatially coherent light sources. OCT enables non-destructive and non-invasive imaging for extraction of subsurface microstructural information. As OCT entails raster scanning and interferometry, it is sensitive to the strength and runtime of the light reflected back. Nowadays, OCT is mostly realized in the Fourier domain configuration, as schematically shown in Figure 2A. This method relies on measuring the spectral interference signal between the back-reflected/back-scattered sample and reference wave. After Fourier transformation of the spectral interference signal, the depth-resolved reflectivity profile from within the sample is obtained. Therefore, OCT facilitates non-destructive monitoring of the subsurface and embedded micron-scale structural defects within the (semitransparent) specimen.
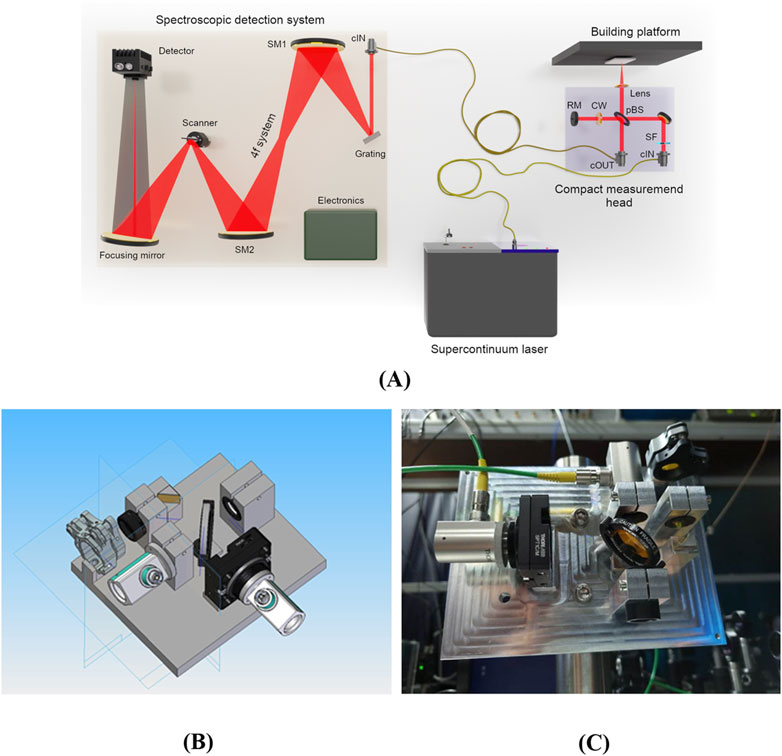
Figure 2. (A) Schematic of the mid-infrared optical coherence tomography (MIR-OCT) system; (B) schematic 3D design of the optical interferometric head; (C) assembled optical head containing the interferometer unit, fiber connectors, and ports as optical core elements.
The Fourier-domain MIR-OCT system established for inline measurement of 3D-printed ceramics comprises three core units:
(1) a compact interferometric optical measurement head downsized to 16.5 cm × 12.5 cm × 6 cm and assembled in the arrangement shown in Figures 2B, C;
(2) a dispersive, single-pixel scanning spectrometer to record the spectral interference signal; and
(3) a mid-infrared (MIR) supercontinuum broadband light source that is spatially coherent, emits instantaneous broadband pulses, and has a spectral window (limited for OCT measurements) from 3.15 μm to 4.2 μm.
The MIR-OCT system applies time-encoded sampling, i.e., scanning of the spectral interferograms in wavelength and wavenumber, to gather the structural information after Fourier transformation. More details on this approach can be found in Zorin et al. (2022).
The measurement head was optimized for integration with a two-component 3D printer for inline monitoring, which enabled layer growth tracking, geometry verification, roughness and porosity measurements, and real-time defect detection. The detection unit included advanced electronics (such as boxcar demodulator, digitizer, and function generator) for precise control and data acquisition; it was connected to a personal computer via ethernet for user interface management.
The MIR-OCT system demonstrated a high sensitivity of around 80.2 dB and good resolution (axial resolution of 8–16 μm depending on the chosen spectral window and lateral resolution of 40 μm), which were suitable for imaging and distinguishing the fine structural details in ceramic samples.
2.3 Integrating MIR-OCT into the LCM machinery
The optical sensing head was fixed on a scanning stage and integrated with the LCM machinery. Here, the optical sensing head can move into the printing field using the rotating mechanical arm of the LCM machine and is positioned under the sample, as shown in Figure 3. Structural imaging is then performed either after completion of the printing process or on a software-defined print layer. Fiber-optic connections enable broadband illumination by the MIR supercontinuum source and spectral interferometric detection at an external spectrometer unit.
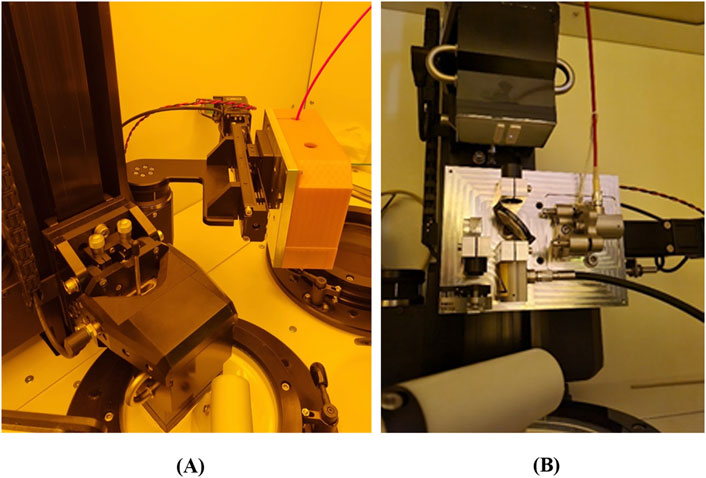
Figure 3. Optical head integrated with the LCM printer: (A) OCT unit in the idle state, i.e., when the 3D printing process is active; (B) OCT unit in the active state, i.e., when moved to the measuring position at the printing field. The plastic housing of the optical unit is removed in (B) for illustration.
Figure 3A shows an LCM printing machine with the MIR-OCT system located at the printing position (when the printing process is active, the OCT is in idle mode). Figure 3B shows the OCT unit in the active sensing mode, where the printing process is paused and OCT measurements are performed. The emission power and repetition range of the supercontinuum source are selected according to the optimal parameters (250 kHz and 6,000 mA diode current), yielding an output MIR average power of around 230 mW.
2.4 Data analysis
For automated data analysis, a machine learning or DL strategy was applied. In particular, a pretrained ResNet18 model was implemented to analyze the OCT images for classification under correct and defective labels. A dataset containing at least 400 images per defect class and reference parts without faults was manually labeled and used for subsequent training and modeling. Data augmentation was used to increase the size of the dataset.
3 Results
3.1 Inspection and monitoring
3.1.1 At-line inspection of LCM-printed ceramics for micron-scale defects
At-line inspection is beneficial for reducing the number of defective ceramic parts that are sintered after printing and potentially supplied to customers. The contrast and visibility of the microdefects in the green ceramic parts achieved with MIR-OCT imaging are relatively high, especially compared to those of the sintered samples. This is attributed to the lower difference in refractive index between the ceramics and polymer matrix filling the pores than that for the sintered state with air in the porous ceramic material. Hence, stronger scattering is observed in the latter case, which could hide the potentially buried microdefects in the interior of the material. Different specimens with defined printing faults were tested using the at-line MIR-OCT system, as reported by us recently (Zorin et al., 2022).
3.1.2 Inline monitoring during LCM printing
Before integrating the inline system, the MIR-OCT was calibrated to determine the optimal head positioning (i.e., z-offset that was obtained with the printer’s Z-scan stage). Moreover, the sensitivity roll-off was evaluated. For the calibration and initial evaluation, simple scanning profiles of the platform were obtained, as shown in Figure 4. In addition, various U-shaped and step-slope preliminary measurements were realized to determine the optimal step scan and timings. The OCT signal was almost comparable to that obtained previously with the at-line MIR-OCT system (i.e., the DC and AC components do not differ significantly), with the sensitivity being about 80 dB.
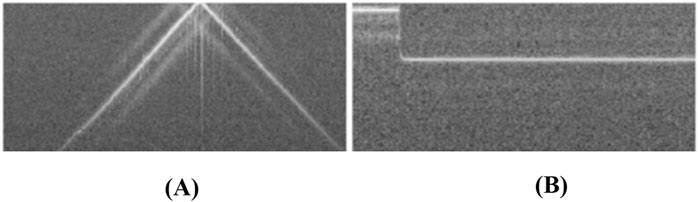
Figure 4. Characterization of the inline MIR-OCT system: (A) sensitivity roll-off determined at a tilted surface over a depth range of 3 mm (optimal position at zero frequency was chosen), where the OCT image of the surface appears reflected since the zero-delay plane has been crossed; (B) B-scan of a step profile with a vertical step size of 0.4 mm and lateral scanning range of about 10 mm.
The MIR-OCT system was extensively tested for inline monitoring of the LCM process, where characteristic microstructured green parts were designed and printed. Typical B-scans of such green parts with internal microchannels were imaged during the inline process, as depicted in Figure 5. It should be noted that small machine vibrations during the automated printing process can pose challenges for inline inspection and may require additional technical measures for compensation.
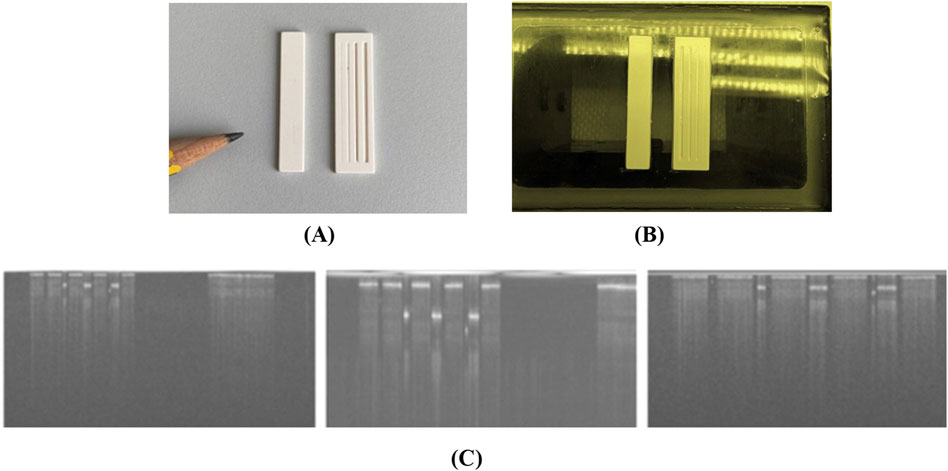
Figure 5. Photographs of (A) ceramic 3D-printed samples, (B) samples arranged on the building platform of the LCM machine, and (C) typical B-scans of the microstructured ceramic green parts with different structure sizes of the embedded stripes, recorded in the inline mode of the MIR-OCT system integrated with the LCM printer. The lateral scanning range was about 42 mm.
3.2 Learning and classification
3.2.1 Characterizing defect classes of LCM-printed samples
The automated analysis and validation of recorded image data from specimens is of great importance for process monitoring. By applying DL concepts, typical defects in printed ceramics specimens, such as large pores/air bubbles, contamination, and cracks (Harrer et al., 2017), were defined and labeled for both green parts and sintered components. The labeling of the training data was performed by an expert on ceramics. Two sets of defective ceramic samples, as illustrated in Figure 6, were chosen.
• Set 1 contained the following classes: correct parts (“ok” as references), contaminations, cracks, and layer defects recorded from real samples directly during the LCM/AM inline process.
• Set 2 contained the following classes: correct parts (“ok” as references), air bubble inclusions, (dirt/paper) contaminations, and slits/holes recorded from artificial samples with deliberately inserted defects to enable better ground truth data.
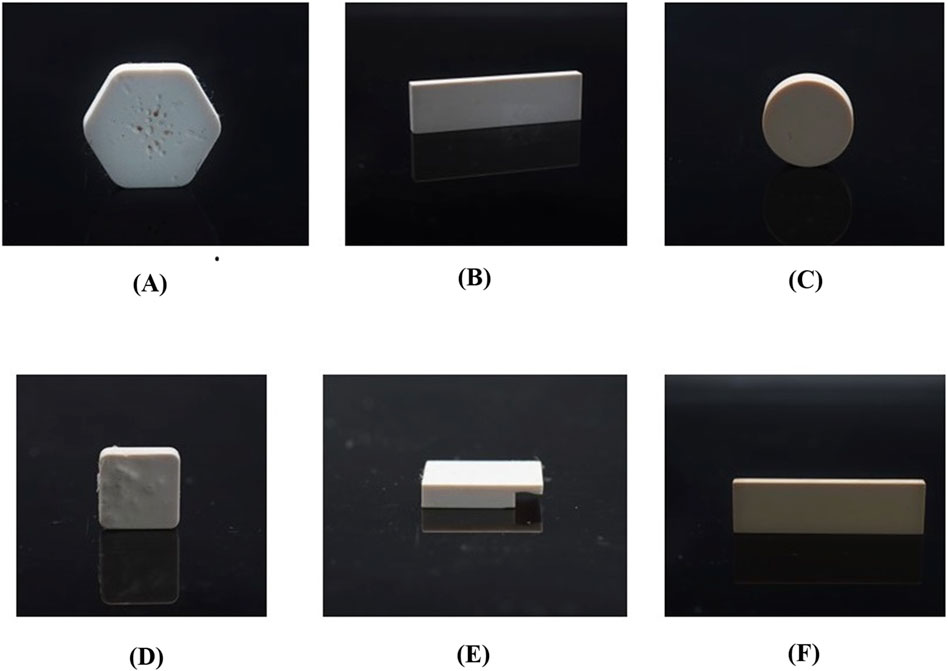
Figure 6. Illustrations of different classes of defects in 3D-printed ceramic samples: (A–C) pores (air bubbles), (D) contamination, (E) overhang, and (F) reference sample without defects.
These defects expressed in the MIR-OCT B-scans are shown in Figure 7. It is emphasized that these cross-sectional MIR-OCT images of printed ceramics showing internal inclusions and layers at depths of tens of micrometers were recorded in a non-destructive manner from above the surface. The delineation between the defect classes in the 3D OCT scans are occasionally hampered since combinations of defects may sometimes occur within the imaging volume. In such cases, the most pronounced defect class is defined as the input for the learning method.
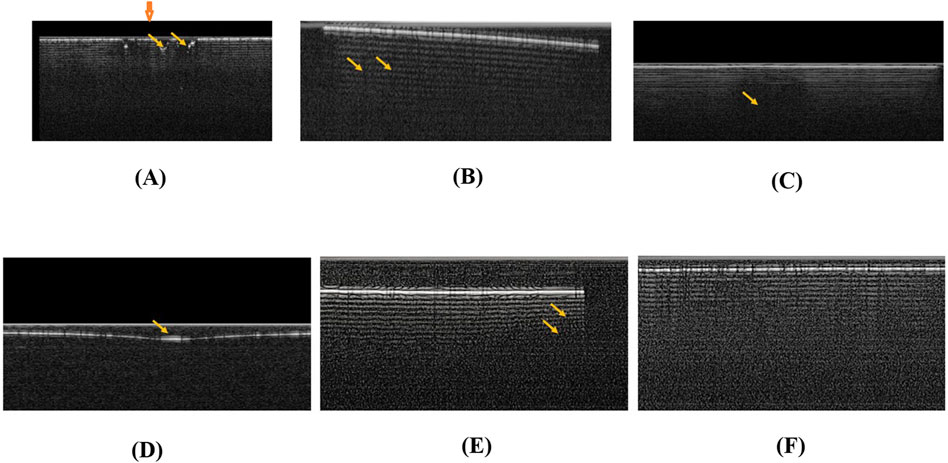
Figure 7. OCT images (B-scans) recorded for the 3D-printed ceramic samples corresponding to Figure 6: (A–C) pores (air bubbles), (D) contamination, (E) overhang, and (F) reference sample without defects. The yellow arrows indicate the printing defects expressed in the OCT images; the thicker orange arrow in (A) indicates the sensing/imaging direction.
3.2.2 Image database
The image database was generated using the accumulated and labeled MIR-OCT image datasets gathered for various LCM-printed ceramic parts. OCT images were recorded for various materials; however, the printed materials are currently composed of mainly alumina and zirconia. Since the image data on defective parts are less than the those on correct parts, imbalanced behaviors are introduced (Dablain and Chawla, 2023; He and Garcia, 2009), for which the available data are increased by augmentation; this includes translation, rotation, tilting, and mirroring of the OCT volume sets, as schematically illustrated in Figure 8. In total, after augmentation, Set 1 included training data of 1,959 samples (for four classes) and 1,348 samples (for three classes after excluding layer defects), while Set 2 comprised training data of 336 samples.
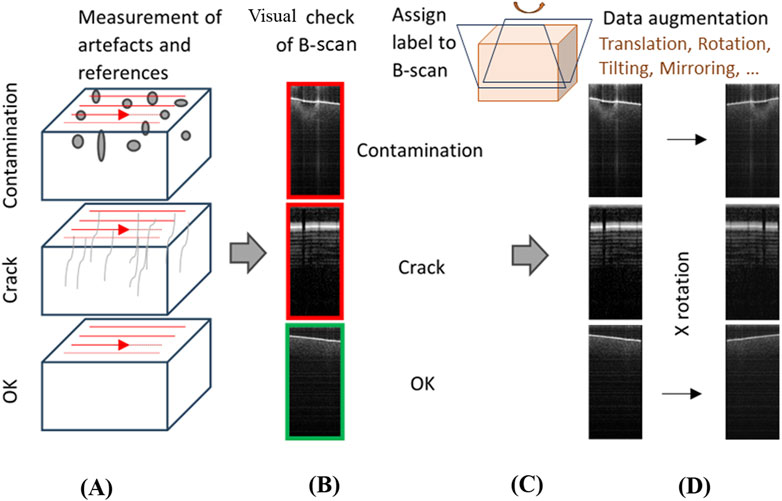
Figure 8. Illustration of data augmentation: (A) scheme of the 3D OCT image sets (with contaminations, cracks, and no defects); (B) B-scans (2D) extracted from OCT volume sets (normal to the scanning direction); (C) B-scans extracted in various directions from the OCT volume sets; (D) augmented OCT B-scans assigned to the corresponding defect groups.
3.2.3 Machine learning/DL framework
The established DL-based framework using the ResNet18 structure enables transfer learning. Therefore, the ResNet model is advantageous for including additional new or modified defect classes with only moderate effort for retraining or completely deriving new models. The DL-based framework used herein that consists of dataset training, network model generation, and classification is schematically illustrated in Figure 9.
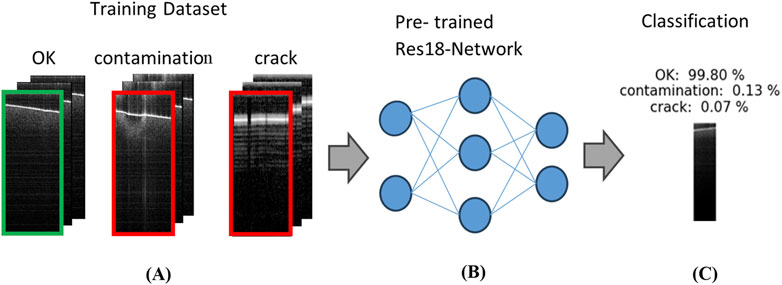
Figure 9. Illustration of training of the neural network: (A) OCT volume scans recorded for green part ceramics with various defects and reference without defects and labeled B-scans applied as (B) inputs to train the ResNet18 structure; (C) classification (with estimated probability for each class).
3.2.4 Feedback unit on quality information
After generating the model, the derived classifications and percentages of defective parts based on the classified defects were considered as the basis for feedback. By introducing a threshold for the defect numbers in the dataset, feedback information was provided to the user. The operator receives a “green signal” label if the image dataset is alright or a “red signal” label if the defect probability is high for the investigated 3D-printed component, as schematically illustrated in Figure 10.
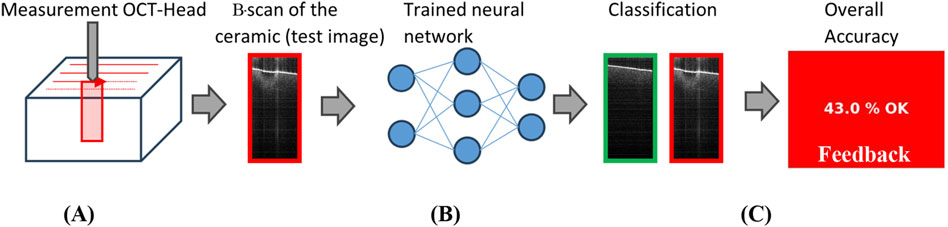
Figure 10. Illustration of the feedback procedure: (A) the ceramic component is imaged inline during printing and recorded as a short B-scan (i.e., image patch of width 100 pixels); (B) B-scan analysis where the measured data are classified by a trained neural network and repeated for all sequential B-scan batches; (C) predicted classifications are stored for calculating the overall accuracy. The final accuracy computed per measurement run or sample is provided as feedback to the operator.
3.2.5 Optimizing AI tools for increasing LCM process reliability
The DL-based classification and feedback tool was finally optimized to obtain a higher classification accuracy. Here, the learning rate that affects how strongly the weights of the model are adapted to the loss gradient during training was optimized. Next, a learning rate scheduler was additionally implemented to reduce the step size during advanced learning to obtain the minimum value as accurately as possible. Two parameters were thus chosen, namely, step size of the gradient descent and frequency of step size reduction. Weight decay was applied as a regularization mechanism. The best performance of the neural network was achieved when the last two layers, namely, layers 3 and 4, were retrained based on these modifications. The metrics of prediction performance, such as precision, recall, and F1 score, from both sets of samples containing four classes each are summarized in Table 1 and Figures 11A, B.
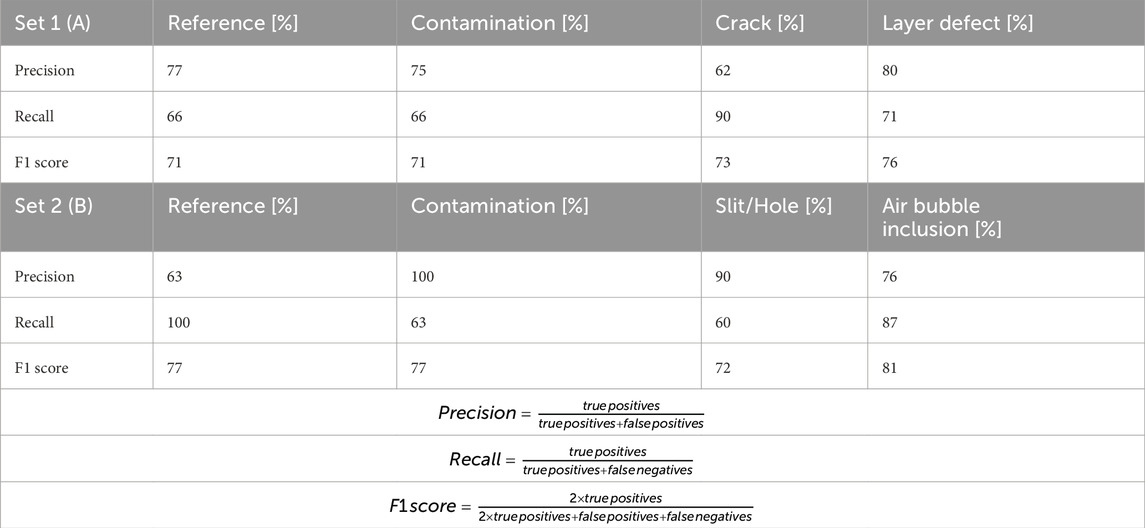
Table 1. Prediction performance metrics (for four classes) when using ResNet18.
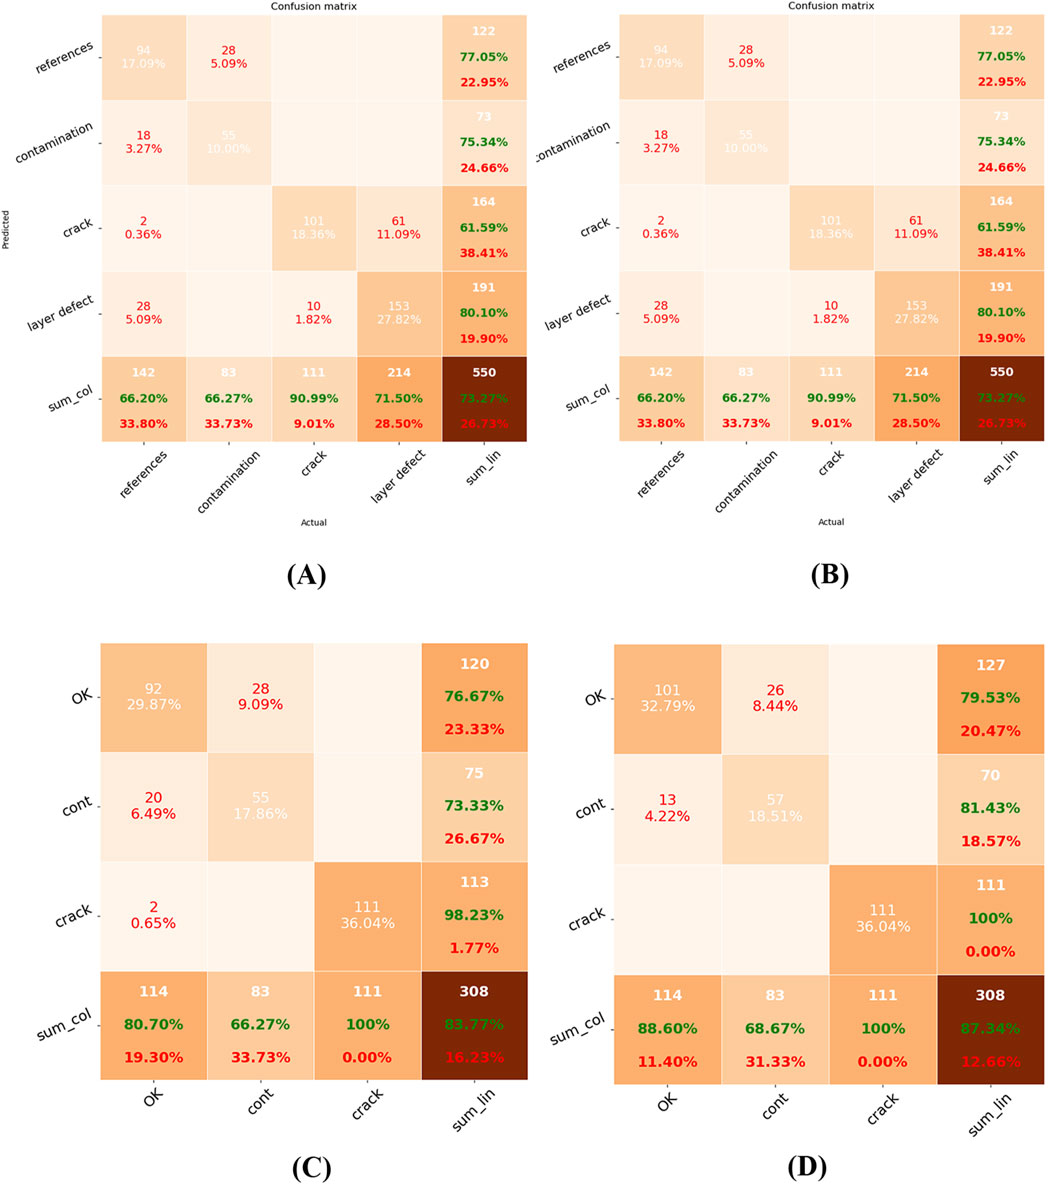
Figure 11. Confusion matrices of the prediction results using the ResNet18 model (A) for dataset 1 with the four-class classification task and (B) for dataset 2 with the three-class classification task; (C) before and (D) after finetuning the ResNet structure by additionally unfreezing the third layer and adjusting the regularization mechanism (weight decay). The diagonal elements represent correct predictions, while the off-diagonal elements indicate the misclassifications. The values in green indicate the percentage of samples recognized correctly, and the values in red indicate the percentage of incorrectly recognized samples; the values shown in white (bottom row) are the respective real numbers of samples per class.
Since the layer defects were not strongly observed and showed highly variable manifestations, the classification was repeated by omitting this type of defect. The confusion matrix for the three-class classification task is shown in Figure 11C. Testing was conducted by varying the batch size and number of epochs to optimize the results, as shown in terms of the confusion matrix in Figure 11D before and after finetuning the ResNet structure. Through this optimization step, the accuracy of classification for the three-class task improved from 83.8% to 87.3%.
4 Summary and conclusions
We demonstrate an MIR-OCT system combined with DL for classification and in-process feedback as a versatile tool for at-line and inline quality control in ACM. In at-line monitoring, the green and sintered ceramics parts can be evaluated directly at the printing facility; the at-line system is shown to provide valuable and functional morphological data on the defects. In contrast, the inline monitoring system was more challenging to implement under the harsh printing conditions but allowed monitoring of the LCM printing process directly with the potential to access polymerization defects and misprints. The inline solution demonstrated here for the first time is characterized by reduced imaging depth than that for the at-line system owing to the presence of the absorbing liquid-phase slurry on the samples and system vibrations. However, since the layers were printed sequentially, this was compensated by aggregating the resulting images of the most recently printed layers at the highest visibility. We expect that additional engineering solutions may be needed to stabilize the inline system, such as maintaining cleanliness of the optical window and mechanical adaptation between the print and optical sensing cycles.
Beyond the MIR-OCT-based solution, we demonstrate an intelligent concept for classifying defective AM parts (and multiple types of defects) from flawless parts using OCT imaging and AI methods. Here, the implementation and training using ResNet-based DL was proven to be a flexible and customizable tool for classifying defects in the inspected and monitored ceramic samples (green parts). A feedback approach for informing the LCM printer operator of the accuracy is also presented briefly.
Given the rapid developments in MIR-based photonics and fiber optic solutions, further miniaturization of the interferometric sensor unit with progressively increasing speeds is expected to be easy to achieve as the next step. This is expected to boost the performance of the inline MIR-OCT system via integration with a 3D printer. Furthermore, extending the spectral range beyond 5 µm or working with lower power levels will help advance the combined MIR-OCT and LCM printer system.
Data availability statement
The raw data supporting the conclusions of this article will be made available by the authors without undue reservation.
Author contributions
BH: Writing–review and editing, Writing–original draft, Supervision, Project administration, Methodology, Funding acquisition, Conceptualization. IZ: Writing–review and editing, Writing–original draft, Methodology, Investigation, Conceptualization. KD: Writing–original draft, Software, Formal analysis, Data curation. VK: Writing–review and editing, Visualization, Data curation. DB: Writing–review and editing, Validation, Methodology, Investigation. JE: Writing–review and editing, Investigation. MS: Writing–original draft, Methodology, Funding acquisition, Conceptualization.
Funding
The authors declare that financial support was received for the research, authorship, and/or publication of this article. This work was supported by the Austrian research funding association (FFG) within the research project “DIQACAM” (FFG project no. 877481). This project was also cofinanced through the “HyperMAT” project by the federal government of Upper Austria and European Regional Development Fund (EFRE) in the framework of the EU-program IBW/EFRE and JTF 2021-2027.
Acknowledgments
The authors acknowledge the assistance provided by Günther Hannesschläger for the CAD design of the inline MIR-OCT optical sensing head and for general engineering support, Michael Schmid for support with calibrating the inline MIR-OCT measurements for the 3D printing process, and Lukas Eminger for support with integrating the inline MIR-OCT optical sensing head and the 3D printer.
Conflict of interest
The authors declare that the research was conducted in the absence of any commercial or financial relationships that could be construed as a potential conflict of interest.
Publisher’s note
All claims expressed in this article are solely those of the authors and do not necessarily represent those of their affiliated organizations or those of the publisher, editors, and reviewers. Any product that may be evaluated in this article or claim that may be made by its manufacturer is not guaranteed or endorsed by the publisher.
References
Abdelkader, M., Petrik, S., Nestler, D., and Fijalkowski, M. (2024). Ceramics 3D printing: a comprehensive overview and applications, with brief insights into industry and market. Ceramics 7 (1), 68–85. doi:10.3390/ceramics7010006
Buj-Corral, I., and Tejo-Otero, A. (2022). 3D printing of bioinert oxide ceramics for medical applications. J. Funct. Biomater. 13 (3), 155. doi:10.3390/jfb13030155
Chen, Z., Li, Z., Li, J., Liu, C., Lao, C., Fu, Y., et al. (2019). 3D printing of ceramics: a review. J. Eur. Ceram. Soc. 39 (4), 661–687. doi:10.1016/j.jeurceramsoc.2018.11.013
Dablain, D., and Chawla, N. (2023). Towards understanding how data augmentation works with imbalanced data Available at: https://api.semanticscholar.org/CorpusID:258079391.
del Amor, R., Morales, S., Colomer, A., Mogensen, M., Jensen, M., Israelsen, N. M., et al. (2020). Automatic segmentation of epidermis and hair follicles in optical coherence tomography images of normal skin by convolutional neural networks. Front. Med. 7, 220. doi:10.3389/fmed.2020.00220
Harrer, W., Schwentenwein, M., Lube, T., and Danzer, R. (2017). Fractography of zirconia-specimens made using additive manufacturing (LCM) technology. J. Eur. Ceram. Soc. C 37 (14), 4331–4338. doi:10.1016/j.jeurceramsoc.2017.03.018
He, H., and Garcia, E. A. (2009). Learning from imbalanced data. IEEE Trans. Knowl. Data Eng. 21 (9), 1263–1284. doi:10.1109/TKDE.2008.239
He, R., Zhou, N., Zhang, K., Zhang, X., Zhang, L., Wang, W., et al. (2021). Progress and challenges towards additive manufacturing of SiC ceramic. J. Adv. Ceram. 10 (Issue 4), 637–674. doi:10.1007/s40145-021-0484-z
Heise, B., Hannesschlaeger, G., Leiss-Holzinger, E., Peham, L., and Zorin, I. (2020). “Optical coherence tomography in nondestructive testing,”. Optics and photonics for advanced dimensional metrology. Editors P. J. de Groot, R. K. Leach, and P. Picart), 11352, 37. doi:10.1117/12.2556832
Heise, B., Zorin, I., Hanneschläger, G., and Su, R. (2019). Optical coherence tomography imaging through the scales. Available at: https://nottingham-repository.worktribe.com/output/2215850/optical-coherence-tomography-imaging-through-the-scales.
Israelsen, N. M., Petersen, C. R., Barh, A., Jain, D., Jensen, M., Hannesschläger, G., et al. (2019). Real-time high-resolution mid-infrared optical coherence tomography. Light Sci. and Appl. 8 (1), 11. doi:10.1038/s41377-019-0122-5
Jang, D., Ryu, H., Maeng, I., Lee, S., Seo, M., Oh, S. J., et al. (2023). All-dielectric terahertz metalens using 3D-printing. Opt. Lasers Eng. 171, 107834. doi:10.1016/j.optlaseng.2023.107834
Kollenberg, W. (2017). Technische keramik. 3rd ed. Vulkan-verlag Gmbh ISBN: 9783802730818. https://www.lehmanns.de/shop/technik/70492816-9783802730818-technische-keramik.
Kopycinska-Müller, M., Schreiber, L., Schwarzer-Fischer, E., Günther, A., Phillips, C., Moritz, T., et al. (2023). Signal-decay based approach for visualization of buried defects in 3-D printed ceramic components imaged with help of optical coherence tomography. Materials 16 (10), 3607. doi:10.3390/ma16103607
Lee, C. S., Baughman, D. M., and Lee, A. Y. (2016). Deep learning is effective for the classification of OCT images of normal versus Age-related Macular Degeneration. BioRxiv, 094276. doi:10.1101/094276
Ly, M., Spinelli, S., Hays, S., and Zhu, D. (2022). 3D printing of ceramic biomaterials. Eng. Regen. 3 (1), 41–52. doi:10.1016/j.engreg.2022.01.006
Nohut, S., Schlacher, J., Kraleva, I., Schwentenwein, M., and Bermejo, R. (2023). 3D-printed alumina-based ceramics with spatially resolved porosity. Int. J. Appl. Ceram. Technol. 21, 89–104. doi:10.1111/ijac.14512
Ramírez, I. S., Márquez, F. P. G., and Papaelias, M. (2023). Review on additive manufacturing and non-destructive testing. J. Manuf. Syst. 66, 260–286. doi:10.1016/j.jmsy.2022.12.005
Schwentenwein, M., and Homa, J. (2015). Additive manufacturing of dense alumina ceramics. Int. J. Appl. Ceram. 12 (1), 1–7. doi:10.1111/ijac.12319
Senthooran, V., Weng, Z., and Wu, L. (2024). Enhancing mechanical and thermal properties of 3D-printed samples using mica-epoxy acrylate resin composites—via digital light processing (DLP). Polymers 16 (8), 1148. doi:10.3390/polym16081148
Stampfl, J., Schwentenwein, M., Homa, J., and Prinz, F. B. (2023). Lithography-based additive manufacturing of ceramics: materials, applications and perspectives. MRS Commun. 13, 786–794. doi:10.1557/s43579-023-00444-0
Su, R., Kirillin, M., Chang, E. W., Sergeeva, E., Yun, S. H., and Mattsson, L. (2014). Perspectives of mid-infrared optical coherence tomography for inspection and micrometrology of industrial ceramics. Opt. Express 22 (13), 15804. doi:10.1364/OE.22.015804
Sun, J. G., Liu, Z. P., Pei, Z. J., Phillips, N. S. L., and Jensen, J. A. (2008). Optical methods for nondestructive evaluation of subsurface flaws in silicon nitride ceramics. Corros. Wear, Fatigue, Reliab. Ceram. Ceram. Eng. Sci. Proc. 29, 181–188. doi:10.1002/9780470456347.ch18
Wits, W. W., Carmignato, S., Zanini, F., and Vaneker, T. H. J. (2016). Porosity testing methods for the quality assessment of selective laser melted parts. CIRP Ann. 65 (1), 201–204. doi:10.1016/j.cirp.2016.04.054
Zorin, I., Brouczek, D., Geier, S., Nohut, S., Eichelseder, J., Huss, G., et al. (2022). Mid-infrared optical coherence tomography as a method for inspection and quality assurance in ceramics additive manufacturing. Open Ceram. 12 (October), 100311. doi:10.1016/j.oceram.2022.100311
Zorin, I., Gattinger, P., Brandstetter, M., and Heise, B. (2020). Dual-band infrared optical coherence tomography using a single supercontinuum source. Opt. Express 28 (6), 7858. doi:10.1364/OE.386398
Keywords: non-destructive testing, additive ceramic manufacturing, inline monitoring, mid-infrared optical coherence tomography (MIR-OCT), learning and feedback
Citation: Heise B, Zorin I, Duswald K, Karl V, Brouczek D, Eichelseder J and Schwentenwein M (2024) Mid-infrared optical coherence tomography and machine learning for inspection of 3D-printed ceramics at the micron scale. Front. Mater. 11:1441812. doi: 10.3389/fmats.2024.1441812
Received: 31 May 2024; Accepted: 22 August 2024;
Published: 18 September 2024.
Edited by:
Chunze Yan, Huazhong University of Science and Technology, ChinaReviewed by:
Xuan Song, The University of Iowa, United StatesMatthew Maschmann, University of Missouri, United States
Copyright © 2024 Heise, Zorin, Duswald, Karl, Brouczek, Eichelseder and Schwentenwein. This is an open-access article distributed under the terms of the Creative Commons Attribution License (CC BY). The use, distribution or reproduction in other forums is permitted, provided the original author(s) and the copyright owner(s) are credited and that the original publication in this journal is cited, in accordance with accepted academic practice. No use, distribution or reproduction is permitted which does not comply with these terms.
*Correspondence: Bettina Heise, QmV0dGluYS5IZWlzZUByZWNlbmR0LmF0