- 1Department of Civil and Environmental Engineering, Universiti Teknologi PETRONAS (UTP), Perak, Malaysia
- 2Division of Operation and Maintenance, Department of Civil, Environmental and Natural Resources Engineering, Luleå University of Technology, Luleå, Sweden
- 3Department of Civil Engineering, College of Engineering, Taif University, Taif City, Saudi Arabia
- 4Structural and Fire Engineering, Department of Civil, Environmental and Natural Resources Engineering, Luleå University of Technology, Luleå, Sweden
- 5Department of Civil Engineering, College of Engineering, Prince Sattam bin Abdulaziz University, Alkharj, Saudi Arabia
There has been a significant surge in the yearly use of plastics, leading to a notable rise in plastic waste generation. Consequently, the recycling of plastic garbage has emerged as a prominent concern around the world. This research explores the feasibility of using polyethylene furanoate (PEF) plastic waste as a substitute for coarse aggregate (CA) in concrete. Graphene nano-platelets (GNPs) were added to the concrete mix in different quantities to improve its structural reliability. The research study used an experimental research design in conducting its investigation. PEF waste plastic was added in concrete in varying proportions of 0%, 5%, 15%, 20%, and 25% as a supplementary material to gravel, and GNPs were added in different percentages of 0%, 0.03%, 0.05%, 0.08%, and 0.1% by weight of cement. Mechanical tests were conducted, which includes compressive strength (CS), split tensile strength (STS), flexural strength (FS), modulus of elasticity (MoE), and ultrasonic pulse velocity (UPV), and the environmental assessment of concrete was done by assessing carbon in concrete and concrete’s eco efficiency (ESE). It was found that 5% addition of PEF as the substitute to CA and 0.1% of GNPs gives the optimum strength, enhancing CS, STS, and FS by 9.10%, 18.18%, and 4.45%, respectively. Response surface technique (RSM) models were created to provide mathematical equations for predicting the predicted outcomes. All models were optimized using a multi-objective optimization approach and then validated.
1 Introduction
Concrete is made up of several different elements, the most important of which are fine sand and coarse aggregate (CA). The production of concrete is an activity that takes place on a significant scale all over the world (Kiani Mavi et al., 2021). It is estimated that the yearly consumption of concrete has reached up to 11 billion metric tons, which has positioned concrete as the most used construction material on a global scale (Sharma et al., 2021). Because of the widespread use of concrete, the number of aggregate resources that are now available is steadily decreasing (Gagg, 2014). Due to that, it is crucial that other options are explored and taken into account regularly. Assessing local resources is a vital topic in civil engineering. The investigation of such substances is significant because they have the ability to be excellent substitutes for conventional materials. Preserving the viability of the construction industry is extremely important. Therefore, it is necessary to explore and investigate the new novel materials, and the additional substitute materials should be investigated to replace the aggregates (Ismail et al., 2013). It has been recently calculated that over 400 million cubic meters of plastic trash are generated globally each year (Paper, 2020). Investigations have been carried out on how to utilize this plastic wastage in concrete as a substitute material for coarse gravel and fine aggregate. This purpose of this current study is to find out the method and proportion to utilize the waste plastic to enhance the characteristics of concrete in a way that would be environmentally friendly (Sau et al., 2023).
In recent times, investigations have been conducted on the use of various types of plastics in concrete to replace natural resources as CA, such as the use of polyethylene terephthalate (PET) and polypropylene (PP) in concrete (Almeshal et al., 2020), (Islam, 2022). Utilization of PET plastic from waste in concrete is a step taken for environmental friendly construction (Almohana et al., 2022). Moreover, using these types of waste material can help in the reduction of using natural resources in concrete while improving the strength of concrete as well (Sau et al., 2023). In recent times, a study was conducted in which PET plastic waste material was used as a sand replacement material to study its effects on concrete (Saxena et al., 2018). In a research study carried out by Hu et al. (2021), 20% of fine aggregate was replaced with PET waste plastic particles. Increasing the degree of fine sand replacement improved the impact resilience of concrete. Another study conducted by Abu-Saleem et al. (2021) investigated the various types of plastic to be used as coarse gravel in concrete as a replacement material. It was found that utilization of plastic as a replacement material instead of gravel increases the resistance of concrete to sudden impacts (Ali et al., 2023). The proportion in which 30% of CA is replaced with unwanted plastic material increased the impact resistance by 4.5 times in comparison to the control mix (Al-Tayeb et al., 2022). Some other studies (Islam et al., 2022; Juki et al., 2013) showed that using a significant amount of synthetic material as the replacement material of aggregate reduces the strength of concrete. Meanwhile, for increasing the ability of concrete to withstand the stresses, nano-materials can be used to enhance the strength (Abdalla et al., 2023). GNPs (graphene nano-platelets) are the materials having the potential to enhance the micro-structure of concrete, resulting in the reduction of pores in concrete and enhancing the bonding between the material (Tao et al., 2019). In a previous study conducted by Jaramillo and Kalfat (2023), greater distribution of GNP enhanced the strength of the concrete. This occurred via strengthening the concrete’s microstructure through the regulation of fracture propagation, amplifying crack complexity, and improving the spatial distribution of the internal stress. Concrete samples showed the highest enhancement in compressive strength (CS) by 19.5% and flexural strength (FS) by 8.8% with the addition of 0.25% wt of GNPs. Moreover, in another study carried out by Ismail et al. (2022), it was discovered that adding GNP content up to 0.10% improved the mechanical characteristics of the concrete. The incorporation of 0.02% of GNPs increased the CS, tensile strength, and FS by 20.82%, 30.05%, and 13.16%, respectively. Recently, in a study conducted by Ghani et al. (2024), an examination was done to observe the combined impacts of waste PET waste plastic and GNPs. The study revealed that including 5% PET together with 0.10% GNPs resulted in increases of 9% in CS, 12.21% in split tensile strength (STS), and 4.40% in FS.
This examination aims to explore the impact of polyethylene furanoate (PEF) waste plastic on concrete, highlighting its superior benefits and features in comparison to PET. PEF is a type of bio-plastic that is made from renewable resources, especially from plants. PEF consists of furan-02, ethylene glycol, and 05-dicarboxylic acid (FDCA). It is also called a greener plastic in contrast to other types of plastics because it is made from renewable resources. PEF is used in packaging, for making plastic containers, and as fibers. It is more environmental friendly compared to PET plastic, and it is more durable. Because of its high durability, it can be used in concrete when it is exposed to extreme environments and can be used for a longer time as well. When using PEF in concrete as a replacement material, care should be taken, and it should be made sure that it can maintain the required strength because the properties of PEF and PET may vary. There is a need for an in-depth study to evaluate how well the structure made from concrete can hold up under the various circumstances over time. PEF has certain properties that make it a better material to be used in concrete compared to PET, which are high insulation (Marques et al., 2018) and soundproofing, because of which it can serve as a material with improved energy utilization and enhanced comfort for people inside the structure constructed using PEF. With regards to the use of different recycled materials for concrete, a lot of research work has been done, such as Ahmed et al. (2024) and Uche et al., but none have researched the use of PEF plastic waste in combination with graphene nano-platelets, which is, in turn, the pressing demand of our work in scientific terms.
As per the available literature, no research has been performed on investigating the effects of incorporating PEF plastic waste as coarse aggregate in concrete along with addition of GNPs. Different unique combinations were prepared and tested to effectively bridge the research gap identified within the current scholarly discourse. Integrating PEF plastic waste offers a sustainable option for addressing the urgent problem of plastic pollution by reusing PEF plastic waste for building. GNPs are well-known for their capacity to improve the mechanical characteristics of concrete. The study aims to investigate possible synergistic effects by mixing PEF plastic waste with GNPs to improve the performance of concrete. The distinctive characteristics of each addition, including flexibility, strength, durability, and environmental effect, were studied. The core target of this study is to execute an in-depth examination to explore the impact of PEF plastic waste and GNPs on the mechanical characteristics of concrete. Additionally, an environmental evaluation was carried out to determine the overall carbon content (EC) and eco efficiency (ESE) of various mix proportions. The unique mix proportions were prepared by RSM, and models for each response were prepared. The RSM model has been employed to construct equations that are capable of predicting the mechanical strengths and environmental characteristics of concrete via the incorporation of PEF and GNPs.
This will reduce the critical necessity of providing sustainable construction material and evaluating the mechanical and environmental impact of the incorporation of PEF plastic waste with graphene nano-platelets in concrete. This work is novel in the sense of the application of PEF plastic waste in the form of coarse aggregates, which, to the best of our understanding, has not been previously practiced. Moreover, this study is significant as the results obtained may be able to offer a viable solution to the problem of waste management up to the ultimate stage, and at the same time, it increases the production of good quality, high performance, and eco-friendly cement.
The article introduces RSM as the main statistical approach used in the research study after the Introduction section. The Materials and methods section outlines the experimental processes, which include the synthesis of materials, sample preparation, and testing protocols. The Results section displays the study’s findings, including the outcomes of the ANOVA analysis for each model and the multi-objective optimization procedure. The next part discusses model validation, which involves evaluating the correctness and dependability of the created models. This research concludes with suggestions for future studies to highlight the importance of the findings and provide directions for future research efforts.
2 Design of experiments
2.1 Background
The use of experimental design methods, like response surface methodology (RSM), is becoming more common in studying concrete properties with the inclusion of waste materials. One way RSM can be used is to help analyze data for a complex mixture that includes silica fume, meta-kaolin clay, volcanic powder, and ground-granulated blast-furnace slag (Khan et al., 2023a). From the lines of evidence we have, it can be concluded that using DoE is a practical approach for effectively managing various inputs and improving decision-making in different scenarios. This method has been widely adopted in various commercial and production industries, as well as by service providers, to improve the effectiveness of testing methods. Throughout history, the technique known as OVAT, or one variable at a time, has been utilized as a strategy to tackle complex issues. This approach requires separating and assessing each element independently. The recommended approach to research involves manipulating every factor excluding the variable under investigation and conducting a series of tests to obtain the most favorable results for the parameter of concern. The process called iteration is employed to calculate the solution for every parameter by repeatedly enhancing the estimate until the desired degree of precision is achieved, considering the presence of multiple variables related to the problem. This is achieved by considering the intrinsic characteristics of the matter. Despite the accuracy and simplicity associated with the concept, its implementation requires the use of extensive datasets and a wide array of trials, both of which demand significant resources and time.
The efficiency of HSC (high-strength concrete) and self-consolidating concrete (SCC) is controlled by a variety of linked factors. Through meticulous examination of the influence of specific factors on the reliant component of interest, the use of the experimental technique has successfully decreased the required amount of data for arithmetical analysis, yielding advantageous results. Researchers who possess limited topic expertise and lack a clearly defined approach to problem-solving may require assistance in addressing the diverse range of DoE scrutinizes. DoE has been widely used in the analysis of construction materials in modern civilization. DoE has been extensively engaged in several phases of rigorous exploration concerning concrete, including the valuation of concrete’s long-term robustness and the formulation of ideal concrete compositions. The valuation of concrete potency using nondestructive testing (NDT) encounters certain restrictions, which, in turn, need the use of mathematical equations in specific cases.
In the present-day setting, it is accustomed to use the methodology of basic linear regressions (SLR) in tandem with a scatter graph. Innovative methodologies for assessing novels, such as the response surface technique, have been acknowledged as significant instruments for generating precise and thorough prognostications. The efficacy of the DoE techniques in discerning prospective replacements to materials has proven noteworthy. Several DoE approaches have been used to evaluate the efficacy of several substitute materials, including fly ash and coir fiber ash. Past studies have used different research methods, like analyzing response surfaces, using curve fitting strategies, and employing neural network-based artificial techniques, to improve the creation of innovative concrete construction methods that frequently incorporate readily available recyclable materials.
2.2 Response surface method
The RSM (response surface technique) is a quantitative and arithmetic approach used to forecast the correlation among the independent and dependent components. A prediction regarding the inherent relationship between the independent variables can be achieved through the utilization of experiments designed with the RSM.
In order to optimize and model PEF and GNPs, the current investigation implemented the design decisions that were deemed most appropriate. In the context of the response surface technique (RSM), “optimal design” denotes the approach or procedure utilized to ascertain the optimal values of independent variables in order to attain the intended outcome. Two considerations that ought to influence the selection of a research or study design are the particular issue under investigation and the goals that are being attempted to achieve. There is a potential requirement to employ numerous strategies showcasing diverse attributes in order to achieve optimal outcomes. Using the response surface simulation to create a contour graph is the fundamental technique used in the optimum design process. The graphical representation facilitates the examination of the contour association among the input and output factors. The process of identifying optimum design alternatives entails the determination of the specific point where the output response demonstrates either an increase or a decrease.
The use of advanced optimizing methodologies entails the optimization of responses by using methods such as multiple goals and resilient optimization of input factors. This methodology facilitates the attainment of equilibrium among several conflicting objectives and the incorporation of uncertainty into both the given input parameters and the model. Either of these objectives have the potential to be achieved via the use of this technology.
3 Experiments and methodology
3.1 Materials
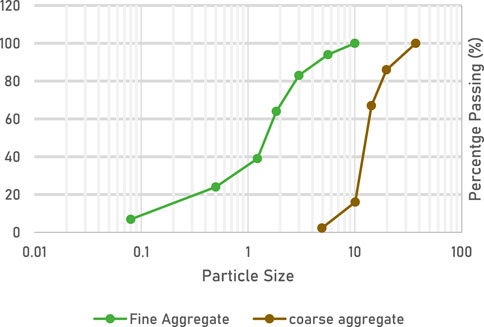
For this examination, PEF bottles were obtained from locally available waste collection centers in Ipoh, Malaysia. The bottles were selected for their recyclability and likelihood of use in construction materials. Once collected, the PEF plastic waste bottles were extensively cleaned and sorted to remove contaminants, labels, and any leftover chemicals. Quality-approved bottles were processed and cut into 20-mm pieces to serve as an alternative for pebbles in concrete. The plastic cutting process was systematically carried out to ensure consistent dimensions and minimize differences. The plastic particles were used as a supplementary material for gravel. The GNPs used in this investigation were obtained from Jiansu XFNANO and had conductivity values between 750 and 1110 S/cm. The coarse and fine aggregates were attained from the concrete laboratory at UTP; on the other hand, the cement was bought from a local provider. The respective specific gravities of the aggregates were 2.60 and 2.80. Grading of fine and coarse aggregates can be seen in Figure 1. The Malaysian company SIKA-KIMIA was the source for the polycarboxylate-based superplasticizer used in this study. The method of mixing entailed the use of readily accessible tap water within the laboratory environment. SEM analysis for PEF plastic was also carried out, which can be seen in Figures 2A–E. FESEM was carried out to examine the effects of GNPs on the microstructure of concrete. Figures 2C, D display FESEM images showing that concrete improves its microstructure by decreasing the hole diameters and transforming hydration crystals into a flowing structure, thereby lowering porosity (Chintalapudi and Pannem, 2020; Lv et al., 2013; Gladwin Alex et al., 2022). It creates nucleation sites inside the concrete to generate calcium carbonate crystals. These crystals fill the pores, leading to the development of self-healing characteristics in concrete, as seen in Figures 3A–C. FESEM in Figures 2C, D demonstrate the existence of closely linked graphene nanoparticles with cross-linking structures and deviating, discontinuous fractures. This results in strengthening the whole matrix by creating a compact microstructure.

Figure 2. (A, B) SEM of PEF plastic at a magnification of 5.00 kx and 3.00 kx (C) with 0.08% of GNPs and (D) with 0.1% of GNPs; (E) pores in the control mix and (F) micro-structure of the control mix.
3.2 Designing mix proportions
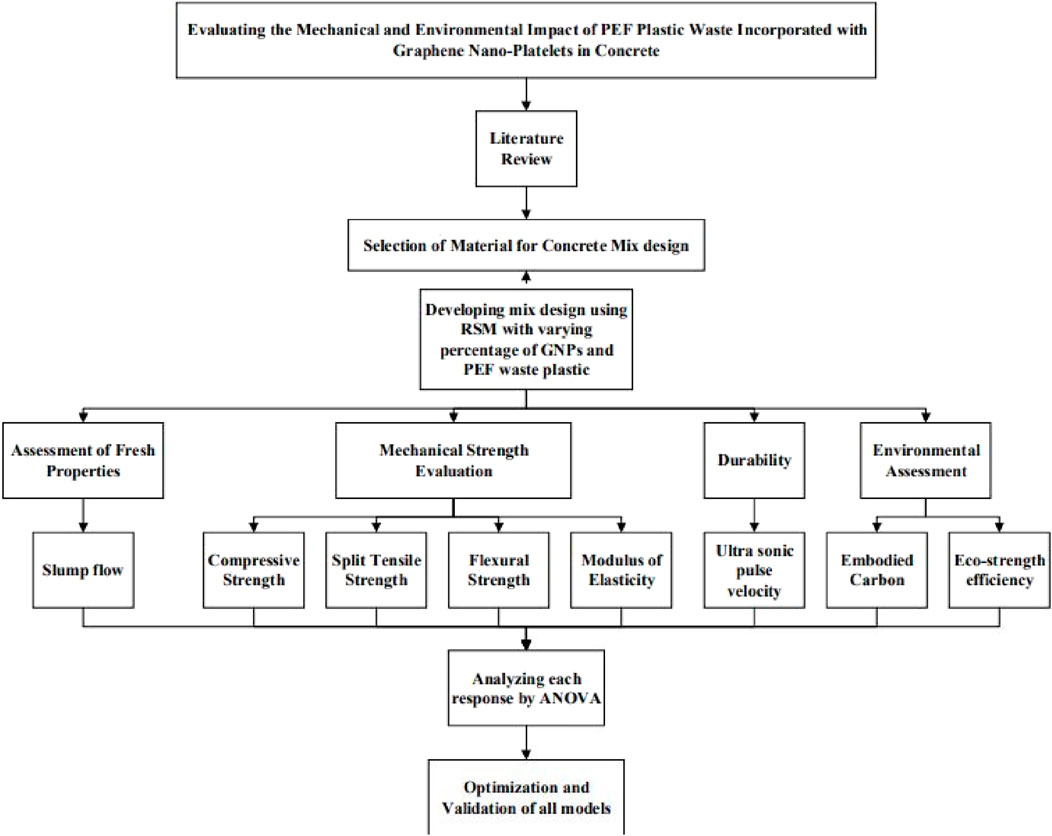
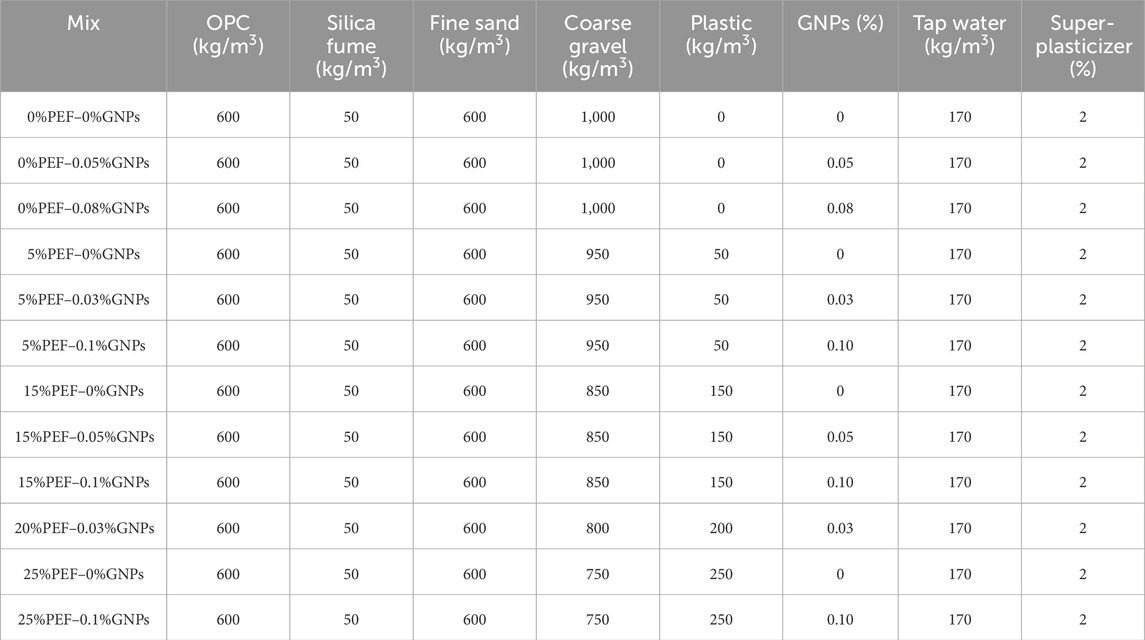
A reference concrete composition was composed in agreement with ACI 211.1–91 conditions. Mix proportioning with a varying content of PEF and GNPs was prepared by RSM in Design-Expert software version 13. Each model was verified by developed models of ANOVA. PEF and GNPs were the input and sovereign variables. The response surface technique involves manipulating the self-determining variable under investigation and analyzing the resulting impact on the dependent variable. In this study, the optimum design option within the software package named Design-Expert 01 version 13 was utilized to determine the appropriate mix percentage. The percentage of PEF plastic as coarse aggregate replacement varies from 0% to 25%, and the quantity of GNPs varies from 0% to 0.1%. The dependent variable for this investigation includes concrete’s CS, modulus of elasticity (MoE), STS, ultrasonic pulse velocity (UPV), FS, total carbon in concrete, and concrete’s eco-efficiency (ESE). All the additional materials like OPC, FA, SP, and water were kept consistent. RSM-developed proportions can be seen in Tables 1, 2. The flowchart of the research methodology followed can be seen in Figure 3.
3.3 Samples and testing methods
A cylindrical barrel mixture was employed for the purpose of mixing the components. The dry components were thoroughly mixed in the desired combination. PEF plastic components were additionally included into the mixture of desiccated constituents. In contrast, the GNPs were adequately dispersed in both water and SP. For the homogenous dispersion of GNPs in SP and water, an ultrasonicator was used with a magnet. It was ensured that GNPs are properly mixed in the water and SP. The cement and water ratio (W/C) was retained consistently throughout all proportions. The appropriate mixing of material was ensured, following a duration of several minutes. A high-shear mixer was utilized to mix the materials properly. First, dried ingredients were mixed for 2 min, and then, a mixture of GNPs in water and SP was introduced and mixed for another 5–8 min. After the thorough preparation of concrete, the samples were manufactured. Cuboid samples with 100-mm sides were created in accordance with ASTM C78/C78M recommendations. Cylindrical samples were created with an outer diameter of 100 mm and an overall height of 200 mm, following the standards outlined in ASTM C496. All the samples were cured at room temperature 23°C–24°C. On day 28, once the samples had been prepared, they were analyzed. A test was performed to evaluate the specimen’s FS in line with the requirements of ASTM C78/C78M-21 specification. A cylindrical sample, having the height of 300 mm and diameter of 100 mm, was cast to measure the elastic modulus (MoE) in agreement with ASTM C469. On day 28, after casting, the sample was examined. The MoE was estimated using Equation 1:
where E is elastic modulus (MOE), σ1is the stress value that resembles 0.4 times of the eventual load (MPa),
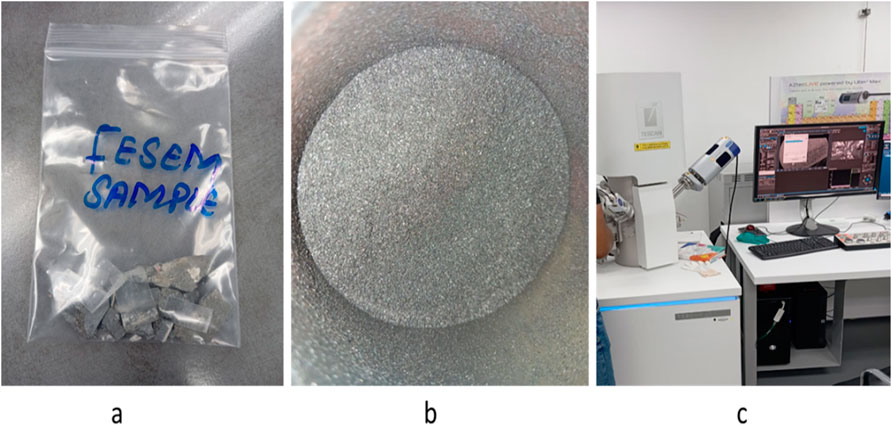
After conducting all the mechanical tests, the tested samples were taken to conduct the micro-structural analysis of concrete containing PEF and GNPs to better understand the effects of GNPs on the micro-structure of concrete. For analyzing the surface of PEF plastic, PEF samples were subject to SEM analysis, as shown in Figure 4. All the tests were performed at the Universiti Teknologi Petronas lab facility.
4 Results and discussion
4.1 Flowability
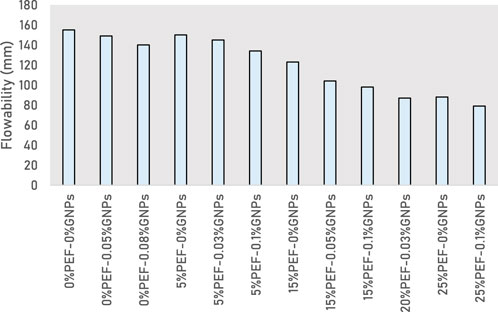
It was found from the investigation that the accumulation of PEF and GNPs both has a negative impact on the concrete’s flowability, as shown in Figure 5. On the addition of both PEF as a coarse replacement material and GNPs as a strength-enhancing additive, it was found that the slump of concrete reduces. Reference concrete has the slump of 155 mm. Adding 0.05% GNPs to the control mix decreases the slump by 3.8%, while increasing the GNPs to 0.08% lowers the slump by 9.6%. When 5% of coarse gravel is substituted with PEF waste plastic material, the slump decreases by 3.2% compared to the control mix. Adding 0.03% of GNPs to the same mix further decreases the slump to 6.4%, and including 0.1% of GNPs results in a 13.54% reduction in the slump, indicating the negative impact of GNPs on the concrete slump. The mix with 25% substitution of coarse gravel with PEF waste plastic material shows the greatest decrease in the slump. On 25% substitution of coarse aggregate, the slump reduces by 43.22% compared to the control mix. Further addition of 0.1% of GNPs in concrete with a similar percentage of substitution results in the reduction of slump by 49%. The reduction in slump observed in concrete-containing PEF plastic aggregates and GNPs can be attributed to several factors. The hydrophobic nature of PEF and the high surface area of GNPs can reduce the effective water content available for lubrication, leading to a stiffer and less workable mixture. Additionally, the irregular shape and rough surface texture of PEF aggregates and the high aspect ratio of GNPs can hinder the flow of the concrete, contributing to the decreased slump values. The presence of GNPs may also increase the viscosity of the cement paste, further reducing the flowability of the concrete mix, as specified in a previous study (Jaramillo and Kalfat, 2023). The previous studies in which PET plastic material was used in concrete as a coarse gravel material also showed that addition of plastic material in concrete results in lessening of concrete’s flowability. An examination carried out by Dawood et al. (2021) found that 20% replacement of aggregate with PET plastic material results in 62% reduction of the slump. Another study performed by Ismail and AL-Hashmi (2008) stated that, when comparing the slump values of concrete-containing plastic material to those of the reference concrete mixture, it was observed that the slump values of concrete tended to decrease below the reference value.
4.2 Compressive strength
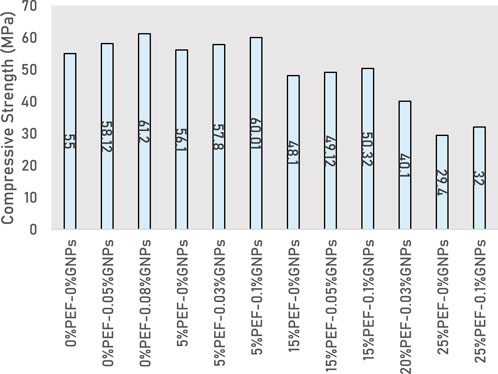
Figure 6 illustrates the experimental outcomes of CS for concrete containing PEF waste plastic and GNPs. The figure shows that PG1 is the control sample with a CS of 55 MPa. Adding 0.05% of GNPs augments the strength of PG2 by 5.67%. Adding 0.08% of GNPs to PG3 boosts its strength by 11.27% without replacing the coarse aggregate. On the other hand, the mix proportion PG4 containing only 5% of PEF plastic has 2% more CS than the control sample. When 0.03% of GNPs are added to PG5 with a substitute of 5% of the coarse aggregate, the CS is 5.09% higher than that of the reference mix. Within PG6, the concentration of GNPs rose to 0.10%, leading to a 9.10% rise in CS, the highest among all mixes. Substituting 15% of the coarse gravel with PEF leads to a 12.54% drop in CS compared to the control samples. Adding 0.05% of GNPs with a 15% substitute of the coarse aggregate resulted in a 10.69% diminution in strength compared to the reference sample. Intensifying the amount of GNPs to 0.1% led to an 8.50% reduction in CS compared to the control sample. Substituting 20% of the coarse gravel with PEF waste plastic mixed with 0.03% GNPs reduces its rigidity by 27.09%. Substituting the coarse aggregate with 25% of PEF has the minimum strength among all the mixtures, which is approximately 46.54% lower than that of control mix; adding 0.10% of GNPs to concrete, with the same amount of coarse gravel substitution, showed 41.81% decrease in CS compared to that of the control mixture. Adding a higher amount of plastic content to replace the coarse gravel results in reduced bonding between the cementitious matrix and aggregate, and due to this reason, CS of concrete decreases (Islam et al., 2016). An examination conducted by Chong and Shi (2023) suggested that addition of the plastic content as a coarse aggregate replacement results in the reduction of the concrete CS of day 28. Another examination conducted by Umasabor and Daniel (2020) found that inclusion of 5% of the PET plastic content results in obtaining the optimum CS among all mixes. In our study, it was found that 5% inclusion of the PEF plastic content also has a positive effect on concrete’s CS along with 0.1% of GNPs, and the incorporation of GNPs at a low dosage of 0.1% can significantly enhance the interfacial bonding between the cement paste and the PET plastic aggregates. Multiple research studies have investigated the influence of GNPs on CS. A study performed by Jiang et al. (2021) found that addition of GNPs ranging 0.03%–0.05% has positive effects on the concrete CS, but, in contrast, it was found in this investigation that GNPs may have positive effects on CS of concrete until the addition of 0.1% of GNPs, if dispersed properly while mixing. Recently, in another study conducted by Ghani et al. (2024), 5% of PET recyclables and 0.1% of GNPs were used in the research study to improve the CS by 9% compared to that of the reference mix.
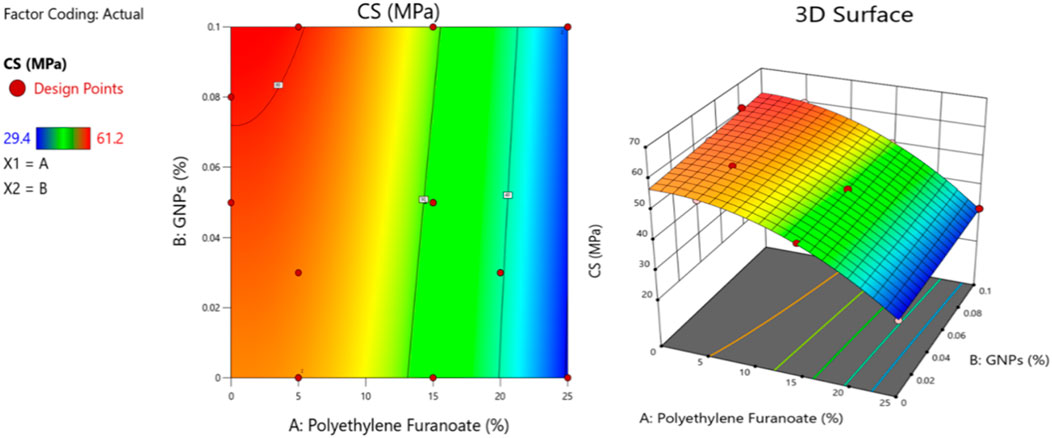
Figure 7 shows the 2D contouring and 3D response diagrams, which show how two variables affect concrete’s CS. The region highlighted in red on the contour plot indicates the highest CS. It is evident that the concrete samples with 0% and 5% substitution of coarse material exhibit greater CS values. A drop in CS of concrete is seen as the degree of coarse gravel replacement rises, indicating an inverse relationship between the level of replacement and CS.
4.3 Split tensile strength
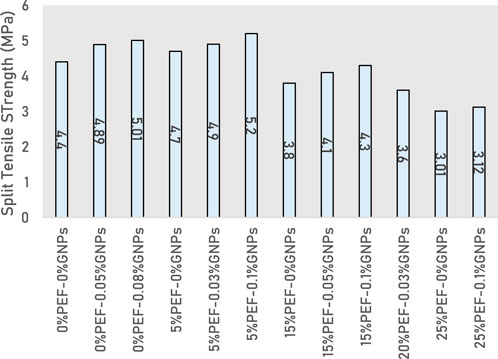
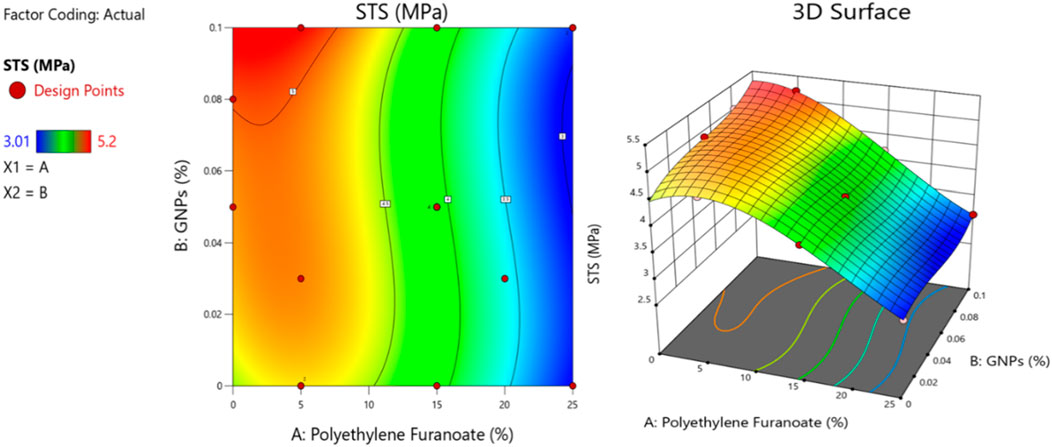
Figure 8 represents STS findings of cement containing GNPs and PEF as coarse aggregate replacing material. It was found that the control mix has the STS of 4.4 MPa. PG2 containing 0.050% of GNPs has 11.11% more STS than the controlled proportion, while increasing the amount of GNPs by 0.08% also enhances the strength by 13.86%. On substituting 5% of coarse aggregate with PEF, STS is boosted by 6.81%, and on adding 0.03% of GNPs to PG5, STS improves by 11.36%. When the concentration of GNPs rises to 0.1% with 5% coarse aggregate substitution in PG6, STS increases by 18.18%. On 15% replacement of the coarse aggregate with PEF, STS falls by 13.63% in compared to that of the reference sample. When 0.050% of GNPs are accumulated with 15% substitution of gravel, there is a 6.81% drop in STS. However, if the GNP content is raised to 0.1%, STS becomes almost equivalent to that of the control mix. Substituting 20% of the coarse aggregate and inclusion of 0.03% of GNPs reduces STS by 18.18%. Although 25% substitution of aggregate concrete has the minimum STS, which is 31.59% lesser than that of the control sample, when 0.1% of GNPs is added with a comparable proportion of replacement, STS drops by 29.09%. Research revealed that the concrete mix with a larger proportion of PEF plastic waste as a substitute material had reduced STS due to the formation of cavities and pockets of air in the cementitious structure, leading to a decrease in concrete’s STS (Islam et al., 2016). Prior investigation performed by Khan et al. (2023b) showed that adding GNPs to concrete improves the microstructure by reducing pores, thereby boosting the concrete’s overall strength. In this examination, it was found from FESEM findings that the accumulation of GNPs boosts the crystalline structure of concrete and results in pore reduction, which finally enhances the strength of concrete. One more study performed by Ghani et al. (2024) found that replacing 5% of the coarse gravel with waste PET material and accumulation of 0.1% of GNPs augmented the STS by 12.12%.
Two variables’ effects on concrete’s STS are shown in the 2D and 3D response graphs in Figure 9. The contour map highlights the location with the greatest STS, shown in red. The STS is clearly higher for the concrete samples that had either 0% or 5% of the coarse material replaced. There seems to be a negative correlation between the quantity of coarse aggregate replacement and STS in concrete, with the latter decreasing as the former increases. In addition, it can be shown that adding GNPs to concrete improves its tensile strength.
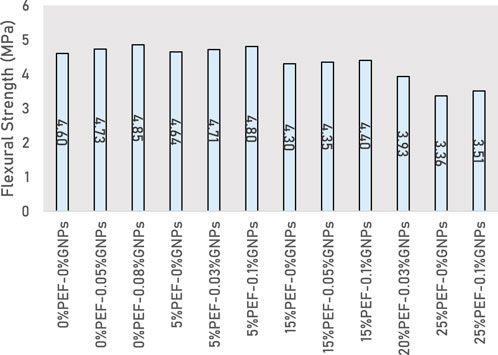
4.4 Flexural strength
Figure 10 illustrates the FS of several mixtures with intensifying amounts of GNPs and PEF plastic as coarse particles. It was found that the control mix has the FS of 4.59 MPa, and this value increases with the addition of GNPs in the control mix. Adding 0.05% GNPs to the control combination increases the strength by 2.27%, while adding 0.08% GNPs boosts strength by 5.48%. Substituting 5% of the coarse gravel with PEF waste plastic has shown favorable outcomes. It can be seen that, on 5% replacement, FS increases by 1% only. However, adding 0.03% of GNPs in PG5 increases the strength by 2.51%, and increasing the GNP content to 0.1% in PG6 doubles the increase in strength and has 4.45% more FS than the control mix. Replacing the coarse aggregate by 15% reduces FS. The concrete mix containing 15% of PEF plastic has 6.48% less strength than the control sample. Adding 0.05% to PG8 does not significantly impact its strength, although PG8 still exhibits 5.49% less strength than the baseline mix. Increasing the GNP content to 0.1% with 15% coarse gravel replacement results in a 4.34% decrease in strength paralleled to the reference mix. It was examined that an increase in the plastic continuously results in the reduction of strength. On 20% replacement with 0.03% of GNPs, FS decreases by 14.61%. Moreover, 25% substitution of the coarse aggregate results in 26.88% reduction in FS. When 0.1% of GNPs are added with 25% coarse gravel substitution, the outcome is a decrease of 23.71 in FS compared to the control percentage. In this investigation, it was found that an increase in PEF causes the reduction, while addition of 0.1% GNPs in the presence of 5% PEF has shown a rise in FS. This increase in FS can be associated with the enhancement in the interaction between the cementitious paste and PEF plastic due to GNPs. It can be seen in Figure 3B how GNPs have enhanced the microstructure of concrete. The study conducted by Umasabor and Daniel (2020) on the integration of PET polymers with concrete demonstrated that the FS of concrete decreased as the amount of PET plastic in the concrete mix rose. Another experimental study conducted by Jaramillo and Kalfat (2023) found that the most favorable concentration of GNP was 0.25 wt%, which resulted in a notable enhancement of up to 8.8% in the FS of concrete. Similarly, in this study, it was found that addition of up to 0.1% GNPs has a positive impact on concrete’s FS. Previously, an investigation carried out by Ghani et al. (2024) discovered that substituting 5% of coarse gravel with waste PET material and adding 0.1% GNPs increased the FS by 4.40%.
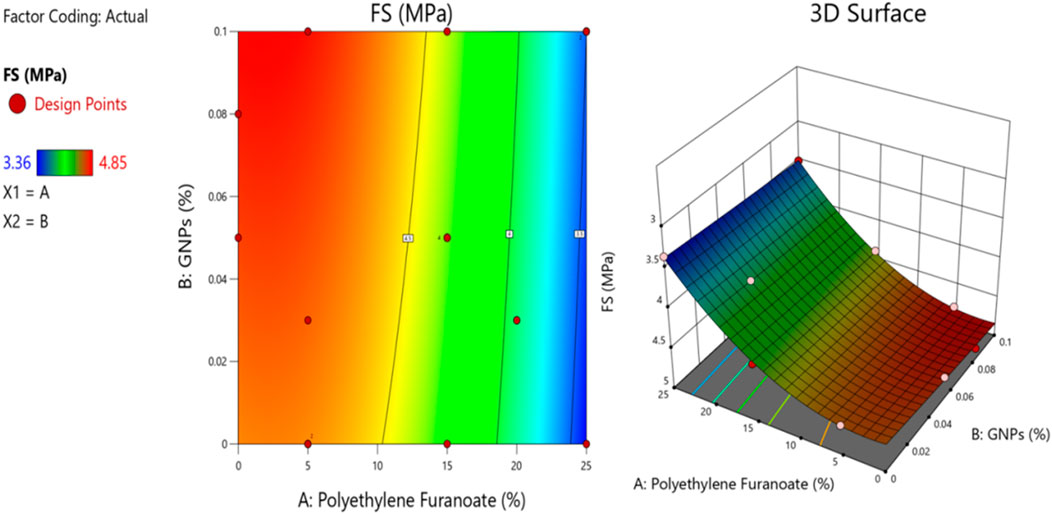
Figure 11 illustrates the impact of two factors on the FS of concrete, as shown in the 2D contour and 3D response plots. The contour plot displays the highest FS, with the red region indicating this value. It is evident from the plot that concrete specimens with 0% and 5% replacement of the coarse aggregate exhibit a greater FS. The findings indicate that there is an inverse relationship between the amount of coarse gravel replacement in concrete and the factor of safety (FS), as shown by the drop in FS with increasing levels of replacement. Furthermore, empirical evidence demonstrates that the integration of GNPs has a constructive impact on the FS of concrete.
4.5 Modulus of elasticity
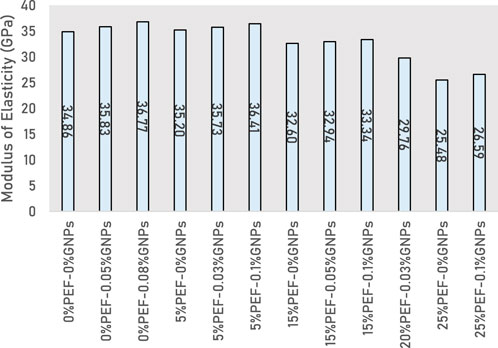
Samples for MoE were tested on day 28 after casting. Figure 12 shows the findings of MoE of each sample with and without GNPs and PEF plastic material. The MoE of the control mix is observed to be 34.85 GPa. In PG2, it was found that addition of 0.05% of GNPs in the reference mix increases the MoE by 2.79%, and if the content of GNPs increased to 0.08%, MoE enhances by 5.48%. In PG4, adding 5% of PEF plastic as alternate material to coarse gravel enhances the strength by 1% only. If 0.03% of GNPs is added with 5.0% of total coarse gravel substitution, MoE enhances by 2.51%, and increasing the GNPs’ content to 0.1% intensifies the MoE by 4.45%. Moreover, adding more PEF content in concrete as the replacement material results in declination of results. The study revealed that the substitution of 15% of coarse gravel with PEF plastic waste led to a diminution in the MoE by 6.48%. However, this drop in MoE percentage diminished when an additional 0.05% of GNP content was included, resulting in a MoE that was 5.49% lesser than that of the control mix. Inclusion of 0.1% GNPs with 15% coarse aggregate substitution results in 4.34% less MoE. Furthermore, 20% replacement containing 0.03% of GNPs lowered the MoE by 14.61%. The sample containing 25% of PEF as a coarse aggregate replacement material has the least MoE, which is approximately 26.88% lesser than that of the reference mix. Addition of 0.1% of GNPs with the same 25% of substitution results in 23.73% low MoE than the controlled proportion. It was found that PEF plastic material does not have same properties of interlocking like the coarse aggregate and has less bonding with the cementitious material, which results in the reduction of MoE as the percentage of coarse aggregate substitution increases (Islam and Shahjalal, 2021). Properties of plastic materials are different than those of the coarse aggregate as it bends more easily than the coarse gravel, due to which it has low stiffness and MoE when used in concrete as a coarse aggregate replacement material (Hanis et al., 2021). In a prior examination conducted by Ghani et al. (2024), it was found that 5% substitution of coarse gravel with PET waste material with 0.1% addition of GNPs augmented the MoE by 4.40%.
Figure 13 presents a visual representation of the influence of two variables on the MoE of concrete. This is shown via the use of both 2D contour graphs and 3D response graphs. The region highlighted in red on the contour plot indicates the greatest MoE. It is evident from the plot that concrete specimens with 0% and 5% replacement of the coarse aggregate exhibit greater MoE. As the proportion of replacement materials in concrete rises, there is a corresponding drop in the MoE.
4.6 Ultrasonic pulse velocity
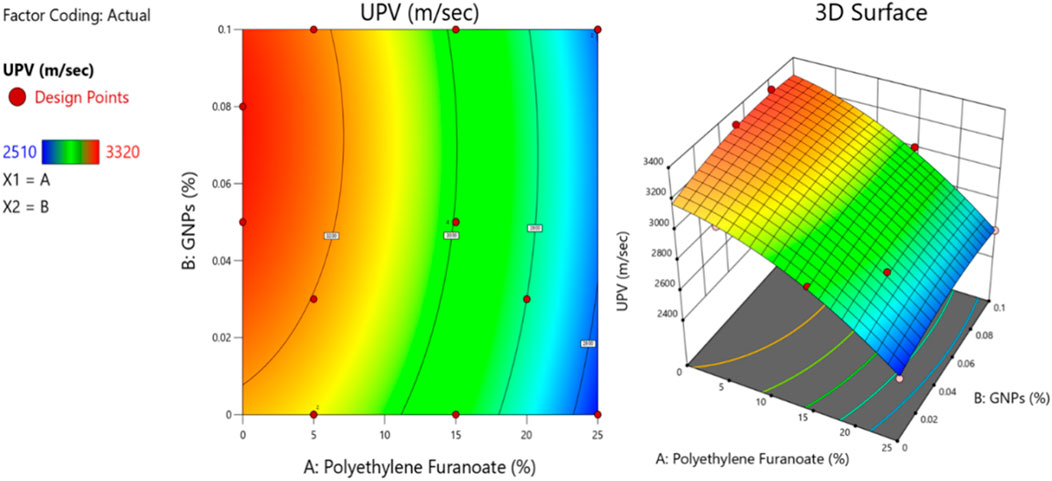
Figure 14 shows the UPV findings of each proportion. It was found that the control mix has the UPV of approximately 3,200 m/sec. Addition of GNPs in the reference mix increases the UPV; on the inclusion of 0.05% of GNPs, UPV increases by 3.09%. If 0.08% of GNPs is added to the control mix, it increases the UPV by 3.75%. Experimental results show that accumulation of PEF plastic waste in concrete results in the reduction of UPV. It can be seen that substitution of 5.0% of gravel with plastic waste reduces the UPV by 2.53%. Furthermore, addition of GNPs in concrete reduces the percentage of reduction as GNPs augment the micro structure of concrete and reduces the pores, and it was found that adding 0.03% of GNPs in concrete reduces the reduction percentage to 1%. If the GNP content rises up to 0.10% with 5% of coarse gravel replacement, then the concrete has UPV almost equal to that of the reference mix. Furthermore, if the substitution proportion of coarse gravel is increased to 15%, it results in 8.84% lesser UPV than the reference mixture. The addition of 0.05% of GNPs with similar 15% of substitution results in 6.62% lower UPV passing through PG8 compared to the reference mix. If the content of GNPs increases to 0.10%, then PG9 has 5.93% lower UPV passing through the specimen compared to the reference mixture. The study findings indicate that an upsurge in the proportion of waste plastic content used as a replacement material results in a reduction in the UPV. It was found that 25% substitution of coarse aggregate has the least UPV than all the other proportions. Plastic material is less dense and has very low rigidity compared to coarse aggregate due to which addition of PEF plastic material in concrete resulted in reduction of UPV as ultrasonic waves travel more slowly through the material having less density and low rigidity (Engineering, 2018). Previously, an investigation carried out by Ghani et al. (2024) found that reducing the substitution percentage of coarse aggregate with PET waste material while increasing the GNP content increases the UPV due to the reduction in concrete pores. It was found that 0% substitution of coarse gravel with 0.08% of the GNP content exhibits 0.07% more UPV compared to the control mix (Ghani et al., 2024).
Figure 15 shows the 2D and 3D contour and response plots for UPV of concrete, revealing the effect of two independent factors. The region highlighted in red on the contour map indicates the greatest UPV. It is evident from the figure that concrete specimens with 0% and 5% replacement of the coarse aggregate exhibit a greater UPV. As the degree of substitution in concrete rises, there is a corresponding drop in the UPV.
4.7 Assessment of sustainability
4.7.1 Embodied carbon
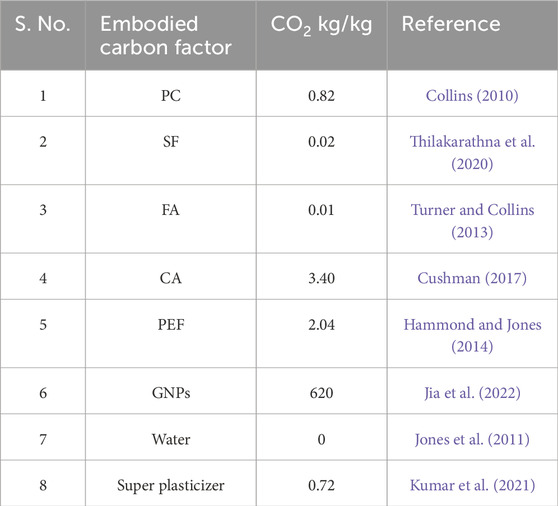
A comprehensive environmental influence evaluation was conducted to determine the embodied carbon of various mixtures using varied proportions of PEF plastic as a supplementary material for coarse gravel, along with the insertion of GNPs to enhance strength. The information about the EC of each material used in these blends has been sourced from the available literature, as shown in Table 3. The table presents the embodied carbon component associated with each material.
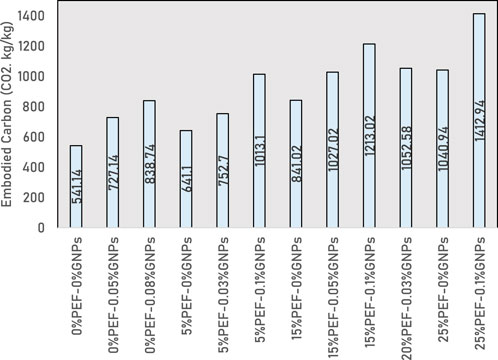
The data shown in Figure 16 indicate that the control sample exhibits the lowest level of embodied carbon. The inclusion of the PEF plastic component and GNPs leads to a notable increase in the embodied carbon of the mixtures. The study revealed that the addition of 0.05% of GNPs to the reference sample led to a significant increase in the EC by 34.37%. Furthermore, the inclusion of 0.08% of GNPs resulted in an even higher rise in EC by 54.99%. This may be attributed to the very high embodied carbon factor associated with GNPs. Moreover, substitution of a coarse aggregate with PEF plastic material also upsurges the EC, and it is obvious as the embodied carbon factor of PEF is more than that of the coarse aggregate. All the mix proportions containing both GNPs and PEF have the highest amount of EC. Substitution of 5% of the coarse aggregate increases the EC by 18.47% compared to the reference mix. Meanwhile, accumulation of 0.03% of GNPs with 5% of substitution increases the EC by 39%. From the findings, it is clear that addition of further GNP content raises the EC of the mix. Replacement of 15% of coarse gravel with PEF plastic waste raises the EC by 55.41%, and on the other hand, addition of 0.1% of the GNP content in this proportion increases EC by 124%. Furthermore, maximum EC was found in the mix containing 0.1% of GNPs and 25% of coarse gravel replacement with PEF plastic, which is approximately 161% more than that of the controlled proportion.
4.7.2 Evaluation of eco-strength efficiency
The efficacy of eco-strength is contingent upon the longevity of concrete and its associated carbon emissions. The reliability of the combination will be enhanced in direct correlation with its ecological efficiency. The ESE is calculated by using Equation 2:
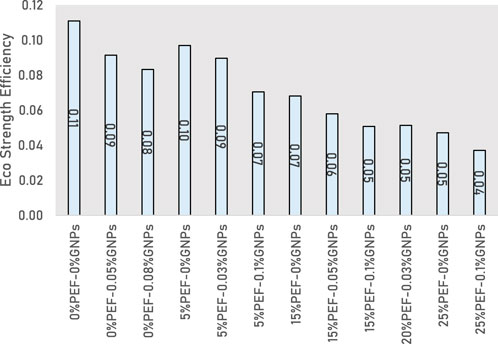
where C28 is the 28th day CS of concrete; Mc is the total EC of the mix proportion. The data shown in Figure 17 illustrate a reduction in the eco-strength efficiency of concrete when the coarse aggregate is substituted with PEF plastic. It was found that the reference mix has the highest ESE amongst all the proportions. The control sample has the ESE of approximately 0.11, while replacing the coarse gravel with 5% of PEF plastic waste also gives higher ESE than all the other samples containing PEF and GNPs, which is approximately 0.10. It was discovered that there is an inverse relationship between the amount of coarse gravel replacement and the ESE; as the amount of replacement rises, the ESE drops. The minimum ESE was found in the mix containing 25% of PEF as replacement material and 0.1% of GNPs, where the value of ESE is approximately 0.04. Although the ESE results indicate a reduction with the inclusion of PEF plastic aggregates and GNPs, suggesting a higher environmental contribution per unit of mechanical performance, there are several advantages to using this mixture. First, PEF and GNPs can significantly enhance the mechanical properties of concrete, including compressive and flexural strength, which may allow for smaller cross sections or reduced material quantities in construction, potentially offsetting the higher EC per unit of strength. Additionally, utilizing recycled PEF from waste bottles contributes to the circular economy by diverting waste from landfills and decreasing the demand for virgin materials, thus positively impacting the overall environmental footprint of the construction industry. Furthermore, ongoing research and optimization of the mix design, such as adjusting the dosages of PEF and GNPs, may lead to improved ESE values while maintaining enhanced mechanical properties. Lastly, the improved durability and service life of concrete containing PEF and GNPs can result in reduced maintenance and repair needs, further offsetting the higher initial EC over the structure’s lifetime. Therefore, the overall benefits of using PEF and GNPs in concrete should be considered in the context of sustainable construction practices.
5 RSM models and analysis of variance
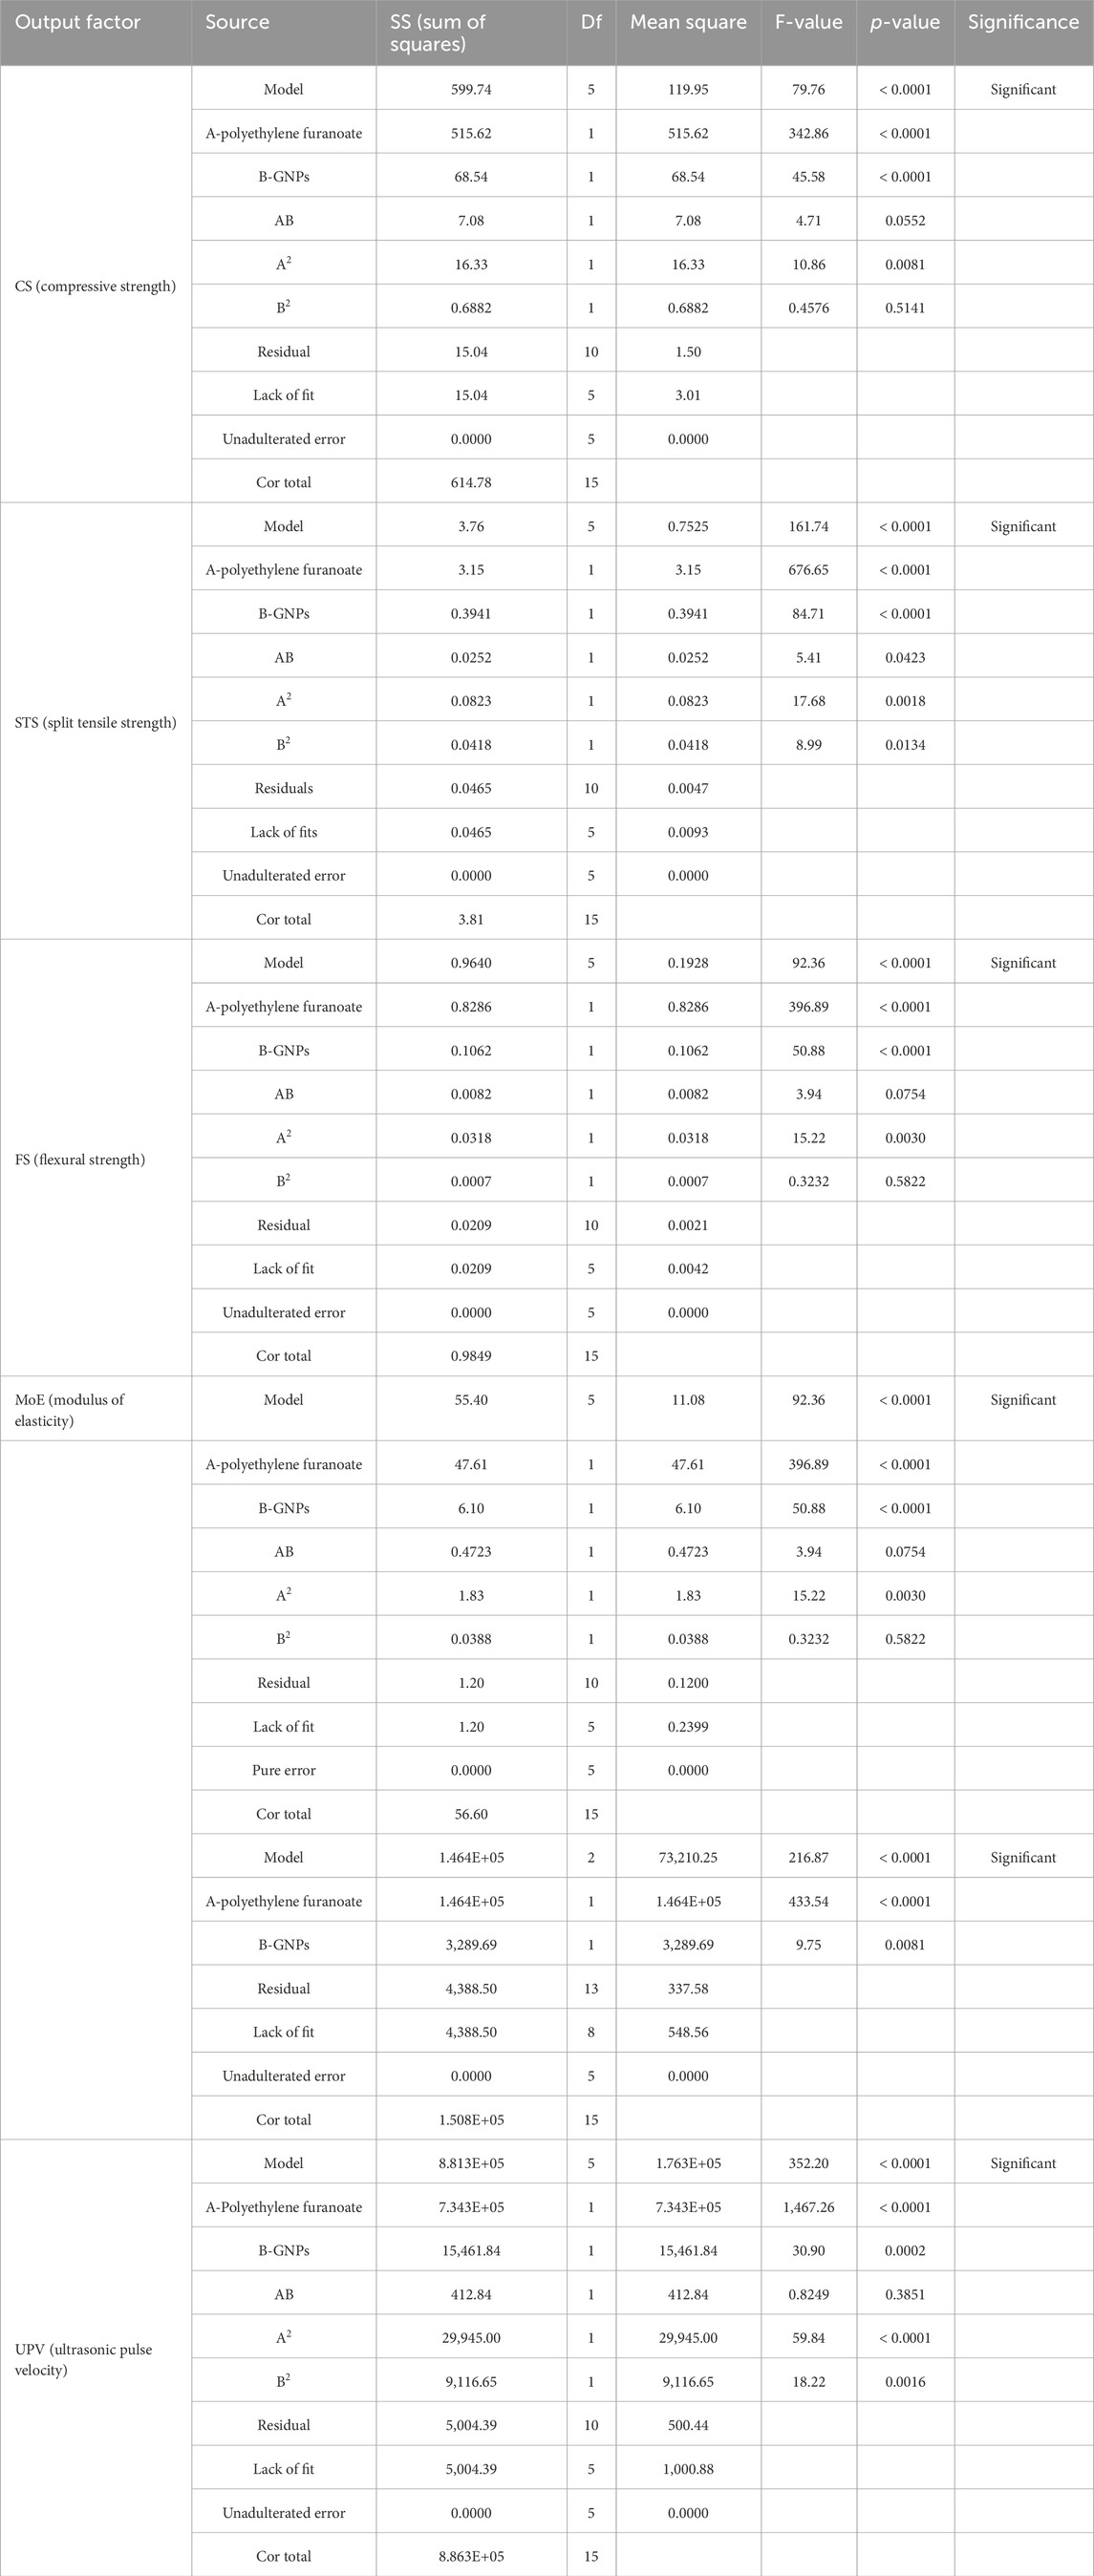
The mathematical model’s design was based on a response surface that included seven separate responses: CS, STS, FS, MoE, UPV, EC, and ESE. The response surface is mathematically described by Equation 3 (Khan et al., 2023b). The quadratic model was concluded to be the preeminent appropriate model for all answers, including CS, STS, FS, MoE, and UPV. The presence of 2D and 3D models is shown in Figures 7, 9, 11, 13, 15. The ANOVA examination of each model was verified at a level of significance of 5% by the use of a 95% assurance interval. The overview of the examination of variance (ANOVA) is shown in Table 4. A relevance criterion of 5% was predetermined, and consequently, any results below 0.05 were deemed to possess statistical validity (Tahir et al., 2023). As can be seen from the table, statistically significant is assigned to models with large F-values and probabilities lower than 0.05 (Khan et al., 2023a). The F-values are rather large, and the conforming p-values are all below or equal to 0.01 for the various response models (Khan et al., 2023c). It is probable that because of noise, F-values of each model are 79.76, 161.74, 92.36, 92.36, 216.87 × 1006 for CS, STS, FS, MoE, and UPV, respectively. Noteworthy model values for CS are A, B, and A2; those for STS substantial model values are A, B, AB, A2, and B2; and significant model values for FS are A, B, and A2. For MoE, the models that are significant are A, B, and A2, and additionally, for UPV, noteworthy model values are A, B, A2, and B2.
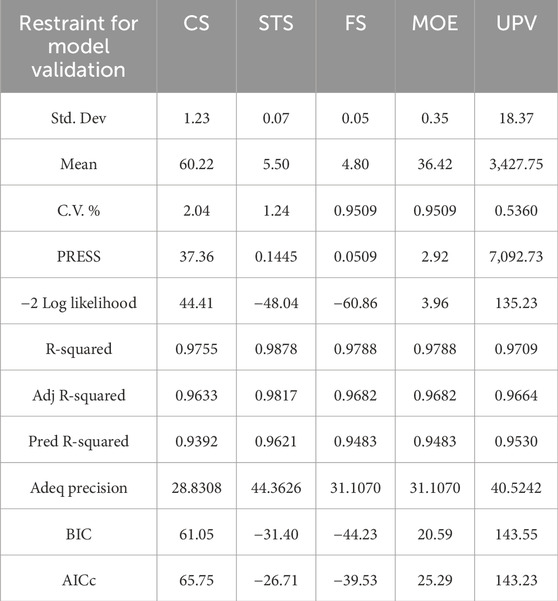
All the parameters for validation of each model are presented in Table 5. To demonstrate how well the model has been predicted, the coefficient of determination (R2) is utilized (Waqar et al., 2023a). R2 shows how well the data and developed models fit. The value of R2 varies from 0% to 100% (Zahraee, 2013). In these developed models, for each response, R2 values are 97.55%, 98.78%, 97.88%, 97.88%, and 97.09% for CS, STS, FS, MoE, and UPV, respectively. High R2 values indicate a significant indication of the robustness of the developed model (Waqar et al., 2023b). Another compelling source of data that serves to illustrate the high level of construction of the model is the study by Waqar et al. (2023c). The disparity between the corrected R2 and the anticipated R2 values should be no more than 0.2 (Zahraee, 2013). The magnitude of the difference exceeds the explanatory capacity of the model to account for the phenomenon (Azmee and Shafiq, 2018). In each instance of model application, the discrepancy between the anticipated and modified R2 values is consistently below 0.2. Likewise, the determination of acceptable accuracy may be ascertained by the evaluation of the ratio of signal to noise, which entails the comparison of the anticipated value range at each design point with the mean forecasting error. Furthermore, it is important to note that a minimum precision value of 4 is considered sufficient. The model created has a notable level of accuracy in predicting the expected replies as the precision consistently surpasses the value of four in all scenarios considered by the model.
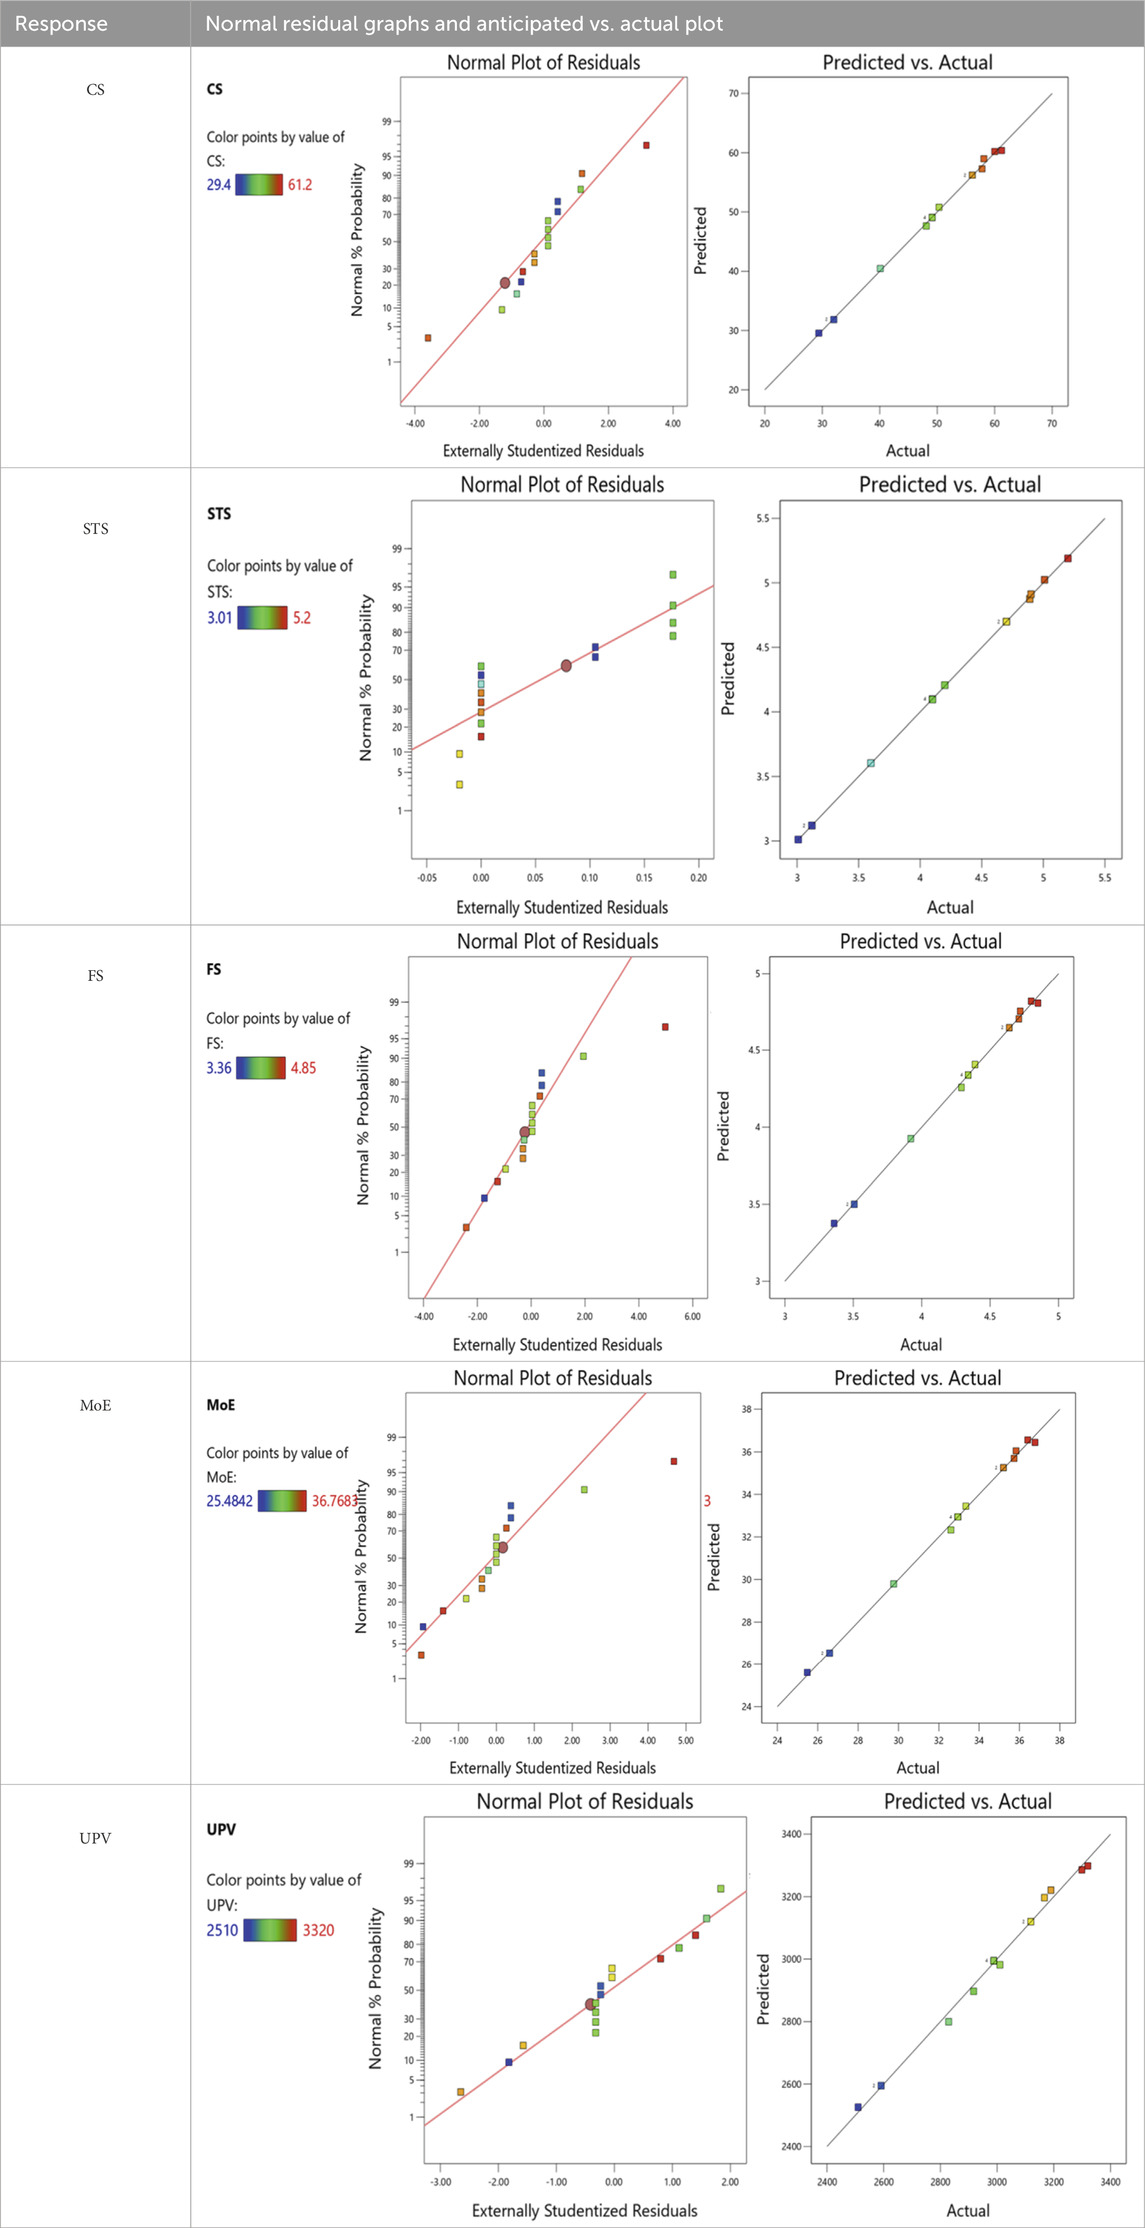
Equation 3 is derived from the developed model, where y represents the responses (Khan et al., 2023b). The aforementioned equation possesses the capability to forecast the resultant output by considering the input factors. This model has two input variables, namely, A and B. The PEF plastic aggregate is denoted as A, while GNPs are denoted as B. In the given equations, all the input variables are articulated as percentages. The evaluation of model accuracy relies on two crucial diagnostic tools: actual vs. expected graphs and residual plots. There are two types of plots that can be generated using the response models depicted in Table 6. For a model to be deemed a good fit, it is crucial that the data points on a plot displaying observed vs. anticipated values roughly align with the regression line. The diagonal alignment of the data points in reference to the regression line suggests a robust correlation between the expected and observed values in this specific model. This statistic serves as a reliable measure of the accuracy of responses to models (Abdulkadir et al., 2021). Additionally, it provides a visual representation of residual plots that adhere to a normal distribution. This discovery provides support for the hypothesis that the erroneous constituents have an undeviating distribution since the linear association between the data points on the diagonal axis suggests linearity (Poorarbabi et al., 2020). One of the key attributes that distinguishes a dependable model is its defining trait (Cibilakshmi and Jegan, 2020). Approximately 90%–95% of residuals are predicted to fall within the −2 to +2 standard deviations range if they follow a normal distribution (Rahim et al., 2022). It is evident from the analysis that all residual plots exhibit conformity, hence indicating the models’ predictive accuracy. Equations 4–8 developed by the RSM can be used to predict the responses as per the constructed models by ANOVA.
6 Multi-purpose optimization model using RSM
6.1 Optimization model
Multi-purpose optimization, also called multi-response optimization, is a systematic approach used to optimize a system by determining the ideal combination of variables that optimizes many responses concurrently (Willden and Jensen, 2020). Many optimization challenges in real-world scenarios require identifying many optimum solutions while balancing competing goals (Aydar, 2018). Therefore, this strategy is the best option. The primary factor of the model was optimized to enhance its efficacy (Kravits et al., 2021). The goal function is of utmost importance in the optimization process since it defines the goals for the parameters, possibly including the importance level. The optimization process involves setting targets for dependent and independent variables using a wide variability of criteria (Senthil Kumar and Baskar, 2014). The primary goal of this approach is to get the desired outcomes while guaranteeing the integrity of the responses throughout the process. The optimization procedure for any specific solution is mostly determined by its desirable value, represented by the interval 0≤dj ≤ 1 (Abdulkadir and Mohammed, 2020). The range of this value spans from 0 to 1. By increasing the value of the dj variable, the resulting outcome can be rendered more advantageous, which is expressed as a percentage (Rizalman and Lee, 2020). The multi-objective optimization approach incorporates the use of the mathematical mean of desirability ratings for each solution (Achara et al., 2019). Equation 9 illustrates the means via which the desirability value of the combined response may be determined.
The value of the variable “n” denotes the total number of replies considered during the optimization process. The symbol “rᵢ” represents the significance assigned to each unique function, ranging from 1 (low importance) to 5 (high importance).
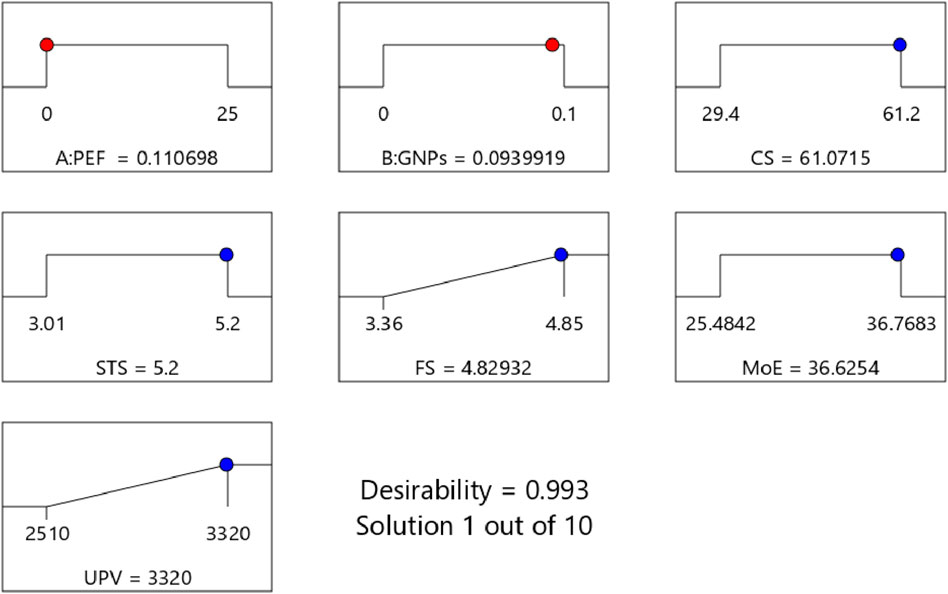
In this case, the same approach was used, and the desirability criterion was set between 0% and 1%. When the desirability value approaches 1%, it signifies a more favorable result for the model and enhances the reliability of predicting the dependent variable’s best outcomes. The demonstration of varied optimization aims is evident. The data shown in Table 7; Figure 18 illustrate that the optimization objectives for CS, FS, STS, and MoE are established within a specified range. Conversely, the optimization goal for UPV is focused on minimizing the replies. The values for CS, STS, FS, MoE, and UPV are 61.07, 5.2, 4.82, 36.62, and 3,320, respectively, falling within the acceptable range based on outcome optimization. According to the model’s variability, the model’s attractiveness is 98%, demonstrating that it produces highly pertinent outcomes. The optimization strategy yielded very favorable results. A desirability factor diagram is shown in Figure 18.
7 Practical implications of the research
Using PEF waste plastic as the coarse aggregate in concrete provides a sustainable method for recycling plastic waste in construction. The discovery helps decrease the environmental effect of plastic waste buildup in landfills and seas by replacing traditional coarse aggregates with PEF waste plastic. Combining GNPs with PEF waste plastic in concrete improves mechanical qualities such CS, FS, and durability via synergistic actions. The enhanced mechanical characteristics of PEF and GNP composite concrete suggest its suitability for structural applications, improving the performance and durability of building projects. Creating sustainable concrete mixes from PEF waste plastic and GNPs offers economic benefits for anyone involved in the building sector.
8 Conclusion
This research aimed to inspect the effect of using PEF waste plastic material as an additive to coarse aggregate, together with GNPs, to improve strength. A series of studies was undertaken to explore the synergistic impact of both materials on CS, STS, FS, MoE, and UPV. An environmental study was conducted to examine the effects of both PEF waste plastic and GNPs on the environment. Response surface models were built to analyze the reactions of both materials to the properties of concrete. The study is very significant as it has the capacity to radically transform the manufacturing process of concrete. Through the implementation of a tailored and enhanced approach, it may efficiently harness the combined advantages of PEF waste material and GNPs, resulting in notable progress. This not only contributes to the accumulation of knowledge in the area but also generates prospects for the development of environmentally friendly and long-lasting concrete compositions in real-world building scenarios. The following conclusions were drawn in light of this investigation:
1) In this study, two independent variables served as input variables for a response surface model construction and multi-objective optimization: PEF, which varied between 0% and 25%, and GNPs, which spanned the range of 0%–0.1%. The predictive and adjusted values of CS, STS, FS, MoE, and UPV were determined. The quadratic models were proposed as the most appropriate models for all the responses, including CS, STS, FS, UPV, and MoE.
2) Upon conducting an ANOVA with a 5% level of relevance and a confidence level of 95%, it was observed that the coefficient of determination (R2) represented a substantial degree of significance for the response models. The R2 values exhibited a range of 97.55%–98.78% across all the replies that were taken into account.
3) The use of multifaceted contour diagrams and three-dimensional response surface diagrams offered visual depictions of the influence of alterations in the components and their interdependencies on the observed responses. Many studies have found that adding more GNPs to a concrete mixture can improve its strength and durability. However, when PEF material is added to concrete in amounts greater than 5%, it has been observed to have a detrimental effect on its CS. Research showed that when 5% PEF was mixed with 0.1% GNPs, there were noteworthy improvements in CS, STS, and FS. The improvements were 9.10% for CS, 18.18% for STS, and 4.45% for FS. It was found that addition of more than 5% PEF as a coarse gravel replacement reduces the UPV and MoE. Concrete containing 5% of PEF and 0.10% of GNPs increases the MoE by 4.45%. Meanwhile, the mix proportion containing 0% of PEF and 0.08% of GNPs has UPV 3.75% greater than that of the control mix.
4) Concrete containing 0% of PEF and 0% of GNPs has very low embodied carbon, while it was found that accumulation of PEF and GNPs increases the EC. Concrete with 25% substitution of coarse gravel with 0.1% of GNPs has the maximum EC, which is 161% more than that of the control mix.
5) The multi-purpose optimization examination shows that the ideal values for the variables were PEF at 25% and GNPs at 0%. The adjustment effectively improved the qualities as planned without sacrificing responsiveness. The models were confirmed by experimentation, showing a discrepancy of less than 5% between the observed and anticipated response values.
Using highly descriptive statistical modeling and optimization, this research confirmed a substantial impact of both PEF and GNPs on concrete properties. The subtlety of the interaction of PEF and GNPs in the concrete matrix plays an important role in balancing the increase in mechanical properties with an acceptable level of an environmental footprint. In other words, miraculously, the ideal concentration of both materials resulted in improvements in strength and durability, with a very reasonable increase in embodied carbon. It is well-grounded, therefore, that all these results—especially caution and innovation with material substitution within the concrete that could improve performance—would be balanced against the environmental sustainability of such a change. Many more similar studies in the direction of the conducted one will be continued with other composites and their influence on the environment, refining our understanding of the sustainability of construction materials. Therefore, this research will, without a doubt, have far-reaching development in the field of material science, and it will be exemplary to the whole world in a more sustainable-construction practice sense.
According to the results obtained from the present study, it is advisable to undertake additional research in order to enhance the adhesion between PEF plastic and the cementitious matrix. The application of surface treatment methods to plastic components in concrete may accomplish this. To get a deeper understanding of the impact of adding PEF to concrete-containing GNPs, further mechanical tests such as durability, freeze–thaw resistance, and penetration of chloride ions tests should be carried out. An extended research should be conducted to evaluate the long-term performance and endurance of concrete using PEF and GNPs. This study will focus on analyzing the behavior of concrete over an extended period to understand degradation reasons and potential changes in the characteristics of materials such as PEF and GNPs. The focus of the optimization in this study was primarily on the mechanical properties of the concrete mixtures as these are critical for assessing the structural performance and durability of the material in practical applications. Although EC is an important factor in evaluating the overall environmental impact of concrete, the primary objective of this study was to investigate the enhancements in mechanical performance achieved through the incorporation of PEF and GNPs. By concentrating on mechanical properties, this research aimed to establish a foundational understanding of how these materials influence strength, workability, and durability. However, it is recommended for the future studies to incorporate EC into future optimization for a more comprehensive assessment of sustainability.
Data availability statement
The raw data supporting the conclusions of this article will be made available by the authors, without undue reservation.
Author contributions
MK: conceptualization, data curation, formal analysis, funding acquisition, investigation, methodology, software, writing–original draft, and writing–review and editing. TN: methodology, project administration, resources, and writing–review and editing. HA: supervision, validation, and writing–review and editing. MA: resources, software, validation, and writing–review and editing. OB: resources, software, validation, visualization, and writing–review and editing.
Funding
The author(s) declare that financial support was received for the research, authorship, and/or publication of this article. This research was funded by Taif University, Saudi Arabia, Project No. TU-DSPP-2024-33.
Acknowledgments
The authors extend their appreciation to Taif University, Saudi Arabia, for supporting this work through project number TU-DSPP-2024-33.
Conflict of interest
The authors declare that the research was conducted in the absence of any commercial or financial relationships that could be construed as a potential conflict of interest.
Publisher’s note
All claims expressed in this article are solely those of the authors and do not necessarily represent those of their affiliated organizations, or those of the publisher, the editors, and the reviewers. Any product that may be evaluated in this article, or claim that may be made by its manufacturer, is not guaranteed or endorsed by the publisher.
References
Abdalla, J. A., Hawileh, R. A., Bahurudeen, A., Jittin, V., Syed Ahmed Kabeer, K. I., and Thomas, B. S. (2023). Influence of synthesized nanomaterials in the strength and durability of cementitious composites. Case Stud. Constr. Mater. 18, e02197. doi:10.1016/j.cscm.2023.e02197
Abdulkadir, B., and Mohammed, I. (2020). Rsm analysis and study on the 6 Months compressive strength development and shrinkage behaviour of high volume fly ash rubberized ECC (HVFA-RECC). Int. J. Adv. Res. Eng. Technol. 11 (9), 965–980. doi:10.34218/IJARET.11.09.2020.095
Abdulkadir, I., Mohammed, B. S., Liew, M. S., and Wahab, M. M. A. (2021). Modelling and multi-objective optimization of the fresh and mechanical properties of self-compacting high volume fly ash ECC (HVFA-ECC) using response surface methodology (RSM). Case Stud. Constr. Mater. 14 (March), e00525. doi:10.1016/j.cscm.2021.e00525
Abu-Saleem, M., Zhuge, Y., Hassanli, R., Ellis, M., Rahman, M. M., and Levett, P. (2021). Evaluation of concrete performance with different types of recycled plastic waste for kerb application. Constr. Build. Mater. 293, 123477. doi:10.1016/j.conbuildmat.2021.123477
Achara, B. E., Mohammed, B. S., and Liew, M. S. (2019). Bond behaviour of nano-silica-modified self-compacting engineered cementitious composite using response surface methodology. Constr. Build. Mater. 224, 796–814. doi:10.1016/j.conbuildmat.2019.07.115
Ahmed, A., Shah, S. K. H., Ahmad, N., Ali, U., Malik, A. A., and Iqbal, M. J. (2024). Feasibility of utilizing recycled concrete aggregate blended with waste tire rubber and drywall waste as pavement subbase material. J. Mater. Cycles Waste Manag. 26, 2278–2293. doi:10.1007/s10163-024-01967-x
Ali, K., Saingam, P., Qureshi, M. I., Saleem, S., Nawaz, A., Mehmood, T., et al. (2023). Influence of recycled plastic incorporation as coarse aggregates on concrete properties. Sustainability 15 (7), 5937. doi:10.3390/su15075937
Almeshal, I., Tayeh, B. A., Alyousef, R., Alabduljabbar, H., and Mohamed, A. M. (2020). Eco-friendly concrete containing recycled plastic as partial replacement for sand. J. Mater. Res. Technol. 9 (3), 4631–4643. doi:10.1016/j.jmrt.2020.02.090
Almohana, A. I., Abdulwahid, M. Y., Galobardes, I., Mushtaq, J., and Almojil, S. F. (2022). Producing sustainable concrete with plastic waste: a review. Environ. Challenges 9, 100626. doi:10.1016/j.envc.2022.100626
Al-Tayeb, M., Abu Aisheh, Y., Qaidi, S., and Tayeh, B. (2022). Experimental and simulation study on the impact resistance of concrete to replace high amounts of fine aggregate with plastic waste. Case Stud. Constr. Mater. 17, e01324. doi:10.1016/j.cscm.2022.e01324
Aydar, A. Y. (2018). Utilization of response surface methodology in optimization of extraction of plant materials. Stat. Approaches Emphas. Des. Exp. Appl. Chem. Process. doi:10.5772/intechopen.73690
Azmee, N. M., and Shafiq, N. (2018). Ultra-high performance concrete: from fundamental to applications. Case Stud. Constr. Mater. 9, e00197. doi:10.1016/j.cscm.2018.e00197
Chintalapudi, K., and Pannem, R. M. (2020). The effects of Graphene Oxide addition on hydration process, crystal shapes, and microstructural transformation of Ordinary Portland Cement. J. Build. Eng. 32, 101551. doi:10.1016/j.jobe.2020.101551
Chong, B. W., and Shi, X. (2023). Meta-analysis on PET plastic as concrete aggregate using response surface methodology and regression analysis. J. Infrastruct. Preserv. Resil. 4 (1), 2. doi:10.1186/s43065-022-00069-y
Cibilakshmi, G., and Jegan, J. (2020). A DOE approach to optimize the strength properties of concrete incorporated with different ratios of PVA fibre and nano-Fe2O3. Adv. Compos. Lett. 29, 2633366X2091388–16. doi:10.1177/2633366X20913882
Collins, F. (2010). Inclusion of carbonation during the life cycle of built and recycled concrete: influence on their carbon footprint. Int. J. Life Cycle Assess. 15 (6), 549–556. doi:10.1007/s11367-010-0191-4
Cushman, B. R. (2017). Energy consumption Energy type. Available at: http://www.dartmouth.edu/∼cushman/books/Numbers/Chap1-Materials.pdf.
Dawood, A. O., AL-Khazraji, H., and Falih, R. S. (2021). Physical and mechanical properties of concrete containing PET wastes as a partial replacement for fine aggregates. Case Stud. Constr. Mater. 14, e00482. doi:10.1016/j.cscm.2020.e00482
Engineering, S. (2018). MODULUS OF ELASTICITY AND ULTRASONIC PULSE VELOCITY OF CONCRETE CONTAINING POLYETHYLENE TEREPHTHALATE (PET). WASTE HEATED HIGH Temp. 13 (11), 3577–3592.
Gagg, C. R. (2014). Cement and concrete as an engineering material: an historic appraisal and case study analysis. Eng. Fail. Anal. 40, 114–140. doi:10.1016/j.engfailanal.2014.02.004
Ghani, M. U., Sun, B., Houda, M., Zeng, S., khan, M. B., ElDin, H. M., et al. (2024). Mechanical and environmental evaluation of PET plastic-graphene nano platelets concrete mixes for sustainable construction. Results Eng. 21, 101825. doi:10.1016/j.rineng.2024.101825
Gladwin Alex, A., Kedir, A., and Gebrehiwet Tewele, T. (2022). Review on effects of graphene oxide on mechanical and microstructure of cement-based materials. Constr. Build. Mater. 360, 129609. doi:10.1016/j.conbuildmat.2022.129609
Hammond, G., and Jones, C. (2014). The inventory of carbon and energy (ICE). A BRIA guid. Embodied Carbon 22. Available at: https://greenbuildingencyclopaedia.uk/wp-content/uploads/2014/07/Full-BSRIA-ICE-guide.pdf.
Hanis, N., Gani, P., Chuck, N., and Uvarajan, T. (2021). Utilisation of plastic waste as aggregate in construction materials: a review. Constr. Build. Mater. 296, 123669. doi:10.1016/j.conbuildmat.2021.123669
Hu, S., Tang, H., and Han, S. (2021). Energy absorption characteristics of PVC coarse aggregate concrete under impact load. Int. J. Concr. Struct. Mater. 15 (1), 26. doi:10.1186/s40069-021-00465-w
Islam, J. (2022). Comparative study of concrete with polypropylene and polyethylene terephthalate waste plastic as partial replacement of coarse aggregate. Adv. Civ. Eng. 2022, 1–13. doi:10.1155/2022/4928065
Islam, M. J., Meherier, M. S., and Islam, A. K. M. R. (2016). Effects of waste PET as coarse aggregate on the fresh and harden properties of concrete. Constr. Build. Mater. 125, 946–951. doi:10.1016/j.conbuildmat.2016.08.128
Islam, M. J., and Shahjalal, M. (2021). Effect of polypropylene plastic on concrete properties as a partial replacement of stone and brick aggregate. Case Stud. Constr. Mater. 15, e00627. doi:10.1016/j.cscm.2021.e00627
Islam, M. J., Shahjalal, M., and Haque, N. M. A. (2022). Mechanical and durability properties of concrete with recycled polypropylene waste plastic as a partial replacement of coarse aggregate. J. Build. Eng. 54, 104597. doi:10.1016/j.jobe.2022.104597
Ismail, F. I., Shafiq, N., Abbas, Y. M., Bheel, N., Benjeddou, O., Ahmad, M., et al. (2022). Behavioral assessment of graphene nanoplatelets reinforced concrete beams by experimental, statistical, and analytical methods. Case Stud. Constr. Mater. 17, e01676. doi:10.1016/j.cscm.2022.e01676
Ismail, S., Kwan, W. H., and Ramli, M. (2013). Sustainable aggregates: the potential and challenge for natural resources conservation. Procedia - Soc. Behav. Sci. 101, 100–109. doi:10.1016/j.sbspro.2013.07.183
Ismail, Z. Z., and AL-Hashmi, E. A. (2008). Use of waste plastic in concrete mixture as aggregate replacement. Waste Manag. 28 (11), 2041–2047. doi:10.1016/j.wasman.2007.08.023
Jaramillo, L. J., and Kalfat, R. (2023). Fresh and hardened performance of concrete enhanced with graphene nanoplatelets (GNPs). J. Build. Eng. 75, 106945. doi:10.1016/j.jobe.2023.106945
Jia, C., Pang, M., Lu, Y., Liu, Y., Zhuang, M., Liu, B., et al. (2022). Graphene environmental footprint greatly reduced when derived from biomass waste via flash Joule heating. One Earth 5 (12), 1394–1403. doi:10.1016/j.oneear.2022.11.006
Jiang, Z., Sevim, O., and Ozbulut, O. (2021). Mechanical properties of graphene nanoplatelets-reinforced concrete prepared with different dispersion techniques. Constr. Build. Mater. 303, 124472. doi:10.1016/j.conbuildmat.2021.124472
Jones, R., Mccarthy, M., and Newlands, M. (2011). Fly ash route to low embodied CO 2 and implications for concrete construction. World Coal Ash Conf.
Juki, M. I., Awang, M., Annas, M. M. K., Boon, K. H., Othman, N., binti Abdul Kadir, A., et al. (2013). Relationship between compressive, splitting tensile and flexural strength of concrete containing granulated waste polyethylene terephthalate (PET) bottles as fine aggregate. Adv. Mater. Res. 795, 356–359. doi:10.4028/www.scientific.net/AMR.795.356
Khan, M. B., Iqbal Khan, M., Shafiq, N., Abbas, Y. M., Imran, M., Fares, G., et al. (2023b). Enhancing the mechanical and environmental performance of engineered cementitious composite with metakaolin, silica fume, and graphene nanoplatelets. Constr. Build. Mater. 404, 133187. doi:10.1016/j.conbuildmat.2023.133187
Khan, M. B., Shafiq, N., Waqar, A., Radu, D., Cismaș, C., Imran, M., et al. (2023c). Effects of jute fiber on fresh and hardened characteristics of concrete with environmental assessment. Buildings 13, 1691. doi:10.3390/buildings13071691
Khan, M. B., Waqar, A., Bheel, N., Shafiq, N., and Sor, N. H. (2023a). Optimization of fresh and mechanical characteristics of carbon fiber-reinforced concrete composites using response surface technique, 1–32.
Kiani Mavi, R., Gengatharen, D., Kiani Mavi, N., Hughes, R., Campbell, A., and Yates, R. (2021). Sustainability in construction projects: a systematic literature review. Sustainability 13 (4), 1932. doi:10.3390/su13041932
Kravits, J., Kasprzyk, J. R., Chauhan, S., and Kumar, R. (2021). Modelling and optimization of the impact resistance of graphene oxide modified crumb rubber-ECC using response surface methodology modelling and optimization of the impact resistance of graphene oxide modified crumb rubber-ECC using response surface methodology. IOP Conf. Ser. Mater. Sci. Eng. doi:10.1088/1757-899X/1197/1/012043
Kumar, R., Shafiq, N., Kumar, A., and Jhatial, A. A. (2021). Investigating embodied carbon, mechanical properties, and durability of high-performance concrete using ternary and quaternary blends of metakaolin, nano-silica, and fly ash. Environ. Sci. Pollut. Res. 28 (35), 49074–49088. doi:10.1007/s11356-021-13918-2
Lv, S., Ma, Y., Qiu, C., Sun, T., Liu, J., and Zhou, Q. (2013). Effect of graphene oxide nanosheets of microstructure and mechanical properties of cement composites. Constr. Build. Mater. 49, 121–127. doi:10.1016/j.conbuildmat.2013.08.022
Marques, D. V., Barcelos, R. L., Silva, H. R. T., Egert, P., Parma, G. O. C., Girotto, E., et al. (2018). Recycled polyethylene terephthalate-based boards for thermal-acoustic insulation. J. Clean. Prod. 189, 251–262. doi:10.1016/j.jclepro.2018.04.069
Poorarbabi, A., Ghasemi, M., and Azhdary Moghaddam, M. (2020). Concrete compressive strength prediction using non-destructive tests through response surface methodology. Ain Shams Eng. J. 11 (4), 939–949. doi:10.1016/j.asej.2020.02.009
Rahim, N. I., Mohammed, B. S., Abdulkadir, I., and Dahim, M. (2022). Effect of crumb rubber, fly ash, and nanosilica on the properties of self-compacting concrete using response surface methodology. Mater. (Basel) 15 (4), 1501. doi:10.3390/ma15041501
Rizalman, A. N., and Lee, C. C. (2020). Comparison of artificial neural network (ANN) and response surface methodology (RSM). Predict. Compressive Strength POFA Concr. 4, 210–216. Available at: http://arqiipubl.com/ams.
Sau, D., Shiuly, A., and Hazra, T. (2023). Utilization of plastic waste as replacement of natural aggregates in sustainable concrete: effects on mechanical and durability properties. Int. J. Environ. Sci. Technol. 21, 2085–2120. doi:10.1007/s13762-023-04946-1
Saxena, R., Siddique, S., Gupta, T., Sharma, R. K., and Chaudhary, S. (2018). Impact resistance and energy absorption capacity of concrete containing plastic waste. Constr. Build. Mater. 176, 415–421. doi:10.1016/j.conbuildmat.2018.05.019
Senthil Kumar, K., and Baskar, K. (2014). Response surfaces for fresh and hardened properties of concrete with E-waste (HIPS). J. Waste Manag. 2014, 1–14. doi:10.1155/2014/517219
Sharma, R., Gupta, M., Sahoo, K., and Bashani, K. (2021). Recycled plastic as coarse aggregate for structural concrete.
Tahir, H., Khan, M. B., Shafiq, N., Radu, D., Nyarko, M. H., Waqar, A., et al. (2023). Optimisation of mechanical characteristics of alkali-resistant glass fibre concrete towards sustainable construction. Sustainability 15, 11147. doi:10.3390/su151411147
Tao, J., Wang, X., Wang, Z., and Zeng, Q. (2019). Graphene nanoplatelets as an effective additive to tune the microstructures and piezoresistive properties of cement-based composites. Constr. Build. Mater. 209, 665–678. doi:10.1016/j.conbuildmat.2019.03.173
Thilakarathna, P. S. M., Seo, S., Baduge, K. S. K., Lee, H., Mendis, P., and Foliente, G. (2020). Embodied carbon analysis and benchmarking emissions of high and ultra-high strength concrete using machine learning algorithms. J. Clean. Prod. 262, 121281. doi:10.1016/j.jclepro.2020.121281
Turner, L. K., and Collins, F. G. (2013). Carbon dioxide equivalent (CO2-e) emissions: a comparison between geopolymer and OPC cement concrete. Constr. Build. Mater. 43, 125–130. doi:10.1016/j.conbuildmat.2013.01.023
Umasabor, R. I., and Daniel, S. C. (2020). The effect of using polyethylene terephthalate as an additive on the flexural and compressive strength of concrete. Heliyon 6 (8), e04700. doi:10.1016/j.heliyon.2020.e04700
Waqar, A., Almujibah, H., Khan, M. B., Alotaibi, S., and Elhassan, A. A. M. (2023c). Factors influencing adoption of digital twin advanced technologies for smart city development: evidence from Malaysia. Build. (Basel). 13, 775. doi:10.3390/buildings13030775
Waqar, A., Bheel, N., Shafiq, N., Othman, I., Khan, M. B., Mansoor, M. S., et al. (2023a). Effect of volcanic pumice powder ash on the properties of cement concrete using response surface methodology. J. Build. Pathol. Rehabil. 8 (1), 17. doi:10.1007/s41024-023-00265-7
Waqar, A., Othman, I., Radu, D., Ali, Z., and Almujibah, H. (2023b). Modeling the relation between building information modeling and the success of construction projects: a structural-equation-modeling approach applied sciences modeling the relation between building information modeling and the success of construction pro, 0–23.
Willden, C., and Jensen, W. A. (2020). Optimal designs with axial values. J. Qual. Technol. 52 (3), 235–248. doi:10.1080/00224065.2019.1571346
Keywords: polyethylene furanoate plastic waste, graphene nano-platelets, mechanical properties, environmental assessment, nano material
Citation: Khan MB, Najeh T, Almujibah H, Al Zouabi MG and Benjeddou O (2024) Evaluating the mechanical and environmental impact of PEF plastic waste incorporated with graphene nano-platelets in concrete. Front. Mater. 11:1424177. doi: 10.3389/fmats.2024.1424177
Received: 27 April 2024; Accepted: 12 September 2024;
Published: 11 October 2024.
Edited by:
Cristina Valles, The University of Manchester, United KingdomReviewed by:
Nahla Hilal, University of Fallujah, IraqZhangfan Jiang, University of Virginia, United States
Copyright © 2024 Khan, Najeh, Almujibah, Al Zouabi and Benjeddou. This is an open-access article distributed under the terms of the Creative Commons Attribution License (CC BY). The use, distribution or reproduction in other forums is permitted, provided the original author(s) and the copyright owner(s) are credited and that the original publication in this journal is cited, in accordance with accepted academic practice. No use, distribution or reproduction is permitted which does not comply with these terms.
*Correspondence: Muhammad Basit khan, bXVoYW1tYWRfMjEwMDIwMTRAdXRwLmVkdSxteQ==; Taoufik Najeh, dGFvdWZpay5uYWplaEBsdHUuc2U=
 Muhammad Basit Khan
 Taoufik Najeh
 Hamad Almujibah
 Mohammad Ghiath Al Zouabi
 Omrane Benjeddou