 Jian Wang
 Tao Liu1,2
94% of researchers rate our articles as excellent or good
Learn more about the work of our research integrity team to safeguard the quality of each article we publish.
Find out more
ORIGINAL RESEARCH article
Front. Mater., 04 July 2024
Sec. Polymeric and Composite Materials
Volume 11 - 2024 | https://doi.org/10.3389/fmats.2024.1421546
This article is part of the Research TopicInjection Molding of Polymeric and Composite MaterialsView all 6 articles
Warpage deformation is a typical phenomenon for polymer injection-molded parts, mainly caused by unbalanced cooling, and it is inevitable. Complex process parameters usually lead to uncontrollable thermal behavior of the polymer materials during injection molding and significant experimental errors. This work presents an experimental mold with a flat mold cavity and nine local heating sections to determine the exact effect of temperature difference on the thermal deformation of injection molded parts. Through local heating at different positions, different warpage deformation was caused. Experimental results demonstrated the relationship between the local temperature and the local thermal warpage. The predicted results of local temperature distribution by numerical simulation presented a strong negative correlation with the experimental results (R2 = 67%); however, the warpage prediction results by numerical simulation were moderate (R2 = 35%). Machine learning with neural networks was further conducted based on the experimental results. When more data was given with a suitable neural network structure, the model prediction accuracy of warpage could be up to 97%, while for the extrapolation test, the prediction accuracy could also be up to 89%. This local thermal heating technique and neural network modeling method can be applied in further theoretical investigation of warpage of injection molded parts and support the development of new models with high accuracy in predicting warpage deformation.
Polymer injection molding is a cornerstone of modern manufacturing, facilitating the production of many products that permeate nearly every aspect of human life. From intricate automotive components to everyday household items, the versatility and efficiency of injection molding have revolutionized industrial production (Fu et al., 2020). During the COVID-19 pandemic, this technology was crucial in producing medical protective equipment such as goggles, face shields, protective clothing, and disinfection medicine barrels (Pasha et al., 2022). However, the conventional manual approaches and trial-and-error methods used in injection molding have limitations, affecting both part quality and overall operational efficiency (Khosravani and Nasiri, 2020). Warpage deformation is a significant concern in injection molding production, as it can significantly affect the final products’ quality and usability. Warpage generally causes dimensional inaccuracies, resulting in parts that do not meet the required tolerances and specifications. Deformed parts may not fit or function properly when assembled with other components, which leads to functional deficiencies and even failure of the products to perform their intended purpose. Warpage deformation poses a significant challenge within the injection molding process. This phenomenon, characterized by distortions or deviations from the intended geometry, often arises due to uneven cooling during manufacturing and stands out as a common problem for injection molding (Zhao et al., 2022). Warpage not only impacts product appearance but also affects assembly and performance. Thermal warpage deformation, in particular, occurs when temperature differentials across the molded part exacerbate the issue (Jacques, 1982; Guerra et al., 2023). Understanding these intricacies is essential for mitigating warpage and ensuring manufactured products’ dimensional accuracy and structural integrity.
Theoretical underpinnings of thermal warpage in injection molded parts stem from the complex interplay of material properties, process parameters, and cooling dynamics. Despite the myriad benefits of injection molding, the unpredictable thermal behaviors of polymer materials during the process lead to significant experimental errors. Predicting thermal warpage deformation in injection molded parts is a complex task that involves understanding and modeling the interplay of various factors (Zhao et al., 2022). The material’s thermal conductivity, shrinkage characteristics, and coefficient of thermal expansion influence its response to temperature changes during cooling, and the variation of specific volume is the most critical parameter to characterize local shrinkage and the relative warpage (Wang and Mao, 2013; Hopmann et al., 2020; Wang et al., 2020; Hopmann et al., 2021). However, Hopmann et al. (2020) have shown that the local specific volume of the injection-molded part is different and challenging to predict and measure. Injection molding parameters such as melt temperature, mold temperature, injection pressure, and cooling rate significantly impact the cooling behavior and, consequently, the extent of warpage deformation (Sudsawat and Sriseubsai, 2018). Especially the cooling rate is different for different sections of the polymer melting in the mold cavity, which will lead to different specific volume variations (Sun et al., 2016; Wang et al., 2020) and, thus, warpage deformation. The design of the mold, including the placement and configuration of cooling channels, plays a crucial role in controlling temperature distribution and minimizing warpage (Kanbur et al., 2020). In addition, computational methods, such as finite element analysis (FEA) and computational fluid dynamics (CFD), are commonly employed to simulate the cooling process and predict thermal warpage deformation. These simulations involve modeling the material behavior, heat transfer phenomena, and mechanical responses to predict the final shape of the molded part (Guo et al., 2012; Zhang et al., 2018; Divekar et al., 2022). Using numerical simulation, Tillmann et al. (2024) demonstrated that introducing an algorithm can reduce warpage significantly. However, experimental errors and the differences between experiments and simulations still influence prediction accuracy. Researchers have increasingly turned to advanced techniques, including neural network modeling and artificial intelligence, to address these challenges and enhance warpage prediction capabilities. Machine learning algorithms, particularly neural networks, have emerged as powerful tools for predicting thermal warpage deformation (Liao et al., 2004). Recent studies (Chang et al., 2022; Fernández et al., 2023) have demonstrated the efficacy of machine learning algorithms in capturing the nuanced relationships between process variables and warpage deformation. By training on extensive experimental and simulated data, neural networks can learn complex patterns and relationships, enabling accurate warpage predictions under various conditions. Still, a suitable neural network structure is essential. Lee et al. (2022) investigated the ability of neural networks to represent linear or nonlinear relations between input and output parameters in injection molding. They found that the predicted results can be relatively better by dividing the linear and nonlinear data into two groups. Moreover, experimental studies involving temperature measurements, strain analysis, and physical observations provide valuable data for validating simulation results and refining predictive models (Farahani et al., 2022). A data-driven predictive framework could be established for injection molding to obtain the exact in-mold data. Gim et al. (2024) pointed out that the in-mold condition as the transient process conditions in actual processing space should be considered, and they proposed a new process optimization method by explainable artificial intelligence.
In summary, predicting thermal warpage deformation in injection molded parts requires a multidisciplinary approach integrating theoretical understanding, numerical simulation, experimental validation, and advanced computational techniques. Despite advancements in numerical simulation techniques, accurately predicting warpage deformation remains a formidable challenge. The inherent complexities of injection molding processes and the non-linear behavior of polymer materials often confound traditional simulation approaches. Machine learning with neural network models shows good prediction accuracy but is still limited to the quantity and error of experimental data and training time. Data-driven frameworks (Farahani et al., 2022) and explainable artificial intelligence (Gim et al., 2024) have shown good optimization results in reducing the warpage of injection-molded products. However, establishing a data-driven framework requires high costs and a unique mold design with sensors inside the cavity, which is unsuitable for regular production. Moreover, Gim et al. (2024) pointed out that the application of explainable artificial intelligence to process optimization has been hampered because analysis of in-mold conditions depends on domain knowledge and insight into the process. Additionally, conventional research only focuses on the maximum warpage of the part or the warpage at a specific position of the part as the detection target, and the data is single, which cannot reflect the overall warpage deformation of the product. Therefore, recent studies have illuminated the limitations of existing predictive models, emphasizing the need for deep learning of the thermal warpage of injection-molded products to address the issue.
Understanding the precise impact of temperature differentials on the thermal deformation of injection molded parts necessitates a comprehensive approach. Considering the in-mold conditions of local domains for injection-molded products, this work introduced a specially designed experimental mold with nine local thermal heating sections. By selectively heating distinct locations, varying degrees of warpage deformation were induced, offering valuable insights into the relationship between local temperature and thermal displacement. The total warpage deformation was examined by measuring nine measurement positions of the flat part. An infrared thermal imager was used to measure the surface temperature distribution of the injection-molded part after ejection, which can directly reflect the exact in-mold temperature condition. The experimental results established a clear relationship between local temperature and local thermal displacement. Numerical simulation was also conducted, but their efficacy in forecasting warpage deformation was comparatively limited. Machine learning techniques employing different neural networks and leveraging experimental results were conducted. With ample data and an appropriately structured neural network, prediction accuracy for warpage deformation was enhanced. This innovative fusion of local thermal heating techniques and neural network modeling advances our theoretical understanding of injection molded part warpages and paves the way for developing highly accurate prediction models. Such advancements hold immense promise for optimizing manufacturing processes and facilitating the creation of injection-molded parts with enhanced precision and reliability.
Polypropylene (PP) pellets (model number: PP 579S, SABIC) were selected for injection molding. Table 1 presents some fundamental property values of the material. These characteristics make PP a versatile polymer material that can be used to study a wide range of injection molding aspects, from flow behavior and mold filling to the final properties of the molded parts.
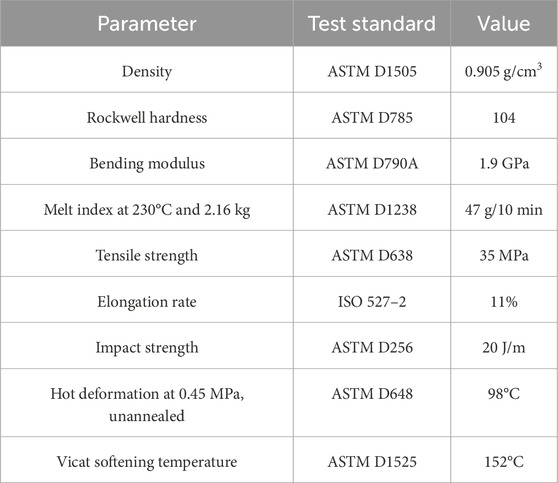
Table 1. Property parameter values of the PP for injection molding.
As shown in Figure 1A, a self-made fully electric desktop micro injection molding machine was applied to prepare the PP parts. Figure 1B depicts the mold with a flat cavity, and Figure 1C shows the PP part geometry with dimensions of 45 × 45 × 2 mm3. To realize the local thermal heating, 18 alumina ceramic heating elements (MCH, 24V, Beijing Baizheng Cable Co., Ltd., China) were applied behind the mold cavity. The positions of the 18 heating elements are shown in Figure 1D, and Figure 1E shows the elements. The 18 ceramic heaters were separately used for nine heating sections (I to IX). Each section can be heated with two ceramic heaters. Figure 1F presents the schematic of the particular structure of the heating mold plate. An insulation plate was used to fix the 18 elements and can also be used for thermal insulation. The heating element has a dimension of 15 × 7 × 1.2 mm3, heats up quickly, and can reach 200°C in 5 s and 480 C in 15 s. Four cooling channels were used to control the essential mold temperature.
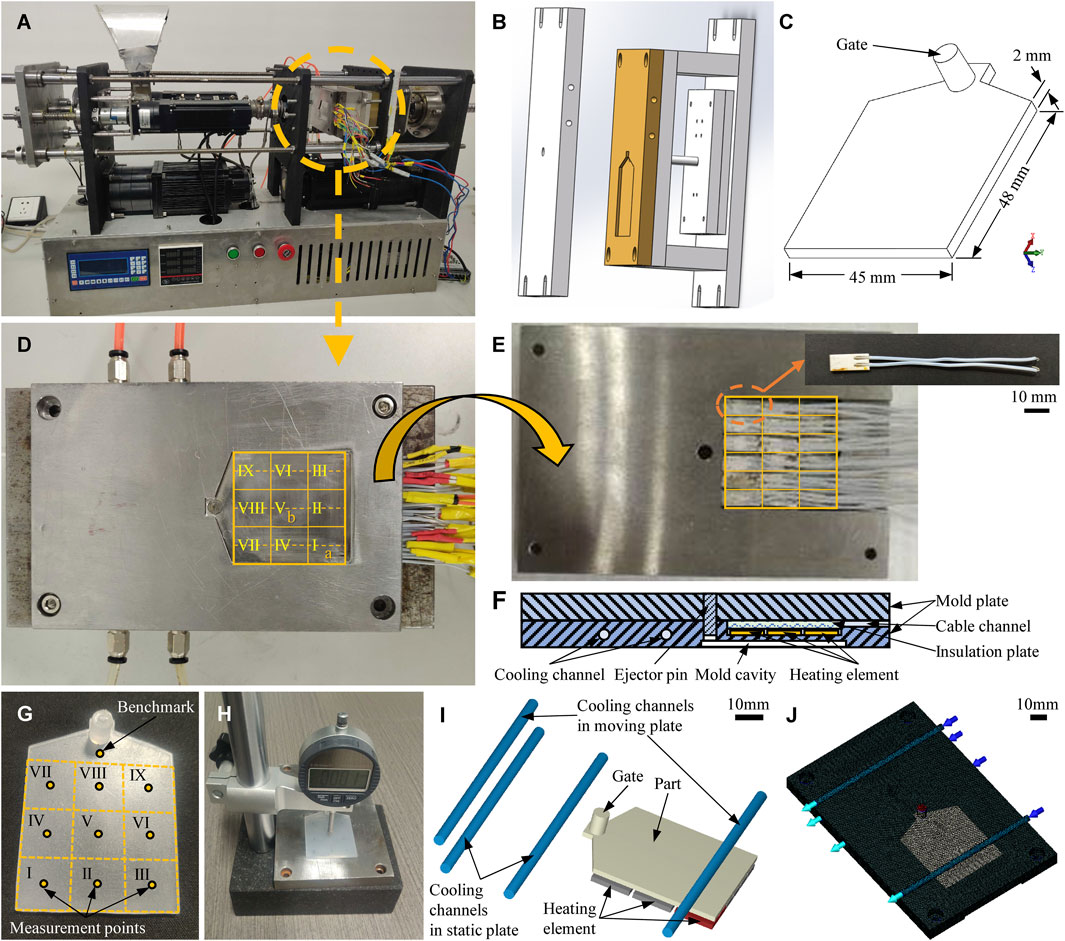
Figure 1. Self-made fully electric desktop micro injection molding machine (A), the simple experimental mold with a flat cavity (B), the flat part model (C), the moving plate with the flat cavity (D), reversed moving plate with 18 ceramic heating elements (E), the schematic picture showing the internal structures of the special mold plate with local heating elements, insulation plate, cable channel, and cooling channels (F), the injection molded part with the positions of the nine local heating sections and warpage deformation measurement points (G), the electronic dial gauge with a seat platform for the warpage measurement (H), the numerical simulation model (I), and the finite element meshing model (J).
The flat PP parts were produced under the same processing conditions except for the local heating temperature. Three barrel temperatures of the desktop injection molding machine were set at 210, 220, and 220°C, respectively. The nozzle temperature was 220°C. The injection speed was 16.5 mm/s. The reciprocating movement distance of the screw was 33 mm. The holding time was 12 s. The mold temperature was controlled at 40°C by a small mold temperature controller (WSC-1000, Changzhou Yineng Experimental Instrument Factory, Changzhou, China). All the experiments were conducted at the room temperature of 19°C. Table 2 shows the experimental setting of the nine heating sections. The heating sections of I to IX were separately turned on/off. Experiments No. 1 to 9 were conducted with one heating section, Experiment No. 10 was conducted with no heating, and Experiments No. 11 to 29 were conducted with two heating sections.
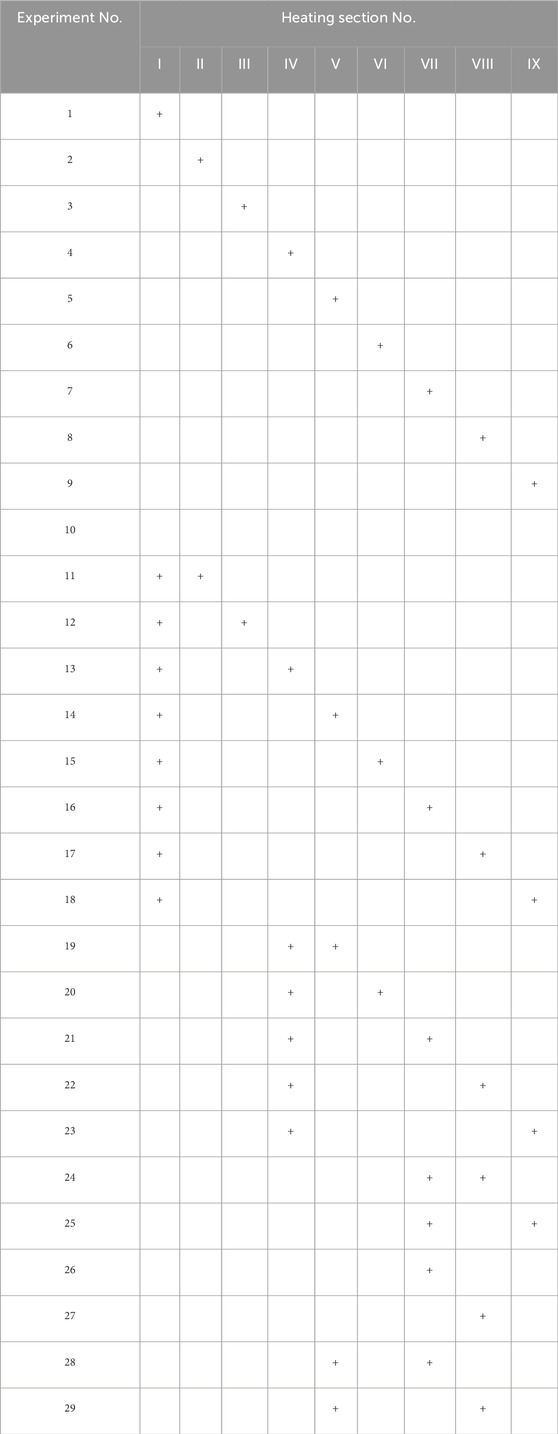
Table 2. Property parameter values of the PP for injection molding.
An infrared thermal imager (Tui260B, Ulide Technology Co., Ltd., China) was used to measure the temperature distribution. The temperature range of the device is −20°C–550°C, with a temperature resolution of 0.1°C and a test response time of ≤500 m. The thermal images were analyzed to identify specific coordinates within the image. RGB color data was then extracted from these coordinates, especially those corresponding to the nine measurement points (Figure 1G). The RGB color data were converted to grayscale values and then associated with the corresponding grayscale temperature values to get the temperature values of the specific coordinate positions.
The injection molded parts were set at room temperature for at least 24 h to release their internal stress. The warpage deformation of the thin plate part mainly occurred in the thickness direction (Z-direction). Thus, the Z-direction displacement of the nine sections on the flat part was measured. The point in the middle of each section was chosen as the measure position, as shown in Figure 1G. The benchmark was close to the sprue. An electronic dial gauge with a seat platform (Figure 1H) was used for the warpage measurement. The mold plate was directly used as a fixed platform, which can limit the horizontal movement of the parts and can also provide support, especially at the benchmark point where less warpage deformation occurred. The electronic dial gauge was zeroed according to the benchmark and then used to measure the Z-direction values at the nine points. Each experiment group included three parts to obtain the average value and the experimental error.
The software Moldex 3D (CoreTech System Co., Ltd.) was utilized for numerical simulation of the injection molding. The material property data for PP 579S can be directly found in the software’s database. The simulation encompassed the filling, packing, cooling, and warping stages. The processing conditions for simulation were mainly set according to the exact experiments. The plastic temperature was 220°C, the injection speed was 16.5 mm/s, the holding time was 12 s, the cooling time was 12 s, the mold temperature was 40°C, and the room temperature was 19°C. The calculated temperature distribution and warpage deformation in the Z-direction were mainly considered to facilitate comparison with the experimental results. Figure 1I shows the physical model of the mold cavity, heating elements, and the four cooling channels in the static and moving plates. The mold temperature of 40°C corresponded to the water temperature in the four cooling channels with an exact flow rate of 12 cm3/s. A power of 10 W was set for each heating element when it was used for “heating on” according to Table 2. Figure 1J shows the relative finite element mesh. There were 2740876 mesh elements. Nine probe positions were selected with the same points as the measurement points in Figure 1G. The temperature and Z-direction displacement values at these nine probe positions were applied for analysis and discussion.
A primary neural network with only one hidden layer was tried to model local thermal warpage deformation with different local heating. Table 3 shows the setting of the neural network structures. Four neural network structures were tried, and six groups of neural network modeling with different experimental data samples were conducted. Three neurons of the input layer in the network (3,6,1) include the X and Y coordinate positions of the warpage value test points and the situation of the relative heating section at that position (on or off represented by 1 and 0, respectively). Experimental warpage values of one and two heating sections were applied, respectively. When the experimental warpage values with two heating sections were used, the heating section number (HNo) was added as one input neuron (1, 0, and 2 represented 1 heating section, 0 heating section, and 2 heating sections). The network (4,8,1) with 1&0 HNo means the experimental warpage values with one heating section and no heating were used, while the network (4,8,1) with 1&0&2 HNo means the experimental warpage values with 1 heating section, 0 heating section, and 2 heating sections were all used. In addition, considering the exact temperature effect, the surface temperature of the part after ejection from the mold was also used as an input neuron in the network (5,10,1) with 1&0 HNo. & T. For the above modeling, the output neuron is only the Z-direction displacement of the warpage; thus, one position is related to one Z-direction warpage value. However, many repeated input values corresponded to different Z-direction warpage values; the nine Z-direction warpage values might not be related to the relative group of experimental input values. Therefore, we created a particular network with nine output neurons, and the input neurons included the heating section number, the X and Y coordinate positions, and their relative heating section situations. The neuron number for the hidden layer did not affect the fitting accuracy significantly, so it was determined by doubling the neuron number of the input layer for the first three types of networks, while nine neurons in the hidden layer were applied for the fourth type of network. For each fitting group, 75% of data samples were used for training, 15% for validation, and 15% for testing. The mean square error (MSE), R (regression coefficient), and R2 (R-squared) were respectively used to determine the accuracy of the model. MSE is the mean squared difference between outputs and responses, and R is the correlation between outputs and responses.
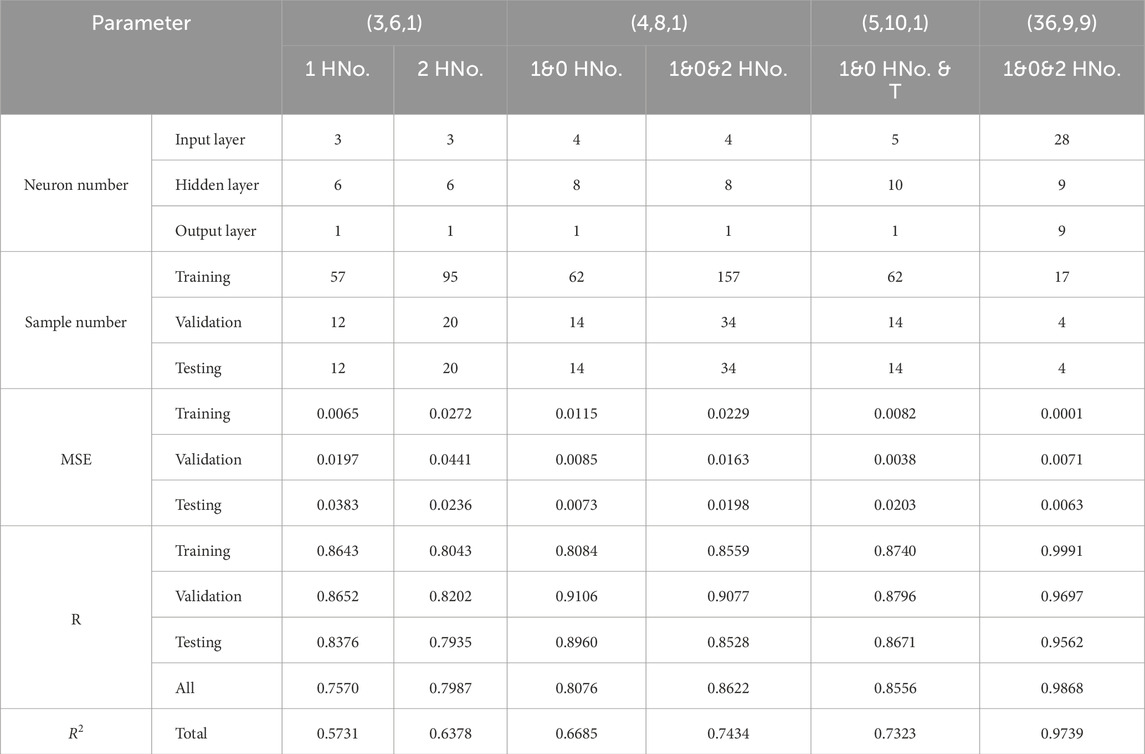
Table 3. The parameter settings of the four neural networks and six groups of neural network modeling and their relative results of MSE, R, and R2.
Figure 2A illustrates the measured temperature at two different positions (a and b in Figure 1D) on the surface of the mold cavity. Two mold temperatures (17°C and 40°C) for the cooling channels were applied. Typical exponential heating curves can be seen. The temperature increased quickly and then slowly. Figure 2B shows the cavity surface temperature at 5, 15, and 60 s. After 60 s, the temperature changed little. Thermal conduction is the primary mode of heat transfer in the metal mold. It indicates that different heating positions led to various temperature variations and maximum temperatures. The mold temperature controlled by the cooling channels also influenced the final maximum temperature of the local position. Especially at the mold temperature of 40 °C, the maximum temperature at section “a” was up to 51°C while section “b” had the maximum temperature of 67.5°C. Section “b” was close to the middle of the mold cavity; therefore, more heat can be maintained. Figure 2C illustrates the temperature distribution on the cavity surface with the first nine experiments (No. 1 to No.9) in Table 2, where one heating section was turned on but in different sections. The images indicate that the maximum temperatures were close to the heating section but not precisely because of the thermal conduction in the mold plate. Figure 2D gives the maximum cavity surface temperature for different experiments. Experimental No. 5 had the highest temperature value, 87.7°C, and corresponding to the heat section V was turned on. The lowest temperature of 61.5°C corresponded to the heat section III.
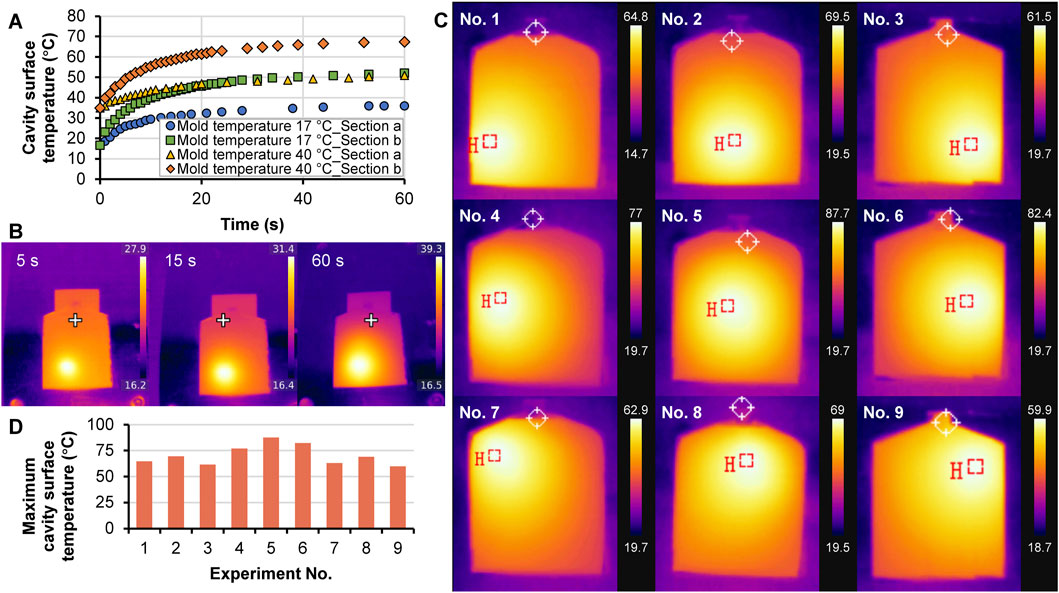
Figure 2. Cavity surface temperature as a function of time at two different mold temperatures (A), infrared thermal images of the cavity surface at three different times of 5, 16, and 60 s (B), infrared thermal images of the cavity surface at the stable heating time, corresponding to one heating section at the nine different sections (C), and the maximum cavity surface temperature corresponding to the nine experiments with one heating section turning on (D).
Figure 3A shows the infrared thermal image of the surface temperature of the injection molded parts after ejection without any local heating. Figure 3B shows the exact temperatures at the nine measurement points. A significant temperature difference can be seen, but it was distributed symmetrically. The highest temperature was located at the gate, the middle of the part, and the maximum temperature was 94.6°C at section V. Sections II, V, and VIII had higher temperatures because the polymer melt cooled slowly in the middle of the cavity. Section VIII was close to the gate and thus showed higher temperatures than section II. This indicates that the surface temperature of the injection molded part will be cooled fast because of the air convection heat dissipation after ejection. Figure 3C illustrates the temperature distribution at the part surface from the first nine experiments in Table 2. The maximum temperature positions corresponded to the positions of the heating section. However, the maximum temperature values differed due to different heating sections, material temperature, and heat transfer in the cavity. Figure 3D gives the exact temperatures at the nine measurement points. Sections II, V, and VIII still had relatively higher temperatures, but the highest temperature depended on the heat location. The temperature in each section was generally around 60°C–70°C, and the temperature in the heating section was between 90°C–100°C. Local heating influenced heat transfer, leading to a particular temperature distribution. The higher temperatures corresponded to the relative heating sections, respectively. The heating sections at sections II, V, and VIII caused a much higher temperature. For experiment No. 5, the highest temperature was up to 97.15°C due to the limited heat dissipation. Whereas, according to the temperature distribution of experiment No. 10 without local heating, the highest temperatures for each experiment (No. 1 to No. 9) were significantly unstable, especially for the temperature at section V. The temperature at section V in experiment No. 2 had a temperature of 79.57°C, which has a 15°C temperature difference compared with the temperature of 94.6°C for experiment No. 10 without local heating. The environmental temperature and the experimental errors, such as the test time of the infrared thermal imager after part ejection, caused this.
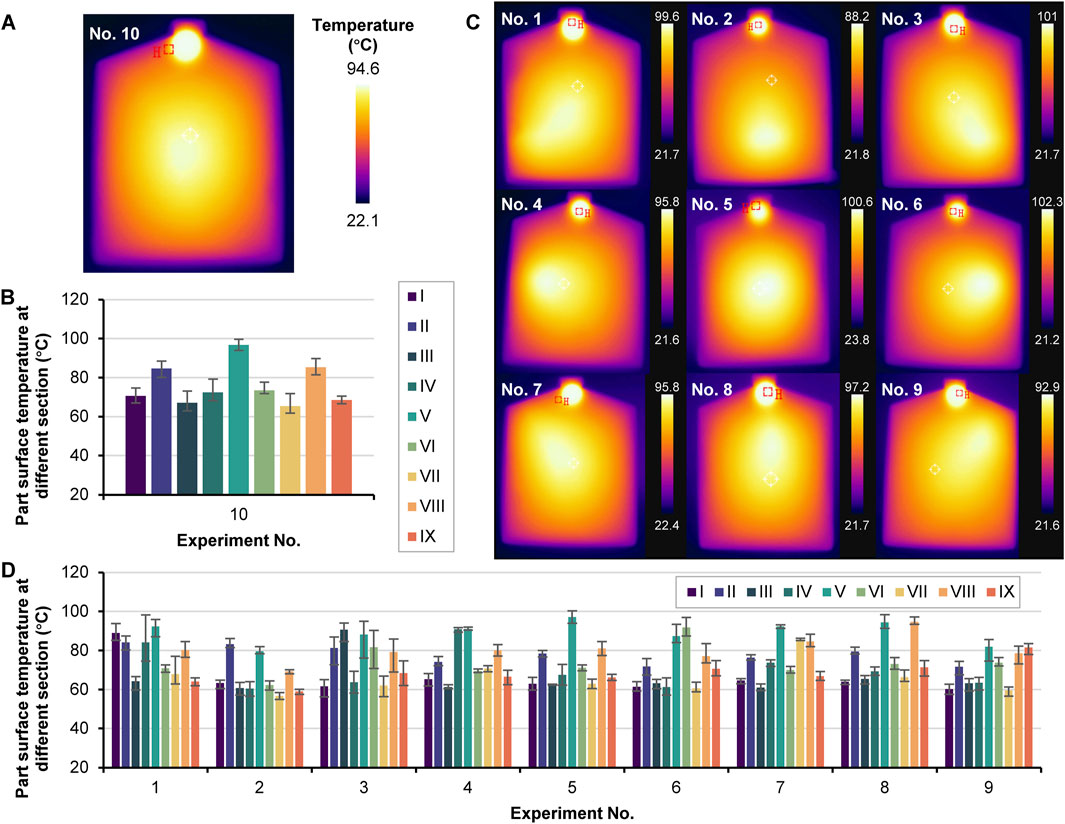
Figure 3. Infrared thermal image of the injection-molded part after ejection of experiment No. 10 (A), part surface temperature at the nine sections in experiment 10 (B), infrared thermal images of the part after ejection for the nine experiments No.1 to No. 9 (C), and part surface temperature at the nine sections of the parts prepared in experiments No. 1 to No. 9 (D).
Figure 4 A shows the pictures of the nine parts prepared by the respective experiments No. 1 to No. 9, in X and Y directions. It shows different warpage deformation degrees corresponding to different local heating. Figure 4B gives the exact warpage values in the Z direction of the part of experiment No. 10 without local heating. Different from the symmetrical distribution of part surface temperature after ejection, the warpage deformation for experiment No. 10 without local heating exhibited an unsymmetrical distribution, and the position of the highest warpage was close to section I where it was far from the gate and correlated with the gravity direction. This indicates the gravity effect on the filling balance of the mold cavity (Olivero and Altan, 2001; Baum et al., 2023). More flow melt was occupied in the middle of cavity section I with more heat, thus leading to more severe thermal residual stress (Torres-Alba et al., 2021) than in the other sections.
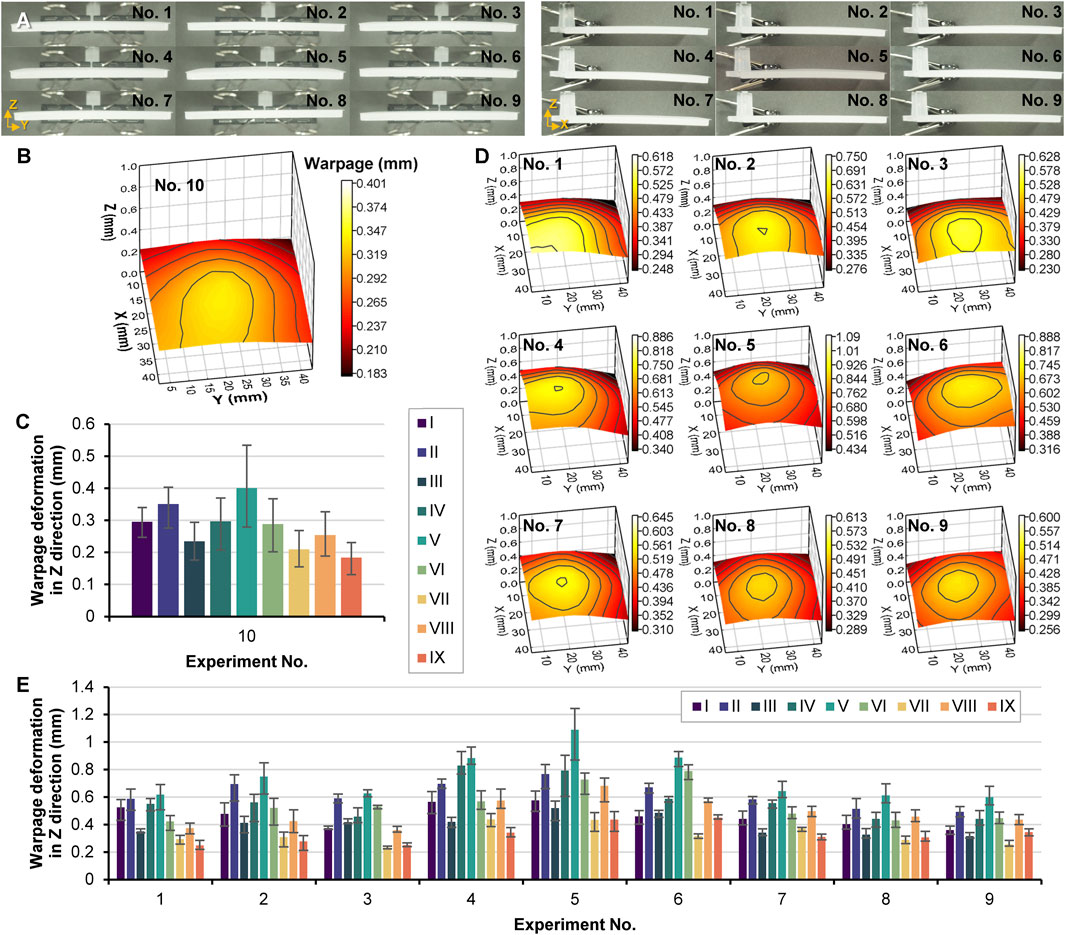
Figure 4. Injection molded parts in X and Y directions (A), measured warpage deformation of the part prepared in experiment No. 10 without local heating (B), measured warpage deformation in Z direction of the nine measurement points of the part prepared in experiment No. 10 (C), measured warpage deformation of the parts prepared in experiments No. 1 to 9 with one local heating section (D), measured warpage deformation in Z direction of the nine measurement points of the parts prepared in experiments No. 1 to 9 (E).
Figure 4C gives the exact warpage values at the nine measurement points. The most significant average warpage deformation was 0.401 mm. Figure 4D shows the warpage deformation in the Z direction of the nine parts of experiments No. 1 to 9, and Figure 4E gives the exact warpage deformation values at the nine measurement points of each part. In these nine groups of injection-molded parts, the maximum average warpage was 1.09 mm, located at section V in the middle of the part. Local heating did not change the position of the maximum warpage but affected the total geometry deformation.
Each group had three injection-molded parts for the warpage measurements. The experimental errors influence the quantitative analysis. Ten parts were injection molded at the same experimental condition for each group experiment (No. 1–9) to determine the experimental repeatability. The part weight repeatability was calculated with the equation:
where δm is the part weight repeatability (%), mi presents the weight of the part number i,
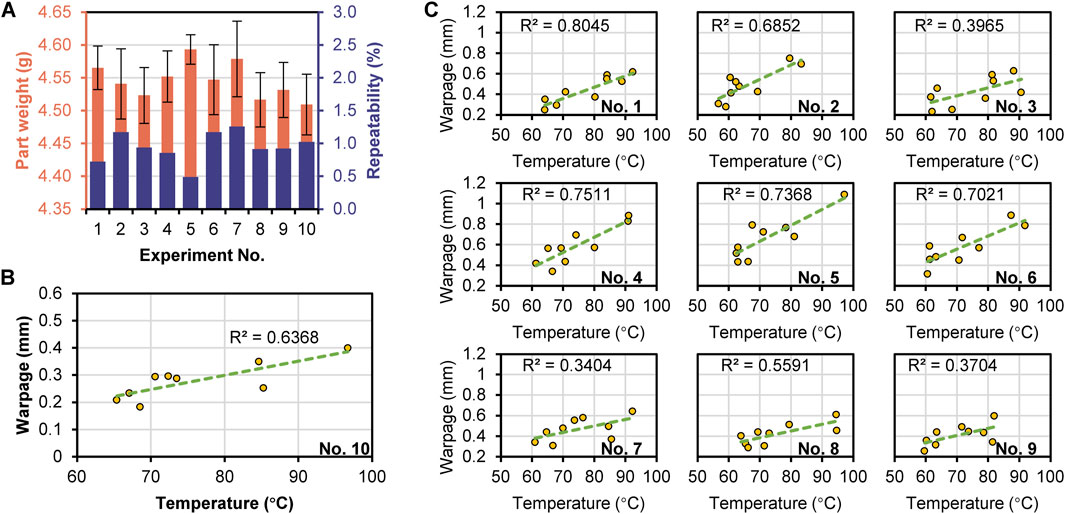
Figure 5. Part weight and repeatability of the experiments No. 1 to 10 (A), correlation between the part surface temperature and the warpage of the experiment No. 10 (B), correlation between the part surface temperature and the warpage of the experiments No. 1 to 9 (C).
Local heating mainly causes local warpage deformation, so the correlation between the warpage and the temperature was analyzed. The correlation coefficient (R2) can be calculated by the equation:
where y and x are the variables, and
Numerical simulation software considers the exact relationship between warpage and local heating with theoretical government equations, especially the energy conservation equation where the temperature, time, density or specific volume, specific heat, and thermal conductivity are considered. Figure 6A shows the simulated warpage in the Z direction of the part with the preparation conditions of experiment No.10. Figure 6B gives the exact warpage deformation values in the Z direction of the nine measurement points. The simulated warpage deformation trend was consistent with the experimental results. However, due to the different testing benchmarks, there were significant differences in numerical values. The critical difference between the simulation and experiment results is that the simulated warpage was symmetrical and showed no twist deformation like the experimental part (Figure 4B). Only when local heating was enabled did the symmetrical warpage change into unsymmetrical, as shown in Figures 6C, D.
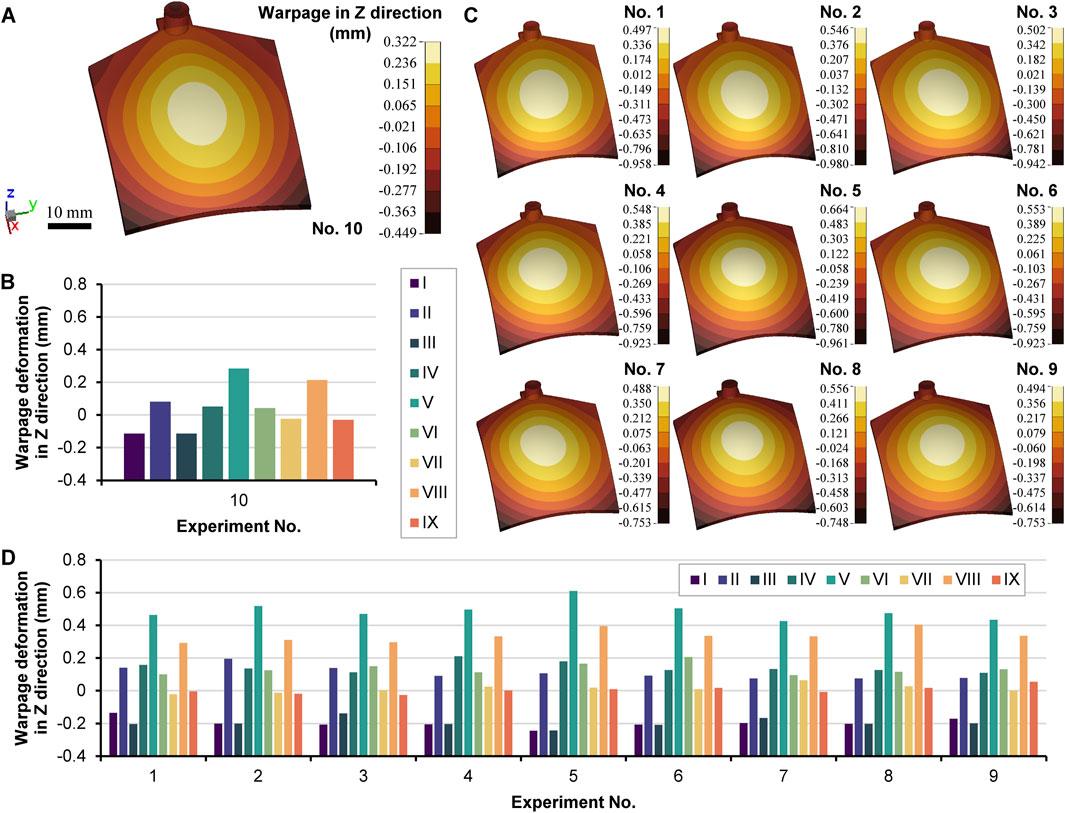
Figure 6. Simulated warpage deformation of the part related to experiment No. 10 without local heating (A), warpage in the Z direction of the nine measurement points in the part of experiment No. 10 (B), simulated warpage deformation of the parts related to experiments No. 1 to 9 with local heating (C), and warpage in the Z direction of the nine measurement points in the parts of experiments No. 1 to 9 (D).
Figure 7A compared the warpage values of the experiment and simulation at the nine sections of part of No. 10. The warpage values at sections II, V, and VIII of the experiment and simulation were all higher than those on either side. Neglecting the testing benchmark, the fundamental prediction values were close to the simulation results. Figure 7B shows the warpage comparison of experiments No. 1 to 9 with the simulated results. The simulated warpage at sections I, II, and III was lower, depending on the difference in coordination caused by the benchmark. During the experimental warpage measurement, the four corners of the part were all in contact with the platform, while the sprue was not precisely perpendicular to the platform. Whereas the maximum warpage values were located in section V. Figure 7C gives the maximum warpage values of the nine sections in the experiment and simulation of experiments No.1 to 10. The experiment and simulation results all indicate that the largest warpage occurred in experiment No. 5 because of the highest heat in the middle of the cavity when the local heating was enabled at section V. Figure 7C also shows the warpage difference (∆max. warpage_exp.-sim.) by using the maximum warpage of experiment minus the maximum warpage of simulation and the warpage difference (∆min warpage_exp.-sim.) by using the minimum warpage of experiment minus the minimum warpage of simulation. Experiment No. 10 presented the lowest warpage difference because the local heating was not conducted, indicating the simulation could obtain a more significant effect of local thermal effect. In addition, the lower warpage difference in No. 7, 8, and 9 demonstrates that the simulation result reflects the difference of positions near or far from the gate. The relative warpage near the gate was slight. Figure 7D shows a good correlation of maximum warpage between the experiment and simulation. However, in Figure 7E, the correlated values of R2 in No. 1, 2, and 3 were not high, which is consistent with the higher warpage difference result of No. 1, 2, and 3 in Figure 7C. The correlated R2 of all the warpage data between the experiment and simulation was 35% in Figure 7F, indicating the higher difference between the experiment and simulation.
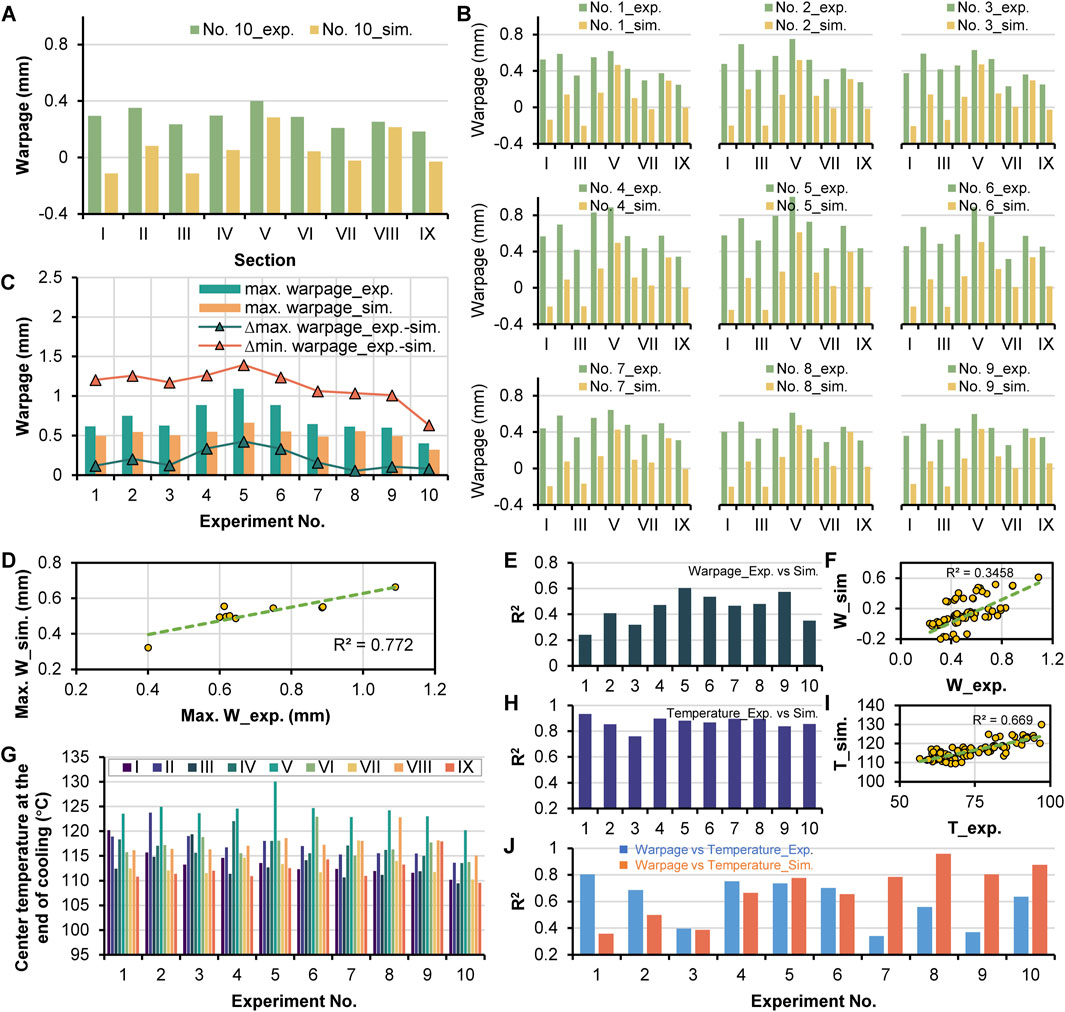
Figure 7. Comparison of warpage at the nine sections between the experiment and simulation in related to No. 10 (A), comparison of warpage at the nine sections between the experiment and simulation in related to No. 1 to 9 (B), the maximum warpage of experiment and simulation, the difference of maximum warpage and minimum warpage between experiment and simulation, in related to experiments No. 1 to 10 (C), correlation of maximum warpage of the 10 cases between experiment and simulation (D), R2 of the warpage correlation between experiment and simulation (E), correlation of warpage between experiment and simulation of all warpage deformation data (F), simulated center temperature in the nine sections at the end time of cooling in the 10 experiments (G), R2 of the temperature correlation between experiment and simulation (H), correlation of temperature between experiment and simulation of all temperature data (I), R2 of the correlation between warpage and temperature of the experiment and simulation (J).
The simulated temperature distribution must be further analyzed to confirm the effectiveness of the simulation. Figure 7G shows the center temperature of the nine measurement points at the end time of cooling in experiments No. 1 to 10. Figure 7H gives the correlated R2 between the experimentally tested part surface temperatures and the simulated temperatures of the ten experiments. The R2 values were around 80%, indicating a good prediction result for temperature. Figure 7I shows the total R2 for all temperature data between the experiment and simulation; 67% is not bad compared to 35% of the warpage. Figure 7J demonstrates that the warpage is not linearly related to the temperature due to its vector property. In experiments No. 1, 2, 4, 5, 6, and 10, the correlation R2 between the experimental warpage and temperature was higher than 60%. In comparison, the correlation R2 was higher than 60% for the simulated warpage and temperature corresponding to experiments No. 4 to 10. It shows a significant difference between the experiment and the simulation. Therefore, warpage deformation, as a typical problem for injection molding, can still not be simulated very well. However, some advanced non-linear models, such as considering the visco-elastic and thermo-mechanical properties of the polymer materials, were applied successfully (Divekar et al., 2022), which is not the topic of this work.
The above results discussed the warpage and its correlation with temperature in the experiments with one local heating section and without heating. The two local heating sections can be turned on together, and the thermal warpage would differ. Figure 8A illustrates the warpage deformation in the Z direction of experiments No. 11 to 25 in Table 2. This leads to a more complex phenomenon. Figure 8B gives the exact warpage values at the nine experiment measurement points. Only one part for each experiment was prepared. The maximum warpage values for all the experiments occurred at the position of section V. For the experiments of No. 11 to 18, the local heating section I was always enabled, which made a higher warpage at sections I and II. The combination of enabled local heating sections of II to VI made more significant warpage than the combination of local heating sections of VII to IX because sections of VII to IX were close to the gate. The most considerable warpage value was 1.683 mm, corresponding to experiment No. 14 (I + V). For the experiments of No. 19 to 23, the enabled local heating section IV enhanced the warpage in the middle of the part. However, because heating section IV was close to the middle section V, which always had high heat, it caused consistent warpage, even when the other heating section changed from V to IX. In addition, the warpage corresponding to the enabled local heating section VII with sections VIII and IX were insignificant.
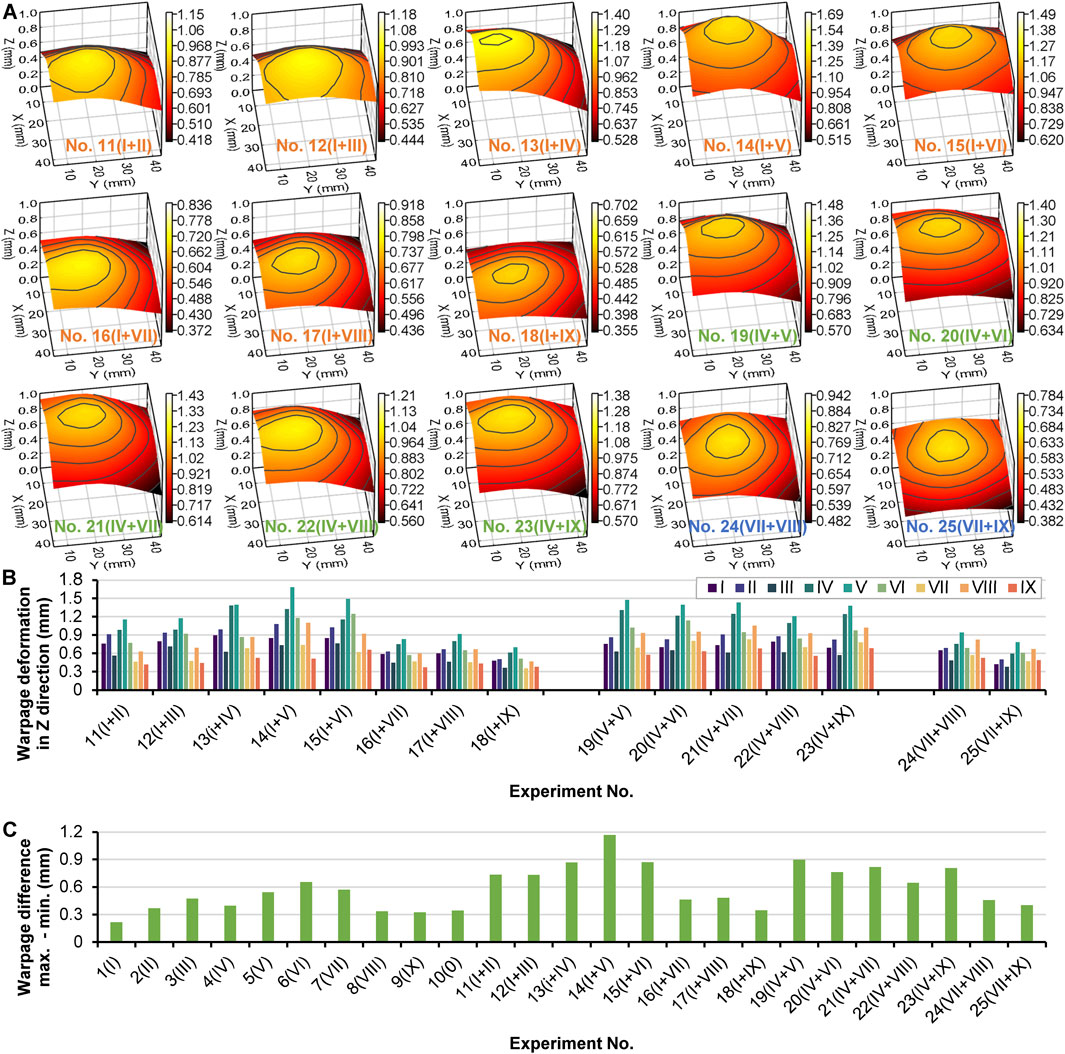
Figure 8. Warpage deformation of the parts prepared by experiments No. 11 to 25 (A), measured warpage deformation in Z direction at the nine measurement points for the parts of experiments No. 11 to 25 (B), warpage difference by maximum value minus minimum value of all experiments No. 1 to 25 (C).
Further, the thermal warpage caused by two heating sections was always higher than that caused by only one local heating section. When considering the whole warpage deformation of the part, the warpage difference between the maximum and the minimum values can be calculated to determine the thermal effect. As shown in Figure 8C, the significant warpage difference was related to experiment No. 14 (I + V). This corresponds to the middle section V, which had a high heat concentration, and section I, which was far from the gate and had a gravity effect. Interestingly, experiment No. 1 with section I heating, not experiment No. 10, created the slightest warpage difference. According to the warpage theory, with non-uniform shrinkage of the whole part, the unbalanced heat distribution inside the cavity is the main factor causing warpage. Experiment No. 10, without local heating, cannot create a better-balanced heat distribution, and the temperature distribution result has shown that the middle section V generated a much higher heat concentration. Therefore, balanced heat dissipation inside the cavity should be created, and decreasing the temperature difference between the middle section and the other sections is the key to reducing the warpage. According to the results of the experiment, the local warpage near the gate was insignificant. Increasing the temperature at the section far from the gate would be helpful. It is clear that experiment No. 1 with the heating section I turned on reduced the whole warpage of the part, which is limited only in these 25 experiments.
The experimental warpage results with different local heating sections have given enough data for machine learning and neural network modeling. As the simulation did not show a good prediction on the warpage while the experiment had experimental errors, neural network modeling based on machine learning could be conducted to establish an accurate model to predict the local warpage. Figure 9A presents the structures of four networks for the local warpage prediction. Table 3 gives the relative parameters and the interpolation accuracy, including MSE and R2. Figure 9B illustrates the correlation between the experiment and neural network output data. Because the hidden layer in this work was only one, the interpolation accuracy was not very high. In comparison, the network (3,6,1) for the data of one local heating section and two local heating sections had larger MSE and lower R2 because of the relatively low data. It showed higher accuracy when more experimental data were applied in machine learning, such as the network (4,8,1). For the network (5,10,1), the data of part surface temperature were also added as one input neuron, and the R2 could be up to 86%. The network (36,9,9) presented a very high accuracy (R2 = 99%) because the network structure considered the location of the nine warpage data in one group experiment and excluded data with different output values for the same input values from interfering with machine learning. Figure 9C illustrates the correlation of the prediction values with the two networks of (4,8,1) and (36,9,9) to the experiment warpage values. Figure 9D presents the difference by experiment value minuting prediction value with the two different networks. The network (36,9,9) presented a higher prediction accuracy.
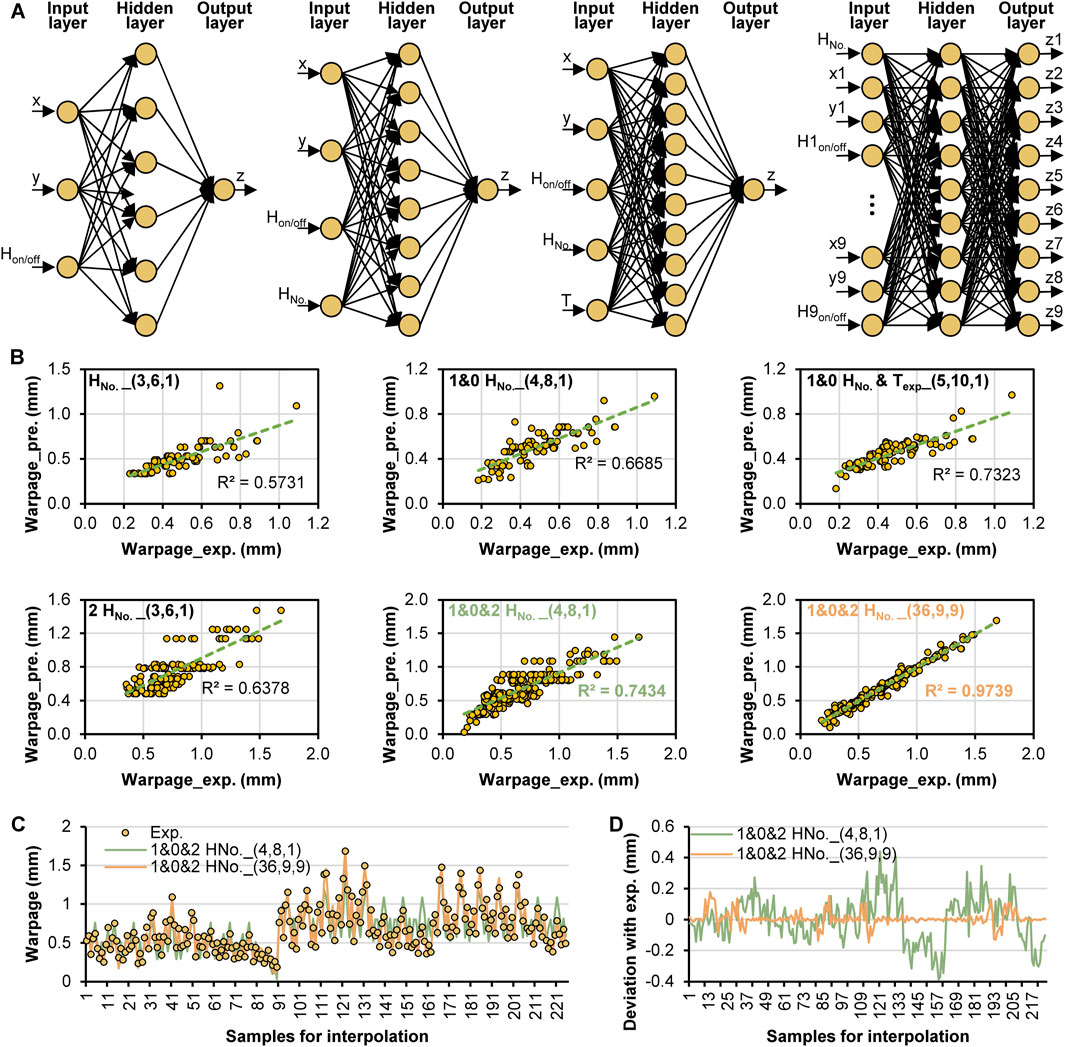
Figure 9. Four neural network structures for modeling (A), correlation of warpage between experiment and prediction by different neural networks with various input and output data (B), warpage values of experiment and prediction with the networks of (4,8,1) and (36,9,9) (C), warpage deviation between experiment and prediction with the networks of (4,8,1) and (36,9,9) (D).
The extrapolation properties of the two network models (4,8,1) and (36,9,9) were also evaluated. The warpage data of the additional four experiments, No. 26 to 29, with two local heating sections, were not applied in the machine learning. Figure 10A illustrates the warpage deformation of the experiments (yellow-red-black) and prediction with the two network models (blue and red). Interestingly, the extrapolation ability of the network (4,8,1) also performed well, even better than that of the network (36,9,9). As shown in Figures 10B, C, the network (4,8,1) obtained lower MSE and higher R2 than the network (36,9,9) in the cases of No. 26, 27, and 29, but the network (36,9,9) obtained a higher value of the total R2 (89%), as shown in Figure 10D. The warpage correlation of the extrapolation data with experiment data in Figure 10E indicates a consistent warpage. However, the deviation with experiment data in Figure 10F indicates a deviation of 0.5 mm, which is relatively high.
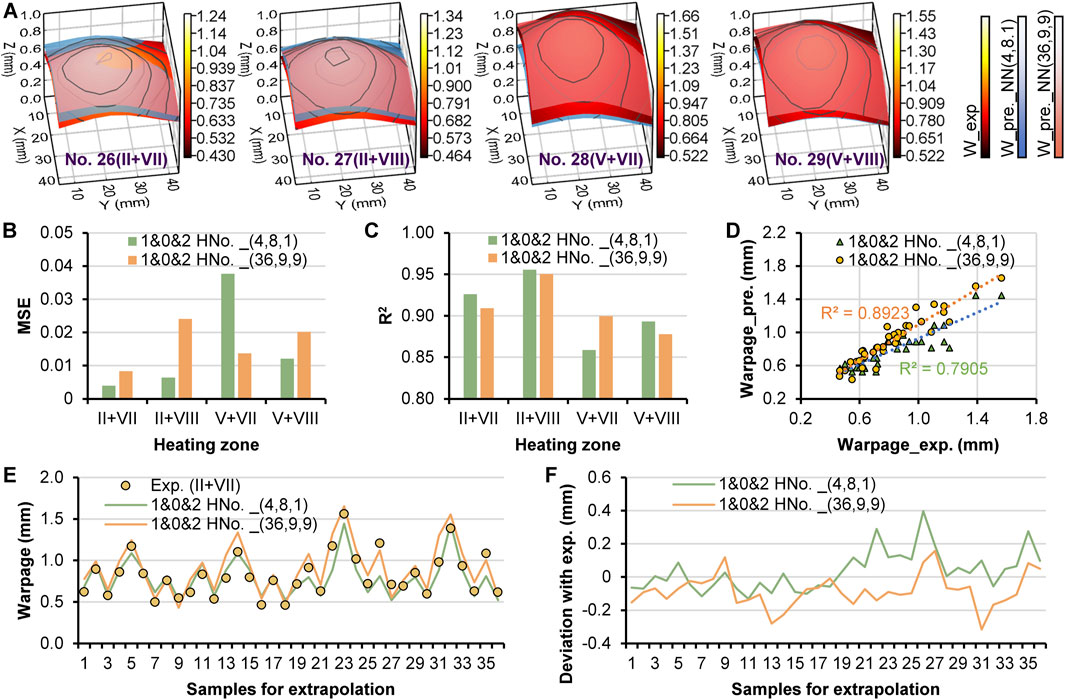
Figure 10. Warpage deformation of experiment and prediction with the networks of (4,8,1) and (36,9,9) (C) in the experiments No. 26 to 29 (A), MSE between experiment and prediction with the networks of (4,8,1) and (36,9,9) (B), R2 between experiment and prediction with the networks of (4,8,1) and (36,9,9) (C), correlation of warpage values between experiment and prediction with the networks of (4,8,1) and (36,9,9) (D), warpage values of experiment and prediction with the networks of (4,8,1) and (36,9,9) (E), deviation of warpage values between experiment and prediction with the networks of (4,8,1) and (36,9,9) (F).
This work investigated the local thermal warpage deformation of a PP injection-molded flat part by developing a unique experimental mold with nine local heating sections in the moving mold plate. Injection molding experiments without local heating, with one local heating section and two local heating sections, were respectively conducted. The highest temperature was always in the middle of the part due to the effortless heat concentration and slow dissipation. As one local heating section was turned on, the highest temperature was 97.15°C, corresponding to the most significant warpage deformation of 1.09 mm at the same section V and experiment No. 5. The results indicated a positive correlation between the local temperature and warpage. However, it was nonlinear, and the correlation R2 was not very high. The numerical simulation was conducted, and the prediction accuracy on temperature was high; R2 was around 80% versus experimental temperature. However, the simulated warpage values were not close to the experimental values. The warpage deformation as two local heating sections were turned on was significantly enhanced, indicating that more heat concentration leads to more significant deformation. The combination of heating the middle section and the section far from the gate can cause the largest warpage, 1.683 mm. The smallest warpage of 0.217 mm was realized by heating the section far from the gate, which created a balanced heat distribution. It demonstrated that the local heating technique can control the deformation. Further, neural network modeling based on machine learning was conducted, and two network models (4,8,1) and (36,9,9) obtained high interpolation accuracy (74% and 97%, respectively). The network (36,9,9) was considered a good model structure for predicting local warpage deformation, but it is not suggested for extrapolation because of the significant prediction deviation.
This innovative fusion of local thermal heating techniques and neural network modeling advances the theoretical understanding and paves the way for the development of accurate prediction models. Such advancements hold immense promise for optimizing manufacturing processes and facilitating the creation of injection-molded parts with enhanced precision and reliability. The presented method can be further applied to warpage deformation control, which will be our future research work.
The original contributions presented in the study are included in the article/Supplementary Material, further inquiries can be directed to the corresponding author.
JW: Conceptualization, Data curation, Formal Analysis, Funding acquisition, Investigation, Methodology, Project administration, Supervision, Validation, Writing–original draft, Writing–review and editing. TL: Data curation, Investigation, Resources, Software, Writing–original draft. KZ: Data curation, Formal Analysis, Software, Validation, Writing–review and editing. HoL: Data curation, Formal Analysis, Investigation, Methodology, Resources, Software, Writing–original draft. HC: Validation, Writing–review and editing. HnL: Data curation, Writing–review and editing.
The author(s) declare that financial support was received for the research, authorship, and/or publication of this article. This research was funded by the Fundamental Research Funds for the Central Universities, grant number buctrc202005.
We acknowledge the software Moldex 3D 2022 support from CoreTech System Co., Ltd.
The authors declare that the research was conducted in the absence of any commercial or financial relationships that could be construed as a potential conflict of interest.
All claims expressed in this article are solely those of the authors and do not necessarily represent those of their affiliated organizations, or those of the publisher, the editors and the reviewers. Any product that may be evaluated in this article, or claim that may be made by its manufacturer, is not guaranteed or endorsed by the publisher.
Baum, M., Anders, D., and Reinicke, T. (2023). Approaches for numerical modeling and simulation of the filling phase in injection molding: a Review. Polymers 15 (21), 4220. doi:10.3390/polym15214220
Chang, H., Su, Z., Lu, S., and Zhang, G. (2022). Application of deep learning network in bumper warpage quality improvement. Processes 10 (5), 1006. doi:10.3390/pr10051006
Divekar, M., Gaval, V. R., and Wonisch, A. (2022). Improvement of warpage prediction through integrative simulation approach for thermoplastic material. J. Thermoplast. Compos. Mater. 35 (9), 1231–1248. doi:10.1177/0892705720930746
Farahani, S., Khade, V., Basu, S., and Pilla, S. (2022). A data-driven predictive maintenance framework for injection molding process. J. Manuf. Process. 80, 887–897. doi:10.1016/j.jmapro.2022.06.013
Fernández, A., Clavería, I., Pina, C., and Elduque, D. (2023). Predictive methodology for quality assessment in injection molding comparing linear regression and neural networks. Polymers 15 (19), 3915. doi:10.3390/polym15193915
Fu, H., Xu, H., Liu, Y., Yang, Z., Kormakov, S., Wu, D., et al. (2020). Overview of injection molding technology for processing polymers and their composites. ES Mater. Manuf. 8 (4), 3–23. doi:10.30919/esmm5f713
Gim, J., Lin, C. Y., and Turng, L. S. (2024). In-mold condition-centered and explainable artificial intelligence-based (IMC-XAI) process optimization for injection molding. J. Manuf. Syst. 72, 196–213. doi:10.1016/j.jmsy.2023.11.013
Guerra, N. B., Reis, T. M., Scopel, T., de Lima, M. S., Figueroa, C. A., and Michels, A. F. (2023). Influence of process parameters and post-molding condition on shrinkage and warpage of injection-molded plastic parts with complex geometry. Int. J. Adv. Manuf. Technol. 128 (1-2), 479–490. doi:10.1007/s00170-023-11782-7
Guo, W., Hua, L., Mao, H., and Meng, Z. (2012). Prediction of warpage in plastic injection molding based on design of experiments. J. Mech. Sci. Technol. 26, 1133–1139. doi:10.1007/s12206-012-0214-0
Hopmann, C., Kahve, C., and Schmitz, M. (2020). Development of a novel control strategy for a highly segmented injection mold tempering for inline part warpage control. Polym. Eng. Sci. 60 (10), 2428–2438. doi:10.1002/pen.25481
Hopmann, C., Xiao, C., Kahve, C. E., and Fellerhoff, J. (2021). Prediction and validation of the specific volume for inline warpage control in injection molding. Polym. Test. 104, 107393. doi:10.1016/j.polymertesting.2021.107393
Jacques, M. S. (1982). An analysis of thermal warpage in injection molded flat parts due to unbalanced cooling. Polym. Eng. Sci. 22 (4), 241–247. doi:10.1002/pen.760220405
Kanbur, B. B., Suping, S., and Duan, F. (2020). Design and optimization of conformal cooling channels for injection molding: a review. Int. J. Adv. Manuf. Technol. 106 (7), 3253–3271. doi:10.1007/s00170-019-04697-9
Khosravani, M. R., and Nasiri, S. (2020). Injection molding manufacturing process: review of case-based reasoning applications. J. Intelligent Manuf. 31, 847–864. doi:10.1007/s10845-019-01481-0
Liao, S. J., Hsieh, W. H., Wang, J. T., and Su, Y. C. (2004). Shrinkage and warpage prediction of injection-molded thin-wall parts using artificial neural networks. Polym. Eng. Sci. 44 (11), 2029–2040. doi:10.1002/pen.20206
Olivero, K. A., and Altan, M. C. (2001). Gravity effects on fluid front dynamics during mold filling. J. Compos. Mater. 35 (14), 1232–1249. doi:10.1177/002199801772662596
Pasha, A. D., Urbanic, J., Hedrick, B., Ramezani, H., and Jianu, O. (2022). Leveraging advanced design and novel rapid manufacturing solutions to respond to the COVID-19 pandemic. Comput. Aided Des. Appl. 19, 755–778. doi:10.14733/cadaps.2022.755-778
Sudsawat, S., and Sriseubsai, W. (2018). Warpage reduction through optimized process parameters and annealed process of injection-molded plastic parts. J. Mech. Sci. Technol. 32, 4787–4799. doi:10.1007/s12206-018-0926-x
Sun, X., Su, X., Tibbenham, P., Mao, J., and Tao, J. (2016). The application of modified PVT data on the warpage prediction of injection molded part. J. Polym. Res. 23, 86–10. doi:10.1007/s10965-016-0980-y
Tillmann, S., Behr, M., and Elgeti, S. (2024). Using Bayesian optimization for warpage compensation in injection molding. Mater. Werkst. 55 (1), 13–20. doi:10.1002/mawe.202300157
Torres-Alba, A., Mercado-Colmenero, J. M., Caballero-Garcia, J. D. D., and Martin-Doñate, C. (2021). Application of new triple hook-shaped conformal cooling channels for cores and sliders in injection molding to reduce residual stress and warping in complex plastic optical parts. Polymers 13 (17), 2944. doi:10.3390/polym13172944
Wang, J., Hopmann, C., Kahve, C., Hohlweck, T., and Alms, J. (2020). Measurement of specific volume of polymers under simulated injection molding processes. Mater. Des. 196, 109136. doi:10.1016/j.matdes.2020.109136
Wang, J., and Mao, Q. (2013). A novel process control methodology based on the PVT behavior of polymer for injection molding. Adv. Polym. Technol. 32 (S1), E474–E485. doi:10.1002/adv.21294
Zhang, J., Yin, X., Liu, F., and Yang, P. (2018). The simulation of the warpage rule of the thin-walled part of polypropylene composite based on the coupling effect of mold deformation and injection molding process. Sci. Eng. Compos. Mater. 25 (3), 593–601. doi:10.1515/secm-2015-0195
Keywords: warpage, polypropylene, injection molding, thermal deformation, neural network
Citation: Wang J, Liu T, Zheng K, Liu H, Cui H and Li H (2024) Local thermal warpage deformation of polypropylene injection molded flat part and neural network prediction model. Front. Mater. 11:1421546. doi: 10.3389/fmats.2024.1421546
Received: 22 April 2024; Accepted: 14 June 2024;
Published: 04 July 2024.
Edited by:
Vijay Raghunathan, King Mongkut’s University of Technology North Bangkok, ThailandReviewed by:
Jafrey Daniel James D., K Ramakrishnan College of Engineering (KRCE), IndiaCopyright © 2024 Wang, Liu, Zheng, Liu, Cui and Li. This is an open-access article distributed under the terms of the Creative Commons Attribution License (CC BY). The use, distribution or reproduction in other forums is permitted, provided the original author(s) and the copyright owner(s) are credited and that the original publication in this journal is cited, in accordance with accepted academic practice. No use, distribution or reproduction is permitted which does not comply with these terms.
*Correspondence: Jian Wang, d2pqXzAxMDdAMTYzLmNvbQ==, amlhbi53YW5nQG1haWwuYnVjdC5lZHUuY24=
Disclaimer: All claims expressed in this article are solely those of the authors and do not necessarily represent those of their affiliated organizations, or those of the publisher, the editors and the reviewers. Any product that may be evaluated in this article or claim that may be made by its manufacturer is not guaranteed or endorsed by the publisher.
Research integrity at Frontiers
Learn more about the work of our research integrity team to safeguard the quality of each article we publish.