 Yuhang Chen
 Xing Kou
- Shaanxi Engineering Research Center of NDT and Structural Integrity Evaluation, State Key Laboratory for Strength and Vibration of Mechanical Structures, Xi’an Jiaotong University, Xi’an, China
This paper presented a new approach for noncontact inspection of defects in milling groove brazed joints of thrust chamber with laser ultrasonic testing method and synthetic aperture focusing technique (SAFT). Firstly, laser ultrasonic testing methods for milling groove brazed joints of thrust chamber was studied. Subsequently, numerical models were constructed to analyze the influence of defects on laser-excited signals. The analysis revealed that the brazed defects caused internal waves to reflect on the rib surface, manifesting as defect echo signals preceding the outer wall echo. Through scanning setting, the obtained SAFT images illustrate the presence of the defect directly and clearly. Furthermore, an experimental system was established to detect and image artificial defects with different degrees of weld leakage. The experimental results are consistent with simulation results, validating the capability and effectiveness of the testing and imaging method. In general, the proposed laser ultrasound method offers inherent advantages of non-contact detection with high resolution and precision, and it is easy to achieve fast and automated scanning of large and complex structures like thrust chambers, demonstrating its potential for enhancing the safety and reliability of liquid rocket engines.
1 Introduction
As the primary propulsion system of the launch vehicle, the thrust chamber within a liquid rocket engine is an important component that converts the chemical energy of the liquid propellant into propulsive force. The high-pressure gas rapidly expelled from the nozzle attains temperatures surpassing the operational limits of conventional materials (Kang and Sun, 2011; Yang and Sun, 2013; Zhang et al., 2016). Notably, there are two typical regenerative cooling sandwich structures, the corrugated plate and the milling groove configuration. The former integrates inner and outer thrust chamber walls with the corrugated plate and the ribbon brazing material, joined by vacuum brazing in a furnace. Despite its established processing technology, this design exhibits comparatively low cooling efficiency. Conversely, the milling groove type involves directly milling grooves and ribs onto the inner wall, which are then brazed to the outer wall to form a regenerative cooling channel. Compared with the corrugated plate structure, this design streamlines both structure and assembly processes, enhances connection strength, and significantly augments cooling efficiency. Nowadays, this structural form is prevalent in the thrust chamber of high-thrust engines (Zhang, 2012). However, challenges such as incomplete penetration, solder accumulation within channels, and blockages are inherent to the manufacturing process of sandwich structures. Such defects pose substantial risks to the operational safety of liquid rocket engines. Therefore, it is crucial to develop advanced non-destructive testing technology for rapid and effective testing of brazing quality to ensure engine safety and reliability (Lv et al., 2020).
The predominant method for assessing the brazed joint quality in corrugated plate structures is mainly based on X-ray inspection (Ren et al., 2020; Ren et al., 2023a; Ren et al., 2023b), complemented by hydraulic strength testing as a supplementary inspection. However, for the brazed joints quality detection in milled groove structures, conventional radiographic testing encounters significant limitations due to the extremely small gap after welding, and the relatively large height of the milled groove rib, which obscure the brazed joints. In response to the challenge of inadequate X-ray detection sensitivity for brazed joints in milling groove structures, L.B. Shan et al. (Shan et al., 2009) proposed that ultrasonic testing and laser holography technologies have superior detection capabilities. In the meantime, D. F. Wang et al. (Wang et al., 2021) carried out optimization research through the brazing process of the closing and expanding end of the thrust chamber, solved the brazing problems in the brazing process, and improved the strength of the brazed seam connection. Subsequent efforts by Y.H. Wang et al. (Wang et al., 2016) employed laser holography technology to assess the quality of milling groove brazed joints. However, this approach requires a complex detection environment and process, and the defect detection sensitivity is insufficient with a relatively large minimum detection defect length. Ultrasonic testing methods offer promising research and application prospects for non-destructive detection of milling groove brazing structures, owing to the superior penetration and sensitivity of ultrasonic waves (Malone et al., 1972; Kerstens et al., 2021; Masuoka et al., 2011). Given the narrow rib surface width of the milling groove structure, and the tiny distance between the weld seam and the outer wall surface, traditional piezoelectric ultrasound often uses water immersion focused probes for detection (Ma et al., 1998; Monchalin, 2020). Nonetheless, focused ultrasound, characterized by a considerable divergence angle and sidelobes, often induces substantial scattering interference on both sides of the milling groove rib and a large blind spot effect on the bottom surface. In addition, the requirement for specimen contact with the water surface brings great practical challenges to the detection process. In contrast, laser ultrasonic testing technology is a non-contact ultrasonic testing method that uses laser to excite and receive ultrasonic waves. It offers distinct advantages, including long-distance excitation and reception, small source dimension, high resolution, and slight bottom blind spot effect. Consequently, it emerges as a highly promising ultrasonic testing technology (Davies et al., 1993; Li, 2020). By enabling precise excitation of extremely short ultrasonic pulses in the confined area above the narrow rib of the milling groove, laser ultrasonic technique facilitates rapid detection and automated scanning of such large and complex components. Nevertheless, to date, there are few research reports related to quality assessment of milled groove brazing using laser ultrasonic technology.
To address the non-destructive testing challenges of defects in milling groove brazed joints of thrust chamber, this paper proposes a novel method for measuring and evaluating narrow rib brazing welds in milling grooves using laser ultrasound technology. Firstly, laser ultrasonic testing methods for milling groove brazed joints of thrust chamber was studied. Based on the principle of pulsed laser excitation and the numerical simulation method of laser ultrasonic, a laser-excited ultrasonic field simulation was developed for brazed structures in milling grooves, and then, simulation optimization research was conducted to refine the accuracy and efficiency of the simulation process. Afterward, the experimental system was established to realize the detection and imaging of the defects with different degrees of brazing weld, validating the effectiveness of the testing method.
2 Method and simulation
2.1 Method
Due to the intricate structure of the outer wall of the thrust chamber, which is prone to obstruction by the fuel channel, excitation and testing are conducted on the inner wall surface. Figure 1 is a simplified schematic diagram of laser ultrasonic testing principle of milling groove brazed joint structure, where A, B and C are the time-domain signals under three defects. The red laser line source achieves precise excitation with vertical incidence, generating ultra-short pulse ultrasonic waves in a small area on the milling groove rib. Subsequently, the ultrasonic pulse propagates from the inner wall, passes through the ribs and brazing layers and is reflected back from the outer wall.
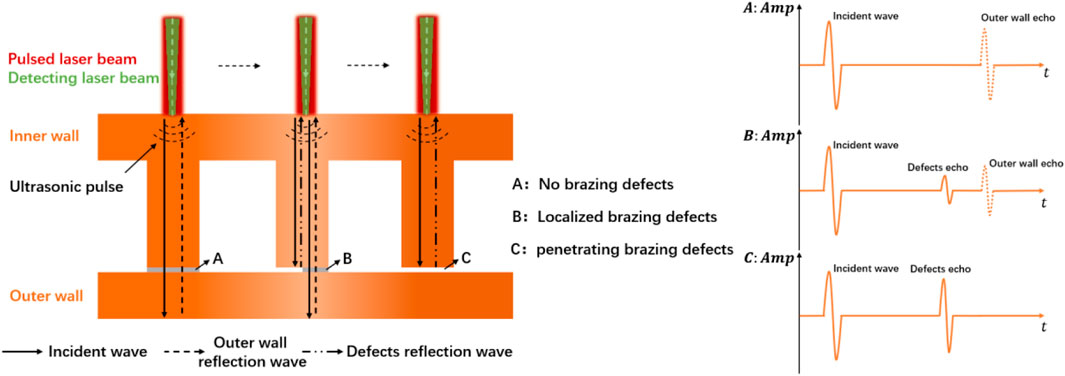
Figure 1. Schematic diagram of laser ultrasonic testing method for simplified milling groove brazed joint structure and time-domain signals under A,B,C defects.
In instances of subpar brazing quality, where partial or complete welding leakage occurs, the significant difference in acoustic impedance between the metal material and air results in the reflection of the ultrasonic pulse at the welding leakage interface. This reflection leads the pulse to propagate towards the upper surface of the inner wall in advance, where it is captured by the green laser in the figure. The received ultrasonic time-domain signal typically manifests in three primary scenarios: In cases of good brazing quality, only echo signals originating from the outer wall appear. In cases of local welding leakage, both external wall echoes and brazing defect signals are identifiable at the forefront, with the advance time corresponding to twice the thickness of the external wall divided by the longitudinal wave velocity in the material. In cases of complete solder leakage, only defect signals will appear, devoid of any external wall echo signals.
The precise excitation by laser can effectively reduce the interference arising from reflection signals at the inner wall and the milling groove rib boundary, while minimizing the blind spot effect on the bottom surface of the outer wall.
The excitation mechanism of laser ultrasound primarily involves thermoelastic and ablation modes. In the thermoelastic mode, the irradiation of solid materials by pulsed laser induces thermal expansion without causing material damages. Conversely, in the ablation mode, the surface melting and splashing within the laser irradiation area will generate high signal-to-noise ratio ultrasound, but cause damage to the materials. To avoid surface damage and enhance signal quality, studies have demonstrated that the presence of a constraint layer can augment the normal stress on the surface, bringing it closer to the ablative state without compromising sample integrity. Additionally, it has also been verified that incorporating constraints and transparent layers on the sample surface can significantly improve the efficiency of longitudinal wave generation (Pei et al., 2012; Kou et al., 2021). Compared with metals, liquids exhibit a higher coefficient of expansion, such that even at lower laser power densities, thin liquid layers can evaporate, exerting greater recoil force on solid material surfaces. This normal recoil force predominantly affects the propagation of longitudinal waves, altering their directionality. Therefore, in this paper, the signal-to-noise ratio was enhanced by applying an oil layer thin film on the specimen surface.
Following signal acquisition, the synthetic aperture focusing technique (SAFT) imaging algorithm based on signal correlation was employed to image the region of interest, thereby improving the imaging accuracy. The correlation can be expressed as Eq. 1.
Where
In the rectangular model shown in Figure 2B, the delaying time of the focusing point can be expressed as:
Where
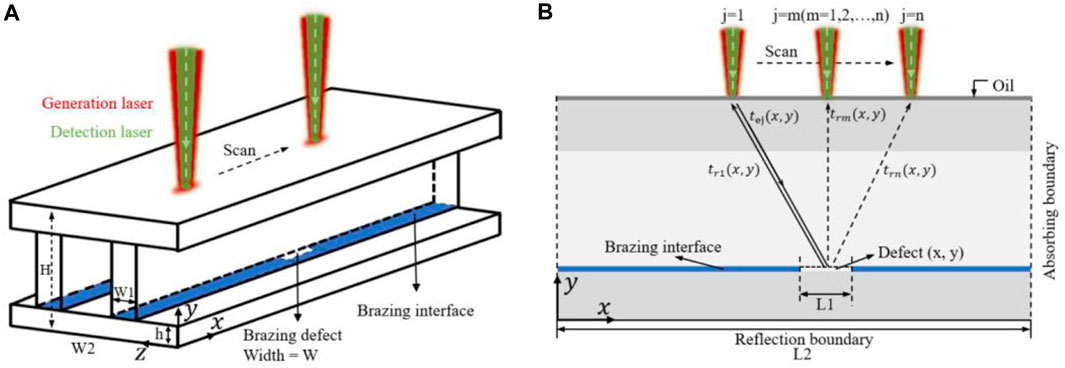
Figure 2. Schematic diagram of laser ultrasound scanning imaging: (A) 3D model (B) x-y cross-section 2D model.
2.2 Numerical simulation
The schematic diagram of the specimen utilized to simulate laser ultrasound is shown in Figure 2. The blue area denotes the well-brazed position, while the red pulse laser irradiation area is located at the top of the model. The power density distribution of the laser beam approximates a Gaussian distribution, characterized by a width of 1.2 mm and a length of 2 mm. The detection point aligns with the central position of the excitation source.
Figure 2A illustrates a three-dimensional (3D) geometric model simulating the generation and propagation of laser ultrasound in the specimen. Two absorbing boundaries are added on both sides of the finite element model. The total width is denoted as W2 = 12.2 mm, with a thickness of H = 5.2 mm. The upper and lower wall thicknesses are h = 1.2 mm, and the narrow rib width is W1 = 1.2 mm. The width of brazing defects varies as W = 0, 0.6, 1.2 mm. Figure 2B depicts a 2D geometric model for simulating the laser ultrasonic scanning imaging of the x-y cross-section of the specimen. The scanning length is set as L2 = 10 mm, with a scanning spacing of d = 0.2 mm. The brazing defect length is L1 = 2 mm, with the defect center located at x = 6 mm. It should be noted that the height of brazing defects in the simulation model is set to 0.1 mm.
The material used in the numerical model is 1Cr18Ni9Ti stainless steel, and the corresponding material parameters are shown in Table 1. In the numerical calculation model, the laser pulse width is 10 ns. The half width of the laser beam is 0.6 mm, the peak power density of the laser is
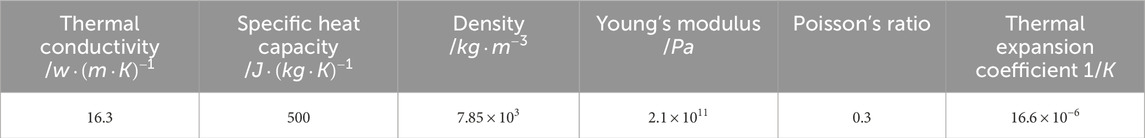
Table 1. The material parameters.
Figure 3 shows the simulated ultrasonic time-domain signals obtained under three different defect widths. The center of the excitation and detection laser spot coincides, acting directly above the narrow rib, and both are located at x = 6 mm. Three simulation signals are obtained by changing the defect width W in the simulation model. According to the formula of longitudinal wave velocity, the theoretical calculation of longitudinal wave velocity is about 6,001 m/s, and the thickness of inner wall is 1.2 mm. Therefore, the signals observed at about 0.4 μs and 0.8 μs correspond to the first and second ultrasonic longitudinal wave signals reflected from the inner wall of the milling groove to the detection point. In contrast to the ultrasonic propagation signal in a semi-infinite flat plate, the ultrasonic wave experiences multiple reflections along the inner wall of the narrow rib, resulting in multiple pulse echoes at the detection point. In the absence of defects, there are three discernible pulse-echo signals from outer wall, with the second pulse-echo signal exhibiting the largest amplitude. However, in the presence of a defect, two pulse echoes will be detected 0.43 μs in advance, with the second pulse echo still displaying the highest amplitude energy. Three obvious pulse echoes from the reflecting interface can be observed. The time interval between them is close to 0.4 μs of the time when longitudinal wave propagates back and forth on the outer wall. In the case of local weld leakage, the reflected wave from the outer wall will be mixed with the multimode guided wave signal. Furthermore, the echo amplitude corresponding to a defect width of W = 1.2 mm surpasses that of defect width w = 0.6 mm.
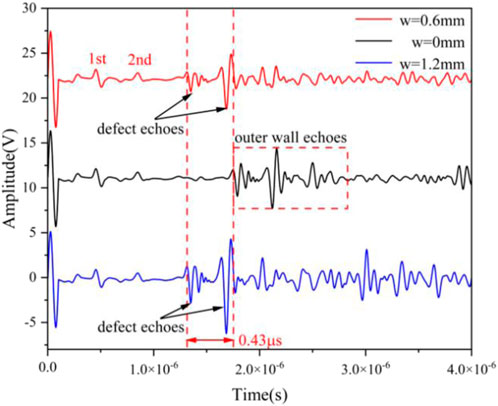
Figure 3. Simulation signals in the case of three different defect widths.
In Figure 2B, the laser spot undergoes scanning along the narrow rib direction, with 51 sets of simulation data collected. The B-Scan image and SAFT considering correlation calculation image are shown in Figure 4. In Figure 4A, it can be observed that the outer wall echo occurs at approximately 1.8 μs. The defect echo is observed at a distance of 5–7 mm, and the outer wall echo appears discontinuous due to the obstruction caused by the defect. The SAFT imaging result is presented in Figure 4B, showcasing the consistency between the measured defect length and the setting value in the simulation model, which is 2 mm.
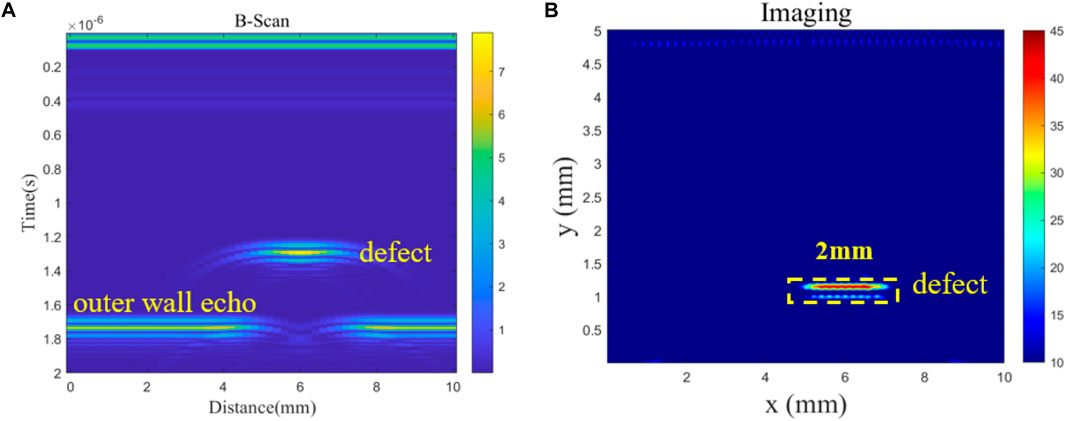
Figure 4. Simulated signal laser ultrasound scanning imaging (A) B-Scan imaging, (B) SAFT considering correlation calculation imaging.
In addition, a model incorporating three brazing defects with different lengths (L1 = 0.5 mm, 1 mm, 3 mm) was subjected to scanning and imaging utilizing identical settings as described previously. The results are shown in Figures 5A,B, where the defect lengths are prominently discernible. Moreover, the defect depth information can be derived by calculating the flight time.
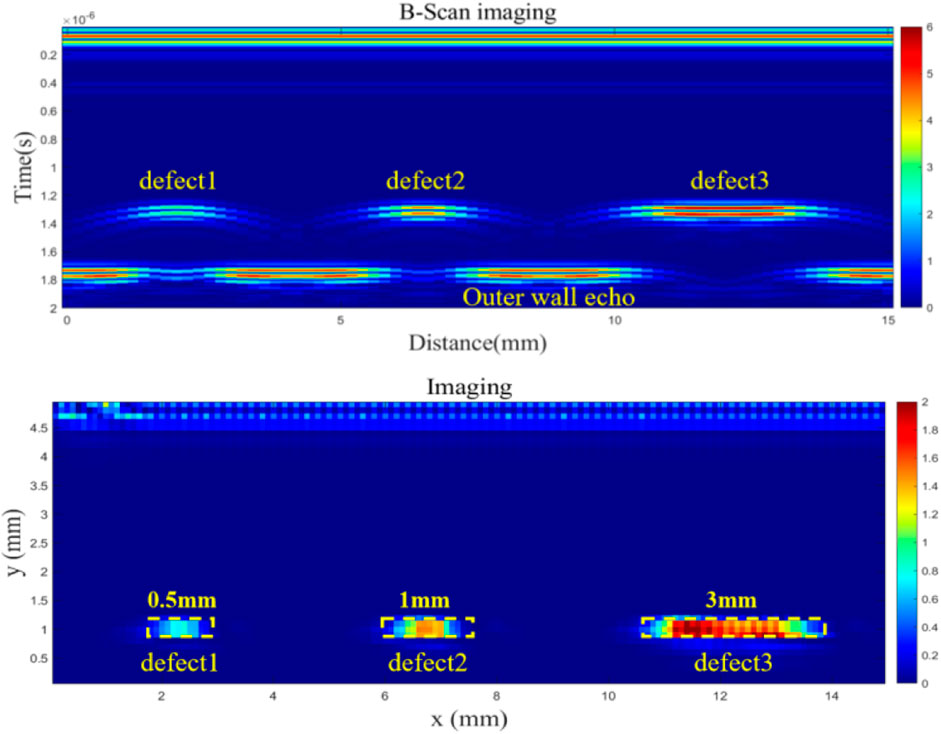
Figure 5. Simulated multiple defects signal laser ultrasound scanning imaging B-Scan imaging, SAFT considering correlation calculation imaging.
3 Experiment validation
3.1 Experiment setup
The schematic diagram of the experimental setup is illustrated in Figure 6. A pulse laser generates a laser pulse with a wavelength of 1,064 nm, a pulse width of 10 ns, a spot diameter of 7 mm, and a repetition rate of 10 Hz. After passing through a focusing lens and a dichroic mirror, it focuses on the sample surface, thereby exciting ultrasonic waves that propagate within the sample. Simultaneously, the photodetector collects the trigger signal and transmits it to the oscilloscope. The laser interferometer is utilized to generate a continuous laser with a wavelength of 532 nm. This laser is reflected by the dichroic mirror and focused on the surface of the sample, with the focus aligning with the center position of the excitation spot. The interferometer collects ultrasonic signals, subsequently transmitting them to the oscilloscope. The computer controls the movement of the 2D scanning platform (moving along the x and z directions) and collects the signal recorded by the oscilloscope.
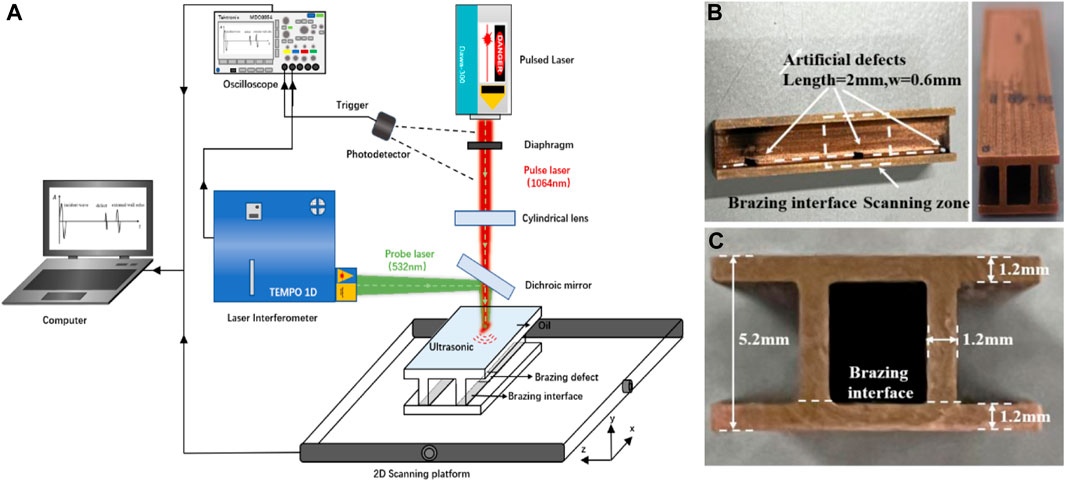
Figure 6. (A) Laser ultrasonic testing experimental system, (B), (C) sample.
In order to assess the detection performance and imaging capability of the method, experimental validation was conducted using samples with three artificial defects. Given the susceptibility of defects on both sides to interference from two cross-sections, only the middle defect was subjected to scanning and detection. The length of the scanning area is 10 mm, with a scanning interval of 0.2 mm, as shown in Figures 6A,B. The sample utilized in the experiment was made of copper alloy, with a total thickness of 5.2 mm. The inner and outer wall thicknesses, as well as the narrow rib width, are 1.2 mm. The defect length is 2 mm, with a width of 0.6 mm.
3.2 Experimental results
The specimen is positioned parallel to the narrow rib direction on the scanning platform, ensuring that the center of the pulse excitation laser and the detection laser coincide to irradiate the upper surface of the specimen. When the scanning platform moves in the x direction under the control of the computer, the irradiation position of the laser on the specimen surface changes accordingly. During detection, the low-frequency noise generated by the experimental system, the instability of hardware facilities, and the unevenness in the oil layer on the specimen surface can introduce noise in the system. To address this, actual spectrum analysis testing has been conducted, indicating that bandpass filtering within the range of 5–50 MHz is suitable for improving the signal-to-noise ratio of the obtained data in this study. For experimental analysis, a sample with a brazing defect at a width of w = 0.6 mm was utilized. Previous tests have revealed that the longitudinal wave velocity of the sample is 5,037.8 m/s.
The sample is positioned on a 2D scanning platform, and the computer precisely controls the scanning platform to move and scan along the x-axis direction at an interval of
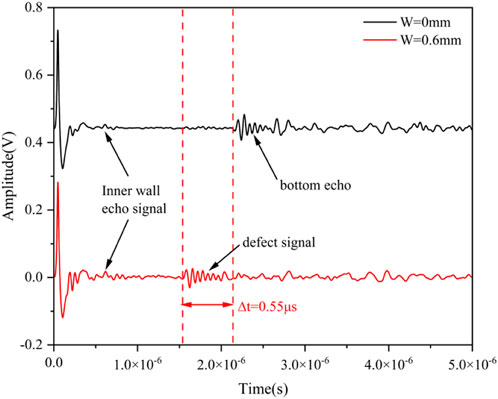
Figure 7. Experimental signals for brazing areas without and with defects.
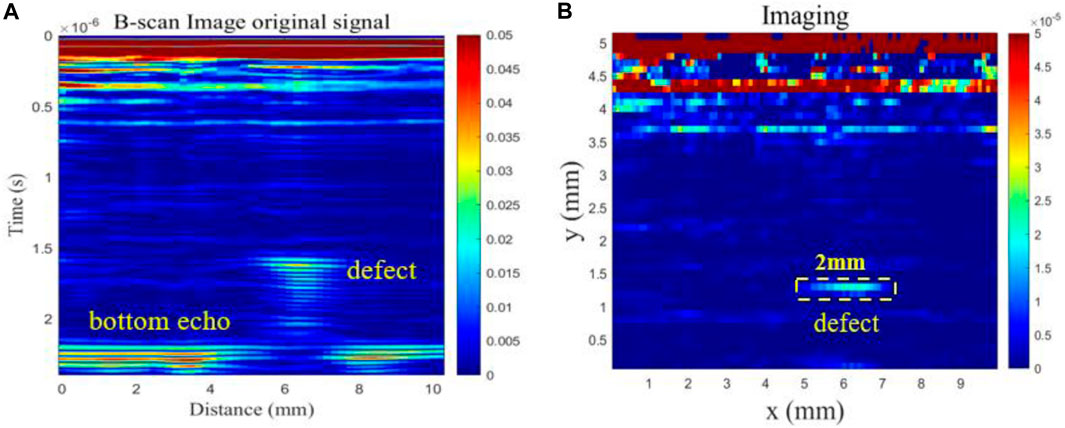
Figure 8. Experimental signal laser ultrasound scanning imaging (A) B-Scan imaging, (B) SAFT considering correlation calculation imaging.
Figure 8B shows SAFT imaging considering correlation calculation, with the horizontal axis representing the scanning distance and the vertical axis representing the thickness dimension of the specimen. It should be noted that the interference signals in red from about y = 4–5.2 mm is due to noise and internal wall reflection interference during the experiment, which does not have a significant impact on our defect judgment. The defect signal can be observed clearly at x ranging from 5 to 7 mm and y of about 1.2 mm, consistent with the defect setting in the specimen.
4 Conclusion
This paper investigates a non-destructive testing method for defects in milling groove brazed joints of thrust chamber using laser ultrasonic testing technology, focusing on completely non-contact scanning imaging. Firstly, the mechanism of the laser ultrasonic testing method for narrow rib weld structure in thrust chamber milling groove was studied. Then, with the established numerical models, it reveals that the laser spot can be precisely positioned above the narrow rib through analysis of echo signals. Laser-excited ultrasound induces mode conversion within the narrow rib, generating a multimodal wave signal and resulting in a complex waveform of multiple pulses in the outer wall echo. Afterward, with the analysis of numerical results, the presence of brazing defects leads to the reflection of internal waves on the rib surface, manifesting as defect echo signals preceding the outer wall echo. Through scanning simulation setting of a 10 mm distance along the narrow rib, defect signals are clearly observed in B-scan and SAFT images. Finally, an experimental system was established to detect artificial defects with different degrees of weld leakage. The experimental results are consistent with the simulation results. After scanning of thrust chamber milling groove structure samples containing brazed defects with length of L1 = 2 mm and width of W = 0.6 mm, the obtained B-scan, and SAFT imaging can be obtained from initial time-domain signals with 5–50 MHz bandpass filtering. It proved that these techniques enabled clear distinction of defect signals and validated the effectiveness of the detection method.
Data availability statement
The original contributions presented in the study are included in the article/Supplementary Material, further inquiries can be directed to the corresponding author.
Author contributions
YC: Writing–original draft, Writing–review and editing. XK: Writing–original draft, Writing–review and editing. YL: Writing–original draft, Writing–review and editing. CP: Writing–review and editing. ZC: Writing–review and editing.
Funding
The author(s) declare that financial support was received for the research, authorship, and/or publication of this article. National Natural Science Foundation (No. 12072255) and the National Key R&D Projects of China (No. 2022YFB3707200) support was received for this article.
Acknowledgments
The authors would like to thank the National Natural Science Foundation (No. 12072255) and the National Key R&D Projects of China (No. 2022YFB3707200) for funding.
Conflict of interest
The authors declare that the research was conducted in the absence of any commercial or financial relationships that could be construed as a potential conflict of interest.
Publisher’s note
All claims expressed in this article are solely those of the authors and do not necessarily represent those of their affiliated organizations, or those of the publisher, the editors and the reviewers. Any product that may be evaluated in this article, or claim that may be made by its manufacturer, is not guaranteed or endorsed by the publisher.
References
Davies, S. J., Edwards, C., Taylor, G. S., and Palmer, S. B. (1993). Laser-generated ultrasound: its properties, mechanisms and multifarious applications. J. Phys. D Appl. Phys. 26, 329–348. doi:10.1088/0022-3727/26/3/001
Kang, Y. D., and Sun, B. (2011). Numerical simulation of liquid rocket engine thrust chamber regenerative cooling. J. Thermophys. Heat Transf. 25 (1), 155–164. doi:10.2514/1.47701
Kerstens, F., Cervone, A., and Gradl, P. (2021). End to end process evaluation for additively manufactured liquid rocket engine thrust chambers. Acta Astronaut. 182, 454–465. doi:10.1016/j.actaastro.2021.02.034
Kou, X., Pei, C. X., Liu, T., Wu, S., and Chen, Z. (2021). Noncontact testing and imaging of internal defects with a new Laser-ultrasonic SAFT method. Appl. Acoust. 178, 107956. doi:10.1016/j.apacoust.2021.107956
Li, K. S. (2020). Research on material defects testing based on laser ultrasonic technology. Southwest Jiaotong University Doctor Degree Dissertation. Sep.
Lv, Y. D., Chen, Y. W., and Guo, H. Q. (2020). Application of industrial CT detection technology in defect inspection of 5 kN engine. Aerosp. Mater. Technol. 50 (04), 87–91. doi:10.27414/d.cnki.gxnju.2020.002528
Ma, H. W., Zhang, M. G., and Wang, T. (1998). Ultrasonic nondestructive testing of braze defects. J. Xi'an Jiaot. Univ.
Malone, G. A., Stauffis, R., and Wood, R. (1972). Nondestructive tests of regenerative chambers final report. Bell Aerospace company contractor reoprt. ID:19730006782.
Masuoka, T., Kurosu, A., Moriya, S., and Yamawaki, H. (2011). “Wall thickness measurements by ultrasonic probes in a liquid rocket combustion chamber,” in 47th AIAA/ASME/SAE/ASEE joint propulsion conference and exhibit 31 july-03 august. San Diego, California. doi:10.2514/6.2011-5934
Monchalin, J.-P. (2020). Laser-ultrasonics: principles and industrial applications. J. Nondestruct. Test. 25 (3). doi:10.1142/9789812770943_0004
Pei, C. X., Fukuchi, T., Zhu, H. T., Koyama, K., Demachi, K., and Uesaka, M. (2012). A study of internal defect testing with the laser-EMAT ultrasonic method. IEEE Trans. Ultrasonics, Ferroelectr. Freq. Control 59, 2702–2708. doi:10.1109/tuffc.2012.2511
Ren, W. J., Liu, Z., and Zhang, T. (2020). X-ray digital imaging detection technology for brazed body of thrust chamber. J. Rocket Propuls. 46 (3).
Ren, W. J., Wang, Y. H., Li, C. K., Shi, Y., Sun, Z. C., and Liu, G. Z. (2023a). Research on automatic detection method of DR digital imaging for brazing seam defects of thrust chamber body. Electr. Weld. Mach. 53 (1), 9–14. doi:10.7512/j.issn.1001-2303.2023.01.02
Ren, W. J., Yan, M. W., and Li, C. K. (2023b). Automatic detection method of DR digital imaging for brazing seam defects of thrust chamber body. Weld. Join. 2023 (07), 34–39+53. doi:10.12073/j.hj.20220419002
Shan, L. B., Jin, Z. H., and He, Y. L. (2009). Testing techniques of brazing and diffusion welding quality of liquid rocket engine. J. Rocket Propuls. 35 (No.6).
Wang, D. F., Liu, C. F., and Chen, S. B. (2021). Optimization analysis test of brazing process in thrust chamber convergent-divergent section. Mech. Res. Appl. 34. doi:10.16576./j.cnki.1007-4414.2021.03.036
Wang, Y. H., Yan, M. W., and Liu, G. Z. (2016). Research and application of laser holography detection technology. J. Rocket Propuls. 42 (No.4).
Yang, W., and Sun, B. (2013). Numerical simulation of liquid film and regenerative cooling in a liquid rocket. Appl. Therm. Eng. 54, 460–469. doi:10.1016/j.applthermaleng.2013.02.021
Zhang, Q. Y. (2012). Structure and cooling design of liquid rocket engine thrust chamber. Tsinghua University Master Degree Dissertation.
Keywords: liquid rocket, defects in milling groove brazed joints, laser ultrasonics, synthetic aperture focusing technique, ultrasonic imaging
Citation: Chen Y, Kou X, Liu Y, Pei C and Chen Z (2024) Laser ultrasonic testing of defects in milling groove brazed joints of thrust chamber. Front. Mater. 11:1421323. doi: 10.3389/fmats.2024.1421323
Received: 22 April 2024; Accepted: 19 June 2024;
Published: 17 July 2024.
Edited by:
Gabriella Epasto, University of Messina, ItalyReviewed by:
Chao Wang, Ansys, United StatesJinxing Qiu, Wuhan University of Technology, China
Fanghao Li, China Jiliang University, China
Copyright © 2024 Chen, Kou, Liu, Pei and Chen. This is an open-access article distributed under the terms of the Creative Commons Attribution License (CC BY). The use, distribution or reproduction in other forums is permitted, provided the original author(s) and the copyright owner(s) are credited and that the original publication in this journal is cited, in accordance with accepted academic practice. No use, distribution or reproduction is permitted which does not comply with these terms.
*Correspondence: Cuixiang Pei, cGVpLmN4QG1haWwueGp0dS5lZHUuY24=