 Awen Bruneau1*
 François Mahé2
 Christophe Binetruy1
 Sébastien Comas-Cardona1
 Charlotte Landry3Nelly Durand4
- 1Nantes Université, Centrale Nantes, GeM, UMR Centre National de la Recherche Scientifique, Nantes, France
- 2University Rennes, ENS Rennes, Centre National de la Recherche Scientifique, IPR-UMR, Rennes, France
- 3Centre Technique Des Industries Mécaniques-Technocampus Composites, Bouguenais, France
- 4Centre Technique Des Industries Mécaniques, Mulhouse Cedex, France
A numerical model of packing applied to rigid objects is presented. It aims at describing a random stack of polymer composite chips in order to model the packing step of an existing recycling technique. The geometric properties of the stack play a major role in the mechanical properties of the recycled products. Short, simple and effective geometric descriptors of the stack are proposed. Their ability to differentiate random stacks is illustrated with an example. Then, a validation is proposed based on experimental data obtained from a bench specially designed for this work. The tests consist in the free fall of square chips. Finally, the developed model is compared to other models (free fall and packing of fibers) in order to enforce its relevance in the simulation of packing of rigid objects.
Highlights
• Thermoplastic composites
• Mechanical recycling process
• Numerical packing model of rigid objects
• Experimental fitting
• Theoretical validation
1 Introduction
Composite materials are used in various fields and their production has been increasing over the last decades. They have become one of the most widely used materials in the aerospace and automotive industries thanks to their high mechanical performance and light weight. These outstanding properties are due to the high-strength fibers that reinforce the polymer matrix, which maintains the shape of the fiber reinforcement and protects it from environmental aggressions. As the production of composite materials has increased, so as the amount of waste generated. In fact, some processes can generate a significant amount proportion of waste, up to 25
This work focuses on the packing step of the considered mechanical recycling technique and does not model the shredding or the consolidation steps as depicted in Figure 1. This characterization of defect formation in both thermoplastic and thermoset discontinuous fiber-reinforced composites, its evolution and the resulting mechanical properties play a key role in the development of robust recycling methods and have already been investigated (Landry and Hubert, 2015; Levy and Hubert, 2015; Selezneva and Lessard, 2016). The paper is structured as follows. First, the pilot line as well as the numerical model are described in detail. Then, the numerical results obtained are presented. Finally, some theoretical and experimental validations are presented before concluding on the findings of this work.
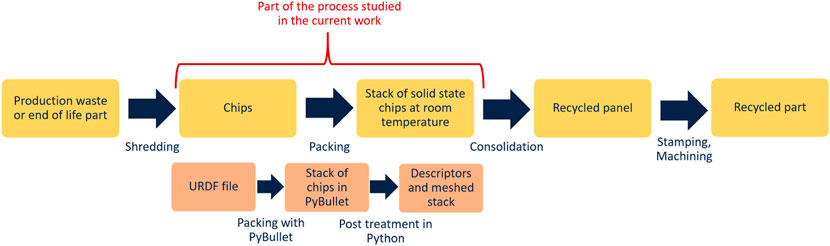
Figure 1. Definition of the focus of the article among the whole recycling process. The top process in yellow is the physical process and the bottom line in orange represents the numerical chain to model the studied part of the process.
2 Materials and methods of numerical deposition
2.1 Process
CETIM has developed a new process for the recycling of thermoplastic composites, which was patented in 2016 (World Wide, 2023). This line combines the Thermoprime® technology, which uses virgin fiber reinforcements with recycled thermoplastic matrix (Cetim Grandest, 2023), and the Thermosaïc® technology which is the main process studied in this work. Switching from one technology to the other is possible on the same recycling line by changing a few components. Thermoprime® technology enables to reinforce the recycled thermoplastic matrix with long or continuous virgin fibers. In this configuration, the recycling line has to include a spool unwinder at the entrance of the line. The recycling line, in the Thermosaïc® configuration, transforms composite chips into a quasi-isotropic plate. These chips are the result of a shredding step on composite waste (end-of-life product or more often production waste). Different types of chips are shown in Figure 2, the top ones were shredded while the bottom ones have been cut. Once the shredding step is completed, the chips obtained are poured into big containers from which the chips are deposited on the main conveyor belt of the line. The conveyor belt then transports the stack of chips under two successive heating presses which will consolidate the stack into a plate as the one shown on the right hand side of Figure 2. It is a semi-continuous process, the panels are produced continuously in the direction of the line in small discrete increments. Typical step duration is around a minute long with 800–1,000 kN loading at temperatures between 200
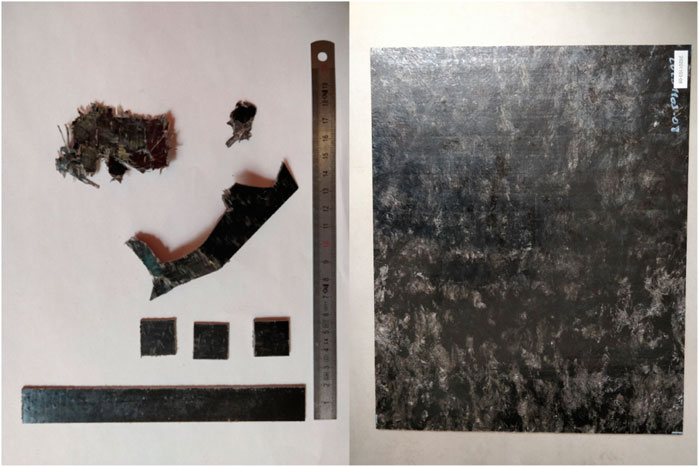
Figure 2. Examples of chips to feed the Thermosaïc® line and a Thermosaïc® panel after consolidation (440 mm
2.2 Materials
In this work, the material used for experimental comparisons is a PA6 matrix reinforced with 60% weight balanced glass fiber twill fabric. The PA6 matrix has a glass transition temperature of 80
2.3 Packing model
2.3.1 Software presentation
To simulate and understand the behavior of chips during packing, a numerical packing model has been built. This packing model has been developed using PyBullet, the python interface of Bullet physics (Coumans and Bai, 2021). This open source library provides real-time contact detection and multi-physics simulation solutions. It is widely used in robotics and machine learning. An example is the training of robot motion and collision avoidance (Mower et al., 2023; Panerati et al., 2021). This library was used and described in (Izadi and Bezuijen, 2015) to simulate the behavior of granular soil, and in (Forró et al., 2020) to simulate the deposition of metal nanowires in networks.
2.3.2 Assumptions and framework
Rigid body dynamics is used to simulate the chips. The chips are considered as infinitely rigid thus, the model could be applied to thinner chips without any modification except modifying the geometry in the numerical modeling. To solve the contact problem, he computational structure includes collision data, pair detection of collision shapes, contact computing and then dynamic integration. During the collision resolution, a resolution of normal and frictional forces and moments is conducted to update the positions and velocities of the rigid bodies. This process is then repeated until the end of the simulation. The solver uses Newton-Euler equations to compute the motions of the rigid bodies in both translation and rotation cases. Contact equations and detailed resolution methods can be found in the literature (Bender et al., 2014).
2.3.3 Numerical packing procedure
The principle of the model developed for the present work is to generate chips at controlled positions and orientations and use the gravity of the Bullet physics environment to stack them to form a pile. The vocabulary used to describe a stack of chips during deposition and the vocabulary used to describe the configuration after deposition are defined in Figures 3, 4. The numerical deposition process of the chips works as described below and illustrated in Figure 5:
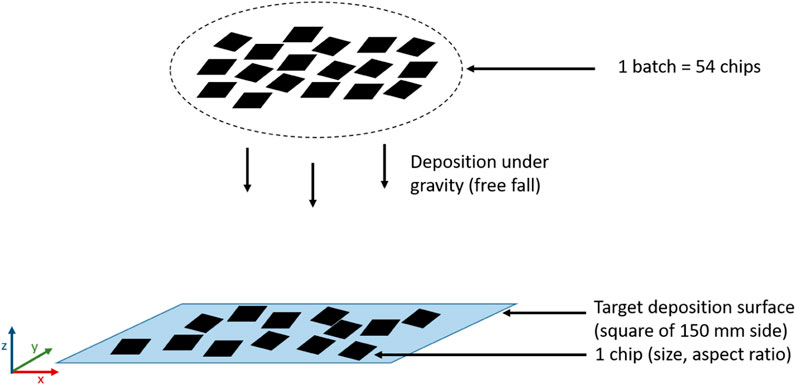
Figure 3. Schematic view of the chip deposition procedure. The vocabulary used to describe each element of deposition process is presented.
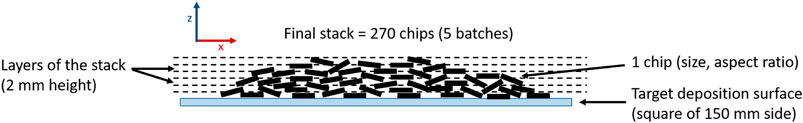
Figure 4. Schematic view of a random stack after five batches of chip deposition. The vocabulary used to describe each element of the stack is presented.
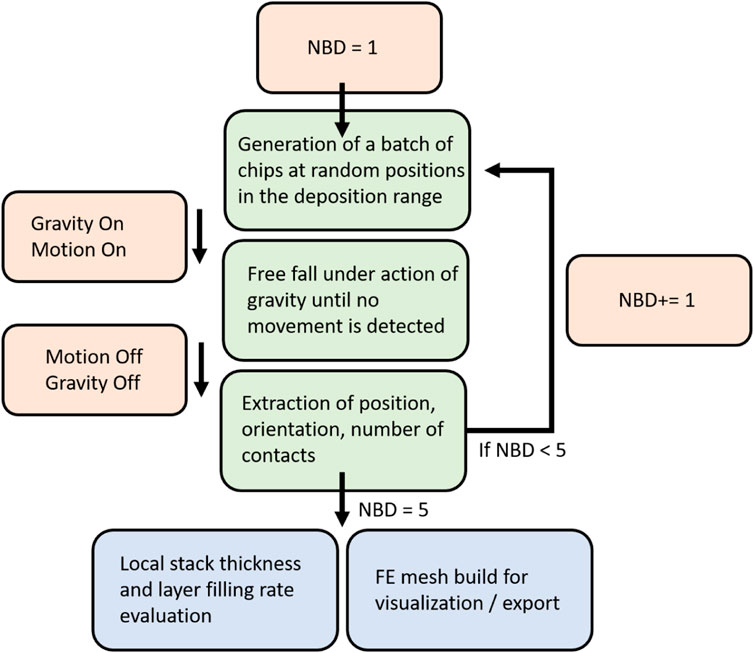
Figure 5. Deposition algorithm, green boxes represent main algorithm steps, orange boxes represent simulation variables, blue boxes represent descriptors and outputs. NBD stands for number of batch deposited.
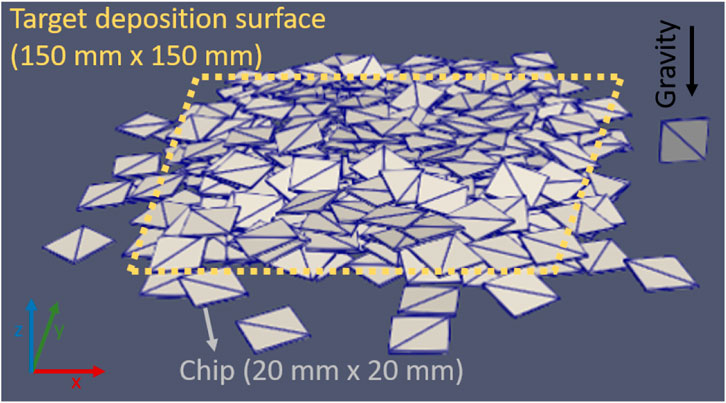
Figure 6. Stack made of 270 square chips with random initial chip positions. One chip is 20 mm
During this deposition step, the position, the orientation and the detected contacts of each chip are available. No deformation of the chips is calculated because they are assumed to be infinitely rigid due to the small mechanical forces that occur during stack formation under gravity. This saves computation time. These data allow to build descriptors of the packing, metrics allowing a rigorous description of the random stack as developed in (Torquato and Haslach, 2002). The descriptors serve two purposes. First, to provide a short, simple, effective and discriminative description of random packings. Second, to establish a direct link between the geometry of the stack and the mechanical properties of the consolidated sheets. Since the initial positions of the flakes are randomly defined, the extracted results may vary from one deposition to another. Therefore, the mean value of a descriptor and a confidence interval based on 10 independent repeats are used to obtain a global interpretation. Single deposition results are kept to describe the local behavior. The independent repeats consist in running the deposition process 10 times with the same target deposition surface (a square of 150 mm side) and the same number of chips (270 chips), but with a variation in the initial position of each flake as it is randomly defined within the acceptable range of deposition. Means and standard deviations are then extracted in order to build the global descriptors, the contact type descriptor is one of these global descriptors and will be the first to be introduced in the next section. All simulations were run on a laptop equipped with Intel core i9 (2.60 GHz). The deposition of 270 chips takes about 2 min and 30 s of computing time, and another 3 min and 30 s are necessary to analyze the stack and build all the descriptors.
3 Results
3.1 Definition of descriptors
3.1.1 Contact type
This first descriptor is a classification of the type of contact. Considering a chip in the stack, it can have contacts with chips below, over or around it. Each contact can be either a point, a line or a surface of contact. These three types of contacts need to be added to obtain the total amount of contact of a chip. Figure 7 shows the mean value of the distribution of these three types of contact during the five batches of the deposition. Contact points are displayed in blue, contact lines displayed in red and contact surfaces displayed in green. For each type, the colored area represents the 95
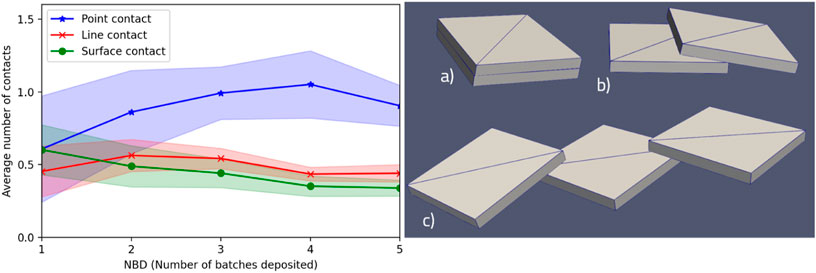
Figure 7. Average number of contact for one chip with its
3.1.2 Local stack thickness
The second descriptor aims at providing local information on the stack, it is a representation of a single deposition in order to focus on local differences that might be hidden by using averages. A description of the process to build this descriptor is given in Figure 8. The principle is to scan the stack, generate a vertical ray and increment the number of elements hit (NEH) each time the ray hits a chip. As soon as there is no element left on the path of the ray, another position of the stack is inspected. Each pixel of Figure 9 corresponds to a position of the stack in the horizontal
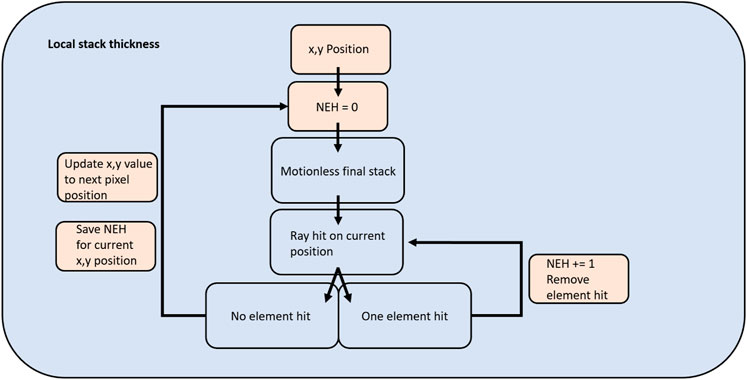
Figure 8. Detection algorithm to compute local stack thickness descriptor. NEH is the number of elements (chips) hit.
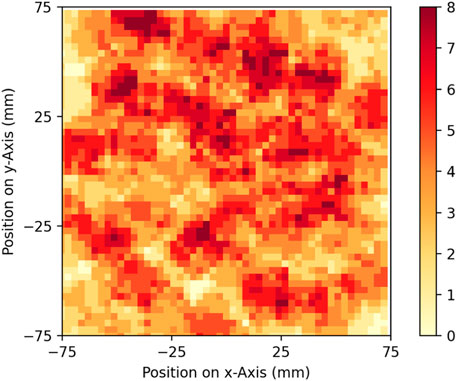
Figure 9. Mapping of the local number of chips in the stack given by the number of superimposed chips.
3.1.3 Layer filling
The layer filling descriptor provides access to the filling level of the layers of the stack, as shown in Figure 10. The horizontal axis represents the successive overlapping layers, where each layer is a 2 mm section of the stack thickness. The vertical axis represents the number of chips in the considered layer. Each chip is assigned to a layer by the position of its center of mass without any consideration of its orientation. It means that a flat chip or a chip crossing multiple layers will be counted only once, in the layer which contains its center of mass. This descriptor aims at identifying a possible overfilling or underfilling of some layers. Thanks to this descriptor it is possible to assess if a layer is totally filled, partially filled or empty. An empty layer would correspond to 0, which is the case for layers 14 and above, and partially filled would correspond to the rest. A completely filled layer (i.e., with no porosity) is a layer containing 56 chips, since 56 square chips of 20 mm length are required to obtain the same area than the deposition target. This descriptor allows to track the filling rate of each layer and helps to detect potential gaps and porosity. It could also be a useful tool to follow the evolution of a stack during a consolidation step to track the level of filling along the thickness as well as the overall thickness of the stack.
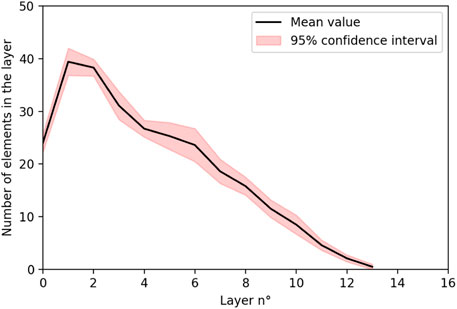
Figure 10. Number of chips per layer (one layer = 2 mm section of the stack thickness).
3.2 Discrimination of stacks using descriptors
3.2.1 Stacks to compare
Since the goal of the descriptor is to allow an effective, short and simple discrimination of the random packing structure, a first development of this ability is presented in this work. Descriptors have to be sensitive enough to the different structure parameters that can vary in a stack and translate them into metrics that can be interpreted. One of these parameters is the geometry of the chips. A change in the geometry of the chips is easily detected by visual inspection of the stack is possible but the effect of this change on the stack is less obvious. In order to illustrate this concept, a comparison between two stacks is realized. The first stack is the reference stack already shown in Figure 6. This reference stack is compared to the stack presented in Figure 11. This is a stack made of 270 rectangular chips with random initial chip position and the same process of deposition as the reference stack. Each chip has a length of 40 mm, a width of 10 mm and a thickness of 2 mm, which means that the volume of chips deposited is the same as in the reference stack made of square chips. The geometry of the chips is therefore different but all other parameters remain constant between the two stacks. These stacks look different to the naked eye, mainly due to the obvious difference in chip geometry. However, it is impossible to predict changes in porosity, local excess or lack of chips and contact distribution. This is where the descriptors come in.
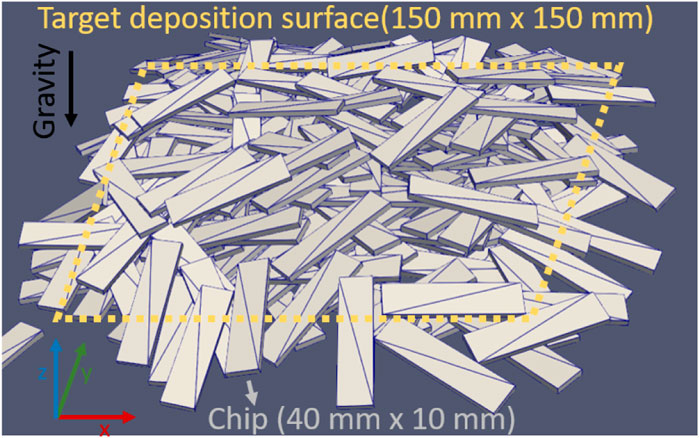
Figure 11. Stack made of 270 rectangle chips with random initial chip position. The chips are 40 mm long, 10 mm wide and 2 mm thick.
3.2.2 Analysis
The stacks presented in Figures 6, 11 are used to analyze the changes induced for a specific descriptor. It could be applied to any descriptor and has to be applied to each descriptor for a complete in-depth analysis of a stack. In this work, the influence of the chip geometry on the layer filling rate is studied. Figure 12 compares the number of elements per layer with the mean value obtained after ten repeats of the square deposition and ten repeats of the rectangular deposition (270 chips for each repetition). It appears that the lower layers of the rectangular chips, layers 0 to 4, are less filled. The stack of rectangular chips also tends to have a higher height. These characteristics can be directly related to the density of the stack. A stack with more layers that are less filled is less dense. This is useful information that could lead to adaptation of the consolidation parameters, for example, by increasing the temperature or the consolidation time for instance since the heat transfer is less favorable in this configuration.
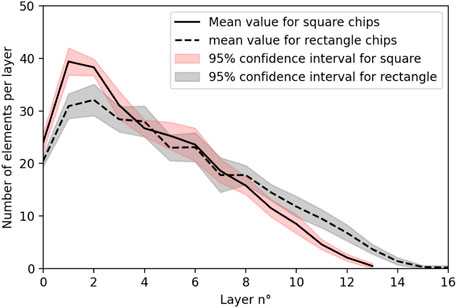
Figure 12. Comparison of the number of chips per layer for two differents stacks containing 270 rectangular or square chips (one layer = 2 mm section of stack thickness).
4 Experimental fitting
4.1 Experimental setup
An experimental deposition setup has been designed and built to validate the predictions of the numerical model. The sequence of steps is shown schematically in Figure 13. The setup aims to achieve a controlled deposition of chips with high confidence in reproducibility. The principle is to use a home-made vacuum box to hang a chip above the target deposition surface and follow a defined sequence visible from left to right in Figure 13:
This sequence of steps is similar to the deposition of batches of chips in the numerical simulation and aims at providing an experimental equivalent to the developed model. Only single chip depositions are performed experimentally. Since single chip depositions are the first step of any deposition and the simplest one, it seems to the author that the fitting of complex behaviors without prior single chip validation would not be relevant. The experimental fitting will focus on the behavior of a single chip as it falls and bounces on the deposition surface without any interaction with other falling or previously deposited chips.
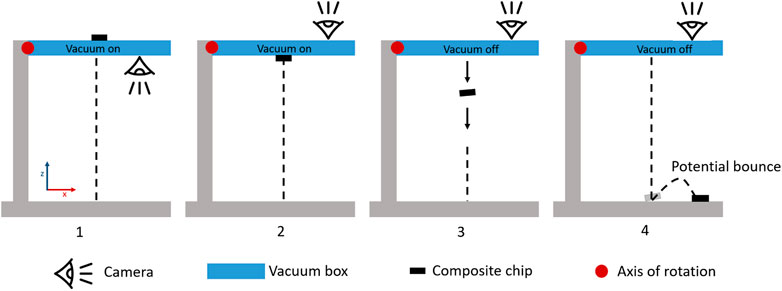
Figure 13. Experimental method and setup for single chip or batch deposition.
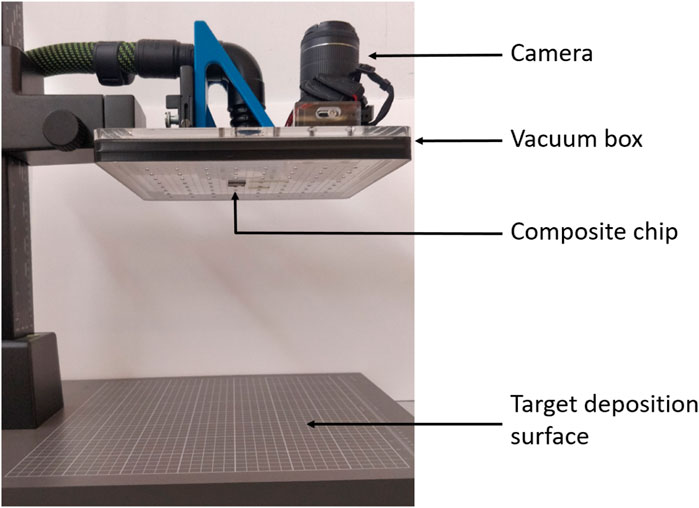
Figure 14. Picture of the setup for single chip or batch deposition at step 2.
4.2 Comparison with numerical predictions
The comparison between experimental measurement and numerical predictions is given after 50 depositions of single square chips with removal of previous deposited chips. Each deposition is performed with a controlled initial chip position (same position and orientation for each deposition) at a 20 cm height. First, the experimental deposition is performed. After each chip deposition, its final position is measured and displayed with a green marker in Figure 15. Figure 15 shows the top view of the target deposition surface, with the (0,0) position corresponding to the center of mass of the deposited chips in the initial position. In this initial position, the sides of the chips are aligned with the
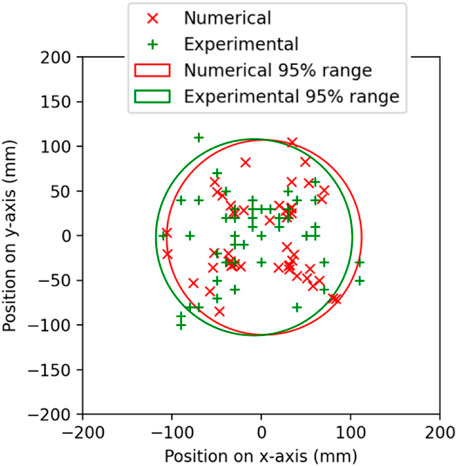
Figure 15. Comparion between the experimental and numerical depositions of square chips.
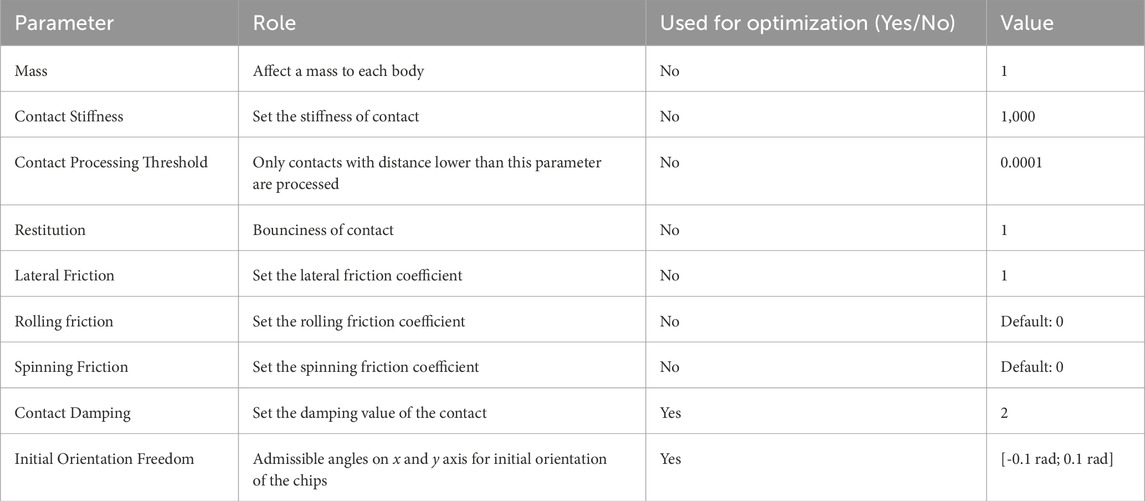
Table 1. PyBullet parameters after experimental fitting.
After this optimization, both experimental and numerical results look similar. The disks containing 95% of the chips have the same radius and the level of dispersion is similar. It is also interesting to note that some directions gather a majority of the final positions. An X-shaped distribution is visible in the center of the circle for both experimental and numerical chips. This is due to the controlled orientation of the chips. Each chip starts with sides parallel to
5 Theoretical validation
A similar model (Mahé’s model) based on a purely geometrical approach has been developed to describe the packing of fiber bundles in sheet molding compound (Mahé et al., 2022), this model has been compared to the model developed in (Sommer et al., 2020) and shows similar results. In the (Mahé et al., 2022) model, the prediction of values taken by descriptors, such as volume fraction, is based on integral geometry principles. It is valid for low density packing of thin and slender objects such as fibers and fiber bundles. This model has been extended to allow stack densification using finite element simulation (Mahé, 2023). The Timoshenko beam model (Timoshenko, 1921) is applied to the fiber bundles to accept rotations and an iterative compaction of the stack is performed. This sequence of random generation and densification is compared to the deposition model developed in this article. Mahé’s model is relevant for one dimension elements and does not take into consideration contacts such as side by side contact or end to end contact. In this work the aim is to map the contacts of three dimensions elements, that is why a new model was developed. The comparison of thin and long elements is here to validate that on similar objects that fulfills the hypothesis of both models the results are similar.
To achieve a fair comparison, the simulated objects (chips on one side and fibers on the other) had to be unified into similar objects. The comparison is then conducted on thin and slender objects, a rectangular chip of 1 mm width, 1 mm height and 25 mm long in the PyBullet environment, visible on the left hand side of Figure 16 and a cylindrical fiber of 1 mm diameter and 25 mm long visible on the right hand side of Figure 16. In each model, the studied configuration is a deposition of 1,000 objects on a square target deposition surface of 100 mm side. In the PyBullet environment the deposition is performed as a free fall of objects under gravity and in Mahé’s model (Mahé, 2023) the objects are randomly generated and then compacted using Timoshenko beam model to a density similar to that obtained with gravity. For both models, 10 random depositions are performed. Finally, the volume fractions and the number of contacts in the stacks are compared. Both models predicted very similar volume fractions as expected, a mean value of 6.68% for PyBullet and 6.61% for Mahé’s model. In terms of contacts, the average number of contacts for PyBullet is 2,169 with a standard deviation of 24, while in Mahé’s model the average number of contacts is 2,212 with a standard deviation of 42. Considering the means and standard deviations, both models are considered to give the same results.
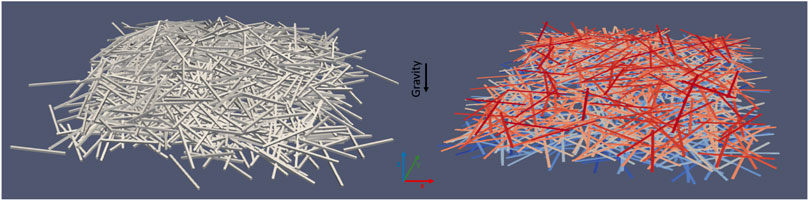
Figure 16. Comparison of stacks of 1,000 fibers on a square target deposition surface of 100 mm side. PyBullet stack on the left hand side and Mahé’s model (Mahé, 2023) stack on the right hand side (colors represents the labels of the of fibers in the stack).
To extend the validation process, a comparison with random packing of fibers in cylinders is also conducted. In (Freeman et al., 2019), fibers with different aspect ratios are packed in cylindrical containers of controlled height and diameter. Both experimental and computational data are post-processed to study the density of this type of packing. In order to generate a similar packing and compare the results, fibers are packed in a cylindrical container with the following parameters:
Each case is repeated 10 times and post-processed to extract a mean volume fraction and a standard deviation. An example of container filling is given in Figure 17. Fibers with an aspect ratio 25 led to a volume fraction of 14.8
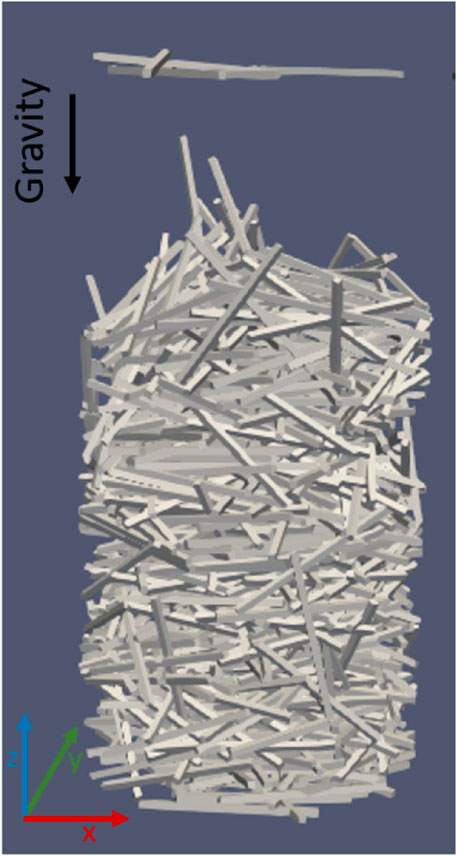
Figure 17. Fiber packing in progress in a cylindrical container (cylinder height to cylinder radius ratio = 2) without the view of the container to allow fiber vision. Snapshot during one packing in the 25 fiber aspect ratio case.
6 Conclusion
The developed packing model presented in this article aims to provide in-depth knowledge on stacks made of rigid objects such as composite chips. It has been shown that several descriptors can be calculated from the simulations in the PyBullet environment and that these descriptors allow the quantitative description and discrimination of stacks. The model has been validated by comparison with experimental data using a newly developed deposition setup. A comparison with other models was also presented, and it was found that the results are in agreement with analytically based models such as Mahé’s model (Mahé, 2023). This model is a promising tool to improve the understanding of packing. It could be improved in several ways in order to increase accuracy or to accommodate more materials and processes. First, the study of objects with random or complex shapes as the stack presented in Figure 18 would add more accuracy in modeling a real industrial mechanical recycling line. The geometry of the chips can be seen as a parameter of the model, thus changing the geometry does not change the process and as long as the amount of contacts generated are in the same amount, the computation time remains identical. Each chip can be generated from a geometry file, a database of admissible geometries could then be used to list all desired chips geometries. At each generation of chip one geometry could be picked up in the dataset either on purpose or following a statistical distribution. Then, several other descriptors can be developed using the same model, such as the measurement of the overlap area between solid objects, the angle distribution of the deposited chips, the fiber orientation among the deposited chips. In the stack presented in Figure 18, the addition of a variable tracking the orientation of the fibers inside the chips would be very relevant. This variable can be seen as a vector representing the fiber orientation in the chip coordinate system, which could be updated and available at each time step of the simulation. It highlights that the designed packing simulation is powerful and allows many possibilities in post-processing to build purpose-oriented quantitative descriptors. Moreover, finite element export from this model to create a meshed stack that would become the input file of a finite element solver would allow a complete model of the recycling process from shredded material to consolidated panels. Such a work is in progress. Finally, some parameters of the model and some steps of the deposition of the algorithm could be modified in order to match different recycling methods or other fields that include deposition steps, such as the manufacturing of OSB panels (Nishimura et al., 2002; Nishimura et al., 2004), controlled deposition of thermoset prepregs as performed by Fairmat company for recycling purpose (Fairmat, 2023), TUFF process (Yarlagadda et al., 2019), HiPerDiF method (Longana et al., 2016) and chip based aluminium recycling (Shamsudin et al., 2016).
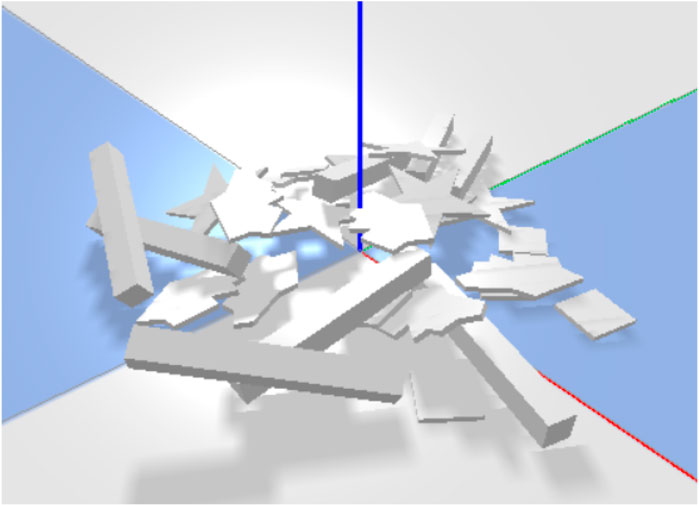
Figure 18. Stack generated in PyBullet with multiple geometries including: square, beam, star and random polygon geometries.
Data availability statement
The raw data supporting the conclusions of this article will be made available by the authors, without undue reservation.
Author contributions
AB: Conceptualization, Investigation, Methodology, Software, Visualization, Writing–original draft, Writing–review and editing. FM: Methodology, Software, Writing–review and editing. CB: Conceptualization, Funding acquisition, Methodology, Supervision, Writing–review and editing. SC-C: Conceptualization, Methodology, Supervision, Writing–review and editing. CL: Resources, Supervision, Validation, Writing–review and editing. ND: Resources, Supervision, Validation, Writing–review and editing.
Funding
The author(s) declare that financial support was received for the research, authorship, and/or publication of this article. This work was supported by the Cetim (France) and Région Pays de la Loire (France).
Conflict of interest
The authors declare that the research was conducted in the absence of any commercial or financial relationships that could be construed as a potential conflict of interest.
The author(s) declared that they were an editorial board member of Frontiers, at the time of submission. This had no impact on the peer review process and the final decision.
Publisher’s note
All claims expressed in this article are solely those of the authors and do not necessarily represent those of their affiliated organizations, or those of the publisher, the editors and the reviewers. Any product that may be evaluated in this article, or claim that may be made by its manufacturer, is not guaranteed or endorsed by the publisher.
References
Aste, T., Saadatfar, M., and Senden, T. J. (2006). Local and global relations between the number of contacts and density in monodisperse sphere packs. J. Stat. Mech. theory Exp. 2006 (07), P07010. doi:10.1088/1742-5468/2006/07/p07010
Babeau, A., Savart, T., Salinier, A., Hochstetter, G., and Deves, L. (2020). Rilsan® matrix pp a tapes and an innovative manufacturing process for new applications. SAMP E Eur.
Bender, J., Erleben, K., and Trinkle, J. (2014). Interactive simulation of rigid body dynamics in computer graphics,” in Comput. Graph. Forum 33, 246–270. doi:10.1111/cgf.12272
Bernatas, R., Dagréou, S., Despax-Ferreres, A., and Barasinski, A. (2021). Recycling of fiber reinforced composites with a focus on thermoplastic composites. Clean. Eng. Technol. 5, 100272. doi:10.1016/j.clet.2021.100272
Cetim Grandest (2023). Cetim grand est webpage. Available at: https://www.cetimgrandest.fr (Accessed October 24, 2023).
Coumans, E., and Bai, Y. (2021). Pybullet, a python module for physics simulation for games. robotics Mach. Learn. Available at: http://pybullet.org.
Fairmat (2023). Fairmat tech company. Available at: https://www.fairmat.tech (Accessed March 14, 2024).
Forró, C., Ihle, S. J., Reichmuth, A. M., Han, H., Stauffer, F., Weaver, S., et al. (2020). Visualizing and analyzing 3d metal nanowire networks for stretchable electronics. Adv. Theory Simulations 3 (8), 2000038. doi:10.1002/adts.202000038
Freeman, J. O., Peterson, S., Cao, C., Wang, Y., Franklin, S. V., and Weeks, E. R. (2019). Random packing of rods in small containers. Granul. Matter 21, 84–11. doi:10.1007/s10035-019-0939-x
Izadi, E., and Bezuijen, A. (2015). “Simulation of granular soil behaviour using the bullet physics library,” in 3rd international symposium on geomechanics from micro to macro (London, United Kingdom: Taylor and Francis Group-London), 2, 1565–1570. doi:10.1201/b17395-285
Kropka, M., Muehlbacher, M., Neumeyer, T., and Altstaedt, V. (2017). From ud-tape to final part–a comprehensive approach towards thermoplastic composites. Procedia CIRP 66, 96–100. doi:10.1016/j.procir.2017.03.371
Landry, B., and Hubert, P. (2015). Experimental study of defect formation during processing of randomly-oriented strand carbon/peek composites. Compos. Part A Appl. Sci. Manuf. 77, 301–309. doi:10.1016/j.compositesa.2015.05.020
Levy, A., and Hubert, P. (2015). Interstrand void content evolution in compression moulding of randomly oriented strands (ros) of thermoplastic composites. Compos. Part A Appl. Sci. Manuf. 70, 121–131. doi:10.1016/j.compositesa.2014.11.017
Liu, Y., Farnsworth, M., and Tiwari, A. (2017). A review of optimisation techniques used in the composite recycling area: state-of-the-art and steps towards a research agenda. J. Clean. Prod. 140, 1775–1781. doi:10.1016/j.jclepro.2016.08.038
Longana, M. L., Ong, N., Yu, H., and Potter, K. D. (2016). Multiple closed loop recycling of carbon fibre composites with the hiperdif (high performance discontinuous fibre) method. Compos. Struct. 153, 271–277. doi:10.1016/j.compstruct.2016.06.018
Mahé, F. (2023). Statistical mechanical framework for discontinuous composites: application to the modeling of flow in SMC compression molding. Paris (France): École centrale de Nantes. PhD thesis.
Mahé, F., Binetruy, C., Advani, S., Férec, J., and Eck, B. (2022). A multi-scale statistical description of stacks of non-cohesive thin particles. Powder Technol. 399, 116988. doi:10.1016/j.powtec.2021.11.032
Mower, C., Stouraitis, T., Moura, J., Rauch, C., Yan, L., Behabadi, N. Z., et al. (2023). “Ros-pybullet interface: a framework for reliable contact simulation and human-robot interaction,” in Conference on robot learning (Auckland, New Zealand: PMLR), 1411–1423.
Murray, R. E., Beach, R., Barnes, D., Snowberg, D., Berry, D., Rooney, S., et al. (2021). Structural validation of a thermoplastic composite wind turbine blade with comparison to a thermoset composite blade. Renew. Energy 164, 1100–1107. doi:10.1016/j.renene.2020.10.040
Nachtane, M., Meraghni, F., Chatzigeorgiou, G., Harper, L., and Pelascini, F. (2022). Multiscale viscoplastic modeling of recycled glass fiber-reinforced thermoplastic composites: experimental and numerical investigations. Compos. Part B Eng. 242, 110087. doi:10.1016/j.compositesb.2022.110087
Nishida, H., Carvelli, V., Fujii, T., and Okubo, K. (2018). Thermoplastic vs. thermoset epoxy carbon textile composites. IOP Conf. Ser. Mater. Sci. Eng. 406, 012043. doi:10.1088/1757-899x/406/1/012043
Nishimura, T., Amin, J., and Ansell, M. P. (2004). Image analysis and bending properties of model osb panels as a function of strand distribution, shape and size. Wood Sci. Technol. 38 (4), 297–309. doi:10.1007/s00226-003-0219-z
Nishimura, T., Ansell, M., and Ando, N. (2002). Evaluation of the arrangement of wood strands at the surface of osb by image analysis. Wood Sci. Technol. 36 (1), 93–99. doi:10.1007/s002260100117
Oliveux, G., Dandy, L. O., and Leeke, G. A. (2015). Current status of recycling of fibre reinforced polymers: review of technologies, reuse and resulting properties. Prog. Mater. Sci. 72, 61–99. doi:10.1016/j.pmatsci.2015.01.004
Panerati, J., Zheng, H., Zhou, S., Xu, J., Prorok, A., and Schoellig, A. P. (2021). “Learning to fly—a gym environment with pybullet physics for reinforcement learning of multi-agent quadcopter control,” in 2021 IEEE/RSJ international conference on intelligent robots and systems (IROS) (IEEE), 7512–7519.
Selezneva, M., and Lessard, L. (2016). Characterization of mechanical properties of randomly oriented strand thermoplastic composites. J. Compos. Mater. 50 (20), 2833–2851. doi:10.1177/0021998315613129
Shamsudin, S., Lajis, M., and Zhong, Z. (2016). Evolutionary in solid state recycling techniques of aluminium: a review. Procedia CIRP 40, 256–261. doi:10.1016/j.procir.2016.01.117
Sommer, D. E., Kravchenko, S. G., and Pipes, R. B. (2020). A numerical study of the meso-structure variability in the compaction process of prepreg platelet molded composites. Compos. Part A Appl. Sci. Manuf. 138, 106010. doi:10.1016/j.compositesa.2020.106010
Sudhin, A., Remanan, M., Ajeesh, G., and Jayanarayanan, K. (2020). Comparison of properties of carbon fiber reinforced thermoplastic and thermosetting composites for aerospace applications. Mater. today Proc. 24, 453–462. doi:10.1016/j.matpr.2020.04.297
Timoshenko, S. P. (1921). On the correction for shear of the differential equation for transverse vibrations of prismatic bars. Phil Mag. Ser. 41, 744–764. doi:10.1080/14786442108636264
Torquato, S., and Haslach, H. (2002). Random heterogeneous materials: microstructure and macroscopic properties. Appl. Mech. Rev. 55 (4), B62–B63. doi:10.1115/1.1483342
World Wide (2023). Procede de recyclage de pieces en composite thermoplastique. Available at: https://worldwide.espacenet.com (Accessed October 24, 2023).
Yarlagadda, S., Deitzel, J., Heider, D., Tierney, J., and Gillespie, J. W. (2019). Tailorable universal feedstock for forming (tuff): overview and performance. NC: SAMPE 2019-Charlotte.
Appendix
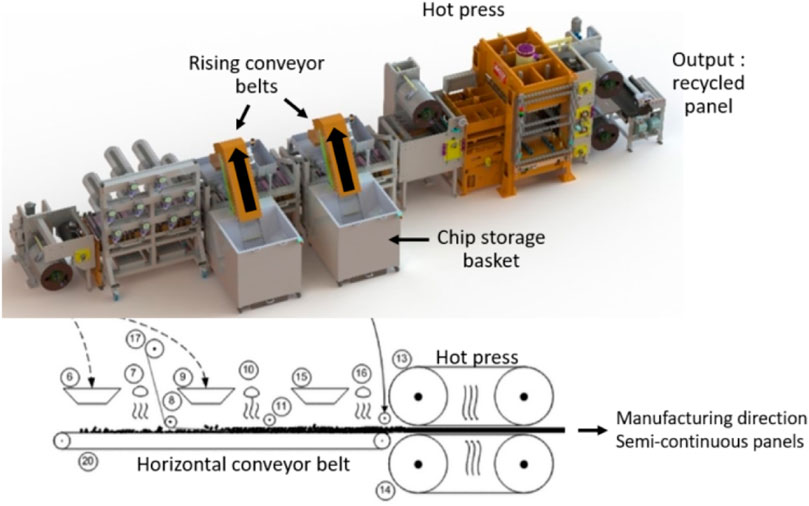
FIGURE A1. Schematic view of Thermoplastic recycling process, from left to right, the line is fed by two sequential rising conveyor belts which are then horizontally conveyed, pressed and consolidated into semi-continuous panels (Cetim Grandest, 2023).
Keywords: packing simulation, composites recycling, thermoplastic composites, process simulation, process modeling
Citation: Bruneau A, Mahé F, Binetruy C, Comas-Cardona S, Landry C and Durand N (2024) Packing simulation and analysis applied to a thermoplastic composite recycling process. Front. Mater. 11:1420014. doi: 10.3389/fmats.2024.1420014
Received: 19 April 2024; Accepted: 18 June 2024;
Published: 30 July 2024.
Edited by:
Chung Hae Park, IMT Lille Douai, FranceReviewed by:
Anaïs Barasinski, Université de Pau et des Pays de l'Adour, FranceAnurag Pisupati, Industrial technical center for plastics and composites, France
Copyright © 2024 Bruneau, Mahé, Binetruy, Comas-Cardona, Landry and Durand. This is an open-access article distributed under the terms of the Creative Commons Attribution License (CC BY). The use, distribution or reproduction in other forums is permitted, provided the original author(s) and the copyright owner(s) are credited and that the original publication in this journal is cited, in accordance with accepted academic practice. No use, distribution or reproduction is permitted which does not comply with these terms.
*Correspondence: Awen Bruneau, YXdlbi5icnVuZWF1QGVjLW5hbnRlcy5mcg==