 Qin Zhang
 Liuyang Qin1,2
95% of researchers rate our articles as excellent or good
Learn more about the work of our research integrity team to safeguard the quality of each article we publish.
Find out more
ORIGINAL RESEARCH article
Front. Mater. , 23 May 2024
Sec. Structural Materials
Volume 11 - 2024 | https://doi.org/10.3389/fmats.2024.1415182
This article is part of the Research Topic Physico-Mechanical Properties and Treatment Technology of Hazardous Geomaterials-Volume III View all 7 articles
Phyllite residual soil is a typical regional soil formed from the weathering of phyllite rock formations, characterized by poor engineering properties. The swelling pressure could pose a threat to roadbed stability and other geological engineering disasters during the rainy season. Therefore, studying the swelling pressure of phyllite residual soil is critical for ensuring the sustainable development of both human society and the natural environment. In this study, a series of swelling pressure tests were conducted on the phyllite residual soil to determine its swelling pressure, and nuclear magnetic resonance (NMR) test was applied to assess the evolution of soil fabric in both the initial unsaturated state and saturated state. The results indicate that the swelling rate of phyllite residual soil is negatively correlated with the initial water content and positively correlates with the dry density. The denser or drier the phyllite residual soil is in its initial state, the higher the equilibrium swelling pressure will be. The analysis of T2 distribution curves reveals that during the wetting process in phyllite residual soil, water fills micropores prior to macropores until water fills up all pores.
China is known for its complex and rugged terrain, which features a variety of soil types spread across different regions. Phyllite residual soil, a typical regional soil formed from the weathering of phyllite rock formations, widely found throughout the country (Zhao et al., 2022). It is characterized by poor engineering properties, including a loose structure, water sensitivity, and low strength, making it considered as a poor roadbed material (Garzón et al., 2015; Li et al., 2024).
Longsheng County in Guilin, renowned as a national ecological demonstration county, is situated in a subtropical monsoon climate zone characterized by hot and rainy weather, and is rich in phyllite rock (Yin et al., 2023). The substantial amount of rainfall in the area has caused significant weathering of the phyllite rock, leading to the formation of extensive phyllite residual soils. These soils, prone to uneven swelling when absorbing water, have contributed to roadbed instability and other geological engineering disasters during the rainy season. This poses a serious threat to the safety of local residents and their properties, as well as hampers the economic and tourism development of the region.
Recently, phyllite weathered soil has begun to attract the attention of researchers (Ansari et al., 2021; Liu et al., 2022). Garzón et al. (2010) conducted macroscopic and microscopic testing methods to present the physical and geotechnical properties of phyllite weathered soil. This included mineralogical and chemical characterization, microstructural characterization, volume-change behavior and shear strength, water-retention and water-permeability properties. These tests aided in constructing a hydraulic mechanical database of phyllite weathered soil and assessing its engineering suitability. Chen et al. (2021) examined the direct and reverse shear characteristics of weathered phyllite and different soil types, and observed that the ductile shear behavior of weathered phyllite matched the creep deformation of the landslides it was associated with. Yin et al. (2023) studied the effects of dry-wet cycling on the shear strength of phyllite weathered soil, and found that the shear strength of the soil weakened as the number of cycles increased. Besides, a few studies explored engineering behaviors of the modified phyllite weathered soil. Mao et al. (2017) enhanced the mechanical properties of weathered soil by using cement admixture, and found that the water content and soaking time were crucial factors in determining the mechanical characteristics of cement-modified phyllite weathered soil subgrade. Liu et al. (2019) and Zhao et al. (2023) had added cement, red clay or lime to the phyllite weathered soil, and the results reflected that these additives effectively enhanced the hydraulic behavior of weathered phyllite soil. However, a scarce number of studies is available on the swelling pressure of phyllite weathered soil during saturation, which is very importance for the durability of a roadbed.
The swelling behavior of soils, caused by the absorption of water in fine-grained soils, often results in engineering failures such as differential settlement and other issues (Du et al., 2021; Taherdangkoo et al., 2023; Tsiampousi et al., 2024). Plenty of studies have discussed the swelling deformation properties of soil (Du et al., 2020; Ghalamzan et al., 2022; Al-Taie et al., 2023). Most studies focused on the swelling properties of expansive soil or bentonite, as it was considered harmful to barrier materials used in high-level radioactive waste repositories or landfills due to significant swelling deformation (Eyo et al., 2019; Tanaka et al., 2019; Liang et al., 2021; Kale et al., 2023). Nevertheless, during the construction of roads, filling materials for the roadbed are typically sourced locally. Therefore, it is important to explore the swelling pressure of various types of soil.
The main objective of this research is to comprehensively study the properties of swelling pressure in phyllite residual soil through experimental analysis. The study aims to investigate the impact of key parameters, such as initial moisture content and dry density, on the swelling pressure demonstrated by phyllite residual soil. By achieving this objective, the research aims to provide valuable insights for effective geotechnical engineering practices in areas characterized by phyllite residual soil.
The researched phyllite residual soil, sampled from Guilin, Guangxi, China. Based on the Chinese Standard (GB/T 50123-2019, MWR, 2019) and X-ray diffraction testing, the particle size distribution curve of the tested phyllite residual soil is shown in Figure 1, while the physical and chemical properties of the phyllite residual soil are detailed in Table 1. Notably, specific gravity represents the ratio of the mass of solid particles in the soil to the mass of pure water at 4°C in the same volume, the unit can be considered as 1.

Figure 1. Particle size distribution curve.

Table 1. Physical and chemical properties of phyllite residual soil.
The constant volume method was employed to measure the swelling pressure (i.e., equilibrium swelling pressure) of the tested phyllite residual soil. The experimental apparatus, as shown in Figure 2, consists of a high-stiffness stainless steel frame that restricts deformation and ensures the volume of the soil sample remains constant throughout the entire testing process. Additionally, there is a channel at the bottom of the device that connects to a water pump for water penetration. The variation in swelling pressure during the soil immersion process can be monitored through a pressure sensor (measured in kPa).
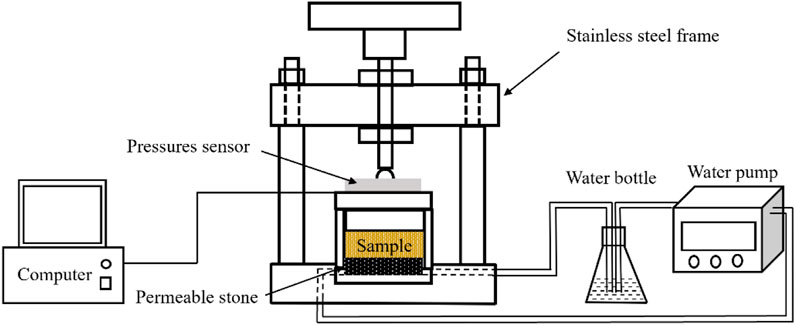
Figure 2. Schematic device for measuring swelling pressure.
The sampled phyllite residual soil was first air-dried and crushed through a 2 mm sieve. Then the soil powder was dried at 105°C in an oven for 24 h (Bai et al., 2023). The dried soil powder was cooled and stored in a sealed plastic bucket for sample preparation. The soil samples were prepared by controlling the dry density and initial water content. The dry density was controlled at 1.4 g/cm3, 1.5 g/cm3, and 1.6 g/cm3, while the target initial water content was set at 6%, 10%, 14%, 18%, and 24%. The experimental scheme is given in Table 2.
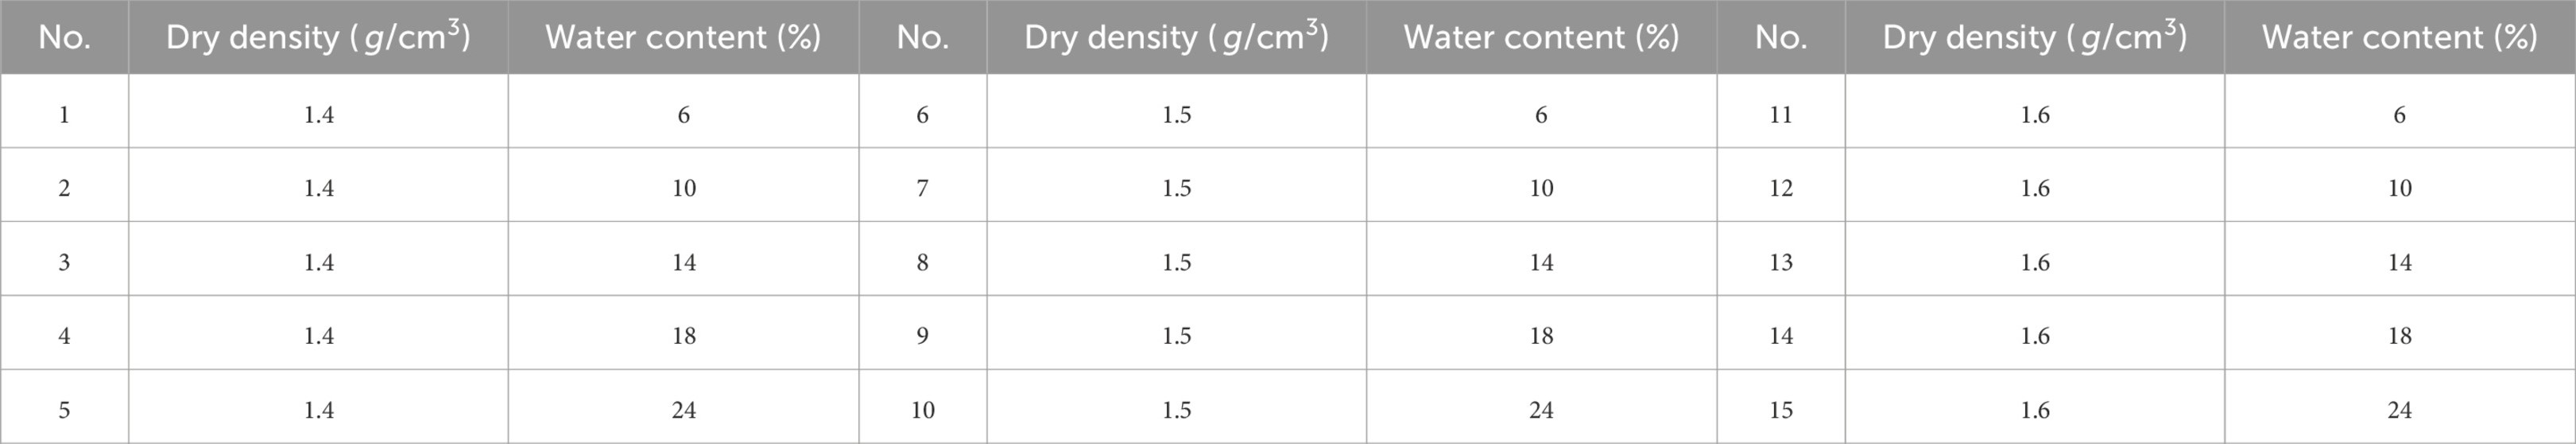
Table 2. Swelling pressure test of phyllite residual soil.
Deionized water was added according to the target water content to ensure full contacting between water and soil, uniform particle size distribution (without clumping or aggregation). The soil was then placed in a sealed plastic bag, stored in a moisturizing cylinder for 48 h, achieving moisture equilibrium. Subsequently, the specimens were statically compacted in a ring of 20 mm height and 61.8 mm diameter, while maintaining a soil height of 10 mm (not completely filling the ring cutter). This was done to prevent soil particles from swelling over the ring cutter during water immersion, and to make it easier to calculate the swelling pressure per unit height (1 cm) of the sample.
The specimen was placed between two filter papers both on the top and bottom surfaces. A 61.5 mm diameter and 10 mm thick iron block was placed and filled inside the ring cutter to restrict significant vertical deformation of the sample. A permeable stone with a diameter of 61.5 mm and thickness of 10 mm was placed at the base, and the ring cutter was positioned at the center of the permeable stone. The pressure sensor centrally placed and aligned with the iron block above the soil sample. To prevent loss of soil particles, the water pump initially operated at 50% speed until the circulating water uniformly flowed into the water bottle below the base without any bubbles for 5 min. Then, the pump speed was adjusted to 100% to fully saturate the specimen until the end of the experiment. Data recordings were taken at specific time intervals (1, 3, 5, 10, 15, 20, 30 min, 1 h, 2 h, 3 h, 4 h, 6 h, 8 h), followed by recordings every 2 h. The experiment was deemed complete when the data remained unchanged within a 2-h interval.
As a non-destruction detection, nuclear magnetic resonance (NMR) measurement is widely applied to determine the distribution properties of pore water in the soil (Liang et al., 2021; Qin et al., 2023; Yu et al., 2024). By using of CPMG (Carr-Purcell-Meiboom-Gill) pulse sequence, the CPMG curve which depicts the variation of nuclear magnetic resonance signal with time in the process of free attenuation is obtained. After the Fourier transform of CPMG curve, the T2 (i.e., transverse relaxation time) distribution curve of the sample can be acquired. According to the property of T2 distribution curve, which could reflect the restricted state of pore water directly, the distribution characteristics of pores in porous media can be determined by NMR technique.
In this test, NMR measurements were carried out using a MacroMR12-110H-l low-field nuclear magnetic resonance analyzer, which was manufactured by Newman Corporation, China. The magnet was held at a temperature of 32 °C, with a variation of ±0.01°C. The echo time of the CPMG pulse sequence was set at 0.12 ms, with a repetition time of 1,000 ms and 1,000 echoes. The specimens were statically compacted to a heigh of 10 mm and a diameter of 61.8 within a polytetrafluoroethylene (PTFE) ring, aiming at eliminating any interference with the signal. After the NMR test, the samples underwent a swelling pressure test. Once the swelling pressure test was completed, the samples were carefully removed from the testing device and placed into the NMR coil for microfabric measurement in the saturated state.
The temporal variation of swelling pressure for phyllite residual soil of varying dry densities is depicted in Figure 3. Significant differences in swelling pressure variations during the saturation process can be observed in samples with different initial states. During the saturation process, the change in swelling pressures for phyllite residual soil can be divided into two stages. During the initial swelling stage upon water absorption, which lasts approximately 10 min at a dry density of 1.4 or 1.5 g/cm3, and about 25 min at a dry density of 1.6 g/cm3, the swelling pressure of the phyllite residual soil increases rapidly and linearly over time due to absorbing a large amount of water. This stage is characterized by the dependence of swelling pressure and rate on the initial water content. The relationship between the swelling rate and initial water content and dry density of the phyllite residual soil has been summarized in Table 3. Specifically, a lower initial water content results in a faster swelling rate and greater swelling pressure. The second stage is the uniform swelling stage, characterized by a relatively stable swelling rate. Phyllite residual soil continues to exhibit linear swelling in this stage, with the swelling pressure gradually increasing until reaching the equilibrium swelling pressure and stabilizing. Importantly, the lower the initial water content, the higher the equilibrium swelling pressure will be.
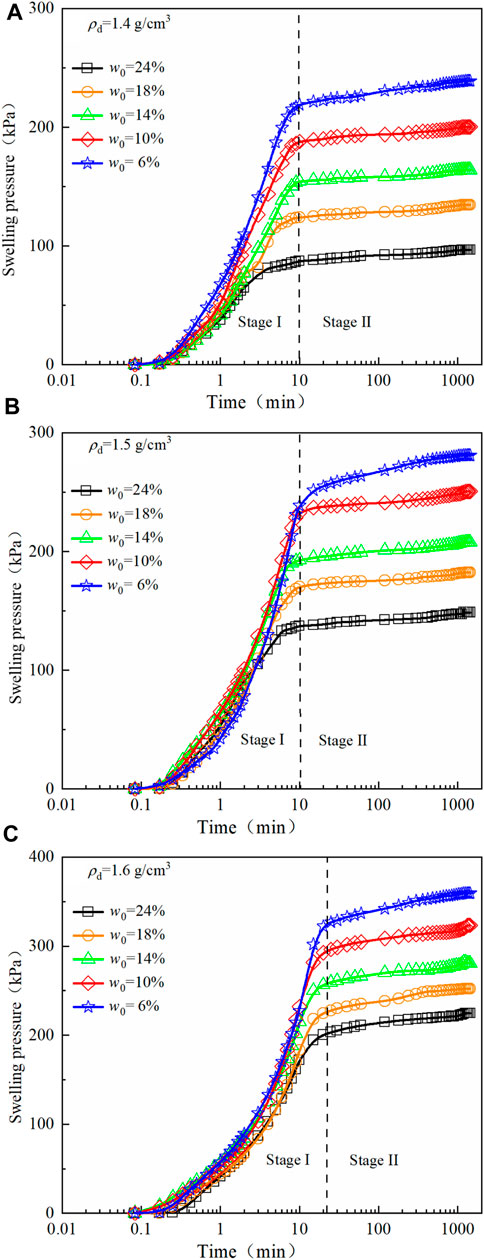
Figure 3. Temporal variations of swelling pressure for the specimens of: (A) ρd = 1.4 g/cm3; (B) ρd = 1.5 g/cm3; (C) ρd = 1.6 g/cm3.
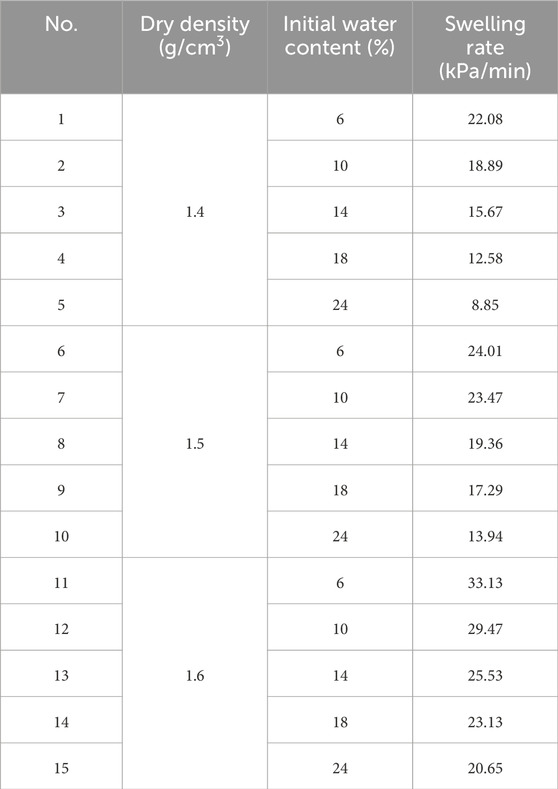
Table 3. Swelling rate of phyllite residual soil.
The specimens have the same dry density, which mean that the content of hydrophilic clay minerals per unit volume (e.g., kaolinite) is essentially identical. This suggests that the water absorption capacity of the samples is similar. However, varying initial water contents led to different matric suction levels in the soil. A lower initial water content results in greater matric suction during the water adsorption process (Bai et al., 2020), leading to increased water absorption and a larger swelling rate. On the other hand, samples with a higher initial water content experience some swelling pressure release before water adsorption occurred, resulting in lower matric suction and smaller degree of swelling during the swelling pressure test. This ultimately led to a lower equilibrium swelling pressure in samples with higher water contents, as compared to samples with lower initial water content.
Figure 4 illustrates the temporal variation of swelling pressure for phyllite residual soil with different water contents. Under the same initial water content conditions, it can be observed that in the initial stages of water adsorption, the phyllite residual soil with higher dry density shows faster swelling rate (Table 3) and greater swelling pressure. Consequently, in the second stage, the specimens with higher dry densities stabilize at a larger equilibrium swelling pressure by the end of the swelling pressure test.
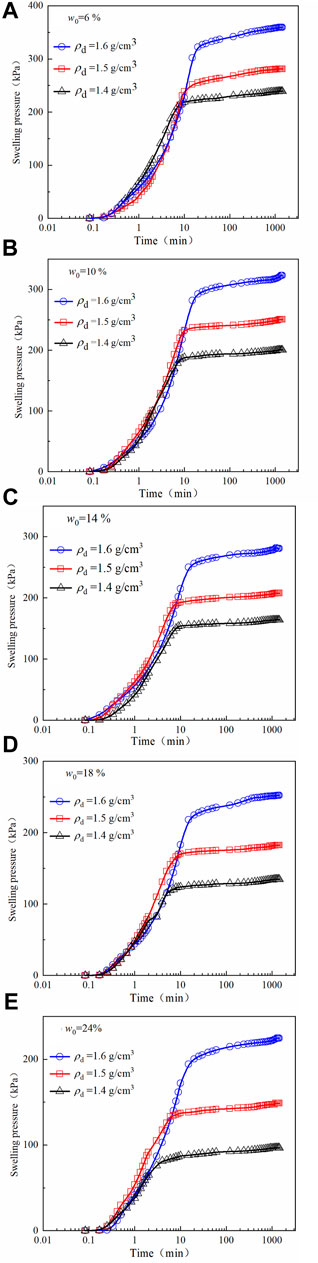
Figure 4. Temporal variations of swelling pressure for the specimens of: (A) w0 = 6%; (B) w0 = 10%; (C) w0 = 14%; (D) w0 = 18%; (E) w0 = 24%.
When the samples have the same initial water content, the content of hydrophilic clay minerals per unit volume, such as kaolinite, vary with different dry densities. This indicates that the water absorption capacity of phyllite residual soil also varies. During the initial stage of swelling, samples with higher dry density contain a larger amount hydrophilic clay mineral, demonstrating a greater water absorption capacity which results in a faster swelling rate and higher equilibrium swelling pressure during water adsorption. Therefore, as dry density increases, the equilibrium swelling pressure of specimens also increases.
The results of the equilibrium swelling pressure obtained from this experiment are displayed in Table 4. It is evident that the equilibrium swelling pressure exhibits a decreasing trend as the initial water content increased, while the dry density remains unchanged. The equilibrium swelling pressure of the phyllite residual soil decreases by approximately 59.5%, 47.1%, and 37.5% as the initial water content increases from 6% to 24% at dry densities of 1.4 g/cm3, 1.5 g/cm3 or 1.6 g/cm3, respectively.
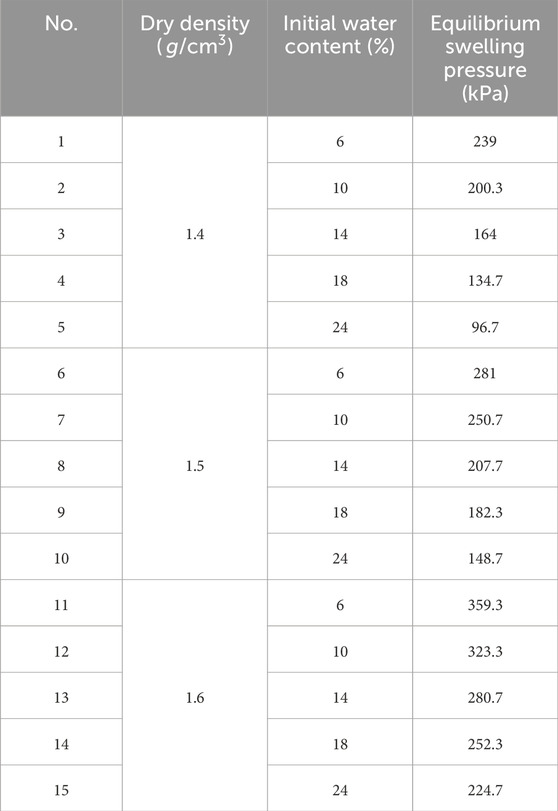
Table 4. Equilibrium swelling pressure of phyllite residual soil.
In a scenario of constant dry density, the content of hydrophilic clay minerals in the samples is generally similar. Thus, the initial water content directly affects the swelling potential during water absorption. When the initial water content is higher, the thickness of the double diffused layer (DDL) is thicker, the hydrophilic clay minerals in the phyllite residual soil have already gone through water absorption and swelling, releasing some swelling pressure before adding more water. The specimens start with lower initial water content, which have a thinner DDL, are able to absorb more water during saturation, resulting in greater volume swelling. In the constant volume method, which restricts volume changes, DDL swelling causes increased particle interactions, leading to higher pressure transmitted between particles and subsequently higher swelling pressure for the phyllite residual soil (Keskin et al., 2023).
Conversely, samples with higher initial water content have already experienced swelling before additional water is pumped in, resulting in reduced water absorption during saturation and subsequently lower volume swelling, leading to lower equilibrium swelling pressure.
To better understand the relationship between the equilibrium swelling pressure and initial water content of the phyllite residual soil, the results are displayed in Figure 5. It is clear that the equilibrium swelling pressure and initial water content follow an exponential function relationship. When the dry density is constant, the relationship between equilibrium swelling pressure and initial water content can be fitted using Eq. 1:
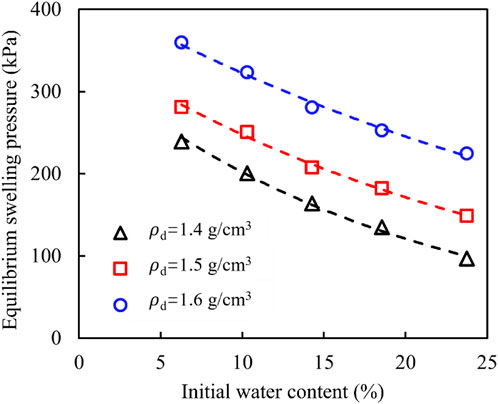
Figure 5. Relationship between initial water content and equilibrium swelling pressure.
Where P is the equilibrium swelling pressure (kPa); w0 is the initial water content (%), and a, b are fitting parameters.
Table 5 presents the variations of the fitting parameters, a and b, with dry density, along with the fitting coefficient R2 values of 0.998, 0.9947, and 0.9938. These values indicate that the fitted curve based on this relationship formula effectively describes the relationship between equilibrium swelling pressure and initial water content.
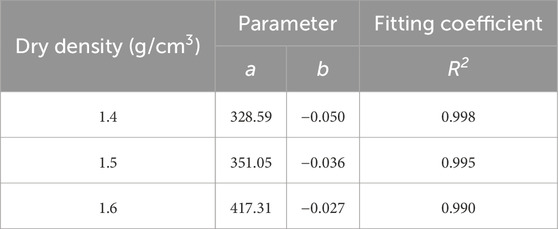
Table 5. Fitting parameters for equilibrium swelling pressure and initial water content.
As shown in Table 4, the equilibrium swelling pressure exhibits an increasing trend as the initial dry density of water content increased, while the initial water content remains unchanged. The equilibrium swelling pressure of the phyllite residual soil increases by approximately 33.5%, 38%, 41.6%, 46.6%, and 60% as the dry density increases from 1.4 g/cm3 to 1.6 g/cm3 at initial water content of 6%, 10%, 14%, 18%, and 24%, respectively.
When the initial water content was the same, differing dry densities directly affected the amounts of hydrophilic clay minerals present in the samples. Higher dry densities led to greater quantities of hydrophilic clay minerals, thereby enhancing their water absorption capacity. This increases water absorption capacity results in greater water uptake and volume swelling when the samples are exposed to sufficient water, particularly in a confined volume environment. Moreover, higher dry densities in phyllite residual soil, which has fewer internal porous spaces, restricted the available space for DDL swelling, leading to increased pressure transmitted between soil particles and ultimately higher equilibrium swelling pressure (Ye et al., 2015; Jadda and Bag, 2020; Liu et al., 2023).
To better understand the relationship between equilibrium swelling pressure and dry density of the phyllite residual soil, the results are displayed in Figure 6. It is evident that the equilibrium swelling pressure and dry density also exhibited an exponential function relationship, confirming the findings of previous studies (Arifin et al., 2009; Wen et al., 2017; Jadda and Bag, 2020). The overall trend showed that the equilibrium swelling pressure increased exponentially with increasing dry density, emphasizing the significant impact of dry density on equilibrium swelling pressure. When the initial water content was constant, the relationship between equilibrium swelling pressure and dry density can be fitted using Eq. 2:
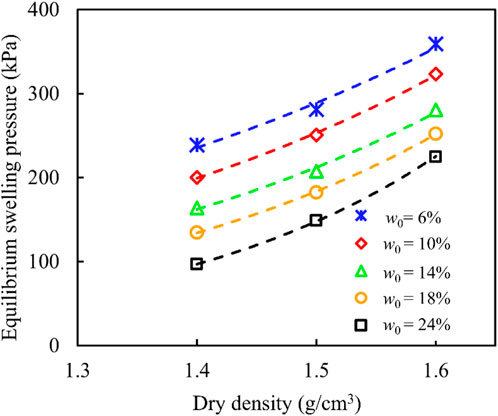
Figure 6. Relationship between dry density and equilibrium swelling pressure.
Where ρd is the dry density (g/cm3), and c, d are fitting parameters.
Table 6 presents information on how the fitting parameters, c and d, change with initial water content, along with the fitting coefficient R2 values of 0.9562, 0.9987, 0.9955, 0.9996, and 0.9999. This demonstrates that the fitted curve, calculated based on this relationship formula, accurately represents the relationship between equilibrium swelling pressure and dry density.

Table 6. Fitting parameters for equilibrium swelling pressure and dry density.
The NMR experiments were used to analyze the characteristics of pore water distribution, as shown in Figures 7, 8. The T2 (x-axis) stands for the magnitude of pore radius in soils, and the NMR signal intensity (y-axis) represents the proportion of water content in pores. Besides, the aera under T2 curve, namely, as “peak aera”, indicates the amount of water content in specimen (Tian et al., 2017; Ma et al., 2020).
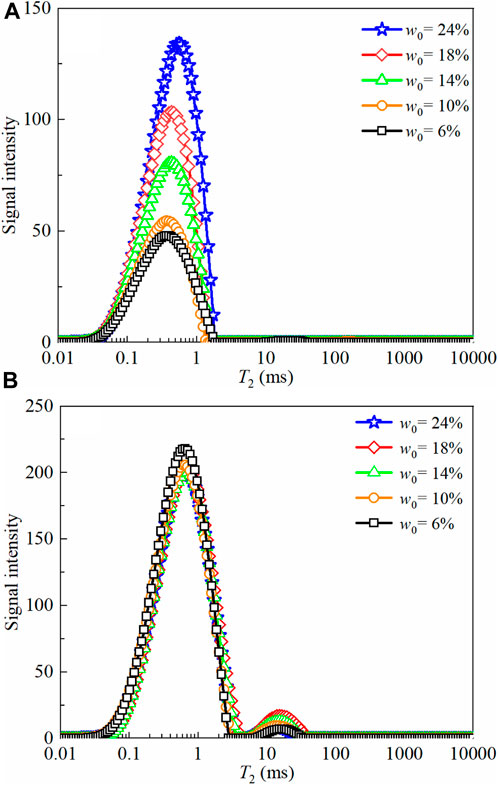
Figure 7. T2 distribution curves of specimens with ρd = 1.6 g/cm3 for: (A) initial state; (B) saturation.
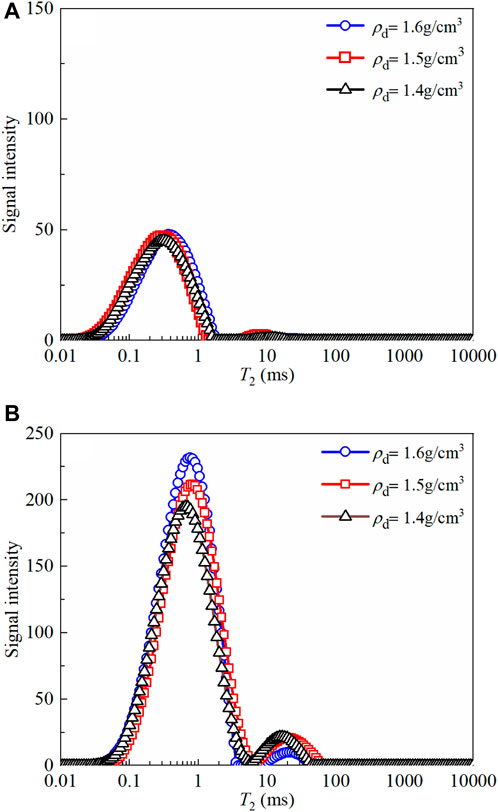
Figure 8. T2 distribution curves of specimens with w0 = 6% for: (A) initial state; (B) saturation.
It is evident that the T2 distribution curves of phyllite residual soil, with a dry density of 1.6 g/cm3, exhibit a unimodal pore structure in the initial state (Figure 7A). As the initial water content increased from 6% to 24%, the peak area of T2 continued to increase. When the samples absorb water to saturation after the swelling pressure test, the T2 distribution curves become bimodal (Figure 7B), and both peak aera are higher than in the initial state. Additionally, samples with lower initial water content exhibit a higher peak area on the left side, while samples with higher initial water content display a higher peak area on the right side. However, the total peak area is found to be almost identical for all samples. Similar observations have also been made for specimens with dry densities of 1.4 g/cm3 or 1.5 g/cm3 (although their NMR T2 distribution curves are not shown here).
The left peak of T2 represents water-saturated micropores, while the right peak stands for water-saturated macropores. During the wetting process in soils, water primarily fill the micropores within the aggregates, before slowly moving to fill the macropores between the aggregates (Suzuki et al., 2005; Ye et al., 2015). Consequently, specimens with higher initial water content have a larger left peak area of T2 in the initial state (Figure 7A), while the total peak area is almost identical at saturation for samples of the same dry density (Figure 7B). Additionally, lower initial water content in samples results in greater matric suction during the water adsorption process, leading to a higher proportion of water content in micropores and higher swelling pressure at saturation. Conversely, samples with higher initial water content have lower matric suction, resulting in a relatively higher proportion of water content in macropores and less swelling pressure at saturation.
The T2 distribution curves of specimens with the initial water content of 6% at different dry densities are displayed in Figure 8. As the dry density of the specimens increases from 1.4 g/cm3 to 1.6 g/cm3, the peak area of T2 slightly increases in the initial state (Figure 8A). When the samples absorb water to saturation after the swelling pressure test, the T2 distribution curves become bimodal (Figure 8B), and both peak areas are higher than in the initial state. Additionally, samples with a looser structure exhibit a higher peak area on the right side, while samples with a denser structure display a higher peak area on the left side. Similar observations were also made for specimens with other initial water content (although some NMR T2 distribution curves are not displayed here).
In the initial state before the swelling pressure test, due to the difference in water content of specimens with dry densities ranging from 1.4 g/cm3 to 1.6 g/cm3 is not significant, the corresponding peak aera of T2 only slightly increases (Figure 8A). As specimens absorb water to saturation, the peak area increases significantly compared to the initial state (Figure 8B). Additionally, samples with higher dry densities exhibit a denser structure and smaller voids, resulting in a higher left peak area and swelling pressure at saturation. Conversely, specimens with lower dry densities have a looser structure and relatively larger voids, leading to a higher right peak area and lower swelling pressure at saturation.
Several swelling pressure experiments were conducted on phyllite residual soil specimens treated with various water content at different dry densities. The temporal variation of swelling pressure was evaluated, and the equilibrium swelling pressure was determined. To explore the underlying mechanism for the swelling pressure of phyllite residual soil, the NMR technique was applied to detect the characteristics of pore water distribution in the phyllite residual soil specimens. The conclusion can be drawn as follows:
1. The temporal variation of swelling pressure for phyllite residual soil can be divided into two stages: the initial accelerated swelling stage and the uniform swelling stage. The swelling rate was negatively correlated with the initial water content and positively correlated with the dry density.
2. The equilibrium swelling pressure showed an exponential relationship with both initial water content and dry density. The denser or drier the phyllite residual soil is in its initial state, the higher the equilibrium swelling pressure will be.
3. The T2 distribution curve of the phyllite residual soil exhibited a unimodal peak pattern, representing micropores in the initial unsaturated state. However, it displayed a bimodal peak pattern at saturation, with the left peak representing micropores and the right peak representing macropores. During the process of wetting in the soils, the water would fill micropores prior to macropores until water fills up with all pores. The denser or drier the phyllite residual soil is in its initial state, the higher the left peak aera will be after the swelling pressure test.
The original contributions presented in the study are included in the article/Supplementary Material, further inquiries can be directed to the corresponding authors.
QZ: Conceptualization, Data curation, Funding acquisition, Investigation, Methodology, Validation, Writing–original draft, Writing–review and editing. LQ: Formal Analysis, Investigation, Methodology, Resources, Writing–original draft. HT: Formal Analysis, Investigation, Writing–original draft. MY: Formal Analysis, Investigation, Software, Validation, Writing–original draft. JJ: Formal Analysis, Investigation, Methodology, Writing–original draft. WY: Formal Analysis, Methodology, Writing–original draft. RY: Conceptualization, Resources, Supervision, Validation, Writing–review and editing.
The author(s) declare that financial support was received for the research, authorship, and/or publication of this article. This research was funded by the Science and Technology Department of Guangxi (No. AD20325010), the National Natural Science Foundation of China (No. 42307239), the Key Scientific Research Projects of Higher Education Institutions in Henan Province (No. 23A560016), the Middle-aged and Young Teachers’ Basic Ability Promotion Project of Guangxi (No. 2022KY0248), and the Guangxi Key Laboratory of Green Building Materials and Construction Industrialization (No. 22-J-21-31).
The authors declare that the research was conducted in the absence of any commercial or financial relationships that could be construed as a potential conflict of interest.
All claims expressed in this article are solely those of the authors and do not necessarily represent those of their affiliated organizations, or those of the publisher, the editors and the reviewers. Any product that may be evaluated in this article, or claim that may be made by its manufacturer, is not guaranteed or endorsed by the publisher.
Al-Taie, A., Yaghoubi, E., Wasantha, P. L. P., Staden, R. V., Guerrieri, M., and Fragomeni, S. (2023). Swelling and collapse behavior of unsaturated expansive subgrades stabilized with recycled glass. Transp. Geotech. 41, 101039. doi:10.1016/j.trgeo.2023.101039
Ansari, T., Kainthola, A., Singh, K. H., Singh, T. N., and Sazid, M. (2021). Geotechnical and micro-structural characteristics of phyllite derived soil; implications for slope stability, Lesser Himalaya, Uttarakhand, India. Catena 196, 104906. doi:10.1016/j.catena.2020.104906
Arifin, Y. F., and Schanz, T. (2009). Osmotic suction of highly plastic clays. Acta Geotech. 4, 177–191. doi:10.1007/s11440-009-0097-0
Bai, B., Bai, F., Nie, Q. K., and Jia, X. X. (2023). A high-strength red mud–fly ash geopolymer and the implications of curing temperature. Powder Technol. 416, 118242. doi:10.1016/j.powtec.2023.118242
Bai, B., Xu, T., Nie, Q. K., and Li, P. P. (2020). Temperature-driven migration of heavy metal Pb2+ along with moisture movement in unsaturated soils. Int. J. Heat. Mass Tran. 153, 119573. doi:10.1016/j.ijheatmasstransfer.2020.119573
Chen, W. W., Song, B. H., Wu, W. J., Sun, Y. F., and Song, Y. P. (2021). Direct and reversal shear behaviors of three kinds of slip zone soil in the Northwest of China. B. Eng. Geol. Environ. 80, 3939–3952. doi:10.1007/s10064-021-02174-w
Du, J., Zhou, A., Lin, X., Bu, Y., and Kodikara, J. (2020). Revealing expansion mechanism of cement-stabilized expansive soil with different interlayer cations through molecular dynamics simulations. J. Phys. Chem. C 124 (27), 14672–14684. doi:10.1021/acs.jpcc.0c03376
Du, J. P., Zhou, A. N., Lin, Z. S., Bu, Y. H., and Kodikara, J. (2021). Prediction of swelling pressure of expansive soil using an improved molecular dynamics approach combining diffuse double layer theory. Appl. Clay Sci. 203, 105998. doi:10.1016/j.clay.2021.105998
Eyo, E. U., Ng'ambi, S., and Abbey, S. J. (2019). Effect of intrinsic microscopic properties and suction on swell characteristics of compacted expansive clays. Transp. Geotech. 18, 124–131. doi:10.1016/j.trgeo.2018.11.007
Garzón, E., Cano, M., O’Kelly, B. C., and Sánchez-Soto, P. J. (2015). Phyllite clay-cement composites having improved engineering properties and material applications. Appl. Clay Sci. 114, 229–233. doi:10.1016/j.clay.2015.06.006
Garzón, E., Sánchez-Soto, P. J., and Romero, E. (2010). Physical and geotechnical properties of clay phyllites. Appl. Clay Sci. 48 (3), 307–318. doi:10.1016/j.clay.2009.12.022
Ghalamzan, F., Rosa, J. D., Gajo, A., and Maio, C. D. (2022). Swelling and swelling pressure of a clayey soil: experimental data, model simulations and effects on slope stability. Eng. Geol. 297, 106512. doi:10.1016/j.enggeo.2021.106512
Jadda, K., and Bag, R. (2020). Effect of initial compaction pressure and elevated temperature on swelling pressure of two Indian bentonites. Environ. Earth Sci. 79, 197. doi:10.1007/s12665-020-08937-0
Kale, R. C., and Ravi, K. (2023). Impact of iron corrosion on swell pressure of compacted barmer bentonite induced with thermal history. Prog. Nucl. Energy 162, 104787. doi:10.1016/j.pnucene.2023.104787
Keskin, İ., Salimi, M., Ateyşen, E. Ö., Kahraman, S., and Vakili, A. H. (2023). Comparative study of swelling pressure in expansive soils considering different initial water contents and BOFS stabilization. Adv. Civ. Eng. 4823843, 1–11. doi:10.1155/2023/4823843
Li, Y., Zhao, Y., Bi, J., Wang, C. L., Ning, L., Zhou, Z. Q., et al. (2024). Study on the pore structure and capillary water migration characteristics of microbially improved strongly weathered phyllite. Constr. Build. Mat. 425, 136028. doi:10.1016/j.conbuildmat.2024.136028
Liang, W. Y., Yan, Y. T., Xu, Y. F., Zhan, Q., Tian, H. H., and Wei, C. f. (2021). Swelling pressure of compacted expansive soil over a wide suction range. Appl. Clay Sci. 203, 106018. doi:10.1016/j.clay.2021.106018
Liu, J. J., Yao, C. Q., Su, W. B., and Zhao, Y. Z. (2023). Research progress on the influence of thermo-chemical effects on the swelling pressure of bentonite. Appl. Sci. 13, 5580. doi:10.3390/app13095580
Liu, L., Zhang, Q., Yan, R. T., Zhao, Y. P., and Jiang, D. W. (2022). Tensile characteristics of fully weathered phyllite soil. Ind. Const. 52 (12), 166–170. (in Chinese). doi:10.13204/j.gyjzG21112405
Liu, Z., He, X., Fan, J., and Zhou, C. (2019). Study on the softening mechanism and control of red-bed soft rock under seawater conditions. J. Mar. Sci. Eng. 7, 235. doi:10.3390/jmse7070235
Ma, T. T., Wei, C. F., Yao, C. Q., and Yi, P. P. (2020). Microstructural evolution of expansive clay during drying-wetting cycle. Acta Geotech. 15, 2355–2366. doi:10.1007/s11440-020-00938-4
Mao, X. S., Miller, C. J., and Liu, L. Q. (2017). Cement improved highly weathered phyllite for highway subgrades: a case study in Shaanxi province. J. Traffic. Transp. Eng. 4 (4), 403–411. doi:10.1016/j.jtte.2017.07.003
MWR (Ministry of Water Resources the People’s Republic of China) (2019) Standard for geotechnical testing method. GB/T 50123-2019. Beijing: MWR.
Qin, P. J., Yan, Q. C., Lu, Y., Yang, C. G., Song, Z. W., and Li, C. B. (2023). One-dimensional compressibility and creep characteristics of unsaturated compacted loess based on incremental loading and constant rate of strain methods. Sustainability 15 (8), 13854. doi:10.3390/su151813854
Suzuki, S., Prayongphan, S., Ichikawa, Y., and Chae, B. (2005). In situ observations of the swelling of bentonite aggregates in NaCl solution. Appl. Clay Sci. 29, 89–98. doi:10.1016/j.clay.2004.11.001
Taherdangkoo, R., Tyurin, V., Shehab, M., Ardejani, A. F., Tang, A. M., Narmandakh, D., et al. (2023). An efficient neural network model to determine maximum swelling pressure of clayey soils. Comput. Geotech. 162, 105693. doi:10.1016/j.compgeo.2023.105693
Tanaka, Y., and Watanabe, Y. (2019). Modelling the effects of test conditions on the measured swelling pressure of compacted bentonite. Soils Found. 59 (1), 136–150. doi:10.1016/j.sandf.2018.09.009
Tian, H. H., Wei, C. F., Lai, Y. M., and Chen, P. (2017). Quantification of water content during freeze–thaw cycles: a nuclear magnetic resonance based method. Vadose Zone J. 17, 1–12. doi:10.2136/vzj2016.12.0124
Tsiampousi, A., Day, C., and Petalas, A. (2024). Engineering soil barriers to minimise annual shrinkage/swelling in plastic clays. Geomech. Energy Envir. 38, 100540. doi:10.1016/j.gete.2024.100540
Wen, S. S., Liang, W. W., Chen, Y. J., Huang, X. Z., Yan, R. T., and Wei, C. F. (2017). Experimental study of swelling characteristics of weak expansive soil. J. Eng. Geol. 25 (3), 706–714. (in Chinese). doi:10.13544/j.cnki.jeg.2017.03.017
Ye, W. M., Zhu, C. M., Chen, Y. G., Chen, B., Cui, Y. J., and Wang, J. (2015). Influence of salt solutions on the swelling behavior of the compacted GMZ01 bentonite. Environ. Earth Sci. 74, 793–802. doi:10.1007/s12665-015-4108-1
Yin, J. L., Liu, Z. K., Gu, Z. F., Yan, Y., Xie, Y. X., and Huang, B. Y. (2023). “Effect of dry-wet cycling on shear strength of phyllite-weathered soil in longsheng, Guilin,” in Proceedings of the 2nd International Conference on Innovative Solutions in Hydropower Engineering and Civil Engineering, Changsha, China, 18-20 September 2020, 479–494.
Yu, H. W., Hao, F. F., Yi, P. P., Zhang, Q., and Ma, T. T. (2024). Experimental investigation on the effect of salt solution on the soil freezing characteristic curve for expansive soils. Sustainability 16 (1), 363. doi:10.3390/su16010363
Zhao, X. S., Zhao, L. H., Yang, Q. J., Wang, Z. Y., Cheng, A., Mo, L. L., et al. (2023). Permeability and disintegration characteristics of composite improved phyllite soil by red clay and cement. Minerals 13 (1), 32–17. doi:10.3390/min13010032
Keywords: phyllite residual soil, swelling pressure, swelling rate, NMR test, fabric
Citation: Zhang Q, Qin L, Tang H, Yan M, Ji J, Yang W and Yan R (2024) Swelling pressure of phyllite residual soil during saturation. Front. Mater. 11:1415182. doi: 10.3389/fmats.2024.1415182
Received: 10 April 2024; Accepted: 06 May 2024;
Published: 23 May 2024.
Edited by:
Bing Bai, Beijing Jiaotong University, ChinaReviewed by:
Chen Peipei, Beijing University of Civil Engineering and Architecture, ChinaCopyright © 2024 Zhang, Qin, Tang, Yan, Ji, Yang and Yan. This is an open-access article distributed under the terms of the Creative Commons Attribution License (CC BY). The use, distribution or reproduction in other forums is permitted, provided the original author(s) and the copyright owner(s) are credited and that the original publication in this journal is cited, in accordance with accepted academic practice. No use, distribution or reproduction is permitted which does not comply with these terms.
*Correspondence: Qin Zhang, emhhbmdxaW5AZ2x1dC5lZHUuY24=; Rongtao Yan, MjAxMjAxOUBnbHV0LmVkdS5jbg==
Disclaimer: All claims expressed in this article are solely those of the authors and do not necessarily represent those of their affiliated organizations, or those of the publisher, the editors and the reviewers. Any product that may be evaluated in this article or claim that may be made by its manufacturer is not guaranteed or endorsed by the publisher.
Research integrity at Frontiers
Learn more about the work of our research integrity team to safeguard the quality of each article we publish.