 Xiaokun Chen1
 Wenjin Di
 Bowen Guan
- 1Qinghai Traffic Control Construction Engineering Group Co., Ltd., Xining, China
- 2Qinghai Guoluo Highway Engineering Construction Co., Ltd., Xining, China
- 3School of Materials Science and Engineering, Chang’an University, Xi’an, China
- 4School of Transportation and Logistics Engineering, Xinjiang Agricultural University, Urumqi, China
This study systematically explores the relationship between the mechanical and shrinkage properties of cement-stabilized macadam (CSM) stone base layers and their resistance to segregation to address the issue of segregation in wide and thick base layers. It establishes three cement dosage levels and five aggregate gradation types (GW1, GW2, GW3, GW4, and GW5). This research evaluates the anti-segregation performance of the mixtures by introducing the shape segregation coefficient L and the sieving segregation coefficient Seg and investigates how these properties influence segregation resistance. The findings revealed that mixtures with GW3 and GW4 gradations exhibit superior segregation resistance, with the most concentrated gradation curves in each zone. These mixtures form a robust force chain structure that resists segregation tendencies during descent. With a 5% cement content, the shape segregation coefficient L decreases by an average of 3.1%, and the sieve segregation coefficient Seg reduces by 14.0%. In addition, mixtures with GW3 and GW4 gradations show optimal drying shrinkage properties. Effective segregation-resistant gradations can significantly reduce the dry shrinkage coefficient of the specimens.
1 Introduction
Semi-rigid bases are widely used in various highway applications and are ubiquitous pavement base materials known for their strong overall integrity, high load-carrying capacity, and excellent water stability (Xia et al., 2023). Common base materials are cement-stabilized macadam (CSM) and lime-stabilized crushed stone. Due to the high processing and transportation costs associated with fly ash and the stringent early maintenance requirements of lime-stabilized base layers, CSM stands out as a prominent type of semi-rigid asphalt pavement base, serving as the primary load-bearing structural layer in such applications (Wang et al., 2019). CSM is a heterogeneous material of solid, liquid, and gas phases (Sun et al., 2020). Its strength derives from cement’s hydration reaction and cement slurry’s bonding effect on coarse and fine aggregates. The solidification of the cementitious matrix further contributes to its overall structural integrity (Wang and Zhong, 2019).
The wide and thick cement-stabilized crushed stone base layer typically utilizes single-pass construction technology. Compared to traditional layered and sequential construction, this approach mitigates the formation of reflective cracks and longitudinal joints and treats the water-stabilized base layer as a unified stress entity, avoiding layered stress and enhancing its overall performance. However, laying a wide and excessively thick water-stable base in one go can lead to aggregate segregation, where localized clustering of coarse and fine aggregates diminishes the uniformity of road base compaction. This reduction in uniformity can decrease the overall compaction of the base, adversely affecting the subsequent performance of the road. Segregation, a prevalent issue in the flow of heterogeneous particle materials, often results from variations in particle density, size, shape, and surface properties. The direct placement of wide and thick water-stable base layers in a single step can facilitate the segregation of the mixture, causing localized agglomeration of coarse and fine aggregates. This results in inconsistent mixture gradation, reduced overall compaction density, diminished strength, and dispersion throughout the base layer (Tang et al., 2024). In addition, segregation-induced drying shrinkage and unexpected permeability post-curing can impact the overall road performance. Therefore, conducting comprehensive research into the anti-segregation properties of CSM and their influence on strength and shrinkage characteristics is vital for enhancing the durability and safety of road surfaces (Ma et al., 2015).
Significant research has been conducted into developing the strength and shrinkage cracking of CSM under compaction conditions. Deng et al. (2019) utilized vibration compaction to assess the mechanical strength of CSM and devised corresponding predictive equations for this strength. M Tang et al. (2020) analyzed fatigue crack detection in CSM using measurement uncertainty and interval analysis theory, identifying sample segregation as a primary cause for considerable variability in fatigue testing outcomes. Zhang et al. (2024) introduced an innovative method to evaluate the compressive strength and dynamic modulus of CSM through four-point bending tests. K Zhao et al. (2022) developed a discrete element model of CSM using stochastic theory to examine its mechanical behavior under external loads. Wang S. J. et al. (2024) optimized the production process of CSM through vibration mixing technology (VMT), evaluating its strength, modulus, and shrinkage properties. Du (2019) introduced asphalt emulsion to reduce shrinkage cracking, with results indicating that the emulsion reduces the dry shrinkage strain and coefficient of CSM due to the encapsulating effect of the asphalt film on the cement slurry. Despite extensive investigations into the strength development and shrinkage cracking of cement-stabilized crushed stone, there remains a gap in systematic evaluations of how anti-segregation performance affects the mechanical and shrinkage properties of cement-stabilized crushed stone.
In addition, the current detection of segregation degree in water-stable base layers is primarily conducted during on-site construction stages, typically utilizing core drilling and sand spreading methods to assess segregation in the base layer (Li et al., 2020). However, detecting segregation in wide and thick water-stable base layers during construction proves time-consuming and labor-intensive, given the limited testing methods for segregating the mixture at the experimental design stage. Hence, it is crucial to conduct indoor segregation tests on CSM materials, establish a set of rational segregation degree classification standards, and recommend aggregate gradations with excellent anti-segregation properties. These measures are essential for maximizing the benefits of CSM base layers and enhancing their application in highway construction.
In this context, the study determines the optimal moisture content and maximum dry density for specimens with varying cement contents through vibration compaction. It assesses the anti-segregation performance of specimens using a self-designed indoor segregation test apparatus. The study evaluates the unconfined compressive strength (UCS), splitting tensile strength, and compressive resilience modulus of specimens at different ages, analyzing the influence of varying curing ages, cement dosages, and aggregate types on the mechanical properties of CSM specimens. The study systematically investigated the impact of CSM’s anti-segregation performance on its mechanical and shrinkage properties by correlating the segregation coefficients of mixtures with different gradations. It recommends cement dosages and aggregate gradations that ensure superior mechanical properties, shrinkage performance, and anti-segregation performance by comparing and analyzing the relationships among strength values, shrinkage coefficients, and segregation coefficients of cement-stabilized crushed stone under various conditions.
2 Materials and method
2.1 Materials
The cement selected for this study is the Conch brand No. 42.5 ordinary Portland cement, with specific indicators listed in Table 1. The aggregates were sourced from the crushed aggregate of the Aerospace Premix Plant in the West of China Construction. Four aggregate levels are used: #1 20–25 mm, #2 10–20 mm, #3 5–10 mm, and #4 0–5 mm, of which 0–5 mm; the latter constitutes fine aggregate, while the other three are coarse aggregates. Specific indicators are detailed in Tables 2, 3.
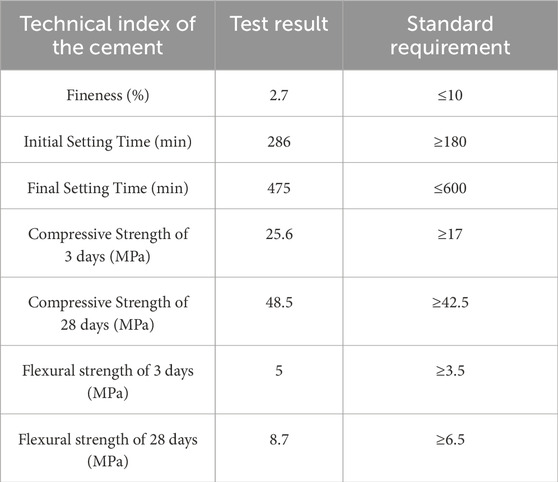
Table 1. Technical index of the cement.
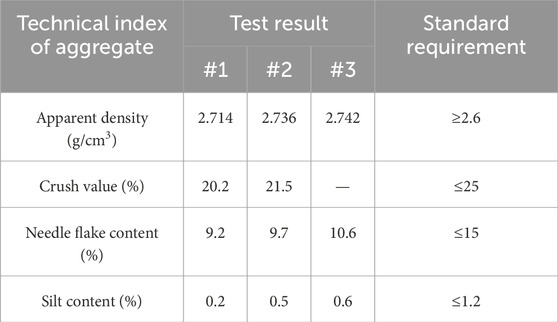
Table 2. Technical index of Coarse aggregate.
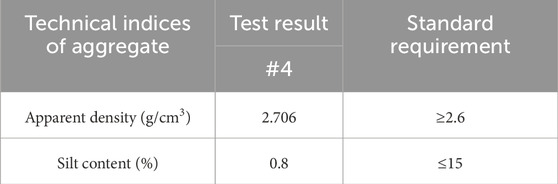
Table 3. Technical index of fine aggregate.
2.2 Gradation design
The study designed five kinds of mixtures with varying thicknesses, naming them GW1, GW2, GW3, GW4, and GW5, corresponding to 4.75 mm pass rates of 25%, 30%, 35%, 40%, and 45%, respectively. The specific grade design is depicted in Figure 1. The composite grading design is shown in Table 4. Additionally, three cement dosages were set to 4%, 5%, and 6%, and optimal water content was added.
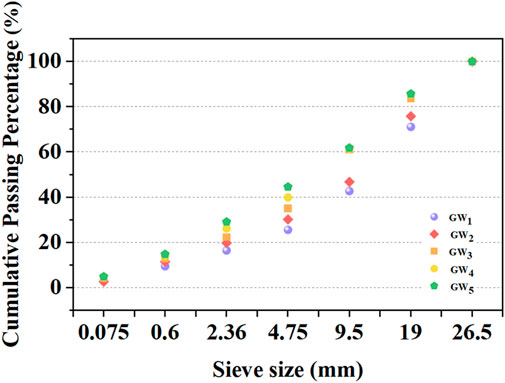
Figure 1. Cement stabilized gravel mix gradation curve.
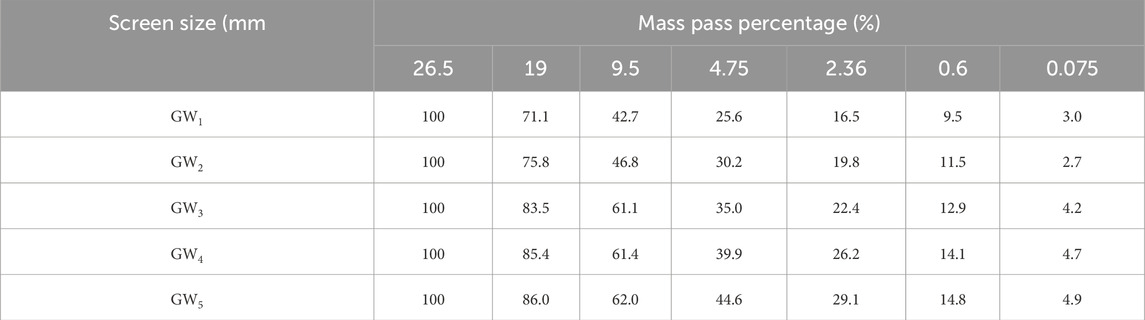
Table 4. Composite grading design.
2.3 Mixtures and sample preparation
Based on the JTG E51-2009, “Test Code for Highway Engineering Inorganic Binder Stabilized Materials,” and considering the prevailing aggregate sizes, this study utilized a large compaction cylinder with an inner diameter of 152 mm and a height of 170 mm, a ring measuring 151 mm in diameter and 50 mm in height, and a cylinder liner block of 50 mm in height. The cement-stabilized crushed stone base layer C-B-1, recommended by JTG/TF20-2015, “Technical Specification for Highway Pavement Base Construction” for high-speed and first-class highways, was selected with a cement dosage set to 5%. This selection was employed for vibratory compaction tests under optimal moisture conditions.
The procedure entailed drying various aggregate grades at 105°C ± 5°C until a consistent weight was reached, followed by weighing the required dry materials according to the mix ratio and aggregate gradation. These dry materials were mixed for 3 min to ensure a uniform mixture before the predetermined water content was added. After stirring for 5 min, the mixture was soaked for 6 h to saturate the aggregates. Then, the designated amount of cement was added to the soaked mixture and thoroughly mixed in two increments. The mold was assembled with oiled internal surfaces, and a paper liner, and the mixed material was compacted in three layers, each receiving 25 strokes using a vibrating rod. The process ensured that the aggregate height slightly exceeded the mold height within 10 min. The filled mold was then placed under a vibrating compactor head operated at 30 Hz frequency, 1.6 mm nominal amplitude, and a vibration time of 125 s. After compaction, the specimens were measured for height accuracy, with a tolerance of ±1 cm. Following a 4-h rest period, the specimens were demolded, sealed in plastic bags, and transferred to a curing room maintained at 20°C ± 2°C and 95% humidity for curing until the specified aging periods of 7, 28, 60, 90, and 180 days.
2.4 Anti-segregation performance test
This study drew inspiration from the design concept of material pile testing and independently designed an indoor segregation testing device. The experimental mechanism of the pile test allows aggregate particles to undergo free-falling motion. During the fall, the aggregate particles experience collision, friction, and squeezing, ultimately forming a material pile upon reaching the ground. Researchers evaluate the mixture’s degree of segregation by analyzing the material pile’s characteristics. The indoor segregation test described in this study also subjects the cement-stabilized crushed stone mixture to a free-falling motion. The indoor segregation test device used in this study includes a segregation test stand, two conical barrels, and a square base plate (refer to Figure 2). The segregation test stand has an overall length of 1,000 mm, a width of 230 mm, and a height of 1,300 mm. The upper layer is situated 1,000 mm above the ground, and the lower layer is 800 mm above the ground. The overall height of the conical bucket is 230 mm, with an upper bottom diameter of 100 mm and a lower bottom diameter of 250 mm, positioned invertedly on the separation test stand. The CSM mixture heap is divided into five zones: Zones I and II in the center and Zones III, IV, and V at the bottom, with equal volumes in Zone III (Figure 3).
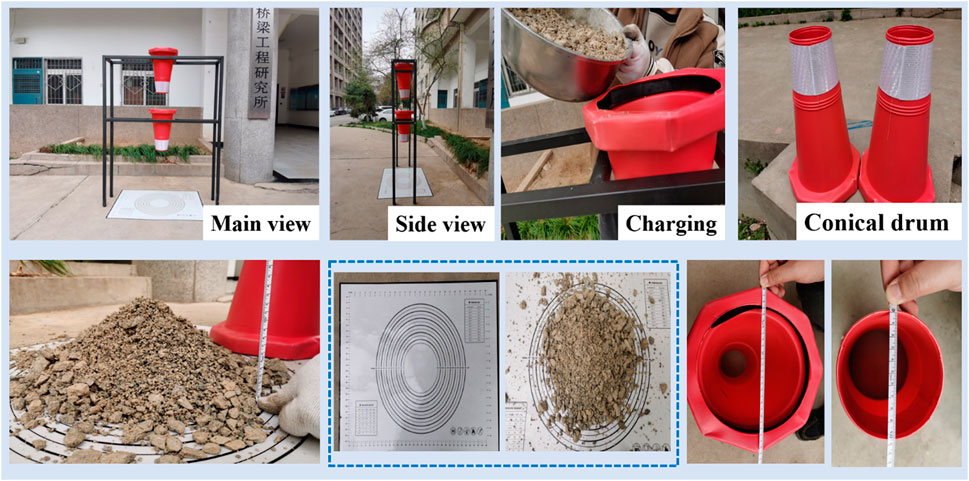
Figure 2. Indoor segregation test device for cement stabilized gravel mix.
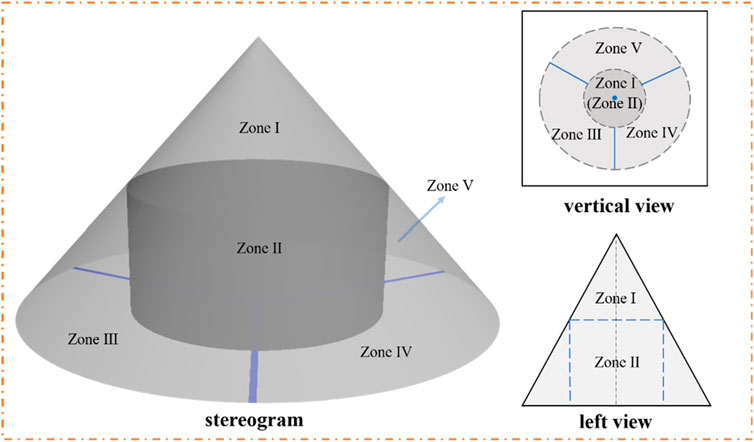
Figure 3. Cement stabilized gravel mix material pile zoning diagram.
Initially, pour the fully mixed CSM mixture into the upper conical bucket and let it stand for 60 s to maintain uniformity. During this time, a baffle blocks the bottom of the upper conical bucket to prevent the mixture from falling. Next, remove the baffle, allowing the mixture to fall into the lower conical bucket and stand for 30 s. After settling, remove the baffle at the bottom of the lower conical bucket to allow the mixture to fall onto the square base plate on the ground, where it is marked with circles and lines for measurement. Samples from each zone were taken, rinsed, dried, and subjected to sieve analysis to determine the passing rate, revealing gradation changes and segregation differences within the heap. The segregation coefficients were determined, focusing on aggregates above 0.6 mm due to fine aggregate loss during rinsing. The formula for calculating the shape segregation coefficient is shown in Equation 1.
where
Equations 2–4 show the formula for calculating the sieve segregation coefficient.
where
The fractional sieve residue, cumulative sieve residue, and the cumulative passing percentage of key sieves were computed using the gradation calculation formula. Combining Equations 2, 3, the segregation status of each partition was calculated using the variance formula, and the sieve segregation coefficient for each gradation was determined using a weighted average. A higher sieve segregation coefficient indicates more pronounced segregation of the mixture, while a lower coefficient indicates reduced segregation.
2.5 Mechanical properties test
The mechanical properties of CSM are evaluated by UCS tests, splitting strength tests, and resilience modulus tests. The specimen has a diameter of 100 mm and a height of 100 mm. The loading rate is 1 mm/min. The average value of the test results from 9 specimens is considered the final test result.
2.6 Shrinkage test
Test the drying shrinkage properties of the specimen according to the method specified in the specification (T0855-2009). The size of the specimen is 100 × 100 × 400 mm. From the time when the dry shrinkable specimen is moved to the constant greenhouse, the dial gauge reading is recorded daily for the first week (accurate to 0.001 mm). From the second week onward, the dial gauge reading is recorded every 2 days through the previous month. After 1 month, record the dial gauge readings on the 60th and 90th days, respectively.
3 Results and discussion
3.1 Segregation resistance
Figure 4 indicates that the segregation resistance of water-stable crushed stone mixtures (CSM) increases with a higher cement content, forming a strong force chain structure when the 4.75 mm passing rate ranges from 35% to 40%. The shape segregation coefficient L initially decreases, then increases as the gradation type transitions from GW1 to GW5. Under identical conditions, the segregation resistance capacity of CSM mixtures is ranked as follows: GW3 > GW4 > GW2 > GW5 > GW1. This ranking is attributed to the stable force chain network established within CSM, which enhances deformation and segregation resistance. Within a specific range, an increase in cement dosage enhances the internal cohesion of CSM and improves the mixture’s deformation resistance.
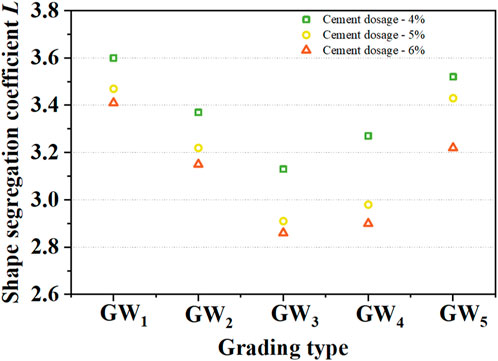
Figure 4. Shape segregation coefficient of mixture at different cement dosages.
Figure 5 shows the sieve separation coefficients of CSM under varying cement dosages and aggregate grades. The segregation coefficient, Seg, is highest for CSM with a 4% cement content, followed by 5% and then 6% cement content. Increasing the cement content from 4% to 5% significantly enhances segregation resistance. For example, taking aggregate grading GW2, the Seg of a 5% cement dose decreased by 5.1%, and the Seg of a 6% cement dose decreased by 22.8% compared to a 4% cement dose. Thus, regarding Seg, the segregation resistance of CSM mixtures with 5% and 6% cement dosages is superior. CSM with gradations GW3 and GW4 demonstrate exceptional segregation resistance due to their ability to form robust internal force chain structures. Excessive or insufficient fine aggregate content can lead to uneven force chain dispersion, weakening internal force chain strength and causing segregation issues after heap testing.
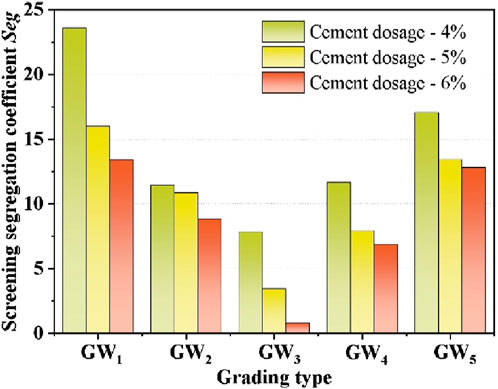
Figure 5. The sieve separation coefficient of mixture at different cement dosages.
An integrated analysis demonstrates that when the cement content achieves 5% and 6%, the segregation resistance performance of mixtures with aggregate gradations GW3 and GW4 consistently remains superior.
3.2 Unconfined compressive strength
3.2.1 Influence of cement dosage
In combination with the variation in the splitting strength of specimens depicted in Figure 6A–E under cement dosages of 4%, 5%, and 6%, it is clear that the trend of UCS varies with different curing ages and cement dosages, as shown in Figure 6. Specimens with aggregate gradation GW2 and a 6% cement dosage exhibit an average growth rate of approximately 0.067 MPa/day before 90 days and 0.017 MPa/day between 90 and 180 days. The UCS at 90 days reaches around 90% of the UCS at 180 days. During the first 90 days, the UCS growth rate from 7 to 28 days is significantly higher than from 28 to 90 days. For GW2 and a 6% cement dosage, the UCS growth rate is about 0.1 MPa/day from 7 to 28 days and 0.056 MPa/day from 28 to 90 days. Similar trends are observed for other aggregate gradations and cement dosages, indicating rapid early strength development followed by a gradual increase in strength due to ordinary Portland cement’s mineral composition and hydration rate (Liu, 2015).
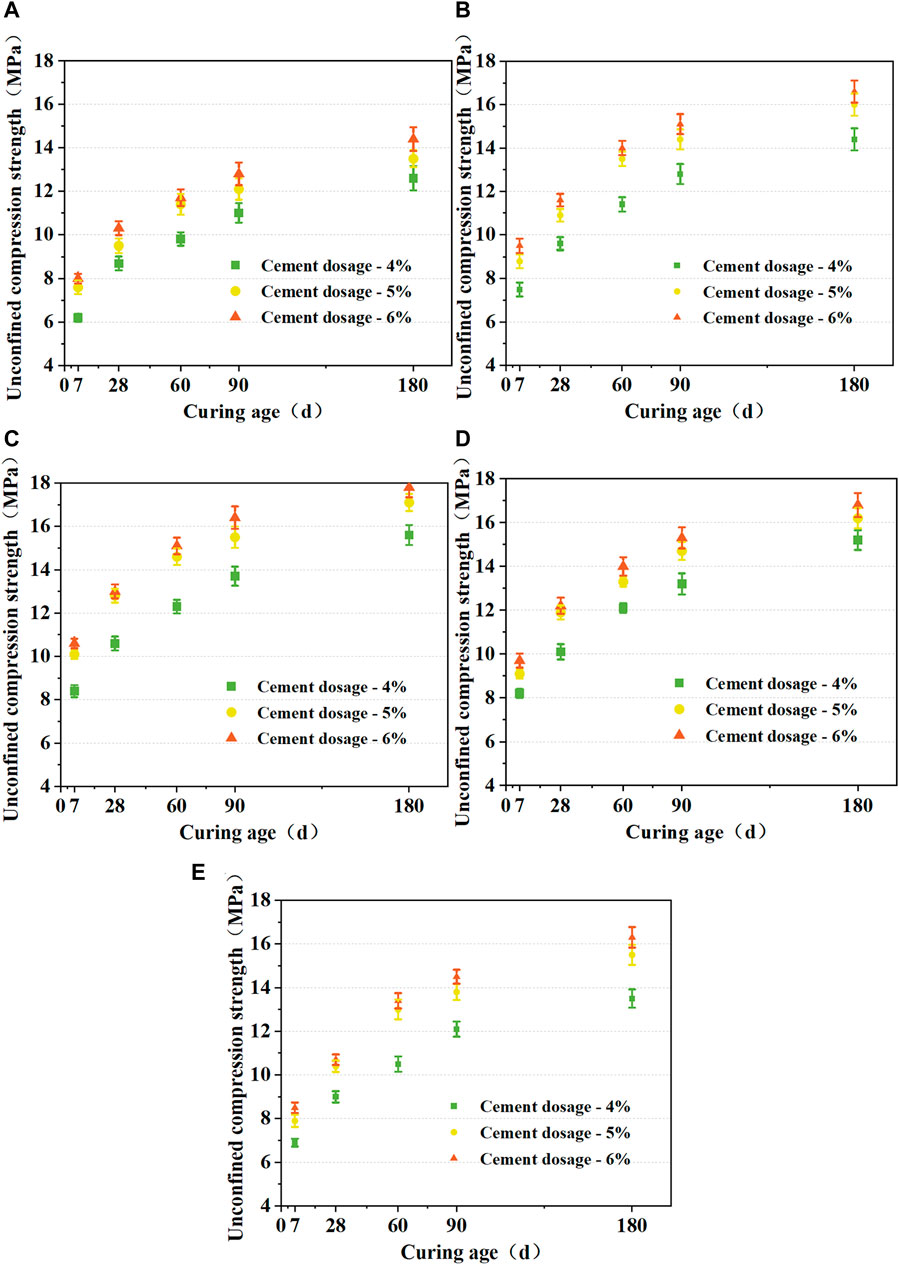
Figure 6. Effect of curing age on UCS of specimens. (A) GW1; (B) GW2; (C) GW3; (D) GW4; (E) GW5.
The UCS increases with higher cement dosages due to the enhanced hydration products that improve the bonding capacity and interlocking force of CSM aggregates. The increased bonding strength leads to better material cohesion, enhancing the force chain network in CSM and improving specimen strength. For GW3, increasing the cement dosage from 4% to 6% results in a 26.2% increase in UCS from 8.4 MPa to 10.6 MPa at 7 days. In addition, the increase in UCS is more pronounced when the cement dosage increases from 4% to 5% than from 5% to 6%. The UCS at 5% cement dosage reaches 95.3% of the UCS at 6% cement dosage, suggesting diminishing returns on strength improvement beyond a 5% cement dosage. While a moderate increase in cement dosage positively impacts specimen strength, reliance solely on this method for enhancing UCS is not recommended due to minimal effectiveness and cost inefficiency (Zheng et al., 2019).
3.2.2 Influence of aggregate grading conditions
The impact of aggregate gradation on the UCS of CSM is illustrated in Figure 6 for different curing periods and cement dosages. Figure 6A–E indicate a significant influence of aggregate gradation on the UCS of CSM. With consistent cement dosages and curing periods, the order of UCS for different gradations of CSM is GW3 > GW4 > GW2 > GW5 > GW1. Among these, specimens with GW1 gradation exhibit the lowest UCS, while those with GW3 gradation show the highest, with an average increase of 27.9% compared to GW1. The variation in UCS due to aggregate gradation can be attributed to differences in the internal structure of the mix, resulting in varying interlocking forces due to different proportions of coarse and fine aggregates (Cui and Li, 2016).
3.2.3 Canonical correlation analysis- segregation coefficient and UCS
Figures 7, 8 depict the relationship between the shape segregation coefficient
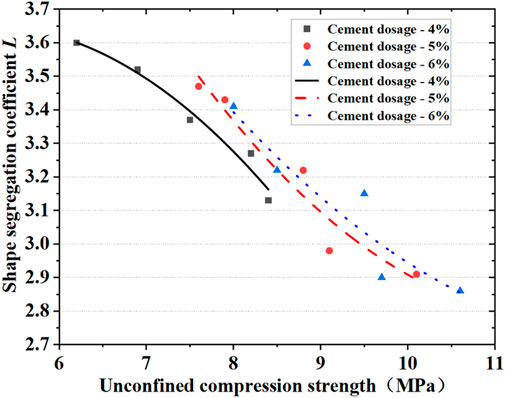
Figure 7. Relationship between shape segregation coefficient and UCS.
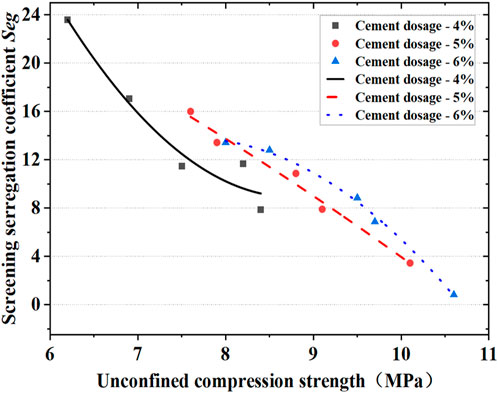
Figure 8. Relationship between screening segregation coefficient and UCS.
Figure 8 indicates that the UCS of the specimen also presents a significant inverse correlation with the sieve separation factor
Similarly, the larger the UCS of the specimen, the smaller its
3.3 Splitting strength
3.3.1 Influence of cement dosage
In combination with the variation of the splitting strength of specimens depicted in Figure 9A–E under cement dosages of 4%, 5%, and 6%, it is observed that the splitting tensile strength of different gradations of CSM increases with longer curing periods and higher cement dosages. The order of splitting tensile strength is GW3 > GW4 > GW2 > GW5 > GW1, indicating a positive correlation between splitting strength and segregation resistance. Analysis of the splitting strength trends across various ages shows that the growth rate is higher in the initial stage (less than 90 days) compared to the period from 90 to 180 days. With a GW3 gradation and 5% cement dosage, the initial growth rate decreases from 0.011 MPa/day to about 0.002 MPa/day between 90 and 180 days. In addition, the growth rate from 7 to 28 days is significantly higher than from 28 to 90 days within the first 90 days, demonstrating a pattern of rapid initial growth followed by a less pronounced increase consistent across different gradations and cement dosages (Zang et al., 2018).
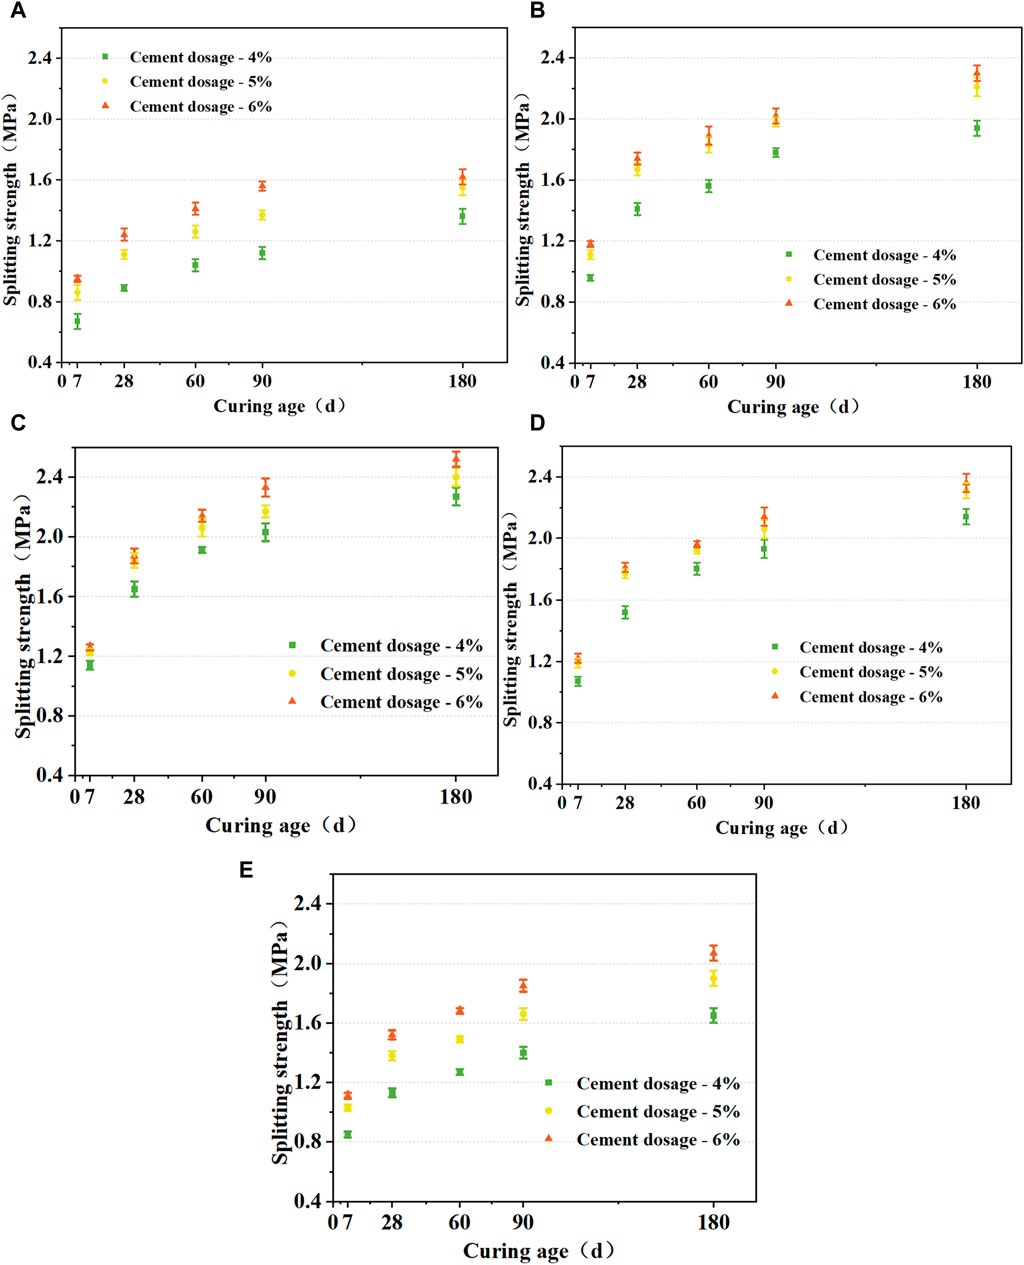
Figure 9. Effect of curing age on splitting strength of specimens. (A) GW1; (B) GW2; (C) GW3; (D) GW4; (E) GW5.
Consistent with the compressive strength law, the splitting strength of a mixture with 5% cement content can reach 97.4% of the strength at 6% cement content.
3.3.2 Influence of aggregate grading conditions
The splitting tensile strength of CSM demonstrates significant variability under different aggregate gradations, as illustrated in Figure 9. Figures 9A–E indicate that aggregate gradation significantly impacts the splitting strength of CSM. When maintaining consistent cement dosage and curing duration, the ranking of splitting strength across various CSM gradations is GW3 > GW4 > GW2 > GW5 > GW1, aligning with the compressive strength hierarchy of the specimens. Specimens with the GW3 gradation exhibit the highest splitting strength, whereas those with the GW1 gradation display the lowest. The splitting strength of the GW3 gradation surpasses that of the GW1 by an average of 62.7%, highlighting the significant role of aggregate gradation in influencing the internal structure and mechanical properties. With a constant cement dosage of 5%, the segregation levels, classified as L, for gradations GW1 through GW5 range from moderate to none. When comparing GW3 with GW1, the splitting strength increases by 66.3% in the absence of segregation and by 59.5% with slight segregation in the GW4 case. This trend is consistent when using segregation levels defined by the Seg classification, indicating a direct relationship between segregation resistance and splitting strength. Specimens with GW3 and GW4 gradations demonstrate an increase in splitting strength of over 55% relative to GW1.
3.3.3 Canonical correlation analysis- segregation coefficient and splitting tensile strength
Figures 10, 11 illustrate the relationship between the shape segregation coefficient
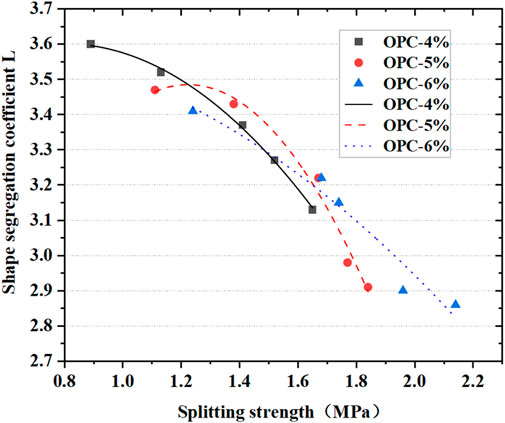
Figure 10. Relationship between shape segregation coefficient and splitting strength.

Figure 11. Relationship between sieve separation coefficient and splitting strength.
Figure 11 indicates a clear inverse correlation between the splitting strength of specimens and the sieve segregation coefficient (
3.4 Compressive resilience modulus
3.4.1 Influence of cement dosage
The influence of varying cement dosages on the compressive resilient modulus of CSM is depicted in Figure 12A–E. The compressive resilient modulus for different gradations of CSM increases with both curing age and cement dosage. The sequence of compressive resilient modulus is GW3 > GW4 > GW2 > GW5 > GW1, indicating a positive correlation with segregation resistance. The growth rate is more pronounced in the early stage (<90 days) compared to the 90–180 days period. With a GW3 gradation and 5% cement dosage, the average growth rate initially approximates 23.7 MPa/day, diminishing to about 5.29 MPa/day in the 90–180 days interval. The compressive resilience modulus of a mixture with 5% cement content can reach 98.1% of the compressive resilience modulus of 6%. This pattern aligns with observations in compressive strength and splitting strength.
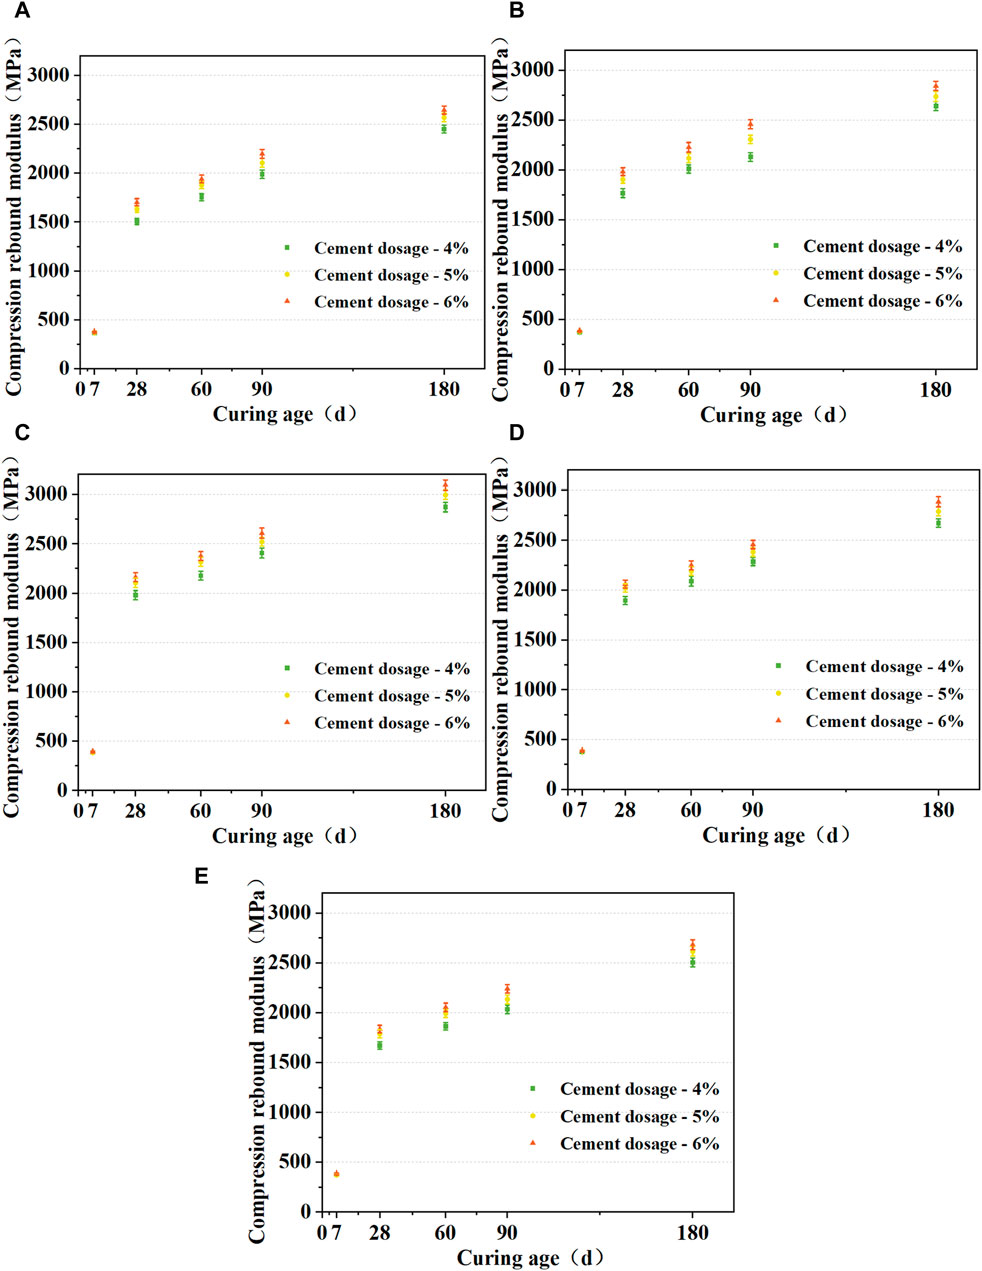
Figure 12. Effect of cement dosage on splitting strength of Compressive resilience modulus diagram: (A) GW1; (B) GW2; (C) GW3; (D) GW4; (E) GW5.
3.4.2 Influence of aggregate grading conditions
Figure 12A–E show that the compressive resilient modulus of CSM varies substantially under different aggregate gradation conditions. Specimens with GW3 gradation exhibit the highest compressive resilient modulus, whereas those with GW1 gradation show the lowest. Compared to GW1, GW3 gradation leads to a 29.0% increase in compressive resilient modulus. This variation stems from differences in the internal structure of the mixtures, emphasizing the importance of rational gradation matching for stable force chain networks and enhanced mechanical properties. With a consistent 5% cement dosage, GW3 and GW4 gradations demonstrate significant enhancements in compressive resilient modulus, with increases exceeding 24% compared to GW1. This underscores the correlation between segregation resistance and a higher compressive resilient modulus in specimens.
3.4.3 Canonical correlation analysis- segregation coefficient and resilience modulus
Figures 13, 14 illustrate the relationships between the shape segregation coefficient
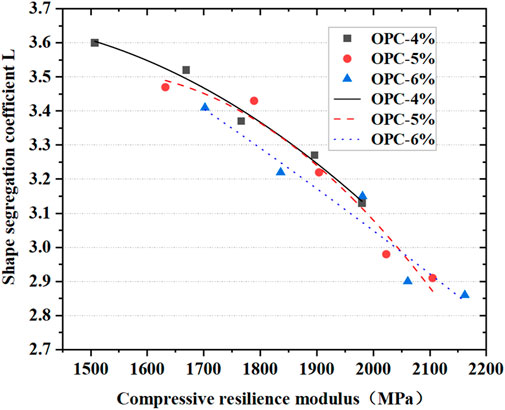
Figure 13. Relationship between shape segregation coefficient and compressive resilience modulus.
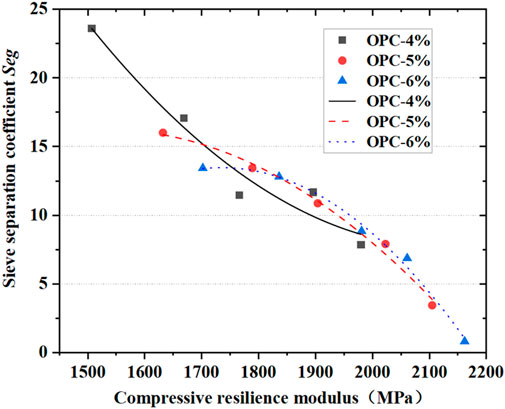
Figure 14. Relation between sieve separation coefficient and compressive resilience modulus.
Figure 14 further demonstrates a significant inverse correlation between the compressive resilient modulus of specimens and the sieve segregation coefficient
3.5 Dry shrinkage properties
3.5.1 Water loss rate
The relationships between different drying shrinkage ages and water loss rates are illustrated in Figures 15A, B. The early-stage drying shrinkage rate of CSM decreases rapidly, transitioning to a more gradual decline in later stages. In addition, increasing fine aggregate content reduces the voids necessary to resist drying shrinkage deformation, diminishing shrinkage properties. The ranking of drying shrinkage coefficients for different gradations is GW5 > GW1 > GW2 > GW4 > GW3. As the drying shrinkage age progresses, the water loss rate decreases rapidly within the first 15 days before leveling off, while the cumulative water loss rate initially rises quickly in the same timeframe before stabilizing. In the early stages, the specimens are saturated, causing rapid evaporation of free water in the dry environment, leading to rapid changes in the water loss rate (Yan et al., 2024). However, as the free water content decreases, the rate of change in the water loss rate also reduces. Secondly, in the early stages of drying shrinkage, water in the specimens considerably participates in the hydration reaction of cement, contributing to the rapid changes in water loss rate (Wang S. S. et al., 2024). The ranking of cumulative water loss rates for different gradations follows the pattern GW5 > GW1 > GW2 > GW4 > GW3. Compared to GW3, GW1 exhibits a 33.2% increase in cumulative water loss rate, while GW5 shows a 35.8% increase. This finding indicates that insufficient fine aggregate enhances the internal voids in the specimens, increasing the contact area between water and dry air (Alanazi et al., 2022; Yang et al., 2023).
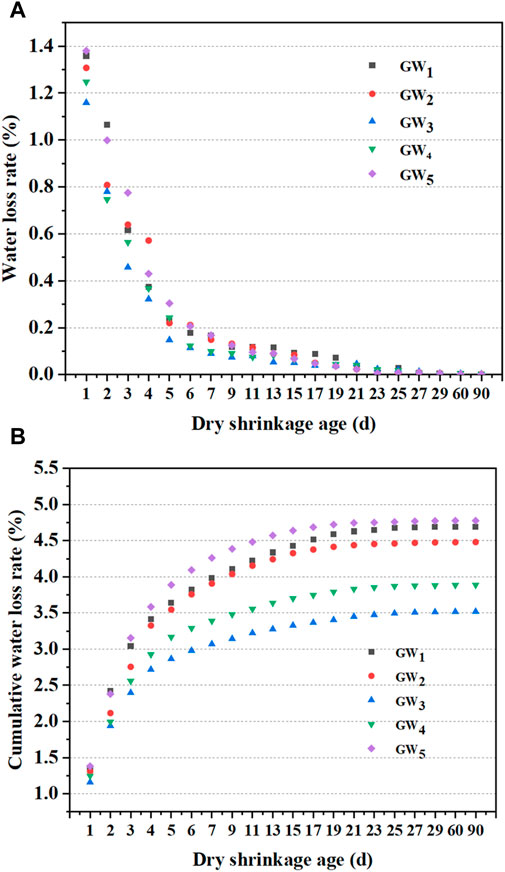
Figure 15. (A) Relationship between water loss rate and dry shrinkage age; (B) Relationship between cumulative water loss rate and dry shrinkage age.
3.5.2 Shrinkage strain
Figures 16, 17 illustrate the relationship between drying shrinkage strain, the shrinkage coefficient, and drying shrinkage age. Drying shrinkage strain decreases with age, while cumulative drying shrinkage strain increases. The ranking of cumulative drying shrinkage strain for different gradations is GW5 > GW1 > GW2 > GW4 > GW3, emphasizing the pivotal role of aggregate gradation in influencing drying shrinkage strain. The impact of gradation on the drying shrinkage coefficient is pronounced. Compared to the 1-day drying shrinkage coefficient, the 90-day drying shrinkage coefficient increased by 58.37% for GW1, 59.64% for GW2, 39.36% for GW3, 50.10% for GW4, and 62.73% for GW5. This highlights the superior drying shrinkage properties of GW3 and GW4, as they exhibit smaller increases in drying shrinkage coefficients (Lin and Zhou, 2023). An integrated analysis reveals that the drying shrinkage property ranking of the five CSM mixtures is GW3 > GW4 > GW2 > GW1 > GW5. Due to differences in fine aggregate content between GW5 and GW1, the excessive fine aggregate content in GW5 results in poorer drying shrinkage properties. Compared to the moderately segregated GW1, the non-segregated GW3 and slightly segregated GW4 reduced their 90-day drying shrinkage coefficients by 23.9% and 11.2%, respectively. This underscores the close relationship between drying shrinkage properties and segregation resistance, highlighting the role of well-designed aggregate gradation in effectively reducing drying shrinkage coefficients (Huang et al., 2018).This reduction demonstrates a close relationship between the drying shrinkage properties of the mixture and its resistance to segregation (Sankar et al., 2021). An optimal aggregate gradation with effective segregation resistance can significantly lower the drying shrinkage coefficient of the specimens.
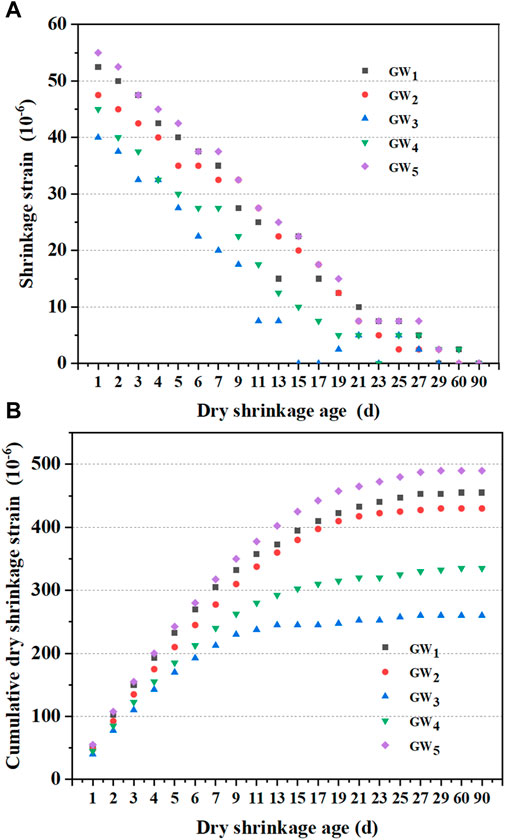
Figure 16. (A) Relationship between shrinkage strain and dry shrinkage age; (B) Relationship between cumulative dry shrinkage strain and dry shrinkage age.
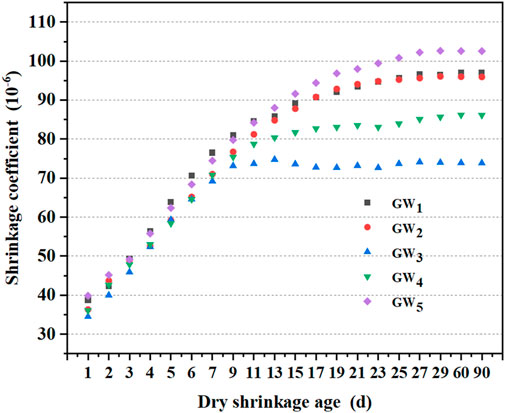
Figure 17. Relationship between shrinkage coefficient and dry shrinkage age.
3.5.3 Canonical correlation analysis- segregation coefficient and shrinkage coefficient
Figures 18, 19 illustrate the relationships between the shape segregation coefficient

Figure 18. Relationship between shape segregation coefficient and dry shrinkage coefficient.
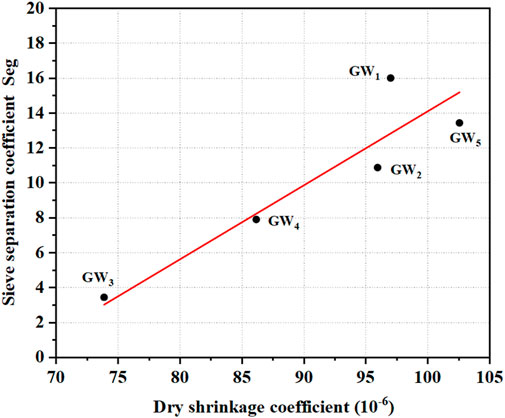
Figure 19. Relationship between sieve separation coefficient and dry shrinkage coefficient.
Figure 19 depicts a conspicuous positive correlation between the drying shrinkage coefficient of specimens and the sieve segregation coefficient
4 Conclusion
This study methodically explores the segregation resistance of CSM and its effects on the material’s mechanical and shrinkage properties. The findings are summarized as follows:
(1) Elevating the cement content enhances the anti-segregation capabilities of CSM. Specifically, CSM with a cement content of 5% achieves an anti-segregation level of 87% relative to CSM with a cement content of 6%.
(2) Mixtures with GW3 and GW4 gradations display superior segregation resistance, characterized by highly concentrated gradation curves in each designated zone. A robust force chain structure within the mixture helps counteract segregation tendencies during the descent process when the pass rate of 4.75 mm aggregates is between 35% and 40%.
(3) The mixture’s strength index negatively correlates with the shape segregation coefficient L and the sieve segregation coefficient Seg, indicating a positive correlation between the mixture’s strength and resistance to segregation.
(4) Mixtures featuring GW3 and GW4 gradations exhibit the most favorable drying shrinkage properties. Effective segregation-resistant gradations can substantially diminish the dry shrinkage coefficient of the specimens.
Data availability statement
The original contributions presented in the study are included in the article/supplementary material, further inquiries can be directed to the corresponding authors.
Author contributions
XC: Data curation, Writing–original draft. CD: Formal Analysis, Writing–original draft. XZ: Data curation, Writing–review and editing. WD: Methodology, Writing–original draft, Writing–review and editing. XC: Methodology, Writing–original draft. BG: Formal Analysis, Funding acquisition, Writing–review and editing.
Funding
The author(s) declare that financial support was received for the research, authorship, and/or publication of this article. This research was funded by Key R& D and transformation plan of Qinghai Province (2023-SF-123).
Conflict of interest
Author XC was employed by Qinghai Traffic Control Construction Engineering Group Co., Ltd. Authors CD and XZ were employed by Qinghai Guoluo Highway Engineering Construction Co., Ltd.
The remaining authors declare that the research was conducted in the absence of any commercial or financial relationships that could be construed as a potential conflict of interest.
Publisher’s note
All claims expressed in this article are solely those of the authors and do not necessarily represent those of their affiliated organizations, or those of the publisher, the editors and the reviewers. Any product that may be evaluated in this article, or claim that may be made by its manufacturer, is not guaranteed or endorsed by the publisher.
References
Alanazi, N., Kolawole, J. T., Buswell, R., and Susmel, L. (2022). The Theory of Critical Distances to assess the effect of cracks/manufacturing defects on the static strength of 3D-printed concrete. Eng. Fract. Mech. 269, 108563. doi:10.1016/j.engfracmech.2022.108563
Cui, K., and Li, W. (2016). Dry shrinkage and durability performance of cement stabilized graded stone with framework and dense structure. Mater. res.-ibero-am. J. Mater 19, 215–219. doi:10.1590/1980-5373-mr-2015-0204
Deng, C. Q., Jiang, Y. J., Lin, H. W., and Ji, X. P. (2019). Mechanical-strength-growth law and predictive model for cement-stabilized macadam. Constr. Build. Mater. 215, 582–594. doi:10.1016/j.conbuildmat.2019.04.209
Du, S. (2019). Mechanical properties and shrinkage characteristics of cement stabilized macadam with asphalt emulsion. Constr. Build. Mater 203, 408–416. doi:10.1016/j.conbuildmat.2019.01.126
Huang, T., Zheng, J. L., Lv, S. T., Zhang, J. H., Wen, P. H., and Bailey, C. G. (2018). Failure criterion of an asphalt mixture under three-dimensional stress state. Constr. Build. Mater. 170, 708–715. doi:10.1016/j.conbuildmat.2018.03.081
K Zhao, X., Dong, Q., Chen, X. Q., and Ni, F. J. (2022). Influence of initial defects on the fatigue behaviour of cement-stabilized macadam base through DEM. Int. J. Pavement. Eng. 23 (14), 4845–4856. doi:10.1080/10298436.2021.1984473
Li, X., Lv, X., Wang, W., Liu, J., Yu, M., and You, Z. (2020). Crack resistance of waste cooking oil modified cement stabilized macadam. J. Clean. Prod. 243, 118525. doi:10.1016/j.jclepro.2019.118525
Lin, C., and Zhou, J. (2023). Equivalent confining stress-based strength model for concrete under triaxial compression. Constr. Build. Mater. 372, 130812. doi:10.1016/j.conbuildmat.2023.130812
Liu, Z. (2015). Experimental research on the engineering characteristics of polyester fiber-reinforced cement-stabilized macadam. J. Mater. Civ. Eng. 27 (10), 04015004. doi:10.1061/(asce)mt.1943-5533.0001251
Ma, Y., Gu, J., Li, Y., and Li, Y. (2015). The bending fatigue performance of cement-stabilized aggregate reinforced with polypropylene filament fiber. Constr. Build. Mater 83, 230–236. doi:10.1016/j.conbuildmat.2015.02.073
M Tang, L., Xiao, Y., and Xie, J. W. (2020). Fatigue cracking checking of cement stabilized macadam based on measurement uncertainty and interval analysis. Constr. Build. Mater. 250, 118921. doi:10.1016/j.conbuildmat.2020.118921
Sankar, L., Aruna, G., Krishna Rao, A., and Srinivas, K. K. (2021). Studies on drying shrinkage and water permeability of fine fly ash high performance concrete. Mater. Today. Proc. 46, 930–933. doi:10.1016/j.matpr.2021.01.069
Sun, X., Wu, S., Yang, J., and Yang, R. (2020). Mechanical properties and crack resistance of crumb rubber modified cement-stabilized macadam. Constr. Build. Mater 259, 119708. doi:10.1016/j.conbuildmat.2020.119708
Tang, J., Guo, C. C., Qin, L., R Wang, H., F Shi, F., Liu, Z. X., et al. (2024). Fracture characteristics of cement-stabilized macadam using three-point bending test. Constr. Build. Mater. 419, 135384. doi:10.1016/j.conbuildmat.2024.135384
Wang, S. J., Han, L., Wu, C. S., Zhao, Y. L., and Zhang, R. H. (2024a). Mix proportion design and production optimization of stone filled with cement stabilized macadam considering shrinkage resistance and easy construction. Constr. Build. Mater. 416, 135235. doi:10.1016/j.conbuildmat.2024.135235
Wang, S. S., T Lv, S., P Wang, J., H Peng, X., Li, Z., Dong, P., et al. (2024b). Research on dynamic load strength criteria of cement stabilized macadam based on strength tests under simple stress states. Mater. Today. Comm. 38, 108219. doi:10.1016/j.mtcomm.2024.108219
Wang, X., Li, K., Zhong, Y., and Xu, Q. (2019). Investigation of thermal reflective cracking in asphalt pavement using XFEM coupled with DFLUX subroutine and FILM subroutine. Arab. J. Sci. Eng. 44, 4795–4805. doi:10.1007/s13369-018-3554-y
Wang, X., and Zhong, Y. (2019). Reflective crack in semi-rigid base asphalt pavement under temperature-traffic coupled dynamics using XFEM. Constr. Build. Mater 214, 280–289. doi:10.1016/j.conbuildmat.2019.04.125
Xia, X., D Han, D., C Ma, Y., L Zhao, Y., Tang, D., and Chen, Y. J. (2023). Experiment investigation on mix proportion optimization design of anti-cracking stone filled with cement stabilized macadam. Constr. Build. Mater. 393, 132136. doi:10.1016/j.conbuildmat.2023.132136
Yan, S., Lu, H. N., Zhou, Z., Dong, Q., Q Chen, X., and Wang, X. (2024). A polymer latex modified superfine cement grouting material for cement-stabilized macadam – experimental and simulation study. Constr. Build. Mater. 413, 134893. doi:10.1016/j.conbuildmat.2024.134893
Yang, Y., Lv, S., Zheng, G., Peng, X., Ge, D., Lu, W., et al. (2023). Determination method of fatigue strength of cement-stabilized Macadam under three-dimensional stress state using equivalent stress as index. Constr. Build. Mater. 384, 131318. doi:10.1016/j.conbuildmat.2023.131318
Zang, G., Sun, L., Chen, Z., and Li, L. (2018). A nondestructive evaluation method for semi-rigid base cracking condition of asphalt pavement. Constr. Build. Mater 162, 892–897. doi:10.1016/j.conbuildmat.2017.12.157
Zhang, J., Wang, S. X., Cui, J., and Chu, H. (2024). Simultaneous determination of cement stabilized macadam’s dynamic resilient modulus in compression and tension by bending beam test. Case. Stud. Constr. Mater. 20, e03008. doi:10.1016/j.cscm.2024.e03008
Keywords: cement-stabilized macadam, segregation resistance, mechanical property, shrinkage property, correlation analysis
Citation: Chen X, Deng C, Zhai X, Di W, Cao X and Guan B (2024) Study on anti-segregation performance of cement stabilized macadam and its impact on mechanical and shrinkage properties. Front. Mater. 11:1411558. doi: 10.3389/fmats.2024.1411558
Received: 04 April 2024; Accepted: 05 August 2024;
Published: 26 August 2024.
Edited by:
Songtao Lv, Changsha University of Science and Technology, ChinaReviewed by:
Zeyu Zhang, Wuhan University of Technology, ChinaKai Liu, Hefei University of Technology, China
Copyright © 2024 Chen, Deng, Zhai, Di, Cao and Guan. This is an open-access article distributed under the terms of the Creative Commons Attribution License (CC BY). The use, distribution or reproduction in other forums is permitted, provided the original author(s) and the copyright owner(s) are credited and that the original publication in this journal is cited, in accordance with accepted academic practice. No use, distribution or reproduction is permitted which does not comply with these terms.
*Correspondence: Wenjin Di, d2pkaUB4amF1LmVkdS5jbg==; Bowen Guan, Ymd1YW5AY2hkLmVkdS5jbg==