 Haitham A. Mahmoud1
 G. Shanmugasundar2
 Swapnil Vyavahare3
 Rakesh Kumar4,5
 Robert Cep6
 Sachin Salunkhe7,8*Sharad Gawade9
 Emad S. Abouel Nasr1
- 1Department of Industrial Engineering, College of Engineering, King Saud University, Riyadh, Saudi Arabia
- 2Department of Mechanical Engineering, Sri Sai Ram Institute of Technology, Chennai, India
- 3Department of Artificial Intelligence, Datainsights Enterprises, Ahmednagar, India
- 4Department of Mechanical Engineering, School of Engineering and Technology, JAIN (Deemed to be University), Bengaluru, Karnataka, India
- 5Department of Mechanical Engineering, Vivekananda Global University, Jaipur, Rajasthan, India
- 6Department of Machining, Assembly and Engineering Technology, Faculty of Mechanical Engineering, Ostrava, Czechia
- 7Department of Biosciences, Saveetha School of Engineering, Saveetha Institute of Medical and Technical Sciences, Chennai, India
- 8Department of Mechanical Engineering, Gazi University Faculty of Engineering, Ankara, Türkiye
- 9Sharadchandra Pawar, College of Engineering and Technology, Baramati, India
Introduction: Additive manufacturing (AM) is a revolutionary technology transforming traditional production processes by providing exceptional mechanical characteristics.
Methods: The present study aims explicitly to predict the hardness of Polycarbonate (PC) parts produced using AM. The objectives of this study are: (1) To investigate the process parameters that impact the ability to estimate the hardness of PC materials accurately, and (2) To develop a best-performing ML model from a range of models that can reliably predict the hardness of additively manufactured PC parts. Initially, fused filament fabrication (FFF), the most affordable AM technique, was used for the manufacturing of parts. Four process parameters, infill density, print direction, raster angle, and layer thickness, are selected for investigation. A heatmap is generated to obtain the influence of process parameters on hardness. Then, machine learning (ML) techniques create a range of predictive models that can predict hardness value considering the level of process parameters.
Results: The developed ML models include Linear Regression, Decision Tree, Random Forest, K-nearest neighbor, Support Vector Regression, AdaBoost, and Artificial Neural Network. Further, an investigation has been done that includes choosing and improving ML algorithms and assessing the models’ performance.
Discussion: Prediction plots, residual plots, and evaluation metrics plots are prepared to gauge the performance of the developed models. Thus, the research enhances AM capabilities by applying predictive modeling to process parameters and improving the quality and reliability of fabricated components.
1 Introduction
1.1 Additive manufacturing
Additive Manufacturing (AM) technologies, commonly called 3D printing, have significantly influenced the current manufacturing activities. These technologies provide unmatched flexibility in multiple sectors, such as aerospace and healthcare, by stacking materials according to digital designs (Yu et al., 2024), (Devi et al., 2023), (Goyal et al., 2024). Also, these techniques are used in prototyping and the fabrication of functional components that can replace parts manufactured by conventional manufacturing techniques (Korkmaz et al., 2022), (Thomas et al., 2018). Fused filament fabrication (FFF) is the most affordable AM technique, which allows for the creation of intricate shapes with unparalleled design flexibility and productivity (Luo et al., 2024), (de Camargo et al., 2024). FFF fabricated parts have applications as approved material for aeronautics, models for dimensional and functional validation of products, low volume manufacturing, and fabrication of lower cost parts. With the increasing demand for personalized and immediate production, it is crucial to comprehend and enhance AM processes, such as predicting material characteristics, to advance manufacturing capabilities.
1.2 Predicting hardness in AM materials
Hardness is a crucial mechanical characteristic that significantly influences a material’s resistance to external forces, wear, and deformation, playing a vital role in designing and engineering components for challenging applications (Fereidooni and Ghasemi, 2023), (Devi et al., 2023), (Kumar et al., 2024). Precisely predicting the hardness of Polycarbonate (PC) materials in AM is crucial for a wide range of industries and applications. This material has advantageous mechanical characteristics, such as high strength, hardness, and heat resistance (Liu et al., 2023), (Wang et al., 2024), (Srivastava et al., 2023). Predicting hardness in additively manufactured PC components is essential for ensuring product performance, longevity, and reliability. Manufacturers can enhance product quality and performance by precisely forecasting hardness in PC materials, allowing them to optimize manufacturing processes, material compositions, and post-processing techniques to obtain the required mechanical attributes. Thus, predictive modeling of hardness in additively manufactured PC parts allows for informed decision-making, cost-effective material selection, and process optimization, resulting in enhanced efficiency and competitiveness in the AM sector.
1.3 PC and its mechanical characteristics
PC is typically synthesized through the reaction between two components, as tabulated in Table 1, in the presence of a catalyst. This reaction results in the formation of a linear PC polymer chain. PC is a thermoplastic polymer known for its outstanding impact resistance, transparency, and ability to withstand high temperatures. Due to its exceptional characteristics, it is highly favored for various uses, like automotive parts, electrical enclosures, optical lenses, and medical equipment (Xiao et al., 2024). Also, it demonstrates exceptional mechanical strength and toughness, rendering it impervious to impact and fracture. Furthermore, it exhibits outstanding optical clarity and can efficiently transmit light, making it well-suited for applications requiring transparency and visibility (Wu et al., 2024). In addition, PC exhibits exceptional heat resistance, maintaining its mechanical characteristics throughout a broad spectrum of temperatures. Its innate fire resistance and capacity to be readily shaped into intricate forms further enhance its versatility and usefulness across several sectors.

Table 1. Chemical formulation of PC.
1.4 Machine learning in predicting material characteristics
Machine learning (ML) has become a potent instrument for analyzing intricate data sets, detecting patterns, and making highly accurate predictions. Within the field of AM, where the fine-tuning of process parameters and material characteristics is of utmost importance, ML presents a promising method for accurately predicting material characteristics, such as hardness. Such ML models allow firms to enhance production processes, minimize material wastage, and enhance the quality and performance of components manufactured using AM. Furthermore, ML methods enable the identification of intricate connections between process parameters and material characteristics, resulting in valuable insights that can guide the improvement of AM processes to be more efficient and dependable.
1.5 Research objective and scope
The first objective of the present study is to investigate the process parameters that impact the ability to estimate the hardness of PC materials accurately. These process parameters encompass the parameters used during manufacturing. Then, the second objective is to develop a best-performing ML model from the range of models that can reliably predict the hardness of additively manufactured PC parts. The present research focuses on gathering and analyzing pertinent data sets, utilizing ML algorithms for predictive modeling, and verifying the accuracy of the models through practical testing. Thus, the present research intends to improve AM technology and create more efficient and reliable production processes by fulfilling these objectives.
2 Literature review
2.1 Prediction of mechanical characteristics in AM materials
In this comprehensive review, the objective was to construct a solid knowledge base and gain valuable insights that will guide the creation of a predictive modeling method for hardness prediction in additively manufactured PC parts (Batista et al., 2024). Various researchers have investigated the use of ML techniques in the prediction of mechanical characteristics of AM parts. The tensile strength and hardness of liquid resin are mathematically modeled based on the degree of cure by Yang et al. (2019). The developed mechanical characteristics models had 98% and 95% hardness prediction accuracy in the case of green parts and post-cured parts, respectively. Ajay Kumar et al. (2020) used the Taguchi L9 experimental approach to optimize AM process parameters for tensile, flexural, and hardness tests. The optimum hardness value obtained in their experiment was 67.0011 BHN. Researchers also used an experimental design technique, Box Behnken Design (BBD), to study the effect of AM process parameters on the micro-hardness of additively manufactured parts (Raj et al., 2021). They found that individual and interaction effects of process parameters significantly influence response. Kustas et al. (2022) developed a multi-principal element alloy with high hardness and specific strength, which is better than other alloys. In the case of wire arc AM, Ling et al. (2023) performed tests using a neural network algorithm, keeping current, voltage, torch moving speeds, and interval layer cooling coefficients as input parameters and hardness and ultimate tensile strength as output parameters. They observed the good prediction capability of the developed model. In another research on the machinability of parts fabricated by fused deposition modeling and sintering (FDMS), researchers investigated their machining performance (He et al., 2023). They found that FDMS promoted industrialization by improving the machining performance of the diamond blades. Phutela et al. (2023) studied the relationship between characteristics of powder and Laser beam powder bed fusion (PBF-LB) parts of AlSi10 Mg. They observed a high correlation between nano- and micro-hardness of powder and fabricated parts.
2.2 ML techniques applied to material characteristics prediction
This section comprehensively examines the number of ML algorithms utilized in prior research to forecast the hardness and other mechanical characteristics of components manufactured by AM. The merits and drawbacks of several ML techniques, such as supervised, unsupervised, and semi-supervised learning methods, have been analyzed in the context of material characteristics prediction. Yao et al. (2017) constructed an ML algorithm to recommend design characteristics specifically tailored for novice users. The support vector machine (SVM) algorithm utilized pre-existing examples of industrial applications to train the model. Zhang et al. (2018) assessed the data on plume, splatter, and melt pool in AM technology. Quality was documented during the fabrication process using a high-speed camera. Then, the input data was utilized for the development of ML models, including SVM and convolutional neural networks. The accuracy of the SVM model was observed to be 90.1%, while the CNN model achieved an accuracy of 92.7% (Zhang et al., 2018). Agarwal et al. (2022) used AM to create orthopedic bone screws and predicted their compressive behavior. They varied parameters within a specific range to observe their impact on responses. The 4 ML models utilized for predicting compressive strength are k-nearest neighbors (KNN), support vector regression (SVR), decision trees (DT), and random forest (RF). An investigation was conducted utilizing the DT ML algorithm to analyze the influence of essential parameters on dimensional accuracy for different geometries, such as cylindrical shafts, holes, and rectangular slots (Sharma et al., 2022). Veeman et al. used a number of ML algorithms to optimize the AM process parameters in the case of ABS material. The specimen size used was 15 mm × 10 mm × 2 mm in their experiment, which is challenging to accommodate the size of the indenter (2.5 mm). Therefore, the present study has used cube-shaped specimens (size 30 mm). They also predicted hardness value for a combination of process parameters using these ML techniques and found that the RF model outperformed others. However, the researchers did not apply deep learning models to their dataset for prediction purposes (de Camargo et al., 2024). In a recent study, Wang et al. investigated the use of ML algorithms in the prediction of the hardness of polymer blends of multiple materials during AM. They performed hyperparameter tuning using genetic algorithm and particle swarm optimization and found that the design of multi-material co-blinding print products can be quickly performed using ML techniques (Fereidooni and Ghasemi, 2023).
From the literature review, it is observed that supervised machine learning methods like linear regression (LR), DT, random forests (RF), KNN regressor, support vector regressor (SVR), and adaboost (AB) use labeled training data to predict material qualities accurately based on input features. Though supervised deep learning techniques like artificial neural networks (ANN) can model responses more accurately, they pose inherent limitations such as data intensiveness, complexity in interpretability, overfitting, and requirement of high computational resources. In the present study, analysis is performed on the strengths and limits of several ML algorithms to determine the appropriate method for predicting material characteristics in AM. This will help in creating precise and dependable ML prediction models.
2.3 Challenges and limitations in predicting hardness in PC
Although PC material is widely used and has desired characteristics, precisely anticipating their hardness poses various challenges. A vital obstacle lies in the inherent intricacy of a material’s behavior when subjected to different processing conditions, such as temperature gradients, cooling rates, and layer adhesion difficulties commonly encountered in AM (Islam et al., 2024). Insufficient or noisy data and the challenge of capturing complex interactions between processing parameters and material qualities can impede the predictive accuracy of ML models. Furthermore, the absence of standardized testing procedures and material characterization techniques specifically designed for PC in AM adds to the complexity of predicting hardness. To tackle these issues, a comprehensive strategy that includes enhancing data collecting, utilizing advanced modeling approaches, and gaining a more profound comprehension of PC behavior in AM settings is needed. The goal of recognizing and investigating these difficulties is to establish a foundation for developing more precise and dependable predictive models for hardness in PC-based AM methods.
3 Materials and methods
3.1 Filament and AM machine details
The present study utilized PC filament purchased from a manufacturer specializing in 3D printing filaments. The PC filament was melted and placed, and the samples were created using the Delta Wasp 3D printer (Figure 1). The Delta Wasp printer is equipped with a pre-heated Silicon build plate, which minimizes the warping of the models during fabrication. The machine can produce intricate shapes at a faster rate. Additionally, it can manufacture a component with dimensions of ∅200 mm × 400 mm.

Figure 1. Delta wasp 2040 3D printer.
3.2 Development of CAD model and preparation of G-code
Typically, the part size should be large enough to comfortably accommodate the indenter of the Shore D hardness tester while providing a sufficient area for testing. With a side length of 30 mm, the cube provides a suitable surface area for conducting the hardness test on the top surface while ensuring that the indenter can make contact without any obstructions. This size allows for accurate and consistent testing results. The specimens were created and stored in stereolithography (.STL) format using Autodesk Inventor 2020. Subsequently, the STL file must be imported into a slicing software, where the CAD model is transformed into several layers. The process parameters were outlined during the slicing process to change the CAD file into Geometric code (G-code). The G-codes are then exported and transferred to the 3D printers using a Secure Digital (SD) card. Subsequently, the machine assimilates the data from the G-code and proceeds to manufacture the component. The filament was introduced into the nozzle using support rollers by the desired flow rate. Subsequently, the filaments were subjected to heating from heaters positioned above the nozzle, causing them to melt. The resulting molten filament was then placed onto the print bed.
3.3 Process parameters selection
The hardness of the material will be significantly affected by the process parameters used in the slicing section. The present study selected infill density, layer thickness, and printing orientation as process parameters. “infill density” refers to the proportion of a specific material inside a component. The part’s orientation concerning horizontal direction is called “print direction.” “Raster angle” is the deposition angle of material concerning horizontal. It is also a significant parameter in achieving favorable mechanical characteristics. The inclusion of the raster angle of the component allows for the evaluation of its impact on the hardness characteristics of the specimens produced at various levels. The vertical dimension of each subsequent layer applied on top of the previous layers during the material deposition process is called “layer thickness.” The anisotropy of a component plays a crucial role in its mechanical evaluation. The process parameters and their respective ranges are displayed in Table 2. Figure 2 visually illustrates the variations in all process parameters across different ranges. A sample of the fabricated PC part is shown in Figure 3.

Table 2. Range of process parameters.
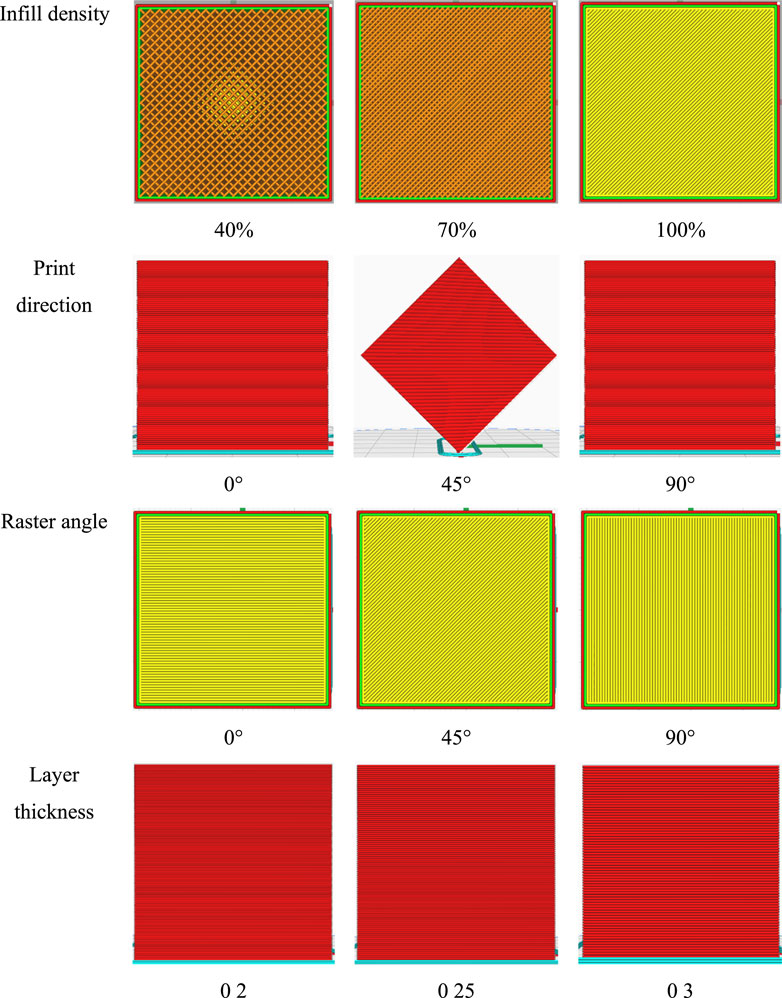
Figure 2. Visual illustration of the variations in process parameters across different ranges.
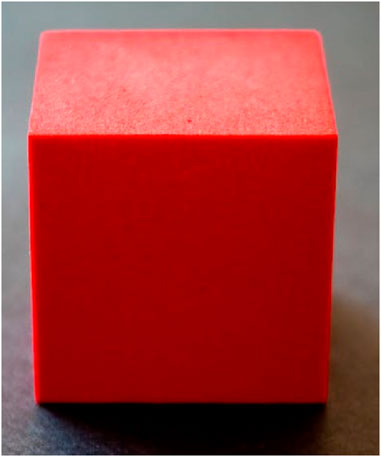
Figure 3. Sample of fabricated PC part.
3.4 Hardness test
Hardness is an intrinsic characteristic of a substance that plays a crucial role in assessing its ability to withstand wear caused by friction or erosion from substances such as oil, water, and steam. This is a non-destructive test performed on specimens to assess the material’s ability to withstand persistent deformation (Sorger et al., 2019). An indenter with precise dimensions is used to penetrate the surface of the specimen. This indenter causes a lasting distortion in the sample known as “indentation.” The hardness value was ascertained by quantifying the depth and extent of the indentation. The primary objective of conducting a hardness test is to assess the material’s appropriateness for particular applications (Kogo et al., 2022). The hardness value in polymers was determined by measuring the load applied to the indenter. Typically, the hardness of polymers and rubbers is assessed using a shore D hardness tester. The hardness testing instrument utilized in this investigation is a shore D durometer manufactured by YUZUKI. The hardness value was determined by calculating the average of five observations, each taken at separate locations with a 3 mm interval. Annexure one lists the dataset obtained from the hardness test.
3.5 Preprocessing steps on the dataset
The dataset is saved as a separate value (.csv) file. It is then imported into the Python environment. The environment is initialized with numpy, pandas, matplotlib, sklearn, and seaborn libraries. Then, process parameters are assigned as X values, and hardness is set as Y values during XY split. Feature scaling is done using a standard scaler, as the scale of all process parameters is different. Further, the dataset is split into training and testing sets in the proportion of 80:20 to feed them into ML models. The study utilized the Scikit-learn toolkit (Version 1.0.2) in Python to construct instances of ML models.
3.6 ML algorithms
According to the reviewed literature, ML techniques are used for two primary purposes: optimizing process parameters and detecting anomalies (Agarwal et al., 2022). The proposed study utilizes the empirical data presented in Annexure one to train ML models and obtain meaningful insights into the conducted process. Several models were trained and assessed using different assessment metrics. The supervised ML algorithms employed are LR, DT, RF, KNN, SVR, AB, and ANN. These particular models were selected to analyze and contrast the effectiveness of different ML algorithms using identical experimental data.
3.7 Model training and validation
LR is an ML model that uses a straight line to establish a connection between dependent and independent variables. Its purpose is to predict continuous outcomes based on the given data. A DT is another ML model that partitions the dataset into subsets using the characteristics. Its objective is to construct a hierarchical structure like a tree, which enables predictions to be made by traversing the paths from the root to the leaves. Figure 4 shows Decision Tree plot. The RF algorithm is an ensemble learning technique that creates several DTs during training. It then combines the predictions of these trees to determine the most common class (for classification tasks) or the average prediction (for regression tasks). This approach enhances the accuracy and reliability of the model. The KNN regressor is an ML model that predicts the value of a target variable by calculating the average of the values of its k-nearest neighbors in the feature space. The SVR is an ML model that seeks to identify the hyperplane that provides the greatest fit for the data points to minimize the error. Its purpose is to predict continuous outcomes by determining the optimal separation between data points in a high-dimensional space. AdaBoost is a technique in ensemble learning that successively combines several weak learners. It assigns higher weights to instances mistakenly predicted in each iteration to focus on the more challenging examples to classify. This process finally results in a strong learner with enhanced accuracy. Further, ANN is a deep learning algorithm that draws inspiration from the structure and function of biological neural networks in the human brain. ANNs are interconnected nodes called neurons arranged in layers that include an input layer, one or more hidden layers, and an output layer. ANNs learn to anticipate outputs from input data by modifying weights and biases in connections between neurons during a process known as training. This enables them to model intricate relationships and make predictions in different fields. In the present study, number of epochs employed were 1,000. Figure 5 shows a plot of Loss Function vs Number of Epochs and Figure 6 shows a plot of Training and testing accuracy varying with number of epochs. The present study optimized each algorithm to generate accurate forecasts by utilizing “GridSearchCV” hyperparameter tuning.
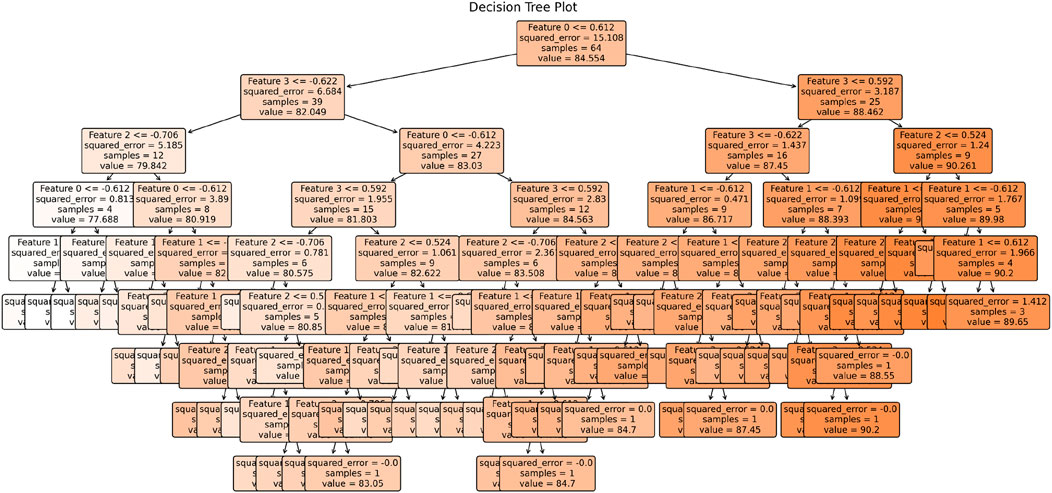
Figure 4. Decision Tree plot.
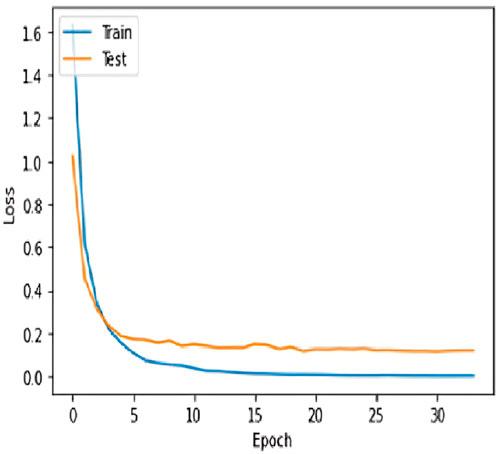
Figure 5. Loss function vs. number of Epochs.
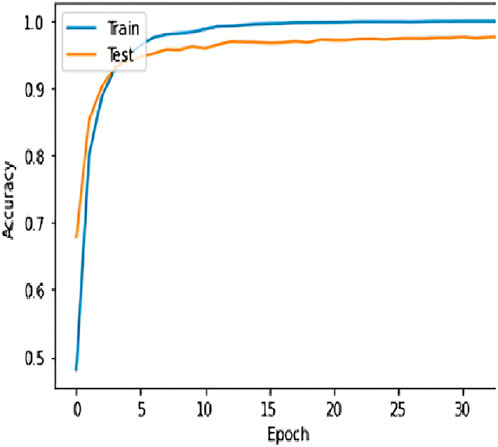
Figure 6. Training and testing accuracy varying with number of epochs.
3.8 Hyperparameter tuning
In the present study, “GridSearchCV” technique was used for hyperparameter tuning. The hyperparameters and their ranges for each ML model are as follows:
• Linear regression: This is a standard ML model. Therefore, hyperparameters were not employed.
• Decision Tree: Max Depth (None, 10, 20, 30, 40, 50), Min Samples Split (2, 5, 10), Min Samples Leaf (1, 2, 4), Criterion (‘mse’, ‘friedman_mse’, ‘mae')
• Random Forest: Number of Estimators (10, 50, 100, 200, 500), Max Depth (None, 10, 20, 30, 40, 50), Min Samples Split (2, 5, 10), Min Samples Leaf (1, 2, 4), Bootstrap (True, False).
• K-nearest neighbor: Number of Neighbors (3, 5, 7, 9, 11), Weights (‘uniform’, ‘distance’), Algorithm (‘auto’, ‘ball_tree’, ‘kd_tree’, ‘brute').
• Support Vector Regression (SVR): C (0.1, 1, 10, 100, 1,000), Gamma (‘scale’, ‘auto’), Kernel (‘linear’, ‘poly’, ‘rbf’, ‘sigmoid').
• AdaBoost: Number of Estimators (50, 100, 200, 500), Learning Rate (0.01, 0.1, 1, 10), Algorithm (‘SAMME’, ‘SAMME.R′).
• Artificial Neural Network (ANN): Number of Hidden Layers (1, 2, 3), Number of Neurons per Layer (10, 50, 100), Activation Function (‘relu’, ‘tanh’, ‘sigmoid’), Solver (‘adam’, ‘sgd’), Learning Rate (0.001, 0.01, 0.1), Batch Size (32, 64, 128), Number of Epochs (50, 100, 200).
3.9 Evaluation metrics
An evaluation metric or error measure is a metric that assesses the performance of a model and enables the forecaster to make quantitative comparisons between different models. These metrics allow the evaluation of the model’s performance more impartially. In the present investigation, four evaluation metrics, namely, mean squared error (MSE), root mean squared error (RMSE), R-squared (R2), and adjusted R-squared (Adj. R2), are used. MSE is a commonly used statistical and machine learning measure that quantifies the average of the squared discrepancies between anticipated and actual values. A predictive model’s performance is evaluated by measuring the degree of concordance between the model’s predictions and the real data, providing a quantitative assessment of the model’s overall quality. MSE is often observed in regression assignments since it serves as a valuable metric for assessing the effectiveness of a model. The mathematical expression for the MSE is given in the Equation 1.
Where: n represents the total number of data points inside the dataset.
The symbol Σ denotes the summation of all data points.
The expression (actual - predicted)2 is used to compute the square difference between the observed (true) value and the expected value for each data point.
RMSE value is the square root of MSE. The R2, often called the coefficient of determination, is a statistical metric used to assess a regression model’s fit appropriateness. This analysis offers valuable information into the extent to which the independent variable(s) included in the model account for the variability seen in the dependent variable. The R2 statistic is a valuable tool for evaluating the extent to which a model’s independent variable(s) account for the variance seen in the dependent variable. The Adjusted R2 is a revised rendition of the R2 statistic, also known as the coefficient of determination, often used in statistical analysis and regression modeling. The R2 metric is used to evaluate the degree of fit of a regression model. In contrast, the adjusted R-squared metric incorporates the number of independent variables in the model, offering a more equitable assessment of the model’s fit. Regularization techniques aid in mitigating the problem of overfitting and enhance the precision of evaluating a model’s capacity to explain the observed data.
3.10 Limitation of ML approaches
This section discusses some of the limitations of ML approaches:
• Overfitting: Overfitting is a significant concern, especially for complex models like ANN. Although ANNs can model responses accurately, they are prone to overfitting due to their complexity and data intensity.
• Assumptions Made by Algorithms: Different algorithms come with inherent assumptions. For example, linear regression assumes a linear relationship between the independent and dependent variables. Decision trees assume that the data can be split into subsets that can be used to make accurate predictions.
• Sensitivity to Outliers or Noise: Some models, such as LR and KNN, are highly sensitive to outliers, which can significantly affect their performance. Thus, there is an importance of feature scaling to handle different scales of process parameters, which can help mitigate the effect of outliers.
• Data Quality and Availability: The intricate nature of AM processes poses challenges in capturing all relevant parameters that affect hardness prediction. This can lead to incomplete or noisy data, affecting model performance.
• Generalizability: The generalizability of the models to different datasets or real-world scenarios is another concern. Therefore, it is suggested that future research should include a broader range of process parameters, material compositions, and environmental conditions to improve model robustness and generalizability.
4 Results and discussion
4.1 Heatmap
Figure 7 shows a heatmap generated using the Python command, which shows the relationship between process parameters and hardness. It is observed that infill density significantly influences the hardness of the specimen, as the heatmap value is 0.84. This is evident from the quantity of material available to resist the indentation, which is directly proportional to the hardness value. The second influential process parameter is layer thickness, which shows a 0.44 heatmap value. Raster angle and print direction have heatmap values of 0.19 and 0.11, respectively, which shows that the influence of these process parameters is less significant for hardness.

Figure 7. Heatmap showing the relationship between process parameter and hardness.
Infill density directly influences the internal structure of the fabricated part. A higher infill density signifies more material is used to fill the interior of the part, leading to increased structural integrity and higher hardness. Conversely, a lower infill density results in a hollow structure, reducing the overall strength and hardness of the part. Also, higher infill density ensures better load distribution within the part, enhancing its ability to withstand external forces and thus improving hardness. Layer thickness affects the bonding between successive layers during the printing process. Thinner layers result in better interlayer adhesion, as each layer has more opportunities to fuse with the previous one, leading to a denser and harder final part. Thicker layers may lead to weaker interlayer bonding, reducing hardness. Also, thinner layers contribute to a smoother surface finish, reducing stress concentrators and potential weak points that could compromise the part’s hardness. A smoother surface also improves the overall mechanical properties of the printed part.
4.2 Prediction analysis
The prediction plots shown in Figure 8 were utilized to display the predicted and actual values for each model visually. The error value is minimal when data points are as close to the diagonal line. These figures suggest that the fundamental and predicted values overlap or exhibit little discrepancies, demonstrating the precision of each model in forecasting the hardness. It is observed that the actual value and predicted values of all tree-based models (DT, RF, and AB) have the highest degree of overlap across the majority of data points. In the case of the LR model, there is often a significant deviation between the actual and predicted values. Out of the three tree-based models, the RF model is the most accurate in forecasting the output values due to its minimal variation. DT and RF exhibit more reliable prediction performance compared to LR. Therefore, the RF model surpasses all other models in accurately forecasting the hardness value. In the KNN and SVR models, a noticeable discrepancy is observed between actual and predicted hardness values. Also, the natural and predicted values of the ANN model vary significantly. This highlights the limitation of using deep learning techniques in predicting hardness for small datasets. Thus, the RF algorithm exhibits the highest level of precision and can generate output with a smaller margin of error.
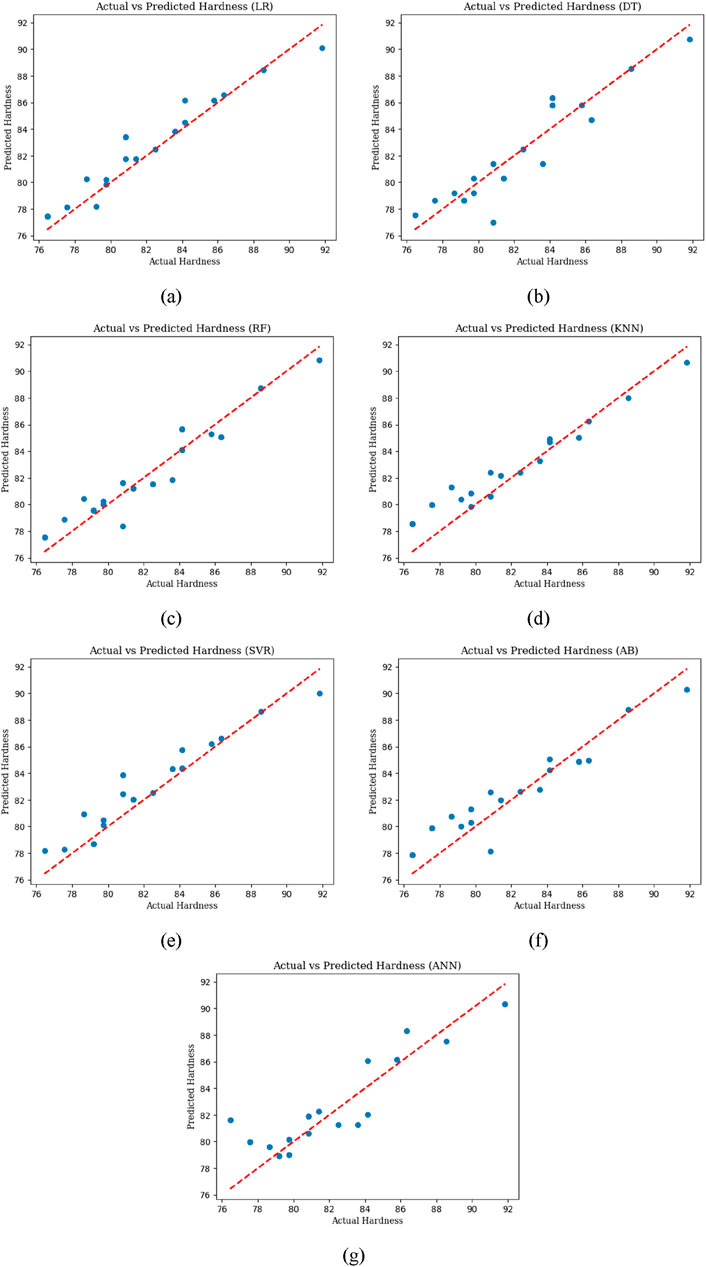
Figure 8. Actual and predicted hardness values of (A) LR, (B) DT, (C) RF, (D) KNN, (E) SVR, (F) AB, and (G) ANN models.
4.3 Residual plots
To obtain a more detailed assessment of the accuracy, ML models must be evaluated based on their performance changes in the training and test data rather than relying solely on prediction plots. To achieve this objective, the study utilized residual plots. Figure 9 displays the residual plots of the training and testing data for all models. The plot was generated by plotting the residuals on the y-axis against the experimental hardness values on the x-axis. The residual value is the discrepancy between the actual and estimated value of hardness. Figure 9 demonstrates that the RF model exhibits uniformly distributed residuals for training and testing data. While the LR, DT, and AB models show low residuals for the training data, the residuals for the test data are significantly high and cannot be disregarded. Consequently, the accuracy of these models’ performance is compromised. In the case of the RF model, the residuals tend to cluster within the range of 1.5 to −1.0 for both the training and testing data. Thus, the RF model accurately predicts the training and testing data within a specific range. Upon evaluating the performance of models utilizing bagging approaches such as DT, RF, and AB, it is evident that they yield superior outcomes compared to basic baseline models like LR and ANN models. The conducted prediction study substantiates this fact.
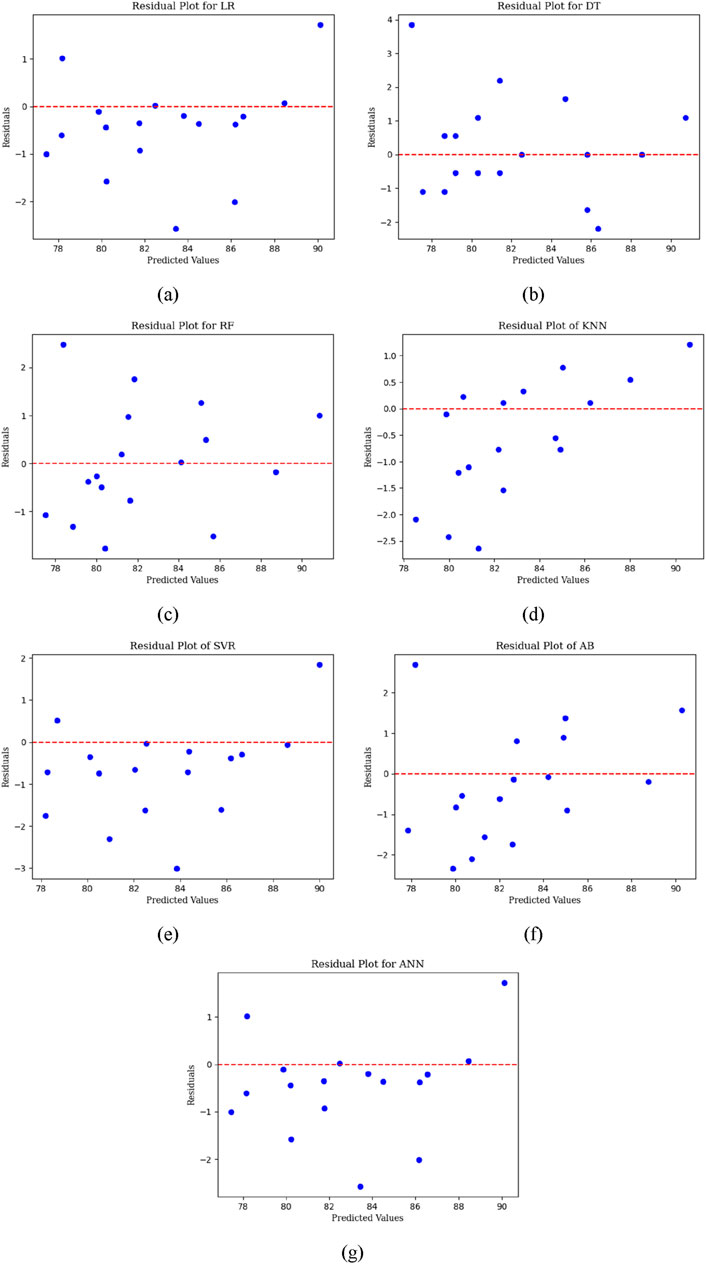
Figure 9. Actual and predicted Hardness values of (A) LR, (B) DT, (C) RF, (D) KNN, (E) SVR, (F) AB, and (G) ANN models.
4.4 Evaluation metrics
Figure 10 depicts the error metrics of the ML models about the training and testing data. When assessing models using error metrics, the most accurate model should have MSE and RMSE values that are closer to 0 and an R2 and adjusted R2 value that are close to 1. The optimal model is determined by evaluating its performance on the training and testing data. This ensures that the model can effectively handle both datasets, avoiding overfitting or underfitting.
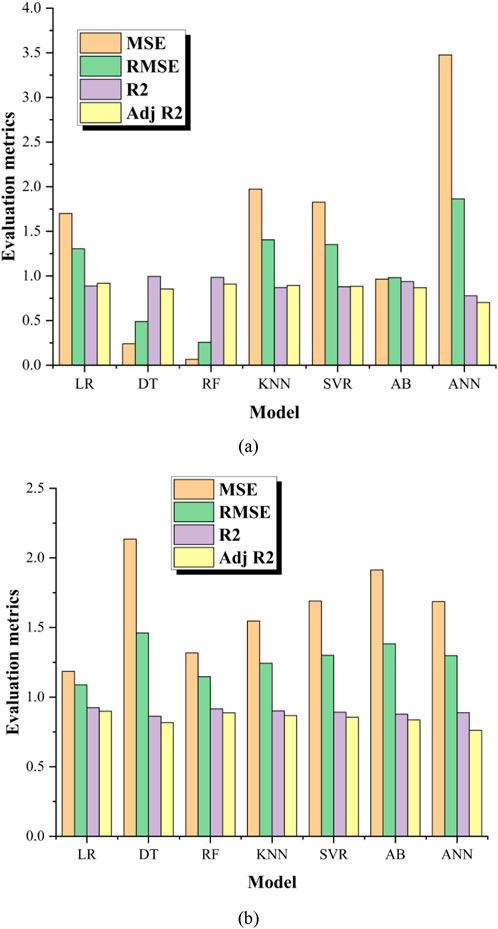
Figure 10. Evaluation metrics plot (A) Training data (B) Testing data.
The metrics indicate that most models have exhibited substantial performance in predicting the training data points except the ANN model. The RF and AB models demonstrate exceptional performance. Their R2 value exceeds 0.95. As mentioned, bagging models exhibit lower error rates than the LR model. This finding reinforces that models employing bagging techniques yield superior outcomes to simplistic models. A thorough comparison of all assessment criteria was conducted to select the optimal model between RF and AB. Based on the data shown, it can be deduced that the RF model has MAE and RMSE values that are close to 0 among all ML models. This phenomenon is also evident in the R2 values. The RF model exhibits the highest R2 value for the training and testing data. In case of RF model, error metrics like MSE and RMSE are lowest for training and testing sets, also, R2 and Adj R2 values are highest in comparison with other models. Therefore, after assessing the inaccuracy of each model based on the training and testing data, it was determined that the RF model yielded the most precise prediction of the hardness value for PC material.
4.5 Implications of the findings
The present study provides substantial advantages to AM practitioners and stakeholders by creating an ML model that can precisely predict the hardness of PC materials. The predictive model allows producers to enhance product quality and performance by optimizing process parameters and material formulations. Manufacturers can improve their production processes to fulfill performance criteria and regulatory standards by understanding the elements affecting hardness prediction accuracy. Furthermore, the present study enhances the progress of predictive modeling abilities in AM, hence facilitating the creation of comparable models for forecasting additional material characteristics.
4.6 Limitations of the study and suggestions for future research
A constraint of the present research resides in the accessibility and caliber of the data utilized for model training and validation. The intricate nature of AM procedures and substances poses difficulties in effectively capturing all pertinent parameters that affect hardness prediction. Future research efforts should broaden the scope of data collecting by including a more comprehensive array of process parameters, material compositions, and environmental conditions. In addition, integrating sophisticated modeling techniques, such as multi-scale modeling or hybrid ML approaches, can improve the accuracy and reliability of predictions. Furthermore, investigating the influence of post-processing treatments and material aging on hardness prediction could yield significant knowledge regarding the durability of additively built components over time. Also, future studies can enhance the comprehension of hardness prediction in AM and contribute to the ongoing enhancement of manufacturing processes and product quality by addressing these limitations and pursuing new research pathways.
5 Conclusion
The present study demonstrates the application of ML techniques, such as LR, DT, RF, KNN, SVR, AB, and ANN, for predicting the hardness of additively manufactured PC material. The findings of these models have demonstrated that bagging-based models exhibit superior predictive capabilities. The slicing software provided descriptions of the process parameters, including infill density, print direction, raster angle, and layer thickness, at three different levels. The hardness values were obtained by averaging measurements using a shore D durometer. The following are essential findings of the study-
• The heatmap shows that infill density and layer thickness are the most significant process parameters affecting hardness.
• The results indicate that the RF model provided the most precise predictions of hardness value in PC material, with an MAE of 0.0661, RMSE of 0.2572, R2 of 0.9840, and Adjusted R2 of 0.9097 for the training set. The RF algorithm is highly accurate when used to train and test data, resulting in low errors.
• In the case of the RF model, the residuals tend to cluster within the range of 1.5 to −1.0 for both the training and testing data. Thus, the RF model accurately predicts the training and testing data within a specific range.
Thus, the RF model provides the most accurate predict the hardness of AM PC parts. Therefore, ML can be an excellent tool for predicting the mechanical characteristics of AM parts.
Data availability statement
The original contributions presented in the study are included in the article/supplementary material, further inquiries can be directed to the corresponding author.
Author contributions
HA: Funding acquisition, Project administration, Resources, Supervision, Validation, Writing–original draft. GS: Conceptualization, Data curation, Formal Analysis, Funding acquisition, Investigation, Methodology, Project administration, Resources, Software, Supervision, Validation, Visualization, Writing–original draft, Writing–review and editing. SV: Conceptualization, Data curation, Formal Analysis, Funding acquisition, Investigation, Methodology, Project administration, Resources, Software, Supervision, Validation, Visualization, Writing–original draft, Writing–review and editing. RK: Conceptualization, Data curation, Formal Analysis, Funding acquisition, Investigation, Methodology, Project administration, Resources, Software, Supervision, Validation, Visualization, Writing–original draft, Writing–review and editing. RC: Conceptualization, Formal Analysis, Investigation, Methodology, Project administration, Validation, Writing–original draft. SS: Conceptualization, Data curation, Formal Analysis, Funding acquisition, Investigation, Methodology, Project administration, Resources, Software, Supervision, Validation, Visualization, Writing–original draft, Writing–review and editing. SG: Conceptualization, Data curation, Formal Analysis, Funding acquisition, Investigation, Methodology, Project administration, Resources, Software, Supervision, Validation, Visualization, Writing–original draft, Writing–review and editing. EA: Conceptualization, Data curation, Formal Analysis, Funding acquisition, Investigation, Methodology, Project administration, Resources, Software, Supervision, Validation, Visualization, Writing–original draft, Writing–review and editing.
Funding
The author(s) declare that financial support was received for the research, authorship, and/or publication of this article. The authors present their appreciation to King Saud University for funding this research through Researchers Supporting Program number (RSPD2024R1006), King Saud University, Riyadh, Saudi Arabia. This article was co-funded by the European Union under the REFRESH–Research Excellence For Region Sustainability and High-tech Industries project number CZ.10.03.01/00/22_003/0000048 via the Operational Programme Just Transition and has been done in connection with project Students Grant Competition SP2024/087, “Specific Research of Sustainable Manufacturing Technologies” financed by the Ministry of Education, Youth and Sports and Faculty of Mechanical Engineering VSB-TUO.
Conflict of interest
Author SV was employed by Datainsights Enterprises.
The remaining authors declare that the research was conducted in the absence of any commercial or financial relationships that could be construed as a potential conflict of interest.
Publisher’s note
All claims expressed in this article are solely those of the authors and do not necessarily represent those of their affiliated organizations, or those of the publisher, the editors and the reviewers. Any product that may be evaluated in this article, or claim that may be made by its manufacturer, is not guaranteed or endorsed by the publisher.
References
Agarwal, R., Singh, J., and Gupta, V. (2022). Predicting the compressive strength of additively manufactured PLA-based orthopedic bone screws: a machine learning framework. Polym. Compos 43 (8), 5663–5674. doi:10.1002/pc.26881
Ajay Kumar, M., Khan, M. S., and Mishra, S. B. (2020). Effect of machine parameters on strength and hardness of FDM printed carbon fiber reinforced PETG thermoplastics. Mater Today Proc. 27, 975–983. doi:10.1016/j.matpr.2020.01.291
Batista, R. C., Agarwal, A., Gurung, A., Kumar, A., Altarazi, F., Dogra, N., et al. (2024). Topological and lattice-based AM optimization for improving the structural efficiency of robotic arms. Front. Mech. Eng. 10 (Jun). doi:10.3389/fmech.2024.1422539
de Camargo, I. L., Verza, J. R., Garcia, J., Di Federico, D., Fortulan, C. A., and da Luz, A. P. (2024). Fused filament fabrication of partially stabilized zirconia (3Y-TZP) parts. Mater Lett. 355, 135510. doi:10.1016/j.matlet.2023.135510
Devi, P. A., Reddy, P. R., and Prasad, K. E. (2023). Hardness and impact testing of glass epoxy nanoclay composites. Mater Today Proc. doi:10.1016/j.matpr.2023.09.166
Fereidooni, D., and Ghasemi, F. (2023). Development of a mandrel indentation test to evaluate surface hardness of dimensional building stones and comparison to Vickers hardness. Int. J. Rock Mech. Min. Sci. 170, 105491. doi:10.1016/j.ijrmms.2023.105491
Goyal, G., Kumar, A., and Sharma, D. (2024). “Recent applications of rapid prototyping with 3D printing: a review,” in 3D printing technologies (De Gruyter), 245–258. doi:10.1515/9783111215112-012
He, T., Zhang, S., Yip, W. S., To, S., Wu, J., Liu, L. l., et al. (2023). Investigation on the machining performance of copper-based diamond ultra-thin dicing blades manufactured by fused deposition modeling and sintering (FDMS). Tribol. Int. 187, 108702. doi:10.1016/j.triboint.2023.108702
Islam, M. A., Mobarak, M. H., Rimon, M. I. H., Al Mahmud, M. Z., Ghosh, J., Ahmed, M. M. S., et al. (2024). Additive manufacturing in polymer research: advances, synthesis, and applications. Polym. Test. 132, 108364. doi:10.1016/j.polymertesting.2024.108364
Kogo, B., Xu, C., Wang, B., Chizari, M., Reza Kashyzadeh, K., and Ghorbani, S. (2022). An experimental analysis to determine the load-bearing capacity of 3D printed metals. Materials 15 (12), 4333. doi:10.3390/ma15124333
Korkmaz, M. E., Waqar, S., Garcia-Collado, A., Gupta, M. K., and Krolczyk, G. M. (2022). A technical overview of metallic parts in hybrid additive manufacturing industry. J. Mater. Res. Technol. 18, 384–395. doi:10.1016/j.jmrt.2022.02.085
Kumar, P., Hussain, S. S., Kumar, A., Srivastava, A. K., Hussain, M., and Singh, P. K. (2024). “Finite element method investigation on delamination of 3D printed hybrid composites during the drilling operation,” in 3D printing technologies (De Gruyter), 223–234. doi:10.1515/9783111215112-010
Kustas, A. B., Jones, M. R., DelRio, F. W., Lu, P., Pegues, J., Singh, P., et al. (2022). Extreme hardness at high temperature with a lightweight additively manufactured multi-principal element superalloy. Appl. Mater Today 29, 101669. doi:10.1016/j.apmt.2022.101669
Ling, Y., Ni, J., Antonissen, J., Ben Hamouda, H., Vande Voorde, J., and Abdel Wahab, M. (2023). Numerical prediction of microstructure and hardness for low carbon steel wire Arc additive manufacturing components. Simul. Model Pract. Theory 122, 102664. doi:10.1016/j.simpat.2022.102664
Liu, Z., Ma, M., Ge, B., Zheng, Y., Chen, S., Shi, Y., et al. (2023). Toward flame-retardant, transparency, and high mechanical property of polycarbonate based on low addition of linear polyborosiloxane. Chem. Eng. J. 474, 145799. doi:10.1016/j.cej.2023.145799
Luo, M., Yang, T., Wang, T., Yan, Z., and Zhang, J. (2024). The effect of filler size on the properties of TPU/BN flexible thermal conductive composites prepared by Fused Filament Fabrication. Polym. Guildf. 296, 126810. doi:10.1016/j.polymer.2024.126810
Phutela, C., Bosio, F., Li, P., and Aboulkhair, N. T. (2023). Correlating the microstructure and hardness of AlSi10Mg powder with additively-manufactured parts upon in-situ heat-treatments in laser beam powder bed fusion. Addit. Manuf. Lett. 7, 100168. doi:10.1016/j.addlet.2023.100168
Raj, M., Venkatraman, R., and Raghuraman, S. (2021). Experimental analysis on density, micro-hardness, surface roughness and processing time of acrylonitrile butadiene styrene (ABS) through fused deposition modeling (FDM) using Box behnken design (BBD). Mater Today Commun. 27, 102353. doi:10.1016/j.mtcomm.2021.102353
Sharma, P., Vaid, H., Vajpeyi, R., Shubham, P., Agarwal, K. M., and Bhatia, D. (2022). Predicting the dimensional variation of geometries produced through FDM 3D printing employing supervised machine learning. Sensors Int. 3, 100194. doi:10.1016/j.sintl.2022.100194
Sorger, G. L., Oliveira, J., Inácio, P. L., Enzinger, N., Vilaça, P., Miranda, R., et al. (2019). Non-destructive microstructural analysis by electrical conductivity: comparison with hardness measurements in different materials. J. Mater Sci. Technol. 35 (3), 360–368. doi:10.1016/j.jmst.2018.09.047
Srivastava, A. K., Tiwari, S., Pachauri, P., Gupta, N., Sunil, B., and Kumar, A. (2023). Bonding strength and microstructural features of Al5083-AZ31B alloys laminated sheet through friction stir additive manufacturing. J. Adhes. Sci. Technol. 38, 583–596. doi:10.1080/01694243.2023.2240637
Thomas, P. A., Aahlada, P. K., Kiran, N. S., and Ivvala, J. (2018). A review on transition in the manufacturing of mechanical components from conventional techniques to rapid casting using rapid prototyping. Mater Today Proc. 5 (5), 11990–12002. doi:10.1016/j.matpr.2018.02.173
Wang, Z., Xiong, W., Zhao, Y., Liu, J., Sun, H., and Pan, X. (2024). Hydrogen bond interaction and mechanical property of polycarbonate polyurethane solid electrolyte. J. Mol. Struct. 1297, 136947. doi:10.1016/j.molstruc.2023.136947
Wu, R., Gilavan, M. T., Akbar, M. A., Fan, L., and Selvaganapathy, P. R. (2024). Direct transformation of polycarbonate to highly conductive and superhydrophobic graphene/graphitic composite by laser writing and its applications. Carbon N. Y. 216, 118597. doi:10.1016/j.carbon.2023.118597
Xiao, X.-X., Bai, T. Y., Zhang, Q., Chen, Z. X., Wang, Z. N., Bai, J. H., et al. (2024). Machine learning-assisted design and scalable fabrication of high-performance fire-safe polycarbonate for advanced applications. Chem. Eng. J. 484, 149565. doi:10.1016/j.cej.2024.149565
Yang, Y., Li, L., and Zhao, J. (2019). Mechanical property modeling of photosensitive liquid resin in stereolithography additive manufacturing: bridging degree of cure with tensile strength and hardness. Mater Des. 162, 418–428. doi:10.1016/j.matdes.2018.12.009
Yao, X., Moon, S. K., and Bi, G. (2017). A hybrid machine learning approach for additive manufacturing design feature recommendation. Rapid Prototyp. J. 23 (6), 983–997. doi:10.1108/RPJ-03-2016-0041
Yu, Q., Zhang, M., Mujumdar, A. S., and Li, J. (2024). AI-based additive manufacturing for future food: potential applications, challenges and possible solutions. Innovative Food Sci. and Emerg. Technol. 92, 103599. doi:10.1016/j.ifset.2024.103599
Keywords: additive manufacturing, hardness, polycarbonate, fused filament fabrication, machine learning
Citation: A. Mahmoud H, Shanmugasundar G, Vyavahare S, Kumar R, Cep R, Salunkhe S, Gawade S and Abouel Nasr ES (2024) Prediction of machine learning-based hardness for the polycarbonate using additive manufacturing. Front. Mater. 11:1410277. doi: 10.3389/fmats.2024.1410277
Received: 31 March 2024; Accepted: 15 August 2024;
Published: 29 August 2024.
Edited by:
Guilherme Mariz de Oliveira Barra, Federal University of Santa Catarina, BrazilReviewed by:
Akshansh Mishra, Polytechnic University of Milan, ItalyAjay Kumar, JECRC University, India
Copyright © 2024 A. Mahmoud, Shanmugasundar, Vyavahare, Kumar, Cep, Salunkhe, Gawade and Abouel Nasr. This is an open-access article distributed under the terms of the Creative Commons Attribution License (CC BY). The use, distribution or reproduction in other forums is permitted, provided the original author(s) and the copyright owner(s) are credited and that the original publication in this journal is cited, in accordance with accepted academic practice. No use, distribution or reproduction is permitted which does not comply with these terms.
*Correspondence: Sachin Salunkhe, c2FjaGluc2FsdW5raGVAZ2F6aS5lZHUudHI=