 Shuai Huang1
 Pengfei Men
94% of researchers rate our articles as excellent or good
Learn more about the work of our research integrity team to safeguard the quality of each article we publish.
Find out more
ORIGINAL RESEARCH article
Front. Mater. , 10 June 2024
Sec. Structural Materials
Volume 11 - 2024 | https://doi.org/10.3389/fmats.2024.1410016
This article is part of the Research Topic Advanced Concretes and Their Structural Applications, Volume III View all 12 articles
To improve the flexural performance of damaged reinforced concrete T-beams, a method of filling ultra-high performance concrete (UHPC) in the damaged area was adopted. Experimental studies were conducted on two UHPC-reinforced concrete T-beams with different lengths of damaged areas and one undamaged concrete T-beam as a reference. Crack distribution, failure modes, cracking loads, flexural capacities, and strain variation of the specimens were analyzed. Subsequently, a nonlinear finite element (FE) model of the UHPC-reinforced T-beam was developed using ABAQUS, and the FE model results were compared with the experimental results to validate the accuracy of the FE simulation method. The results indicated that the two UHPC-reinforced T-beams exhibited a similar flexural failure process to the undamaged T-beam. The longitudinal tensile strain distribution at the mid-span section showed that the composite section formed by the filling of UHPC in the damaged region still adhered the assumption of the planar section. Owing to the excellent bond performance between UHPC and the existing concrete, the main cracks of the UHPC-reinforced T-beams appeared in the chiseled area, and the crack widths of the UHPC-reinforced T-beams under the same load were smaller than those of the reference T-beam. Overall, the reinforcing method of filling UHPC in the damaged region can restore or even enhance the flexural performance of the damaged reinforced concrete T-beams.
It is widely recognized that bridge safety is influenced by two major factors: natural factors and human factors. Among the human factors, vehicle collisions pose a significant threat to bridge structures and should not be ignored. However, it is important to note that not all bridges collapse when struck by vehicles, particularly in cases where high vehicles collide with overpass bridges. In most instances, these collisions result in localized damage to the upper structure of bridges. Figure 1 depicts a typical bridge collision accident that took place in China, where it is evident that collisions with high vehicles primarily caused localized concrete failure, fractures in ordinary rebars, and breakage of limited prestressed tendons. Typically, such damage does not result in a loss of bearing capacity or collapse of the bridge. However, before the damaged beams are repaired or replaced, the traffic of the damaged bridge needs to be closed for an extended period.
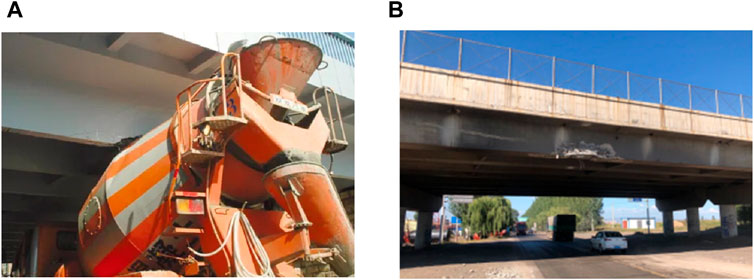
Figure 1. Typical accidents caused by vehicle impact on bridges. (A) Concrete T-beam bridge (B) Small box girder bridge.
Regarding the issue of vehicle collisions with bridges, current research primarily focuses on the damage mechanisms of bridge structures after impact and numerical simulations of the collision process (Xu et al., 2012; Xu et al., 2013). It is difficult to find research literature specifically addressing reinforcement techniques for damaged bridges caused by collisions. However, extensive studies (Ngidi and Dundu, 2018; Di et al., 2020; Qin et al., 2020) have been conducted on concrete bridges that do not meet the normal serviceability requirements in terms of load capacity, which can provide references for the reinforcement research of collision-damaged bridges. In recent years, new types of cementitious materials, such as engineered cementitious composites (ECC) (Zhang et al., 2023a; 2023b; Liu et al., 2023; Men et al., 2024) Ultra-high performance concrete (UHPC) (Leng et al., 2024) concrete have been studied and used in civil engineering. UHPC exhibits high tensile strength, good flowability, and high bond strength with existing concrete (Zou et al., 2023a; Zou et al., 2023b). The application of UHPC for retrofitting existing bridges has become a significant reinforcement method (Zhu et al., 2020).
Zhang et al. (2020a; 2020b) conducted a series of push-out tests to investigate the effects of various parameters, including the of normal concrete strength, interface treatment methods, the age of UHPC, and the moisture level on the surface of normal concrete, on the shear performance of the interface between UHPC and normal concrete. M.A. Al-Osta et al. (2017) conducted experimental investigations on the flexural performance of reinforced concrete beams strengthened with ultra-high performance fiber-reinforced concrete (UHPFRC) using two interface treatment methods: sandblasting treatment on the surface of the reinforced concrete beams and applying epoxy adhesive at the interface. The results indicated that the flexural performance of the beams under both strengthening methods was similar, with the three-sided U-shaped UHPFRC reinforcement method showing the highest increase in the bearing capacity. Paschalis et al. (2018) conducted a comparative study to evaluate the effectiveness of non-reinforced UHPFRC strengthening layers and reinforced UHPFRC strengthening layers on the flexural behaviour of reinforced concrete beams. They found that the non-reinforced UHPFRC layer had a minimal impact on the flexural capacity of the beams but delayed crack formation and enhanced beam stiffness, while the reinforced UHPFRC layer significantly increased the flexural capacity of the test beams. Zhang et al. (2020c; 2023) investigated the flexural performance of damaged reinforced concrete beams strengthened with reinforced UHPC layers, and they found that the reinforced UHPC layers increased the flexural capacity of the beams by 71.4%–126.3% and effectively delayed the development of cracks. P. Ganesh and Murthy. (2021) used precast UHPC strips to strengthen the tension region of reinforced concrete beams and studied the reinforcement effects of different thicknesses of UHPC strips through static load tests. The results demonstrated that the interface between the UHPC strip and concrete beam remained intact throughout the entire loading process. Although the precast UHPC strips increased the flexural stiffness of the beams, the improvement in flexural capacity was not significant. Safdar et al. (2016) replaced the concrete at the top and bottom of reinforced concrete beams with UHPFRC layers of varying thicknesses to investigate their influence on flexural performance, and the study indicated that the UHPFRC s reinforcement layer enhanced the stiffness, ultimate flexural capacity, and delayed crack initiation, thereby improving the durability of the concrete beams. Yin et al. (2017) conducted flexural performance tests on reinforced concrete slabs using UHPC. The results showed that the UHPC reinforcement layer improved the failure mode of the reinforced concrete slabs and increased their flexural capacities.
According to the available literature, numerous studies have been conducted on the flexural performance of existing bridges reinforced with UHPC. However, there is a lack of research specifically addressing the reinforcement of damaged bridges using UHPC. To bridge this gap, this study conducted experimental investigations and nonlinear finite element (FE) model to study the flexural behaviour of damaged concrete T-beams reinforced with UHPC filling, and the findings in this paper can provide guidance for reinforcing this type of damaged bridge.
A total of three T-beam specimens were designed, including one undamaged specimen as a reference and two damaged specimens reinforced with UHPC. For each T-beam, the width and thickness of the top flange were 450 mm and 100 mm, respectively, while the height and width of the web were 300 mm and 150 mm, respectively. The damage areas of the two reinforced specimens were arranged on the web, both located near the mid-span section, with dimensions of 150 mm × 500 mm and 200 mm × 1,000 mm, respectively, in the elevation view. For the actual impact-damaged bridge depicted in Figure 1, prior to reinforcement implementation, it was necessary to remove the damaged rebars and weld new rebars. As the overlapping welding of reinforcing bars is a well-established technique ensuring the strength of the welded joints, this study omitted the step of welding new rebars and used intact rebars in the fabrication process of the specimen. The details of the specimens are illustrated in Figure 2. The dimensions of the damaged and reinforced areas of the specimens are presented in Table 1. In Table 1, the label of the specimen consists of two parts: the first part denotes the reinforcement form of the specimens, where “NC” represents unreinforced T-beam and “NU” represents reinforced beam, and the second part of “NU” represents the length of the reinforced area were 0.5 m or 1.0 m.
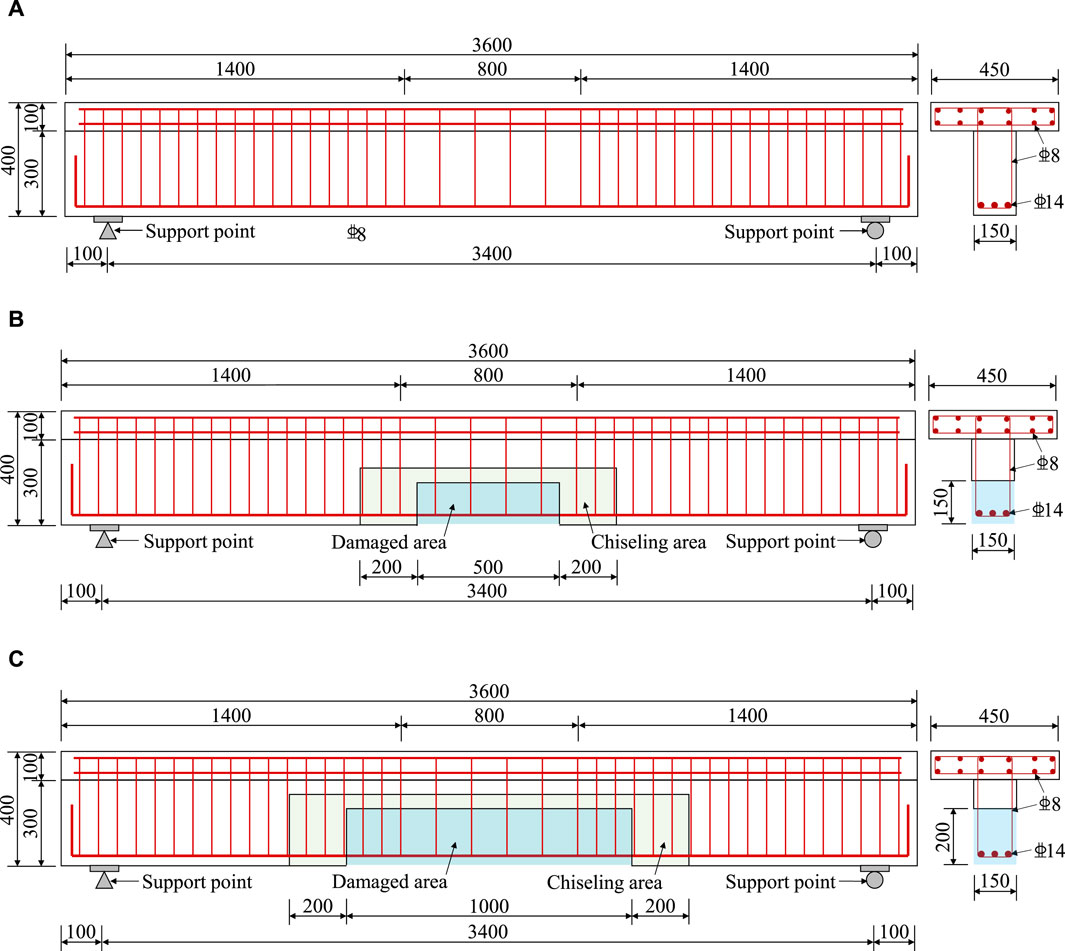
Figure 2. Dimensional parameters of the specimens (unit: mm). (A) NC (B) NU-0.5 (C) NU-1.0.
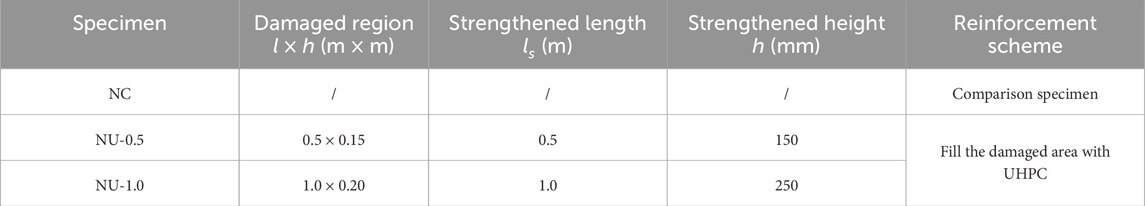
Table 1. Primary test parameters of specimens.
During the specimen fabrication, to ensure the enough bond between the UHPC in the damaged region and the normal concrete of the existing beam, the concrete at the damage area was completely removed, and simultaneously, a certain area around the damaged region of the beam was chiseled to create a rough surface. As shown in Figures 2, 3, the height of the chipped area of the beam was 50 mm higher than that of the damaged region, and each end of the chiseled area was extended 200 mm beyond the damaged region. The chiseling depth on the side and bottom surfaces of the web was controlled at 15 mm and 20 mm, respectively. Through this chiseling process, the normal tensile interface between the UHPC at the damaged region and the existing concrete of the T-beam was transformed into two types of interfaces: the normal tensile interface between the UHPC filling and the existing concrete and the tangential shear interface between the chipped U-shaped UHPC and the existing concrete. This approach helped to weaken or even eliminate the vulnerability of the UHPC-concrete interface to normal tensile strength, which was susceptible to construction quality and material shrinkage deformation. And consequently, the strength of the strengthening interface was improved.
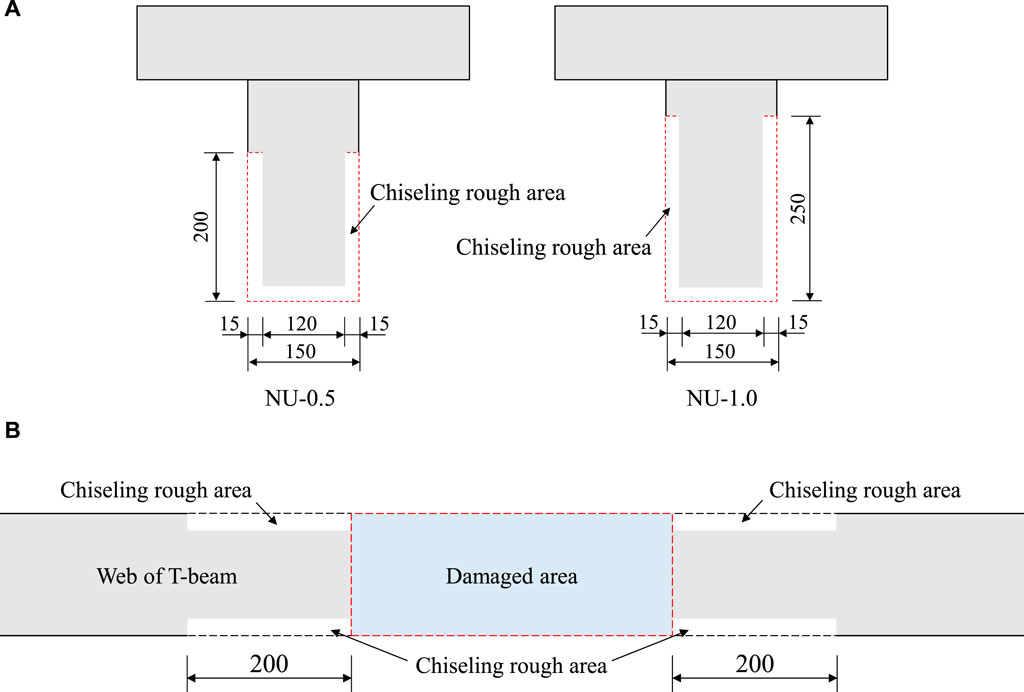
Figure 3. Chiseling rough scheme for reinforcing area (unit: mm). (A) Cross section of chiseling rough area (B) Layout of the web plate in the reinforcement area.
In this experiment, commercial concrete with a concrete grade of C50 was used. The average cubic compressive strength fcu, obtained from six 150 mm × 150 mm × 150 mm cubic specimens, was 51.0 MPa. The average axial compressive strength fc, measured from three 150 mm × 150 mm × 300 mm prismatic specimens, was 43.0 MPa. The elastic modulus Ec, determined from six prismatic specimens of the same dimensions, was 36.3 GPa. Rebars with diameters of 14 mm and 8 mm, both of grade HRB400, were used in the experiment. Material properties of the rebars, including elastic modulus E, average yield strength fy, average ultimate tensile strength fu, yield strain εy, and peak strain εu, were determined through tensile tests on three rebar coupons. Material properties of rebar are summarized in Table 2.
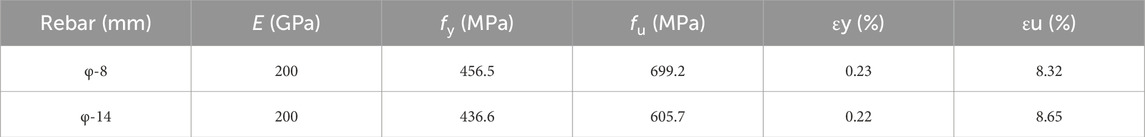
Table 2. Material properties of rebar.
Furthermore, UDC(II)-150 type UHPC pre-mixed material was adopted. Prior to conducting the experiment, the material properties of UHPC were evaluated in accordance with T/CCPA 7-2018 (T/CBMF 37, 2018). The tensile properties of UHPC, including cracking strain εt, peak strain εtu, and tensile strength ft, were determined through uniaxial tensile tests on six dog-bone coupons. Moreover, the elastic modulus and axial compressive strength of UHPC were measured using six cylindrical specimens with diameters of 100 mm and heights of 200 mm. The compressive strength of UHPC was evaluated through testing six 100 mm × 100 mm × 100 mm cubes. The material test results of UHPC are presented in Table 3.

Table 3. Material Properties of UHPC.
As depicted in Figure 4, four-point bending tests were conducted for all specimens. The distance between the loading points was 550 mm, and the distance between the support points was 3,400 mm. Consequently, the shear span ratio was 3.56. A hydraulic jack was used for loading, and the single-point concentrated load was transformed into two equal point loads using a distribution beam. The applied load was obtained through a load sensor under the jack. The loading process included two steps: pre-loading and formal loading. During the pre-loading, the load was applied to 0.6 times of the estimated cracking load and then unloaded. For the formal loading, at the early loading stages, load control was adopted. Before reaching the cracking load, the load was increased in an increment of 2.5 kN. After the cracking load reached, the increment was adjusted to 5.0 kN. Once the load-displacement curve exhibited a yield turning point, the loading control switched to displacement control. Until the load-displacement curve exhibited a significant yield segment or started to decline, the experiment was stopped. During each loading increment, the load was held for 5 min before colleting the test data. Meanwhile, the development of cracks was recorded and the width of these crack was also measured.
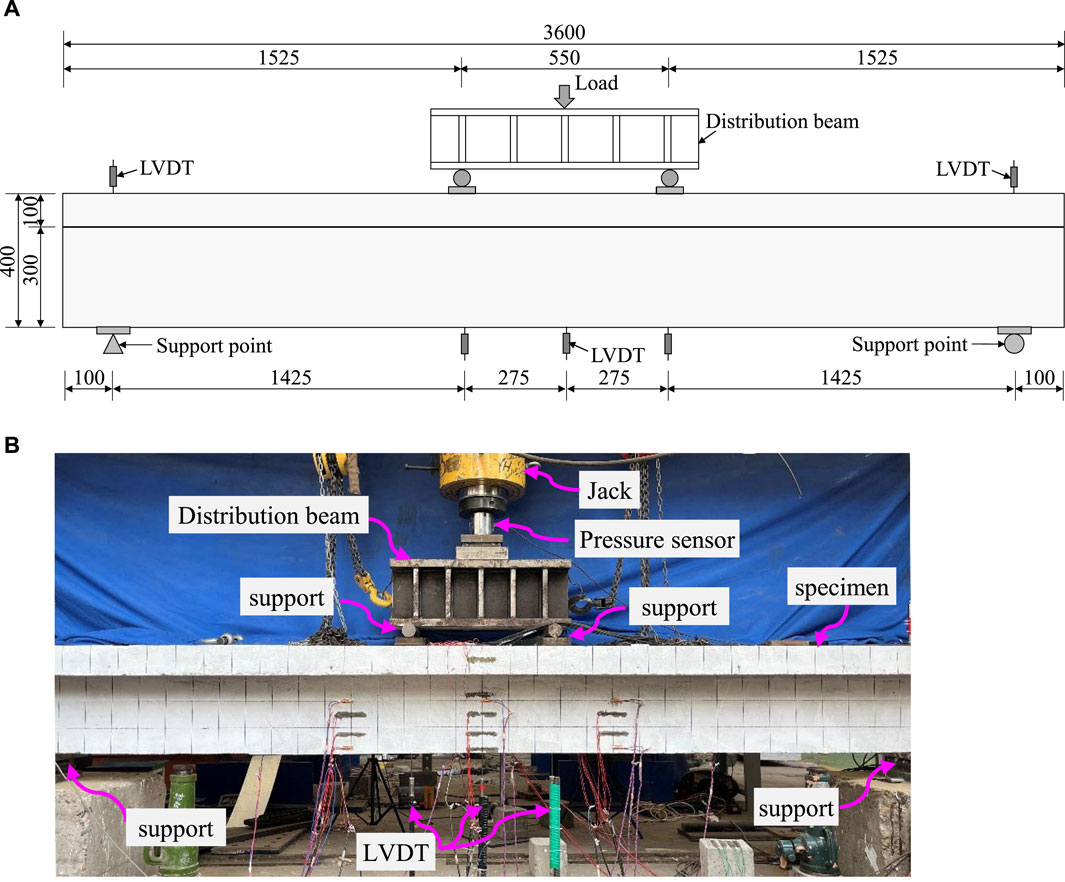
Figure 4. Loading scheme of T-beam specimen (unit: mm). (A) Arrangement of loading and displacement points (B) Experimental loading photographs.
As shown in Figure 5, three linear variable differential transformers (LVDTs) were arranged at the mid-span and two loading points to measure the vertical displacement of the specimen, while one dial gauge was set at each support to measure the settlement of the respective supports. Strain gauges were used to measure the strain of the rebar and concrete. The strain gauge arrangement for the tensile main steel bars is illustrated in Figure 5A, while the strain gauge arrangement for the mid-span section of the specimen is illustrated in Figure 5B.
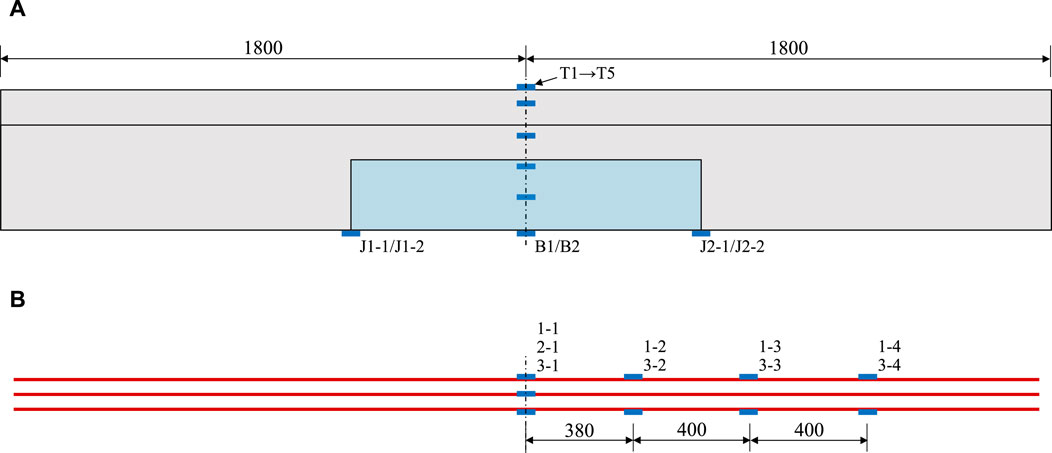
Figure 5. Arrangement of strain gauges of T-beam specimen (unit: mm). (A) Measurement points on the surface (B) Measurement points for rebars.
Figure 6 illustrates the failure modes of the reference specimen NC and the reinforced specimens NU-0.5 and NU-1.0. Apparently, none of the top flanges of the specimens experienced concrete crushing failure when the specimens reached their flexural capacity. This was attributed to the large compressive area of the top flange in the T-beam. When the load-displacement curves of the specimens exhibited a significant yield segment or started to decline, it was considered that the specimens reached their flexural capacities.
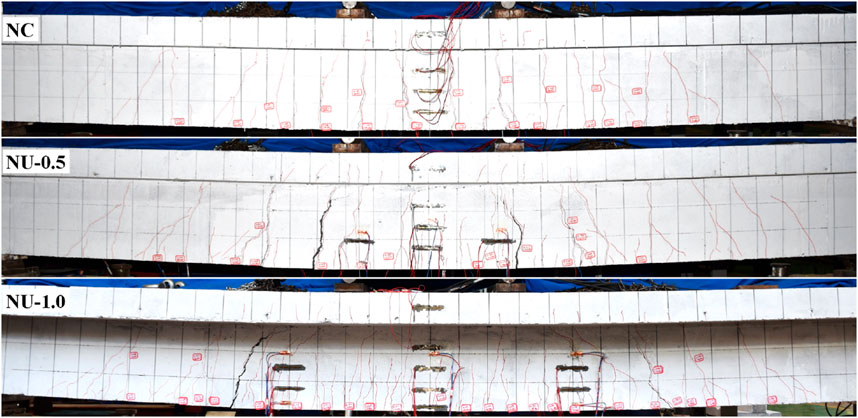
Figure 6. Failure modes of T-beam specimens.
A comparative analysis of the crack distributions of the specimens after failure revealed that the specimen NC exhibited extensive crack development. When it reached its flexural capacity, four wide primary cracks appeared in the section outside the two loading points of the specimen. Furthermore, some cracks extended upwards to the top flange, with the majority of these cracks being primarily distributed between the two loading points. In contrast, the specimens NU-0.5 and NU-1.0 exhibited only one wide primary crack when reaching their flexural capacities. These cracks occurred within the tangential shear interface between the UHPC filling and the existing concrete. Notably, the UHPC-reinforced region did not show significant wide cracks. Specifically, specimen NU-0.5 had fewer cracks in the reinforced region, while the NU-1.0 specimen showed well-developed cracks with larger widths in that area. The observed variation in crack width was related to the length of the damaged zone.
During the loading process, the development of crack width under various levels of applied load was measured using a crack observation instrument. The crack width development curves of the specimens were shown in Figure 7. According to the design code GB 50010-2010 (Code for Design of Concrete Structures, 2010), the maximum allowable crack width for reinforced concrete structures under various quasi-permanent load combinations in the serviceability limit state is 0.3 mm. From Figure 7, it can be observed that specimen NU-1.0, which had a longer UHPC filling region to bear the bending load, fully utilized the excellent tensile properties of the UHPC in the filling region. As a result, the load at which the crack width reached the 0.3 mm limit was higher for specimen NU-1.0 compared to specimen NC. Conversely, for specimen NU-0.5, the length of the UHPC filling region was smaller than the distance between the two loading points. Consequently, at lower load levels, the corresponding crack width of NU-0.5 exceeded that of specimen NC. However, at higher load levels or when the crack width reached the 0.3 mm limit, the applied load for specimens NU-0.5 and NC were similar. Therefore, for T-beams reinforced with UHPC filling, the chiseling method adopted in this study ensured that the interface strength between the UHPC and the existing concrete reached or even exceeded the strength of the concrete, thereby ensuring reliable force transfer at the interface.
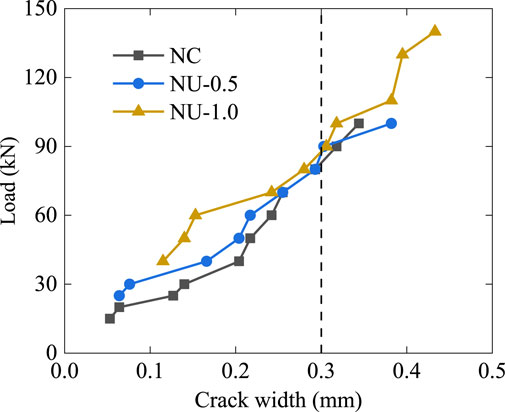
Figure 7. Crack width development law of T-beam specimens.
Figure 8 shows the load-displacement curves of the specimens. The flexural failure process of the specimens reinforced with UHPC filling was similar to that of the reference specimen NC. Both can be divided into three stages: elastic stage, cracking stage, and yielding failure stage, which was typical characteristics of flexural failure in reinforced concrete beams.
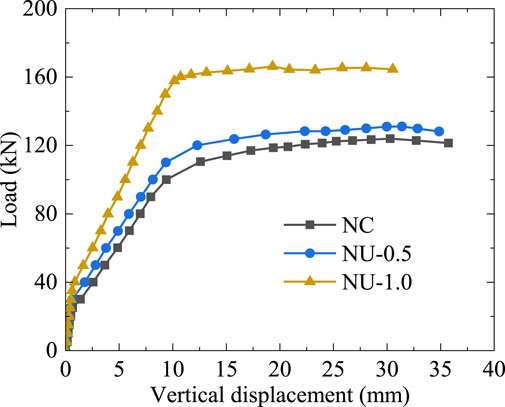
Figure 8. Load-displacement curves of specimens.
Table 4 summarizes bending test results of T beam specimens, including the loads and mid-span vertical displacements. The symbols used in the table are defined as follows: Fc denotes the cracking load, Fu denotes the ultimate load, and Δu denotes the mid-span vertical displacement corresponding to the ultimate load. ΔFc and ΔFu represent the increases in cracking load and ultimate load, respectively, for the reinforced specimens compared to the reference specimens. As shown in Table 4, the cracking loads of specimens NU-0.5 and NU-1.0 increased by 19.52% and 39.84%, respectively, compared to specimen NC. The ultimate loads of specimens NU-0.5 and NU-1.0 increased by 5.73% and 34.11%, respectively. The cracking load and ultimate load of specimen NU-1.0 were higher than those of specimen NU-0.5, with increases of 17.00% and 26.85%, respectively. The flexural stiffness of specimen NU-1.0 was significantly higher than that of specimen NC, while the flexural stiffness of specimen NU-0.5 was only slightly higher than that of specimen NC. This indicated that increasing the UHPC filling area enhanced the flexural capacity and stiffness of the T-beam specimens. In summary, increasing the filling area can significantly improve the flexural stiffness and capacity of damaged T-beams, while also enhancing the ductility of the damaged beams to some extent.
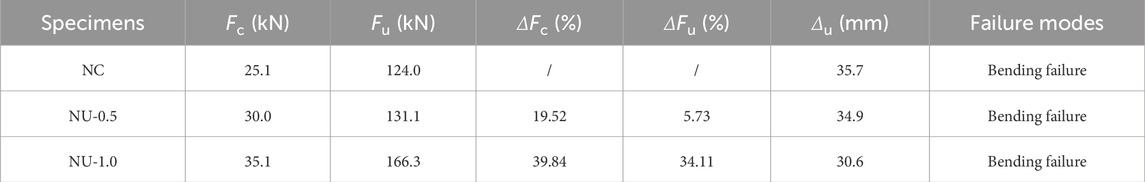
Table 4. Bending test results of T beam specimens.
Figure 9 shows the variation in midspan section strains along the height direction of reinforced specimens under different loading stages, where Fu represents the ultimate load of the reinforced specimens. During the loading process, the strain distribution along the height of the midspan section of the specimen approximately exhibited a linear pattern, indicating that the composite section formed by the filling of UHPC in the damaged region still adhered the assumption of the planar section composed of two different materials.
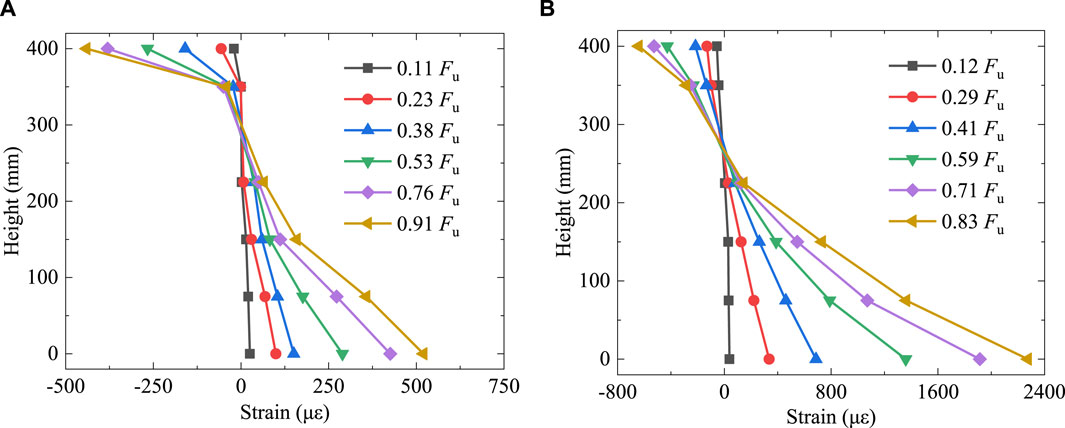
Figure 9. Strain distribution along the height of T-beam specimens at the midspan section. (A) NU-0.5 (B) NU-1.0.
Figure 10 presents the load-strain curves of the top flange at midspan section of the specimens. It can be observed that the compressive strain values of the concrete in the width direction of the top flange of the specimens were similar. This indicated that the shear-lag effect of the T-beam section was minimal, and thus, the top flange of the specimens can effectively participate in the overall bending resistance of the beam. A comparison of the specific strain values revealed that, except for reference specimen NC, the compressive strain values of the top flange at midspan section of the other two reinforced specimens did not exceed 1,000 με. This aligned with the pattern of no principal crack in the UHPC filling region of the reinforced specimens.
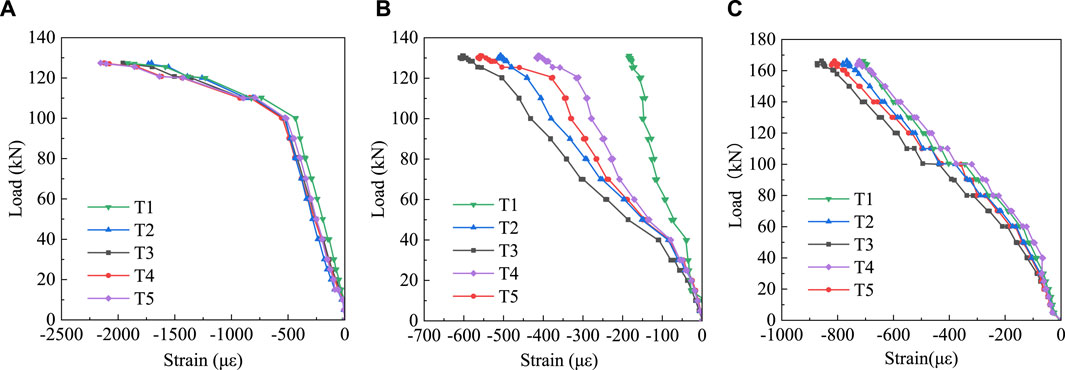
Figure 10. Load-strain curves of top flange of T-beam specimens. (A) NC (B) NU-0.5 (C) NU-1.0.
Figure 11 illustrates the load-strain curves at the bottom surface of UHPC for the reinforced specimens. It was found that both specimens NU-0.5 and NU-1.0 exhibited higher strain values at the interface between UHPC and the existing concrete, in the tensile direction. In contrast, the strain values at the mid-span section of the bottom surface were relatively smaller. This indicated that the primary cracks and the yielding of the tension steel reinforcement of the specimens both occurred near the interface between UHPC and the existing concrete. Compared to specimen NU-0.5, specimen NU-1.0 exhibited higher surface strain on the UHPC at the midspan section of the bottom of the beam. This indicated that a longer UHPC filling region contributed to the full utilization of the tensile performance of the UHPC. Conversely, a shorter UHPC reinforcement region hindered the utilization of tensile performance of the UHPC.
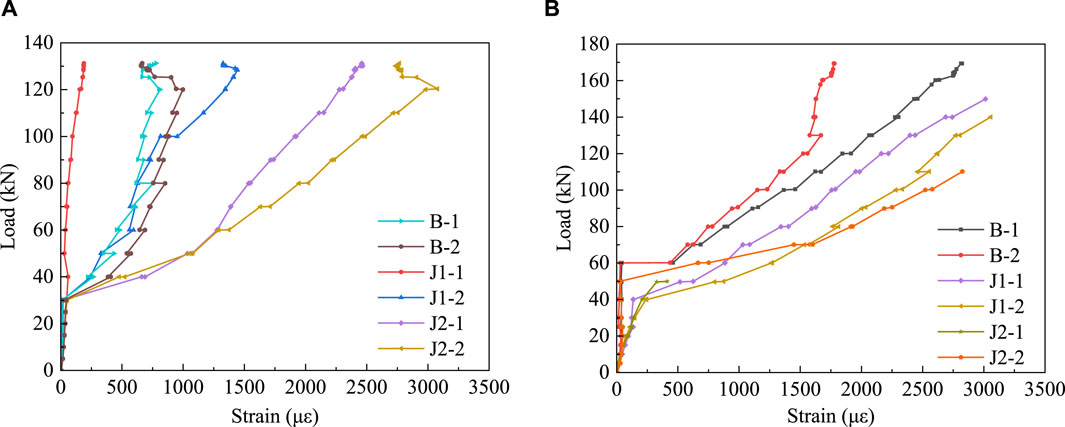
Figure 11. Load-strain curves of UHPC surface of T-beam specimens. (A) NU-0.5 (B) NU-1.0.
A FE model was developed using ABAQUS, as depicted in Figure 12. The model adopted C3D8R elements to simulate the T-beam, including normal concrete, loading and support blocks, and UHPC filling in the damaged region. The rebar skeleton was modelled using T3D2 elements. The loading and support blocks were tied to the T-beam, while rebar skeleton was embedded within the surrounding concrete or UHPC. To simulate the potential interface debonding between the UHPC filling and the existing concrete in the damaged region, a surface-to-surface contact approach was employed, and the contact constraint effectively captured the debonding phenomenon. The FE was established with simply supported boundary conditions, mirroring the experimental setup. During the analysis, vertical displacement loads were applied to the reference points located above the mid-span section of the specimen.
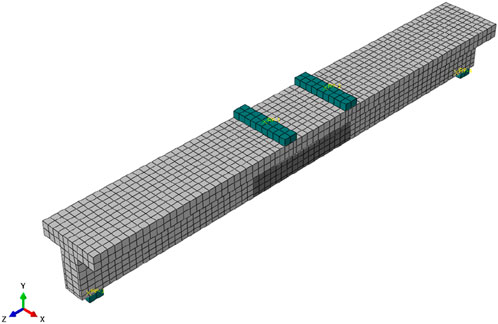
Figure 12. Finite element model.
The concrete constitutive model was defined using the Concrete Damage Plasticity (CDP) model within ABAQUS, with stress, strain, and damage parameters of concrete referenced from GB50010-2010 (GB 50010, 2010). There are various models, such as the elastoplastic model, bilinear model (Men et al., 2022; Men et al., 2023a), and trilinear model (Men et al., 2023b), used to simulate the stress-strain behaviour of steel. In this study, the rebars and steel blocks were modelled using an ideal elastoplastic constitutive model. The constitutive models for concrete and steel are illustrated in Figure 13.
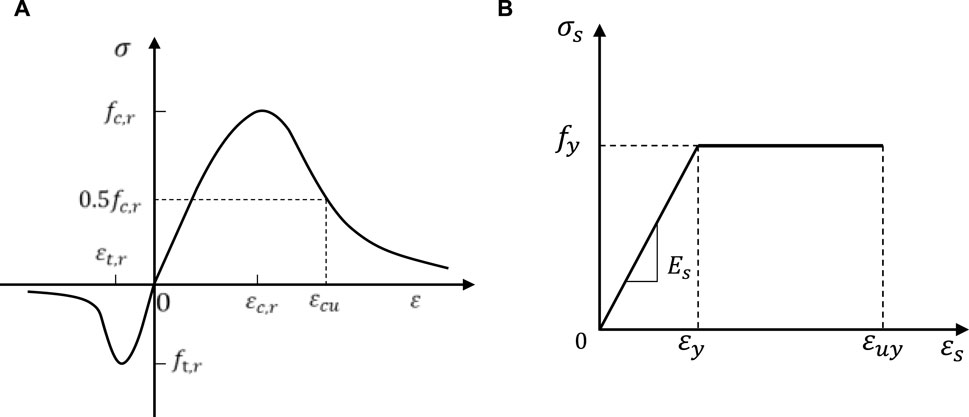
Figure 13. Constitutive models for concrete and steel. (A) Concrete (B) Steel.
After experiencing tensile cracking, UHPC does not immediately lose its load-bearing capacity. Its uniaxial tensile stress-strain curve exhibits a strain-hardening stage after reaching the peak tensile strength. In this study, the constitutive model for UHPC was defined using the CDP model in ABAQUS. The compressive and tensile constitutive models for UHPC, as shown in Figure 14, were defined based on the references (Hussein et al., 2017; Sargand et al., 2017). The specific constitutive equations were determined by Eqs 1, 2, with all material parameters obtained from the material properties tests.
where, x represents the ratio of compressive strain to peak compressive strain of UHPC; σc denotes the peak compressive strength of UHPC; y represents the compressive stress of UHPC; A denotes the ratio of the tangent modulus at the origin to the secant modulus at the peak point of the compressive constitutive curve, with a value of 1.05 in this paper; σt and εt are the tensile stress and strain of UHPC, respectively; fct denotes the peak tensile strength of UHPC; εca is the initial cracking strain of UHPC; and εcp is the ultimate strain of UHPC.
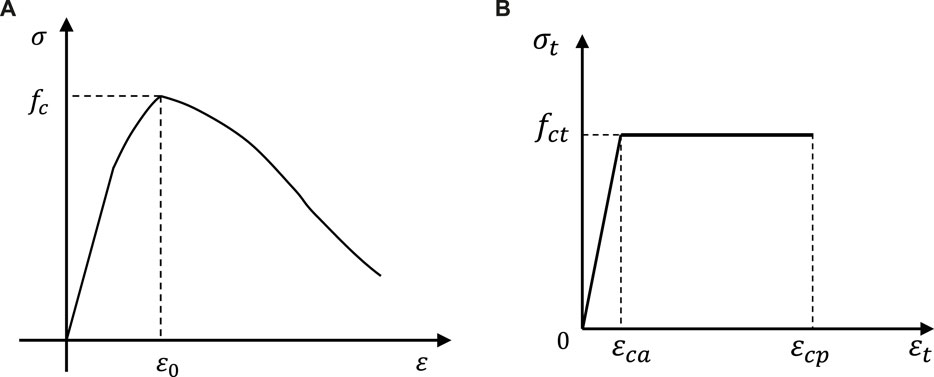
Figure 14. Constitutive model of UHPC. (A) Compressive stress-strain curve (B) Tensile stress-strain curve.
When simulating the loading conditions of reinforced specimens, it is important to consider the interface behaviour between new and existing materials. In this study, a surface-based cohesive behaviour model in ABAQUS was employed to simulate the bonding behaviour between UHPC and the existing beam. The surface-to-surface contact was used to constrain the UHPC-NC interface, incorporating the corresponding cohesive behavior and damage criterion. Based on the references (Hussein et al., 2017; Sargand et al., 2017), the maximum contact stress before damage at the interface was determined through calculations, resulting in a maximum value of 4.00 MPa, with a corresponding relative displacement of 0.068 mm.
Figure 15 presents a comparison load-displacement curves between the finite element analysis (FEA) and experiments. It can be observed that the simulated load-displacement curves of the three specimens generally follow the same trend as the experimental results. The simulated flexural stiffness after cracking but before yielding was slightly higher that the measured flexural stiffness, which can be attributed to the simplifications of the UHPC constitutive model in the FE model. It should be noted that the focus of this section was primarily on the ultimate load of the specimens. As indicated in Table 5, the deviations between the simulated and experimental values for the ultimate loads of specimens NC, NU-0.5, and NU-1.0 were −4.52%, 1.75%, and −1.38%, respectively. This demonstrated that the FEA method employed in this study effectively predicted the ultimate load of the tested beams.
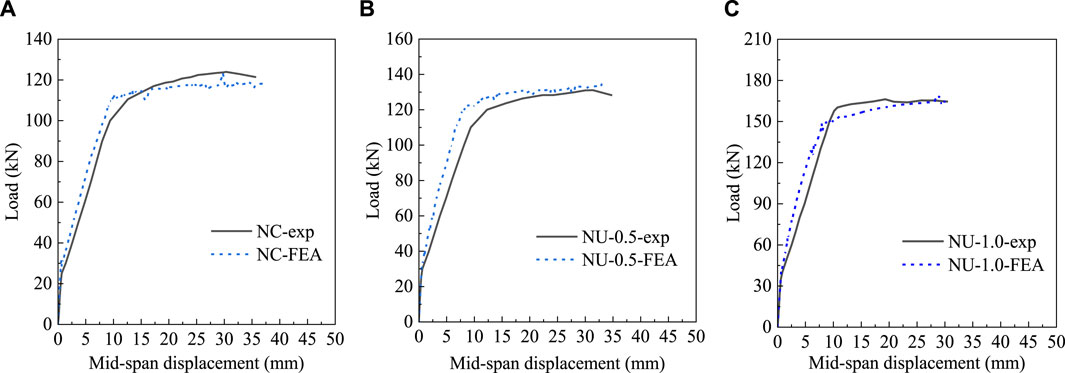
Figure 15. Comparison of load-displacement curves between FEA and experiment. (A) NC (B) NU-0.5 (C) NU-1.0.
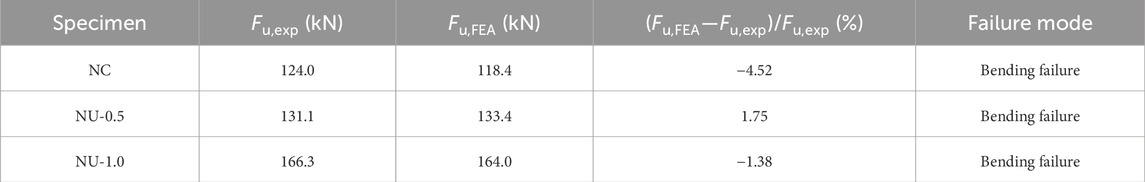
Table 5. Comparison of ultimate loads between FEA and experiment.
Furthermore, the FE model was capable of simulating the crack development of the test beams. Taking the NU-0.5 specimen as an example, Figure 16 compares the crack propagation and failure modes between the FEA and experiment. It can be observed that during the loading process of specimen NU-0.5, there was no occurrence of debonding at the interface between the UHPC and the existing concrete. By considering both the load-displacement curve and the simulated failure process, it can be concluded that the FEA employed in this study accurately simulated the flexural performance of the reinforced concrete T-beams strengthened with UHPC filling.
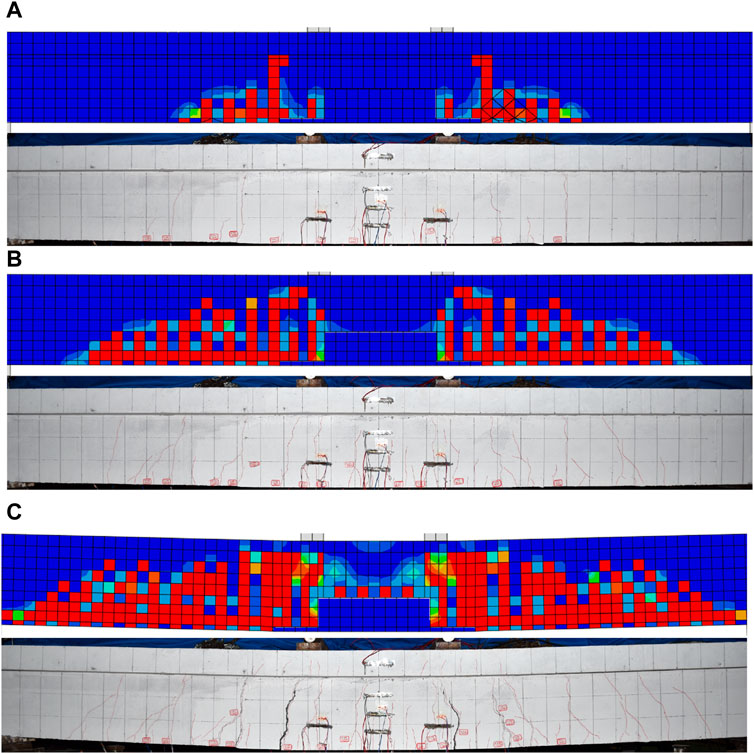
Figure 16. Comparison of failure modes between FEA and experiment for specimen NU-0.5. (A) 0.3 Pn (B) 0.7 Pn (C) Pn.
To further understand the failure modes of the specimens, Figure 17 provides the distribution of rebar stresses when specimens NC, NU-0.5, and NU-1.0 reached their flexural ultimate loads. It can be observed that all three specimens experienced flexural failure due to yielding of the tension rebars. Due to the higher tensile strength and elastic modulus of UHPC compared to normal concrete, the yielding zones of the tensile rebars varied among the three specimens. As only normal concrete was used for specimen NC, the crack distribution was uniform, and the yielding zones of the tension rebars occurred between the loading points and in localized areas outside the loading points. In contrast, for specimens NU-0.5 and NU-1.0, as UHPC-filled region exhibited higher stiffness and strength than the existing concrete, the yielding zones of the tension rebars were closer to the interface between UHPC and the existing concrete. The stress level of the tension rebars in the UHPC filling region was relatively low. Further comparison of the distribution of stirrup stress revealed that since the flexural cracks in the NC specimen fully developed across the entire span, the stresses of the stirrups were minimal. However, for specimens NU-0.5 and NU-1.0, the limited cracking in the UHPC-filled region caused higher stresses on the stirrups in the shear span. This indicates that when filling damaged concrete beams with UHPC to reinforce them, it is necessary to assess the risk of shear failure in the reinforced beam.

Figure 17. Von Mises stresses distribution of rebars of T-beam specimens.
Figure 18 illustrates the relative positions of the main cracks, UHPC-filled area, and chiseling rough area in specimens NU-0.5 and NU-1.0. The purple dashed box represents the UHPC-filled area, and the positions of the two short sides of the purple box correspond to the interface between the UHPC and the existing concrete. The region between the red dashed box and the purple dashed box represents the chiseling rough area of the existing beam.
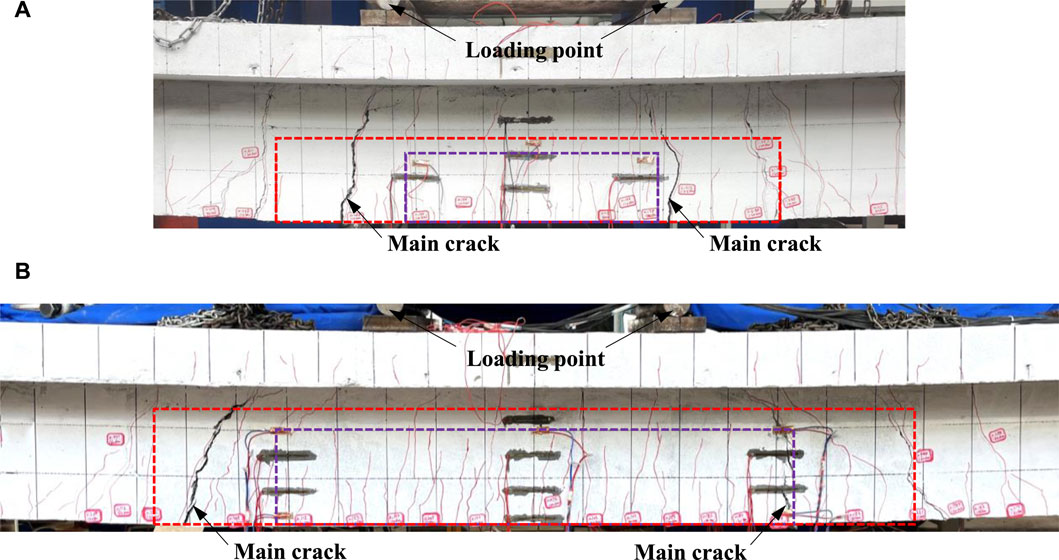
Figure 18. Local cracking behaviour of UHPC-reinforced specimens. (A) NU-0.5 (B) NU-1.0.
From Figure 18A, it can be observed that the length of the UHPC-filled area of specimen NU-0.5 was smaller than the distance between the two loading points. The interface between the UHPC and the existing concrete was always located in the region of maximum bending moment. To address this, the interface treatment scheme shown in Figure 19 was adopted, which converted a portion of the normal tension reinforcing interface into the tangential shear reinforcing interface. With an increase in the load, the shear interface between the UHPC and the existing concrete in specimen NU-0.5 did not experience shear failure. However, defects in the tension interface were continuously exposed, and the thin U-shaped UHPC layer in the chiseling rough area gradually fractured. Ultimately, the tension interface between the UHPC and the existing concrete separated, and the main rebars near the tension interface yielded. The failure zone of specimen NU-0.5 was limited to the vicinity of the tension interface between the two loading points. This also explained why the ultimate load of the specimen NU-0.5 was not significantly different from that of the reference specimen NC. The UHPC in the reinforced area continued to work together with the rebars even after cracking, resulting in a stiffness greater than the post-cracking stiffness of the tension interface cross-section. The overall bending deformation of the specimen was equivalent to the bending of the low-stiffness beam segment on the outer side of the tension interface, driving the bending of the high-stiffness beam segment on the inner side of the tension interface. The deformation of the high-stiffness beam segment on the inner sider was relatively small. Based on the assumption of the plane section, it can be inferred that the compressive strain level of the top flange at the mid-span section of the specimen was not high, which was consistent with the strain levels measured in the experiment.
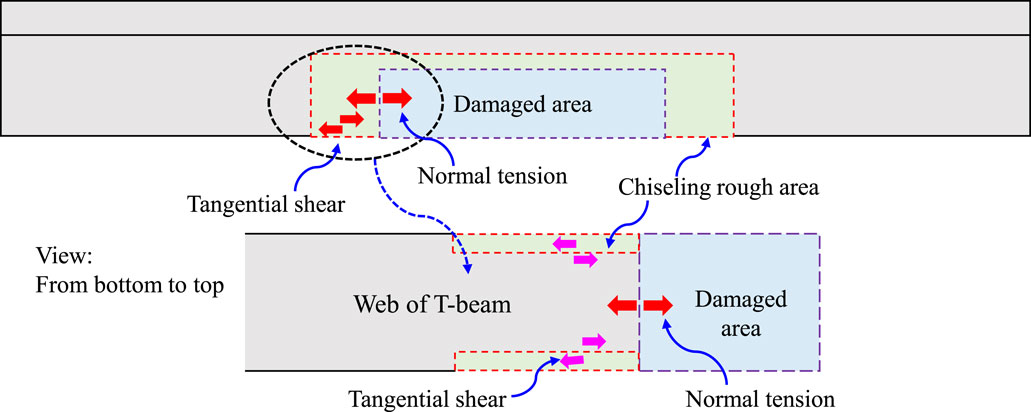
Figure 19. Stress mechanism of reinforced region interface.
As indicated in Figure 18B, the length of the UHPC-filled area of specimen NU-1.0 exceeded the distance between the two loading points. The tension interface between the UHPC and the existing concrete of the NU-1.0 specimen was located in a region with a relatively low bending moment. This allowed the tension interface between the UHPC and the existing concrete to bear higher loads without premature separation. Due to the significantly higher tensile strength of UHPC compared to normal concrete, the failure of specimen NU-1.0 also occurred at the tension interface between the UHPC and the existing concrete. The failure process resembled that of the NU-0.5 specimen, where the U-shaped UHPC layer in the chiseling rough area experienced tension-induced fracture, leading to the separation of the tension interface and yielding of the main rebars near the interface. The extended reinforced area of specimen NU-1.0 enabled the UHPC-filled region to bear a larger bending moment. Compared to specimen NU-0.5, specimen NU-1.0 exhibited a higher number of cracks within the reinforced area, with more extensive vertical propagation of these cracks. As the flexural stiffness of the reinforced area was higher than that of the unreinforced area, the local bending deformation in the reinforced area was not significant. Consequently, the compressive strain in the concrete on the top flange of the mid-span section of the specimen remained relatively small, and the cracks in the top flange primarily distributed in the unreinforced region outside the two loading points region.
This study investigates the flexural performance of damaged reinforced concrete T-beams reinforced with UHPC filling through experiments and nonlinear FEA. The following key conclusions are drawn:
(1) The method of filling UHPC in the damaged region of the reinforced concrete T-beams effectively restored or enhanced the flexural stiffness, cracking load, and ultimate load of the damaged beams. Compared to the unreinforced specimen NC, the cracking load of the reinforced specimens NU-0.5 and NU-1.0 increased by 19.52% and 39.84%, and the ultimate load increased by 5.73% and 34.11%, respectively.
(2) By implementing chiseling rough area treatment around the UHPC-reinforced region, a portion of the tension interface between UHPC and the existing concrete was transformed into a shear interface between UHPC and the chiseled area. This approach restricted the tendency of separation at the tension interface, thereby increasing the cracking load. The reinforced specimens exhibited smaller surface crack widths compared to the reference specimen before reaching the yield turning point on the load-displacement curve.
(3) A nonlinear FE model of the T-beam was developed using ABAQUS, considering the tensile hardening behaviour of UHPC and employing a cohesive zone model to simulate the bond behaviour between UHPC and the existing concrete. Through comparison with experimental load-displacement curves, ultimate loads, and failure modes, the FE model was validated to accurately simulate the flexural performance of T-beams reinforced with UHPC filling.
The original contributions presented in the study are included in the article/Supplementary material, further inquiries can be directed to the corresponding author.
SH: Writing–original draft, Resources, Investigation. YX: Writing–review and editing, Validation, Resources, Investigation. XL: Writing–review and editing, Validation, Investigation. PM: Writing–review and editing, Writing–original draft, Software, Methodology, Investigation, Conceptualization. GW: Writing–review and editing, Validation, Investigation.
The author(s) declare that no financial support was received for the research, authorship, and/or publication of this article.
The authors express their sincere gratitude for the financial support provided by Research project of Shanxi Transportation New Technology Development Co., Ltd. (21-XJSKJ-1), and Science and Technology Research and Development Project of CSCEC Xinjiang Construction and Engineering (group) Co., Ltd. (65000022859700230167).
Author SH was employed by Shanxi Transportation New Technology Development Co., Ltd. Author YX was employed by China Communications 2nd Navigational Bureau 2nd Engineering Co., Ltd. Authors XL and GW were employed by CSCEC Xinjiang Construction and Engineering (group) Co., Ltd. Southwest Company.
The handling editor ZZ is currently organizing a Research Topic with the author PM.
The remaining author declares that the research was conducted in the absence of any commercial or financial relationships that could be construed as a potential conflict of interest.
All claims expressed in this article are solely those of the authors and do not necessarily represent those of their affiliated organizations, or those of the publisher, the editors and the reviewers. Any product that may be evaluated in this article, or claim that may be made by its manufacturer, is not guaranteed or endorsed by the publisher.
Al-Osta, M. A., Isa, M. N., Baluch, M. H., and Rahman, M. K. (2017). Flexural behavior of reinforced concrete beams strengthened with ultra-high performance fiber reinforced concrete. Constr. Build. Mater. 134, 279–296. doi:10.1016/j.conbuildmat.2016.12.094
Di, J., Sun, Y., Yu, K., Liu, L., and Qin, F. (2020). Experimental investigation of shear performance of existing PC hollow slab. Eng. Struct. 211, 110451. doi:10.1016/j.engstruct.2020.110451
Ganesh, P., and Murthy, A. R. (2021). Static and fatigue responses of retrofitted RC beams with GGBS based UHPC strips. Eng. Struct. 240, 112332. doi:10.1016/j.engstruct.2021.112332
GB 50010 (2010) Code for design of concrete structures. China: Ministry of Housing and Urban-Rural Development of the People's Republic of China.
Hussein, H. H., Walsh, K. K., Sargand, S. M., Al Rikabi, F. T., and Steinberg, E. P. (2017). Modeling the shear connection in adjacent box-beam bridges with ultrahigh-performance concrete joints. I: model calibration and validation. J. Bridge Eng. 22 (8), 04017043. doi:10.1061/(ASCE)BE.1943-5592.0001070
Leng, J., Yang, J., Zhang, Z., Du, J., Zou, Y., and Zhou, J. (2024). Effect of vehicle-induced vibration on the strength, nano-mechanical properties, and microstructural characteristics of ultra-high-performance concrete during hardening process. Cem. Concr. Compos. 148, 105487. doi:10.1016/j.cemconcomp.2024.105487
Liu, D., Yu, J., Qin, F., Zhang, K., and Zhang, Z. (2023). Mechanical performance of high-strength engineering cementitious composites (ECC) with hybriding PE and steel fibers. Case Stud. Constr. Mat. 18, e01961. doi:10.1016/j.cscm.2023.e01961
Men, P., Di, J., Qin, F., and Su, Y. (2023a). Experimental investigation of the shear behavior of slender continuous steel–concrete composite girders in hogging moment. J. Struct. Eng-ASCE 149 (1), 04022218. doi:10.1061/JSENDH.STENG-11537
Men, P., Liang, B., He, W., Di, J., Qin, F., and Zhang, Z. (2023b). Vertical shear resistance of noncompact steel–concrete composite girders under combined positive moment and shear. Case Stud. Constr. Mat. 18, e01835. doi:10.1016/j.cscm.2023.e01835
Men, P., Wang, X. M., Liu, D., Zhang, Z., Zhang, Q., and Lu, Y. (2024). On use of polyvinylpyrrolidone to modify polyethylene fibers for improving tensile properties of high strength ECC. Constr. Build. Mater. 417, 135354. doi:10.1016/j.conbuildmat.2024.135354
Men, P., Zhou, X., Ye, J., Di, J., and Qin, F. (2022). Shear capacity investigation of steel-concrete composite girders in hogging moment regions. J. Constr. Steel Res. 194, 107341. doi:10.1016/j.jcsr.2022.107341
Ngidi, S. D., and Dundu, M. (2018). Composite action of pre-cracked reinforced concrete beams repaired with adhesive bonded steel plates. Structures 14, 400–408. doi:10.1016/j.istruc.2018.04.005
Paschalis, S. A., Lampropoulos, A. P., and Tsioulou, O. (2018). Experimental and numerical study of the performance of ultra high performance fiber reinforced concrete for the flexural strengthening of full scale reinforced concrete members. Constr. Build. Mater. 186, 351–366. doi:10.1016/j.conbuildmat.2018.07.123
Qin, F., Zhang, Z., Yin, Z., Di, J., Xu, L., and Xu, X. (2020). Use of high strength, high ductility engineered cementitious composites (ECC) to enhance the flexural performance of reinforced concrete beams. J. Build. Eng. 32, 101746. doi:10.1016/j.jobe.2020.101746
Safdar, M., Matsumoto, T., and Kakuma, K. (2016). Flexural behavior of reinforced concrete beams repaired with ultra-high performance fiber reinforced concrete (UHPFRC). Compos. Struct. 157, 448–460. doi:10.1016/j.compstruct.2016.09.010
Sargand, S. M., Walsh, K. K., Hussein, H. H., Al Rikabi, F. T., and Steinberg, E. P. (2017). Modeling the shear connection in adjacent box-beam bridges with ultrahigh-performance concrete joints. II: load transfer mechanism. J. Bridge Eng. 22 (8), 04017044. doi:10.1061/(ASCE)BE.1943-5592.0001071
T/CBMF 37 (2018) Fundamental characteristics and test methods of ultra-high performance concrete. China: China Building Materials Federation.
Xu, L., Lu, X., Guan, H., and Zhang, Y. (2013). Finite-element and simplified models for collision simulation between overheight trucks and bridge superstructures. J. Bridge Eng. 18 (11), 1140–1151. doi:10.1061/(ASCE)BE.1943-5592.0000472
Xu, L. J., Lu, X. Z., Smith, S. T., and He, S. T. (2012). Scaled model test for collision between over-height truck and bridge superstructure. Int. J. Impact Eng. 49, 31–42. doi:10.1016/j.ijimpeng.2012.05.003
Yin, H., Teo, W., and Shirai, K. (2017). Experimental investigation on the behaviour of reinforced concrete slabs strengthened with ultra-high performance concrete. Constr. Build. Mater. 155, 463–474. doi:10.1016/j.conbuildmat.2017.08.077
Zhang, Y., Huang, S., Liu, Y., Fan, W., and Shao, X. (2023). Flexural behavior of damaged RC beams strengthened with prestressed UHPC layer. Eng. Struct. 283, 115806. doi:10.1016/j.engstruct.2023.115806
Zhang, Y., Li, X., Zhu, Y., and Shao, X. (2020c). Experimental study on flexural behavior of damaged reinforced concrete (RC) beam strengthened by toughness-improved ultra-high performance concrete (UHPC) layer. Compos. Part B-Eng. 186, 107834. doi:10.1016/j.compositesb.2020.107834
Zhang, Y., Zhang, C., Zhu, Y., Cao, J., and Shao, X. (2020a). An experimental study: various influence factors affecting interfacial shear performance of UHPC-NSC. Constr. Build. Mater. 236, 117480. doi:10.1016/j.conbuildmat.2019.117480
Zhang, Y., Zhu, P., Wang, X., and Wu, J. (2020b). Shear properties of the interface between ultra-high performance concrete and normal strength concrete. Constr. Build. Mater. 248, 118455. doi:10.1016/j.conbuildmat.2020.118455
Zhang, Z., Li, Z., He, J., and Shi, X. (2023b). High-strength engineered cementitious composites with nanosilica incorporated: mechanical performance and autogenous self-healing behavior. Cem. Concr. Compos. 135, 104837. doi:10.1016/j.cemconcomp.2022.104837
Zhang, Z., Liu, J. C., Li, J., Qin, F., and Di, J. (2023a). Micromechanics-based analysis of PVA–ECC after thermal exposure. Arch. Civ. Mech. Eng. 23 (3), 213. doi:10.1007/s43452-023-00736-1
Zhu, Y., Zhang, Y., Hussein, H. H., and Chen, G. (2020). Flexural strengthening of reinforced concrete beams or slabs using ultra-high performance concrete (UHPC): a state of the art review. Eng. Struct. 205, 110035. doi:10.1016/j.engstruct.2019.110035
Zou, Y., Jiang, J., Yang, J., Zhang, Z., and Guo, J. (2023a). Enhancing the toughness of bonding interface in steel-UHPC composite structure through fiber bridging. Cem. Concr. Compos. 137, 104947. doi:10.1016/j.cemconcomp.2023.104947
Keywords: damaged reinforced concrete T-beam, reinforcement by ultra-high performance concrete (UHPC) filling, flexural performance, experiments, finite element model
Citation: Huang S, Xi Y, Li X, Men P and Wu G (2024) Flexural behaviour of damaged concrete T-beams reinforced with ultra-high performance concrete filling. Front. Mater. 11:1410016. doi: 10.3389/fmats.2024.1410016
Received: 31 March 2024; Accepted: 14 May 2024;
Published: 10 June 2024.
Edited by:
Zhigang Zhang, Chongqing University, ChinaReviewed by:
Shaorui Wang, Chongqing Jiaotong University, ChinaCopyright © 2024 Huang, Xi, Li, Men and Wu. This is an open-access article distributed under the terms of the Creative Commons Attribution License (CC BY). The use, distribution or reproduction in other forums is permitted, provided the original author(s) and the copyright owner(s) are credited and that the original publication in this journal is cited, in accordance with accepted academic practice. No use, distribution or reproduction is permitted which does not comply with these terms.
*Correspondence: Pengfei Men, bWVucGVuZ2ZlaTE4NTgxMUAxNjMuY29t
Disclaimer: All claims expressed in this article are solely those of the authors and do not necessarily represent those of their affiliated organizations, or those of the publisher, the editors and the reviewers. Any product that may be evaluated in this article or claim that may be made by its manufacturer is not guaranteed or endorsed by the publisher.
Research integrity at Frontiers
Learn more about the work of our research integrity team to safeguard the quality of each article we publish.