 Zhen Wang
 Jian Zhang2
- 1Urban Rail Research Institute, Shandong Polytechnic, Jinan, China
- 2Key Laboratory of Conveyance and Equipment Ministry of Education, East China Jiaotong University, Nanchang, China
- 3College of Locomotive and Rolling Stock Engineering, Dalian Jiaotong University, Dalian, China
To utilise laser deposition for the preparation of high-strength, wear-resistant components, the service life of components in rail transportation equipment should be improved. Laser deposition technology is used to fabricate Fe‒Ni‒Ti coatings on the surface of AISI 1045 steel substrates. By varying the laser power to adjust the laser energy density, Fe‒Ni‒Ti composite coatings are prepared at various energy densities. The morphology, microstructure, phase composition, tensile strength, microhardness, and friction-wear characteristics of the composite coatings are observed and tested. The influence patterns and mechanisms of laser energy density on the organisational variation and friction-wear performance of composite coatings is investigated. When the laser energy density is 97.2 J/mm2 (1400 W), the residual stresses in the deposition layer are minimised, resulting in fewer cracks and gas pore defects, with a porosity rate reaching its lowest value of 1.2% and a density of 99.1%. With the increase in energy density, both the tensile strength and elongation of the deposited layer exhibited an initial increase followed by a decrease. The hardness and wear resistance of Fe‒Ni‒Ti deposition layers is effectively controlled by regulating the laser energy density.
1 Introduction
Laser deposition technology is a novel additive manufacturing technique. This technique utilises a high-energy laser beam to melt metal materials, forming a liquid pool. Simultaneously, deposition powder is conveyed to the pool through a powder delivery system, thereby directly melting the deposition powder into a coating (Glukhov et al., 2016; Arif et al., 2022). Parts produced by laser deposition technology exhibit excellent metallurgical bonding, dense structures, and outstanding performance (Wang Q. et al., 2023; Di et al., 2023). Researchers have found extensive applications in the surface strengthening of components in railway transportation equipment and other fields (Clare et al., 2012; Mortazavian et al., 2022).
Due to the physical differences between the laser deposition material and the substrate material, under the combined effect of rapid heating by high-energy laser beams and rapid cooling of the deposition layer, significant residual stresses are generated in the deposition layer, leading to the formation of cracks and voids (Yu et al., 2013). Low-expansion materials exhibit excellent thermal stability with low coefficients of thermal expansion, enabling them to maintain stable dimensions under various temperature environments. This characteristic enables them to effectively reduce the thermal expansion difference between the cladding layer and the substrate material during laser deposition, thereby minimising thermal stress (Shiga, 1996; Vinogradov et al., 2003; Zhan et al., 2019). Invar alloy is a typical low-expansion material, and Fe‒Ni‒Ti powder is a deposition material designed utilising the low-expansion property of Invar alloy. Laser-deposited Fe‒Ni‒Ti coatings can be prepared with fewer crack defects, resulting in high-strength and wear-resistant components. Yongjian et al. repaired deep pits in ductile iron using laser cladding with NiCu/Fe-36Ni low-expansion alloy coatings, effectively controlling crack formation (Li et al., 2019). In previous studies, the authors conducted laser cladding research on Fe‒Ni‒Ti, achieving cladding layers with fewer defects.
The quality of laser deposition coatings is not only closely related to the deposition materials but also significantly influenced by the deposition process parameters (Lei et al., 2019). The laser energy density affects the energy transferred from the laser beam to the material, exerting a substantial impact on the microstructure and performance of the deposition layer (Wang, 2024). For instance, J.H. Yi et al. investigated the influence of laser energy density on the microstructure, performance, and distortion of Inconel 718 samples prepared through selective laser melting. They found that at 0.2 J/mm, parts with minimal porosity and optimal mechanical performance could be produced (Yi et al., 2019).
AISI 1045 steel demonstrates favourable overall performance and low cost, rendering it suitable as a substrate for laser deposition (Huang et al., 2018). This paper describes the laser deposition of Fe‒Ni‒Ti coatings on the surface of grade AISI 1045 steel. The impact of the laser energy density on the microstructure, properties, and enhancement mechanism of the deposited layer is investigated by controlling the laser power.
2 Materials and methods for the experiment
2.1 Experimental materials
The substrate material for this experiment is quenched and tempered AISI 1045 steel with dimensions of 50 mm × 50 mm × 15 mm. Prior to the experiment, the substrate material underwent grinding and matte treatment to reduce reflection and maximise energy absorption. In previous studies, the authors determined the optimal mass fractions of Fe‒Ni‒Ti cladding powders, as shown in Table 1.
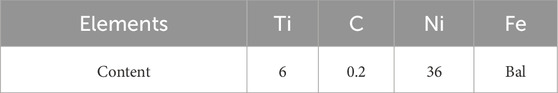
Table 1. Composition and content of laser deposition materials (wt%).
The prepared deposition powder undergoes ethanol-protected ball milling in an XQM-2 L vertical planetary ball mill using agate grinding balls with diameters of 6, 10, and 20 mm. Among them, large balls constitute 20% of the total weight, medium balls 40%, and small balls 40%. The ball milling duration is 12 h, the grinding ball-to-deposition material ratio is 3:1, and the milling speed is 250 r/min. The particle size distribution of the milled cladding powder is tested using a laser particle size analyser; the results are shown in Figure 1. The surface density of the melted powder after ball milling measured by the porosity tester is 3.32 g/cm3, and the internal porosity is 15%. The flowability of the cladding powder is tested using a powder feeder (BTSF-2). The feeding accuracy is 99.3%, indicating the excellent flowability of the cladding powder.
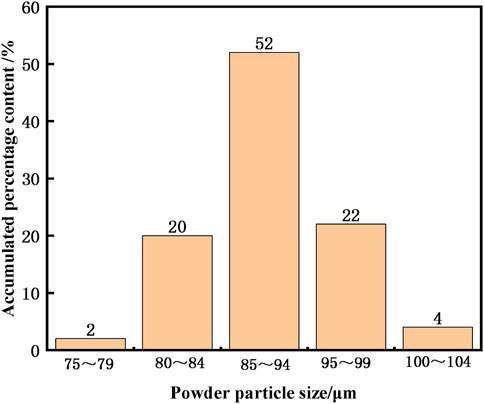
Figure 1. Particle size distribution of the laser cladding Fe‒Ni‒Ti powder.
2.2 Laser deposition additive manufacturing process for Fe‒Ni‒Ti coatings
The experimental setup utilises an LDM2500-60 semiconductor laser for laser deposition, accompanied by a BTSF-2 coaxial powder feeder, with Ar gas protection during the deposition process. The deposition path is controlled by the numerical control system of the laser processing machine. Single-track, single-layer laser deposition experiments are conducted on the surface of grade AISI 1045 steel using coaxial powder feeding. The experimental process parameters are listed in Table 2. The working principle of laser deposition is shown in Figure 2.
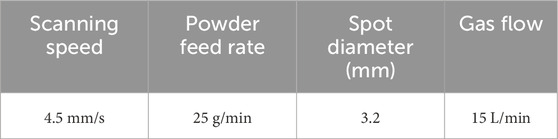
Table 2. Laser deposition parameters.
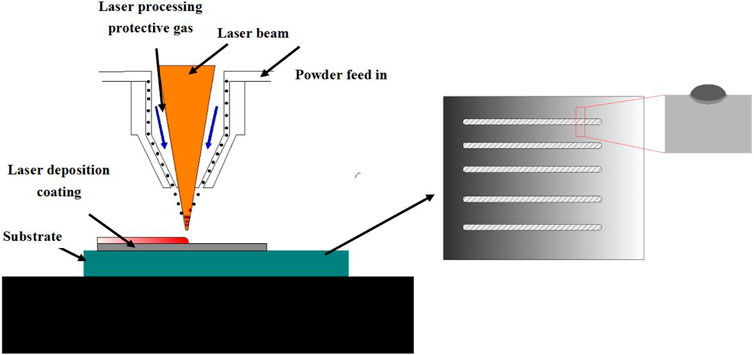
Figure 2. Schematic diagram of the laser deposition working principle.
The laser energy density can be more clearly expressed as the thermal input per unit area, defined by Eq. 1 as follows:
where ρ represents the laser energy density (W/mm2); P represents the laser power (W); A denotes the clad area (mm2); V represents the scanning speed (mm/min); and B represents the scanning width (mm). The calculation according to Eq. 1 yields the laser power and corresponding energy density, as presented in Table 3.
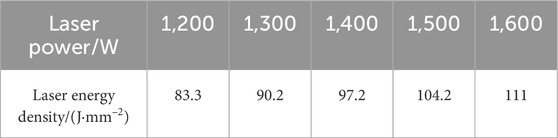
Table 3. Table of correspondence between laser power and energy density.
2.3 Microstructure characterisation and performance testing
The laser-deposited samples are cut into specimens measuring 5 mm × 4 mm × 4 mm using a metallographic cutting machine (DK733-A). The surface of the deposited coating is cleaned, and the cross section is subjected to friction and polished. A 20% nitric acid alcohol solution is used for etching, with an etching time of 10 s. The surface pores and cracks of the deposited coating are observed under an optical microscope (Vert. A1), and the porosity is quantified using ImageJ software. The pore area of the metallographic structure is measured using ImageJ software, and the porosity of the cladding layer is calculated using the following formula: Porosity = Pore Area/Total Area.
The density is measured using the Archimedean displacement method. The density of the composite sample is measured according to Archimedes’ principle. The calculation of actual density can be found in Eq. 2.
where m1 is the mass of the deposition layer in air (g); m2 is the mass of the deposition layer in liquid (g); and ρ1 is the density of distilled water (1 g/cm³). Five sets of samples are measured, and the average value is taken, ensuring that the samples are dry and that the surfaces are clean during the measurement process. The density η of the sample is the ratio of the actual density ρ to the theoretical density ρ,’ defined by Eq. 3 as follows:
Additionally, the deposited samples were sectioned for observation of the coating microstructure using a scanning electron microscope (Tesan VEGAII lMH). The deposited samples are prepared as sample blocks with dimensions of 10 mm × 15 mm × 2 mm, and the phase composition and residual stresses of the cladding layer are analysed using XRD (Bruker D8 ADVANCE). The hardness of the deposition layer is measured using an HV-1000IS microhardness tester. The friction coefficient of the cladding layer is measured using a multifunctional material surface performance tester (MFT-4000) under a load of 50 N for 20 min with a 3 mm diameter abrasive ball and a rotation speed of 150 r/min. Use a universal testing machine (SHT-4605) to test the tensile strength and elongation of the samples, with a tensile speed of 1 mm/min. Each group of samples is tested 5 times, and the arithmetic mean of the tensile test results is taken. The cladding layer is subjected to sliding wear testing using an M-2000 friction and wear testing machine under a load of 250 N, a spindle speed of 200 r/min, and a friction time of 30 min. The samples are weighed before and after wear using an electronic analytical balance (J323A) with an accuracy of 1 mg, and the percentage of mass loss relative to the original mass is used to characterise the wear performance. The worn morphology of the cladding layer is captured using a scanning electron microscope.
3 Experimental discussion and conclusion
3.1 Residual stress in the deposited coatings
XRD is primarily used to measure residual stress near the surface of materials. For most applications, understanding the stress state of the material’s surface is crucial. Although the penetration depth of XRD is limited, it is usually sufficient to cover the stress regions of interest in many engineering applications. Figure 3 shows the significant influence of the laser energy density on the residual stress of the deposition layer. As the energy density increases, the residual stress in the upper part of the deposition layer gradually decreases. However, as it approaches the substrate, the residual stress undergoes rapid growth, reaching its maximum at the metallurgical bond between the coating and the substrate. The maximum residual stress in the upper region of the deposition layer is 220 MPa, corresponding to a laser energy density of 83.3 J/mm2. At the interface between the deposition layer and the substrate, the maximum residual stress reaches 270 MPa, corresponding to a laser energy density of 111 J/mm2. When the laser energy density is 97.2 J/mm2, the residual stress in the deposition layer is minimised.
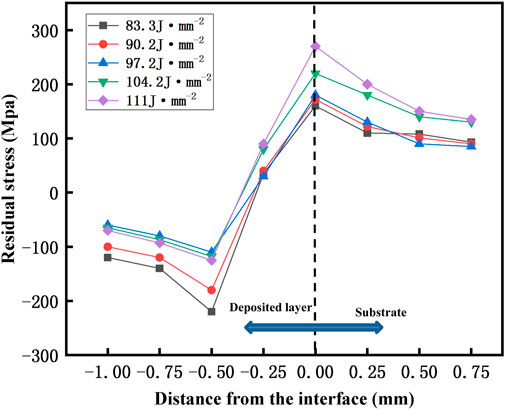
Figure 3. Distribution of residual stress in sedimentary layers with different energy densities (When the laser energy density is 83.3 J/mm2, the residual stress in the upper area of the deposition layer reaches its maximum value of 220 MPa. When the laser energy density is 111 J/mm2, the residual stress in the bonding area between the deposition layer and the substrate reaches its maximum value of 270 MPa).
During laser deposition, the cladding layer and substrate material undergo plastic deformation under the influence of the laser. The laser energy density, as a key factor determining the morphology of the cladding layer and the trend of crack formation, is directly linked to the formation and distribution of residual stress in the cladding layer (Luu et al., 2022). An increase in the laser energy density promotes the uniformity and density of the cladding layer, thereby reducing the thermal stresses in the deposition region. At the same time, an increase in the laser energy density also results in a larger temperature gradient between the cladding layer and the substrate material, consequently leading to greater thermal and structural stresses (Hector and Hetnarski, 1996). These stresses cannot be completely relieved during the cooling process of the cladding layer; thus, these stresses remain in the interior of the cladding layer, forming residual stress.
3.2 Pore defects in the Fe‒Ni‒Ti deposition coatings
Figure 4 illustrates the microstructure and structural defects of the deposition coatings under different laser energy densities. The data show that the microstructure of the composite coating contains dendrites and equiaxed grains. Figure 4F shows the trend of the pore percentage for the five sets of samples. The pore percentage of the coating decreases initially and then rapidly increases with increasing energy density. When the laser energy density ranges from 83.3 J/mm2 to 97.2 J/mm2, the percentage of pores in the metallographic structure of the deposition layer gradually decreases from 2.9% to 1.2%. At a laser energy density of 97.2 J/mm2, the percentage of pores in the Fe‒Ni‒Ti coating reaches its minimum value of 1.2%, and few pores are observed in the metallographic structure. As the energy density continues to increase, large pores appear in the metallographic structure of the deposition layer, and the pore percentage increases from 1.2% to 3.7%. A relatively low laser energy density results in limited heating of the deposition powder and uneven heating, leading to partially unmelted debris in the molten pool, causing the formation of pore defects in the microstructure (Lu et al., 2022).
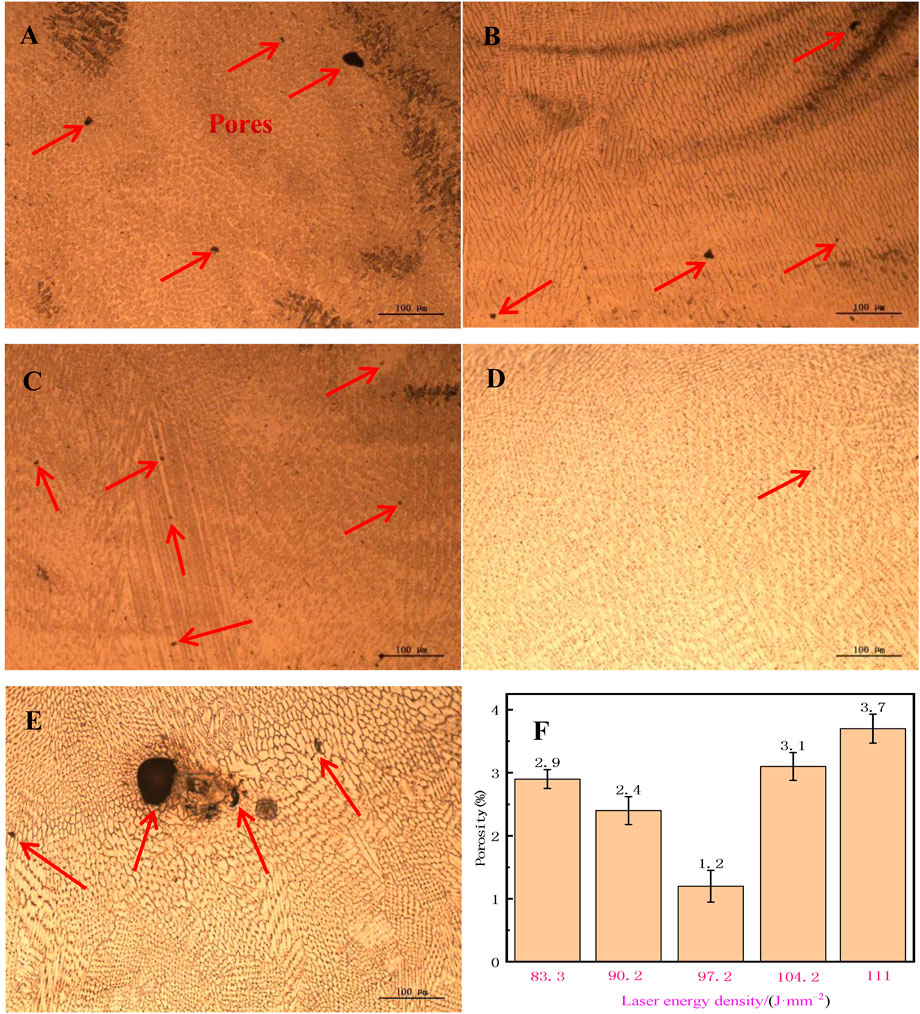
Figure 4. Microscopic Structure and Pore Percentage of the Surface Layer in the Deposition Coating: (A) 83.3 J/mm2, (B) 90.2 J/mm2, (C) 97.2 J/mm2, (D) 104.2 J/mm2, (E) 111 J/mm2, (F) Pore Percentage Variation (When the laser energy density is 97.2 J/mm2, the porosity of the deposited coating is the lowest.).
A lower laser energy density results in less heating of the deposited powder and uneven heating, leading to the presence of partially unmelted particles in the melt pool, causing higher residual stresses in the deposited coating and resulting in the formation of porosity defects in the structure. Conversely, when the laser energy density is too high, the fluidity of the metal melt significantly increases, resulting in the splattering of metal droplets in the melt pool, exacerbating the instability of the deposition region, and leading to the formation of large pores in the structure (Manoj et al., 2023). From the perspective of porosity, the optimal energy density for the Fe‒Ni‒Ti deposition layer is 97.2 J/mm2.
3.3 Density analysis
When the deposition powder is irradiated with a laser beam, there is an extremely high temperature slope in the molten pool, leading to a significant surface tension gradient. This results in turbulent thermocapillary flow in the molten pool, known as the Marangoni flow (Jiang et al., 2020). The stronger the laser absorption rate is, the greater the temperature of the mixed melt in the molten pool, causing an increase in Marangoni flow (Alizadeh-Sh et al., 2020).
Figure 5 illustrates the effect of the laser energy on the density of the deposition layer. When the scanning speed and powder feeding rate are kept constant, the density of the deposition layer increases with increasing laser energy density. When the density reaches a peak of 99.1%, it no longer increases but instead decreases to 96.5% with a further increase in the laser energy density. This phenomenon is primarily based on the variation in the flow state of molten metal in the molten pool due to changes in energy density during the laser deposition process. Marangoni convection is adopted as an indicator to measure the strength of liquid metal convection in the molten pool (DebRoy et al., 2018) as shown in Eq. 4.
where Ma represents the degree of Marangoni convection, μ is the viscosity of the molten metal, α is the heating diffusion coefficient of the alloy, L is the width of the deposited coating, ΔT is the distinction between the highest temperature and the solidus temperature of the alloy, and
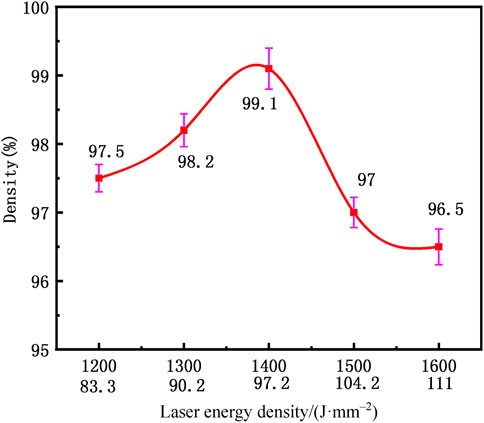
Figure 5. Density of the Deposition Layer at Different Energy Densities (When the laser energy density is 97.2 J/mm2, the deposited coating has the highest density).
According to the laws of physics, there is a negative correlation between the kinematic viscosity of the fused metal or liquid metal in the laser molten pool and the ΔT value as shown in Eq. 5.
where A represents the laser absorption rate, E is the laser energy density, k is the heat conductivity, kth is the heat diffusivity, and τp is the laser radiation time (Zhang et al., 2022).
From the above formulas, it can be concluded that a lower energy density can result in the presence of partially unmelted particles in the molten pool, leading to a lower alloy structural density. Appropriately increasing the laser energy density can achieve a suitable ΔT, allowing for sufficient melting of the alloy powder during the forming process and improving the density. However, an excessively high laser energy density can result in an excessively high maximum temperature in the molten pool, leading to a high ΔT. An excessive ΔT intensifies the fluctuation of Marangoni convection, causing instability in the forming process, leading to defects such as pores and cracks, and reducing the density of the alloy.
3.4 Microscopic morphology and structural analysis
Figure 6 shows the microstructure of the Fe‒Ni‒Ti deposition layer under an SEM at a laser energy density of 97.2 J/mm2. The deposition layer mainly consists of fine dendrites with a few equiaxed grains. The grains grow towards the centre of the molten pool, perpendicular to the solid‒liquid interface, exhibiting characteristics of directional solidification and epitaxial growth. The central region of the deposition layer consists of equiaxed grains with an average size of 9 μm and clear grain boundaries. Figure 6C shows the microstructure of the deposition layer at 4,000x magnification, where in situ TiC reinforcement phases are observed uniformly distributed at the grain boundaries.
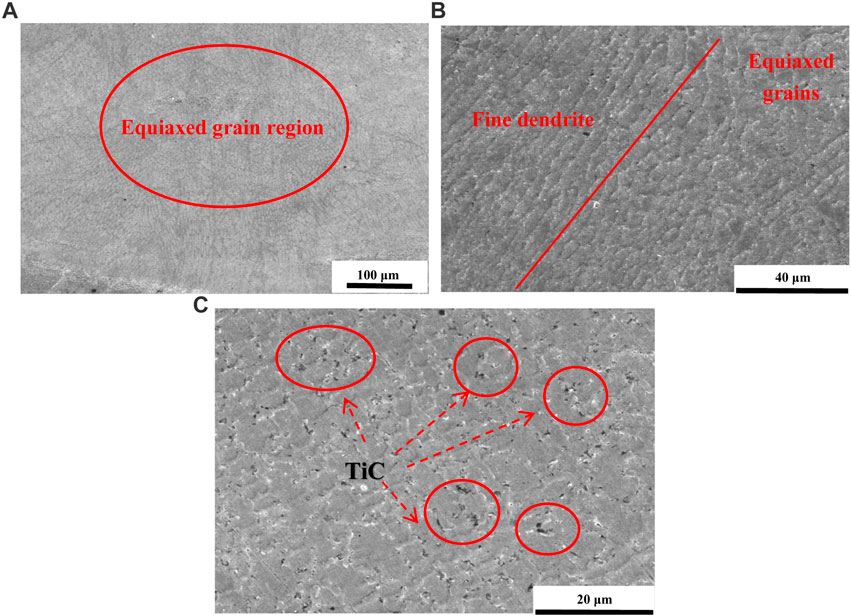
Figure 6. Microscopic Characteristics of the Deposited Layer Surface: (A) 500X, (B) 2,000X, (C) 4,000X. (At a laser power density of 97.2 J/mm2, this structure is composed of columnar grains, dendritic grains, and equiaxed grains, as well as a uniformly distributed in situ TiC reinforcement phase in the coating.).
In the laser deposition layer, columnar grains mainly appear in the boundary area between the cladding layer and the substrate, i.e., the transition zone and the heat-affected zone. This is due to the significant temperature gradient in this area, which causes the grains to grow directionally. Equiaxed grains primarily appear in the central region of the cladding layer, which is the last cooling area in the molten pool. The grains have a longer growth time and are influenced mainly by convection within the melt.
3.5 Phase analysis
Figure 7 presents the X-ray diffraction analysis results for the phases of the Fe‒Ni‒Ti deposited layers under different laser energy densities. The data show that the variation in laser energy density does not alter the phases of the overlay. Austenite is detected in the Fe‒Ni‒Ti deposited layer, along with the presence of a face-centred cubic (FCC) phase. The structure includes α-Fe, Fe3Ni2, and an in situ-formed TiC reinforcement phase. The reaction for the formation of the TiC phase is represented by Eq. 6 As follows:
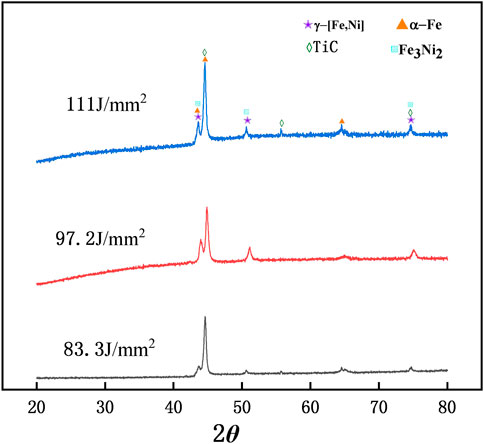
Figure 7. XRD Analysis of the Deposited Layer at Different Energy Densities (The change in laser energy density does not alter the phase of the covering layer. At an energy density of 97.2 J/mm2, the nickel diffraction peak in the Fe‒Ni‒Ti deposited layer becomes lower and broader).
At an energy density of 97.2 J/mm2, the nickel diffraction peak in the Fe‒Ni‒Ti deposited layer becomes lower and broader, indicating a refinement of the metal grains and a denser coating structure, which is conducive to enhancing the material’s mechanical properties, consistent with the SEM analysis results (Penelle and Baudin, 2010).
3.6 Mechanical performance analysis
Figure 8 presents a column chart of the mechanical properties of the Fe‒Ni‒Ti deposited layers at various laser energy densities. The chart shows that with increasing energy density, both the tensile strength and extension of the deposited layer initially increase and then decrease (Yu et al., 2021). At an energy density of 83.3 J/mm2, the tensile strength and extension of the deposited layer are minimal, measuring 545 MPa and 3.44%, respectively. With a density of 97.2 J/mm2, the tensile strength of the deposited layer reaches its maximum value of 628 MPa. With a density of 104.2 J/mm2, the elongation of the deposited layer reaches its maximum value of 5.8%. With a density of 97.2 J/mm2, the microhardness of the deposited layer reaches its highest value of 518 HV, which is approximately 2.24 times greater than the hardness of the base AISI 1045 steel.
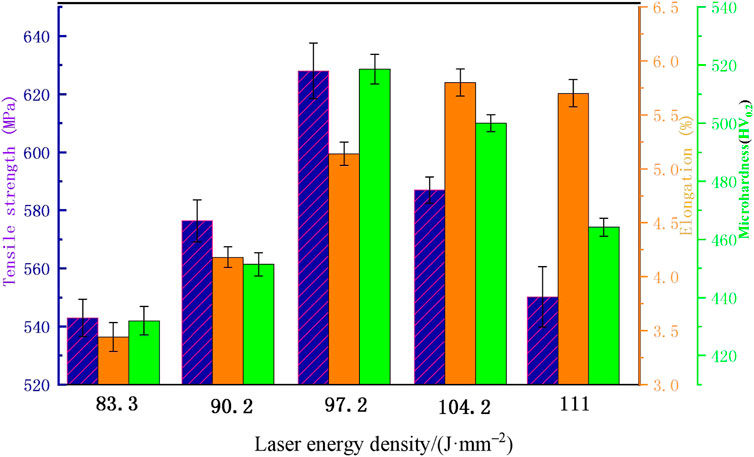
Figure 8. Mechanical Properties of the Deposited Layer at Various Energy Densities (At a density of 97.2 J/mm2, the tensile strength of the deposited layer reaches its maximum value of 628MPa, and the microhardness reaches its maximum value of 518 HV.).
With increasing laser power density, the local temperature of the substrate gradually increases, causing the grains in the deposited layer to transform into fine equiaxed grains. The refinement of the grain size leads to an increase in the overall microstructural density. With a density of 97.2 J/mm2, the TiC precipitate particles generated in situ are uniformly dispersed in the austenitic matrix, providing effective precipitation strengthening. During the tensile deformation process, TiC precipitate particles strongly impede the movement of dislocations, thereby enhancing the tensile strength of the coating. With a density of 111 J/mm2, the microstructural density of the deposited layer decreases, and larger pore defects appear, resulting in a reduction in strength.
The distance from the substrate to the deposition layer is measured over a distance of 0.6–1.0 mm. The microhardness of the deposition layer in this region is tested, as shown in Figure 2. With increasing laser energy density, the microhardness initially increases and then decreases. An analysis of the cause is the following. The primary reason for this phenomenon is correlated with the uniform distribution of ceramic-reinforced TiC in the deposited layer. At a low laser energy density, the melt pool has insufficient energy and poor flowability, resulting in an uneven TiC distribution and lower microhardness. At excessively high laser energy density, the TiC particles undergo melting. This reduces the tendency for dislocation slip, leading to a decrease in the microhardness of the deposited layer. On the other side of the shield, an increase in the energy density increases the internal temperature of the deposited layer. This results in a slower cooling rate, reduced temperature gradient, decreased undercooling, and substantial growth of the internal structure. Consequently, grain coarsening occurs, leading to a decrease in the quality of the cladding layer and a decrease in hardness (Ma et al., 2014).
3.7 Impact of the laser energy density on the friction coefficient of the deposited layer
The variation in the friction coefficient over time for the Fe‒Ni‒Ti coatings deposited under different laser energy densities and subjected to a normal load of 50 N is illustrated in Figure 9A. The friction coefficient represents the ability of a material to reduce friction under complex working conditions. A lower friction coefficient indicates better anti-friction performance, resulting in reduced material wear. In the initial stage of frictional wear, labelled Stage C or the running-in phase, the friction coefficient gradually increases. After 5 min, it enters the stable wear stage labelled Stage D. With increasing relative friction time, debris continuously accumulates and reaches a stable state, indicating the onset of stable wear in the frictional process. Figure 9A shows that at a laser power density of 97.7 J/mm2, the friction coefficient of the deposited layer exhibits the smallest fluctuation during the stable wear stage, indicating the most stable friction behaviour. Figure 9B illustrates the average friction coefficient of the deposited coating and substrate entering the stable wear stage after 10 min. The average friction coefficient of the deposited coating is consistently lower than that of AISI 1045 steel. With increasing energy density, the average friction coefficient of the Fe‒Ni‒Ti-deposited coating initially decreases and then increases (Feng et al., 2022; Wang Z. et al., 2023). At a laser power density of 97.7 J/mm2, the deposited layer exhibits the lowest average friction coefficient of 0.391, which is mainly attributed to the greater hardness and compactness at this energy density.
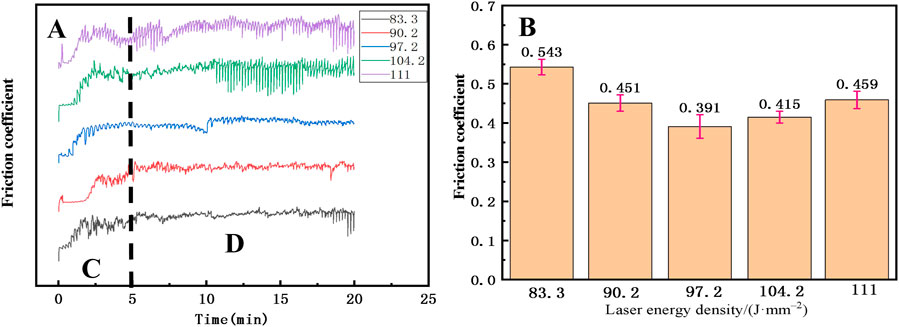
Figure 9. Friction Coefficient of the Deposited Layer at Different Energy Densities: (A) Instantaneous Friction Coefficient, (B) Average Friction Coefficient. (C) The running-in phase, (D) The stable wear stage. (At a laser power density of 97.7 J/mm², the deposited layer exhibits the lowest average friction coefficient of 0.391. At this point, the friction coefficient is relatively stable).
3.8 Impact of the laser energy density on the abrasion capability of the deposited layer
This study investigates the wear performance of the deposited coating through the variation in wear mass loss and the percentage change in the original coating mass. The variation in the wear mass loss ratio of the Fe‒Ni‒Ti coatings deposited under different laser energy densities and subjected to a normal load of 250 N is shown in Figure 10. The wear loss of the deposited layer is consistently lower than that of the AISI 1045 steel substrate. Moreover, at a laser power density of 97.2 J/mm2, the wear mass loss ratio of the deposited layer is minimal, measuring 0.08%. During the wear stage of the deposited layer, the melting of TiC particles into the layer plays a role in solid solution strengthening and precipitation strengthening, leading to an increase in the hardness of the deposited layer and a decrease in wear. The changes in the microhardness of the cladding layer reveal that the wear mass loss ratio is nearly directly proportional to the hardness distribution trend (Guo et al., 2010; Huang et al., 2022).
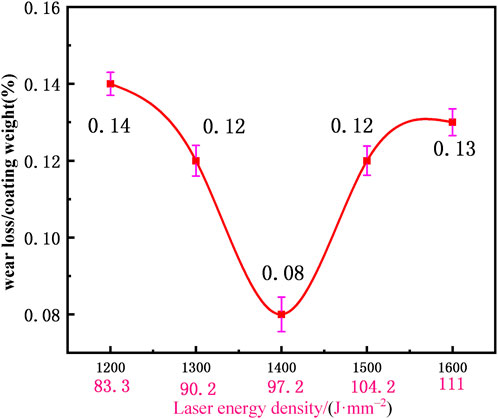
Figure 10. Wear Performance of the Deposited Layer at Different Energy Densities (At a laser power density of 97.7 J/mm², The wear mass loss ratio of the deposited layer is minimal, measuring 0.08%).
Figure 11 shows SEM images of the wear morphology of the Fe‒Ni‒Ti-deposited coating. In Figure 11A, corresponding to a laser power density of 97.2 J/mm2, the wear morphology of the deposited layer shows mainly shallow furrows on a relatively flat surface, indicating mild abrasive wear. In Figure 11B, corresponding to a laser energy density of 111 J/mm2, as the energy density increases, the furrows deepen, and the wear surface becomes uneven. Coating delamination occurs due to plastic deformation, indicating that the predominant wear mechanisms in the deposited layer are abrasive wear and fatigue wear (Zhang and Chen, 2006; Aghababaei et al., 2016). The uniformly distributed TiC particles in the coating, acting as a hard phase, impede the expansion of furrows during wear, enhancing the wear resistance of the material (Mishina and Hase, 2013; Molinari et al., 2018).
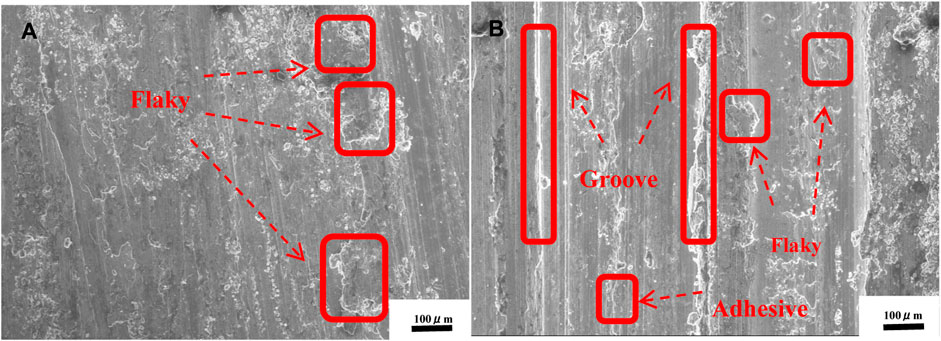
Figure 11. Wear Morphology of the Deposited Layer: (A) 97.2 J/mm2, (B) 111 J/mm2 (The predominant wear mechanisms in the deposited layer are abrasive wear and fatigue wear).
4 Conclusion
In this study, Fe‒Ni‒Ti composite coatings are deposited on the surface of AISI 1045 steel using laser deposition. The influence of different laser energy densities on the microstructure and properties of the Fe-Ni-Ti composite coatings is investigated, with the following conclusions.
(1) Laser deposition of the Fe‒Ni‒Ti composite coating at a laser energy density of 97.2 J/mm2 (1400 W) results in minimised residual stress in the deposition layer and fewer cracks and gas pore defects. Under these conditions, the average size of the equiaxed grains in the central region of the coating is 9 μm, and the coating density reaches 99.1%.
(2) Different laser energy densities do not alter the phases of the deposited layer. The Fe‒Ni‒Ti-deposited coating is primarily composed of γ-[Fe,Ni], Fe3Ni2, and in situ-generated TiC reinforcement. At an energy density of 97.2 J/mm2, the nickel diffraction peaks in the deposited layer decrease in intensity and widen, indicating the refinement of the metallic grains in the coating.
(3) At a laser energy density of 97.2 J/mm2 (1400 W), the deposited layer achieves a maximum tensile strength of 628 MPa and a peak microhardness of 518 HV. The microhardness at this point is approximately 2.24 times that of the AISI 1045 steel substrate. Additionally, the wearability of the deposited layer is optimal, with a wear mass loss ratio of 0.08%. The predominant wear mechanism in the coating is adhesive wear, coupled with abrasive wear.
Data availability statement
The original contributions presented in the study are included in the article/Supplementary Material, further inquiries can be directed to the corresponding author.
Author contributions
ZW: Conceptualization, Data curation, Methodology, Software, Writing–original draft, Writing–review and editing. JZ: Investigation, Visualization, Funding acquisition, Writing–original draft. FZ: Supervision, Funding acquisition, Writing–review and editing. CQ: Writing–review and editing.
Funding
The author(s) declare that financial support was received for the research, authorship, and/or publication of this article. This research was funded by the second batch of national level vocational education teacher innovation team research project (ZI2021090301); 2024 Modern Vocational Education Science and Education Integration Project (01).
Conflict of interest
The authors declare that the research was conducted in the absence of any commercial or financial relationships that could be construed as a potential conflict of interest.
Publisher’s note
All claims expressed in this article are solely those of the authors and do not necessarily represent those of their affiliated organizations, or those of the publisher, the editors and the reviewers. Any product that may be evaluated in this article, or claim that may be made by its manufacturer, is not guaranteed or endorsed by the publisher.
Supplementary material
The Supplementary Material for this article can be found online at: https://www.frontiersin.org/articles/10.3389/fmats.2024.1408333/full#supplementary-material
References
Aghababaei, R., Warner, D. H., and Molinari, J.-F. (2016). Critical length scale controls adhesive wear mechanisms. Nat. Commun. 7, 11816. doi:10.1038/ncomms11816
Alizadeh-Sh, M., Marashi, S. P. H., Ranjbarnodeh, E., Shoja-Razavi, R., and Oliveira, J. P. (2020). Prediction of solidification cracking by an empirical-statistical analysis for laser cladding of Inconel 718 powder on a non-weldable substrate. Opt. Laser Technol. 128, 106244. doi:10.1016/j.optlastec.2020.106244
Arif, Z. U., Khalid, M. Y., Al Rashid, A., Ur Rehman, E., and Atif, M. (2022). Laser deposition of high-entropy alloys: a comprehensive review. Opt. Laser Technol. 145, 107447. doi:10.1016/j.optlastec.2021.107447
Clare, A., Oyelola, O., Folkes, J., and Farayibi, P. (2012). Laser cladding for railway repair and preventative maintenance. J. Laser Appl. 24, 032004. doi:10.2351/1.4710578
DebRoy, T., Wei, H. L., Zuback, J. S., Mukherjee, T., Elmer, J. W., Milewski, J. O., et al. (2018). Additive manufacturing of metallic components – process, structure and properties. Prog. Mater. Sci. 92, 112–224. doi:10.1016/j.pmatsci.2017.10.001
Di, T., Zhao, Y., Song, C., Hu, Y., Ma, G., Wang, Z., et al. (2023). Mechanism of grain refinement and mechanical property enhancement of Ti-45Al-8Nb alloy by directed laser deposition. J. Alloys Compd. 939, 168729. doi:10.1016/j.jallcom.2023.168729
Feng, Y., Gao, Z., and Hu, Z. (2022). Influence of annealing treatment on microstructure and properties of Ni-rich NiTi alloy coating prepared by laser cladding. Materials 15, 3298. doi:10.3390/ma15093298
Glukhov, V., Turichin, G., Klimova-Korsmik, O. G., Zemlyakov, E., and Babkin, K. (2016). Quality management of metal products prepared by high-speed direct laser deposition technology. KEM 684, 461–467. doi:10.4028/www.scientific.net/KEM.684.461
Guo, C., Zhou, J., Zhao, J., and Chen, J. (2010). Effect of ZrB 2 on the microstructure and wear resistance of Ni-based composite coating produced on pure Ti by laser cladding. Tribol. Trans. 54, 80–86. doi:10.1080/10402004.2010.519860
Hector, L. G., and Hetnarski, R. B. (1996). “Thermal stresses in materials due to laser heating,” in Thermal stresses IV (Elsevier), 453–531. doi:10.1016/B978-044481571-2/50006-6
Huang, G., Qu, L., Lu, Y., Wang, Y., Li, H., Qin, Z., et al. (2018). Corrosion resistance improvement of 45 steel by Fe-based amorphous coating. Vacuum 153, 39–42. doi:10.1016/j.vacuum.2018.03.042
Huang, Y., Hu, Y., Zhang, M., Mao, C., Tong, Y., Zhang, J., et al. (2022). On the enhanced wear resistance of laser-clad CoCrCuFeNiTix high-entropy alloy coatings at elevated temperature. Tribol. Int. 174, 107767. doi:10.1016/j.triboint.2022.107767
Jiang, Y., Cheng, Y., Zhang, X., Yang, J., Yang, X., and Cheng, Z. (2020). Simulation and experimental investigations on the effect of Marangoni convection on thermal field during laser cladding process. Optik 203, 164044. doi:10.1016/j.ijleo.2019.164044
Lei, Z., Bi, J., Chen, Y., Chen, X., Qin, X., and Tian, Z. (2019). Effect of energy density on formability, microstructure and micro-hardness of selective laser melted Sc- and Zr- modified 7075 aluminum alloy. Powder Technol. 356, 594–606. doi:10.1016/j.powtec.2019.08.082
Li, Y., Dong, S., Yan, S., Li, E., Liu, X., He, P., et al. (2019). Deep pit repairing of nodular cast iron by laser cladding NiCu/Fe-36Ni low-expansion composite alloy. Mater. Charact. 151, 273–279. doi:10.1016/j.matchar.2019.03.021
Lu, Q., Ou, Y., Zhang, P., and Yan, H. (2022). Fatigue performance and material characteristics of SiC/AlSi10Mg composites by selective laser melting. Mater. Sci. Eng. A 858, 144163. doi:10.1016/j.msea.2022.144163
Luu, D. N., Zhou, W., and Nai, S. M. L. (2022). Mitigation of liquation cracking in selective laser melted Inconel 718 through optimization of layer thickness and laser energy density. J. Mater. Process. Technol. 299, 117374. doi:10.1016/j.jmatprotec.2021.117374
Ma, K., Wen, H., Hu, T., Topping, T. D., Isheim, D., Seidman, D. N., et al. (2014). Mechanical behavior and strengthening mechanisms in ultrafine grain precipitation-strengthened aluminum alloy. Acta Mater. 62, 141–155. doi:10.1016/j.actamat.2013.09.042
Manoj, A., Saurabh, A., Narala, S. K. R., Saravanan, P., Natu, H. P., and Verma, P. C. (2023). Surface modification of grey cast iron by laser cladding for automotive brake disc application. Wear 532-533, 205099–205533. doi:10.1016/j.wear.2023.205099
Mishina, H., and Hase, A. (2013). Wear equation for adhesive wear established through elementary process of wear. Wear 308, 186–192. doi:10.1016/j.wear.2013.06.016
Molinari, J.-F., Aghababaei, R., Brink, T., Frérot, L., and Milanese, E. (2018). Adhesive wear mechanisms uncovered by atomistic simulations. Friction 6, 245–259. doi:10.1007/s40544-018-0234-6
Mortazavian, E., Wang, Z., and Teng, H. (2022). Effect of heat treatment on microstructure and hardness of a worn rail repaired using laser powder deposition. Int. J. Transp. Sci. Technol. 11, 406–422. doi:10.1016/j.ijtst.2021.05.004
Penelle, R., and Baudin, T. (2010). Primary recrystallization of invar, Fe-36%Ni alloy: origin and development of the cubic texture. Adv. Eng. Mater 12, 1047–1052. doi:10.1002/adem.201000077
Shiga, M. (1996). Invar alloys. Curr. Opin. Solid State Mater. Sci. 1, 340–348. doi:10.1016/S1359-0286(96)80023-4
Vinogradov, A., Hashimoto, S., and Kopylov, V. I. (2003). Enhanced strength and fatigue life of ultra-fine grain Fe–36Ni Invar alloy. Mater. Sci. Eng. A 355, 277–285. doi:10.1016/S0921-5093(03)00082-0
Wang, K. (2024). Influence of laser energy density on tribological properties of AlSi10Mg manufactured by selective laser melting. Materials 17, 323. doi:10.3390/ma17020323
Wang, Q., Li, N., Zhou, L., Niu, W., Han, P., Pan, X., et al. (2023a). Microstructure and fatigue performance of hard Al alloy repaired by supersonic laser deposition with laser shock peening treatment. Mater. Charact. 200, 112827. doi:10.1016/j.matchar.2023.112827
Wang, Z., Gui, W., Fu, J., Zhu, P., and Lu, Y. (2023b). Microstructure and properties of electromagnetic field-assisted laser-clad Norem02 iron-based cemented carbide coating. Materials 16, 6774. doi:10.3390/ma16206774
Yi, J. H., Kang, J. W., Wang, T. J., Wang, X., Hu, Y. Y., Feng, T., et al. (2019). Effect of laser energy density on the microstructure, mechanical properties, and deformation of Inconel 718 samples fabricated by selective laser melting. J. Alloys Compd. 786, 481–488. doi:10.1016/j.jallcom.2019.01.377
Yu, C., Liu, X., Li, Y., Song, C., Ma, G., Niu, F., et al. (2021). Investigations of the microstructure and performance of TiCp/Ti6Al4V composites prepared by directed laser deposition. Int. J. Mech. Sci. 205, 106595. doi:10.1016/j.ijmecsci.2021.106595
Yu, J., Rombouts, M., and Maes, G. (2013). Cracking behavior and mechanical properties of austenitic stainless steel parts produced by laser metal deposition. Mater. Des. 45, 228–235. doi:10.1016/j.matdes.2012.08.078
Zhan, X., Qi, C., Gao, Z., Tian, D., and Wang, Z. (2019). The influence of heat input on microstructure and porosity during laser cladding of Invar alloy. Opt. Laser Technol. 113, 453–461. doi:10.1016/j.optlastec.2019.01.015
Zhang, S., Xu, S., Pan, Y., Li, J., and Li, T. (2022). Mechanism study of the effect of selective laser melting energy density on the microstructure and properties of formed renewable porous bone scaffolds. Metals 12, 1712. doi:10.3390/met12101712
Keywords: laser deposition, energy density, Fe-Ni-Ti coatings, microstructure, wear resistance
Citation: Wang Z, Zhang J, Zhang F and Qi C (2024) Impact of laser energy density on the structure and properties of laser-deposited Fe‒Ni‒Ti composite coatings. Front. Mater. 11:1408333. doi: 10.3389/fmats.2024.1408333
Received: 28 March 2024; Accepted: 19 June 2024;
Published: 22 July 2024.
Edited by:
R. D. K. Misra, The University of Texas at El Paso, United StatesReviewed by:
Soundarya Srinivasan, Apple, Inc., United StatesQiyang Tan, The University of Queensland, Australia
Copyright © 2024 Wang, Zhang, Zhang and Qi. This is an open-access article distributed under the terms of the Creative Commons Attribution License (CC BY). The use, distribution or reproduction in other forums is permitted, provided the original author(s) and the copyright owner(s) are credited and that the original publication in this journal is cited, in accordance with accepted academic practice. No use, distribution or reproduction is permitted which does not comply with these terms.
*Correspondence: Zhen Wang, 1715@sdp.edu.cn