- 1Clean Planet Inc., Tokyo, Japan
- 2Institutes of Innovation for Future Society, Nagoya University, Nagoya, Japan
- 3Research Center for Electron Photon Science, Tohoku University, Sendai, Japan
For a system of a nano-sized Ni-Cu multilayer on a Ni substrate and hydrogen gas, many experimental results suggest an anomalous heat release that may be caused by low-energy nuclear reactions in condensed matter. In this paper, to clarify the structural change of the Ni-Cu multilayer with increasing temperature up to 900°C in an atmosphere with and without hydrogen, an in-situ X-ray diffraction (XRD) study using synchrotron radiation was performed for a system of 6 × {Ni(14 nm)/Cu(2 nm)}/α-SiO2(10 nm)/Si wafer (0.5 mm). The surface morphology observation and elemental analysis for the samples after the XRD measurements were performed using electron microscopy analyses. The XRD peaks from Ni were observed up to 600°C and satellite peaks were observed at 300–600°C, which indicates that the initial multilayer structure with a sharp interface was maintained up to approximately 600°C regardless of the atmosphere. After the temperature had increased to 900°C, the initial Ni-Cu multilayer became a single-layer of Ni-Cu alloy with the nominal composition when the system was heated in an atmosphere containing hydrogen; in a hydrogen-free atmosphere, it became a modified Ni-Cu multilayer, where the thickness of the Cu layer decreased to half of the initial value, and many particles were randomly distributed on the surface. For the Ni-Cu multilayer system, a baking pre-treatment at high temperatures in a hydrogen-free environment is considered advantageous to stimulate the anomalous heat effect if we assume that hydrogen diffusion through the bimetallic interface is one of the key factors that induce anomalous heat generation.
1 Introduction
Materials containing metallic elements of Ni and Cu have recently been intensively used to study the anomalous heat (/excess heat) generation, which is assumed to have resulted from low energy nuclear reactions (LENRs) in condensed matter (Takahashi et al., 2020; Tanzella et al., 2020; Alexandrov, 2021; Celani et al., 2022; Iwamura et al., 2024). Celani et al. (2014) attempted to increase the flux of hydrogen associated with electromigration in alloys. Using wires or rods of constantan (e.g., 80% Ni-20% Cu-1% Mn), they successfully enhanced excess power and durability of their devices (Celani et al., 2022). Kitamura et al. (2009) evaluated a report by Arata and Zhang (2008), where a powder material of ZrO2 dispersed with nano-sized Pd was used and excess heat was claimed to be obtainable simply by exposing the material to deuterium gas. Afterwards, Kitamura et al. (2014) reported that nanocomposite powders of bimetallic Pd-Ni or Ni-Cu nano-particles supported by ZrO2 or SiO2 exhibited a better anomalous heat generation (AHG) at higher temperatures. Their findings were developed into a NEDO (New Energy and Industrial Technology Development Organization) project, in which 6 Japanese research institutes participated. In this project, AHG was confirmed for materials of binary metallic nanoparticles supported by ZrO2 or SiO2 but not for single Pd nanoparticles supported by SiO2 (Kitamura et al., 2018; Iwamura et al., 2019). The latter material was independently prepared by 3 institutes using different methods. However, AHG was not observed with these 3 materials. Thus, it has been suggested that the use of materials containing 2 metallic elements is advantageous for AHG. Iwamura et al. (2002) used a material system of nano-sized Pd-CaO multilayer films on a Pd sheet to induce elemental transmutation, and reported that Cs atoms on the top layer of Pd transmuted to Pr by letting deuterium pass through the multilayer system. The amount of transmuted element increased with increasing deuterium flux and total amount of permeated deuterium (Iwamura et al., 2002; Hioki et al., 2013). Thus, the deuterium flux through the interface of the Pd-CaO multilayer may be an important factor that induces the LENR phenomenon of transmutation. Based on the knowledge obtained from the NEDO project and elemental transmutation experiments, Iwamura et al. (2020) invented a material system consisting of a nano-sized Ni-Cu multilayer on a Ni sheet. After the system absorbed hydrogen, they rapidly heated the system to several hundred °C and simultaneously evacuated the chamber in which the system was set. With these procedures, they successfully triggered an AHG. Rapid heating and simultaneous evacuation might have caused a hydrogen diffusion through the multilayer with a flux exceeding a critical level for triggering AHG. Once anomalous heat occurred, anomalous heat was steadily generated for a long time, (e.g., 8 h or more) in a high vacuum environment (Iwamura et al., 2022). Furthermore, a sudden increase in heat (i.e., a heat burst) was occasionally observed (Itoh et al., 2022), and Iwamura et al. (2024) artificially stimulated a heat burst. AHG with a Ni-Cu multilayer system has also been evaluated using photon radiation calorimetry (Kasagi et al., 2023). The radiant power for the Ni-Cu multilayer system is greater than that for a single-layer system of Ni or Cu, which suggests that the bimetallic multilayer structure is an important factor to induce AHG. For AHG with Ni-Cu multilayer systems, the excess heat power depends on the atomic ratio of Ni to Cu (Iwamura et al., 2020; Kasagi et al., 2023). Furthermore, as a characteristic feature of the surface after higher performance AHG experiments, regions of very high oxygen concentrations were observed (Iwamura et al., 2024). However, the relationship between AHG and materials of the Ni-Cu multilayer system has not been well characterized. In this work, to investigate the structural changes in Ni-Cu multilayers with increasing temperature up to 900°C in an atmosphere with and without hydrogen, an in-situ X ray diffraction (XRD) study using synchrotron radiation was performed for a multilayer system of 6 × {Ni(14 nm)/Cu(2 nm)}/α-SiO2(10 nm)/Si wafer (0.5 mm). Here, as a substrate, instead of a Ni sheet, we used a Si wafer covered with a 10-nm-thick amorphous silica (α-SiO2) layer. The α-SiO2 layer was inserted to suppress the chemical reactions between the multilayer and the Si wafer at high temperatures, so that only structural changes in the Ni-Cu multilayer could be observed. The surface morphology and elemental composition of the samples after the XRD measurements were examined using SEM (scanning electron microscopy)/TEM (transmission electron microscopy)-EDX (energy dispersive X-ray spectroscopy). The analysis results are discussed in relation to the materials conditions or active environment (/hot spot) for AHG under the hypothesis that AHG is stimulated by a flux of hydrogen through interfaces between different metals and alloys.
2 Experimental
2.1 Sample preparation
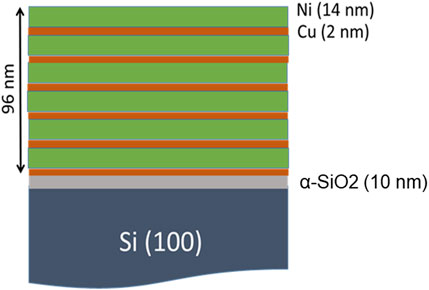
Using magnetron sputter deposition, 6 layers of Ni (14 nm)/Cu (2 nm) bilayer were deposited on a 0.5-mm-thick Si (100) wafer, which was covered with a 10-nm-thick α-SiO2 layer. The substrate was commercially obtained. The base pressure of the deposition chamber was 6.5 × 10⁻⁵ Pa. Ar was supplied as the sputter gas at a rate of 0.12 mL/s and the pressure of the chamber was 0.14 Pa during the deposition. The sputtering conditions were 200 W for 184 s for Ni and 50 W for 82 s for Cu. For uniform deposition, the substrate was rotated at 20 rpm. Figure 1 shows the layered structure of the sample. The nominal atomic composition of the multilayer was Ni0.88Cu0.12. Two samples, (sample-1 and sample-2) were prepared for the present study.
2.2 In-situ XRD with synchrotron radiation
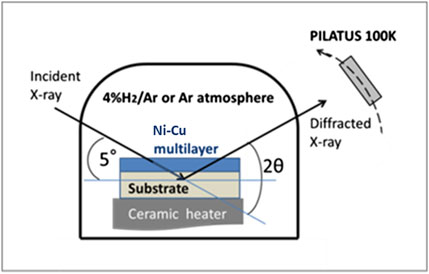
In-situ XRD measurements were performed using the beam line BL8S1 at the Aichi Synchrotron Radiation Center of Aichi Science and Technology Foundation. Figure 2 shows a schematic view of the experimental configuration. The samples were set on a ceramic heater in a small testing chamber (100 mm diameter, 80 mm height) which was installed inside the BL8S1 experimental hutch. The samples can be heated up to 900°C in atmospheres with and without hydrogen. As an atmosphere with hydrogen, a high purity Ar gas mixed with 4% H2, 4% H2/Ar, was used. 4% H2 was the maximum hydrogen concentration within the safety requirements from the BL8S1 facility. As an atmosphere without hydrogen, high purity Ar was used. These gases were supplied to the testing chamber from cylinders located outside the experimental hutch. The wavelength of the X-ray was set to 0.08627 nm. The testing chamber was equipped with a Kapton film window for X-ray irradiation. The incident angle of the X-ray was fixed at 5° to the sample surface. The extracted X-rays were detected by a Rigaku PILATUS 100K detector, which was positioned 300 mm away from the sample. The size of the sample was 8 mm × 20 mm × 0.5 mm and the footprint of the irradiated X-ray at the center of the sample surface was 0.5 mm wide and 2.3 mm long.
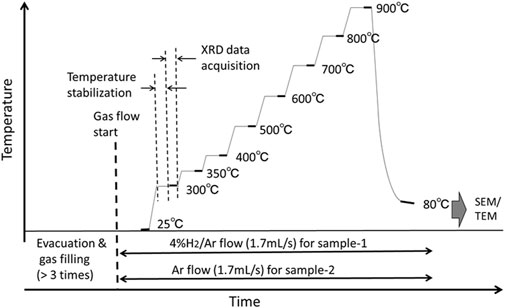
As shown in Figure 3, the temperature of the sample was increased stepwise from 25°C to 900°C with a ceramic heater, in which a thermocouple was embedded. In an atmosphere with hydrogen, where sample-1 was heated, 4% H2/Ar was injected at a flow rate of 1.7 mL/sec. In an atmosphere without hydrogen, where sample-2 was heated, pure Ar gas at a flow rate of 1.7 mL/s was used. The purity of the gas was 99.99999% and 99.9999% for H2 and Ar, respectively.
For the experiment in a hydrogen atmosphere, the testing chamber was first evacuated by a rotary pump to ∼10−1 Pa; then the chamber was filled with the 4% H2/Ar gas up to 0.1 MPa. This process was repeated at least 3 times, and the chamber was subsequently filled with the gas at a fixed flow rate of 1.7 mL/s at 0.1 MPa. Then, the temperature of the sample was increased stepwise. When the temperature reached a fixed value, the sample was maintained at that temperature for approximately 15 min to reach thermal equilibrium, after which approximately 6 min was required to obtain an XRD pattern at that temperature. After a spectrum was taken at 900°C, the input power of the heater was cut, the sample was cooled in the chamber and a XRD spectrum was taken at approximately 80°C. The procedure was repeated for the experiment with sample-2 in the atmosphere of Ar. After the XRD experiments, the samples were subjected to SEM/TEM-EDX analyses.
2.3 SEM/TEM-EDX analyses
The surface morphology and surface elements of the samples were observed after the XRD measurements using JSM-6500F instrument (JEOL) equipped with SEM and EDX instruments. STEM (scanning transmission electron microscopy) observations of cross-sections of the samples were performed using an FEI Titan³ TM 60–300 instrument equipped with double correctors. Thin samples for STEM observations were prepared using a focused ion beam (FIB) of Ga. All equipment was at the Electron Microscope Center, Tohoku University.
3 Experimental results
3.1 Changes in the XRD spectrum with increasing temperature in atmospheres with and without hydrogen
3.1.1 XRD spectra of the as-deposited samples at room temperature
As shown in Figure 4, the XRD spectra at 25°C were compared for sample-1 in an atmosphere of 4% H2/Ar and sample-2 in an atmosphere of Ar. As shown in Figure 4A, three peaks were clearly observed in the background from the substrate of the Si (100) single crystal. All XRD peaks were approximately consistent with those reported in the literature (van Ingen et al., 1994) for face-centered cubic Ni (FCC Ni). Therefore the peaks at 25°C were attributed to crystalline Ni particles in the Ni layers. No peaks from Cu were observed because the Cu layer, 2 nm, was too thin to be observable as XRD peaks. As shown in Figure 4B, the peak profile of Ni (111) for sample-1 overlapped with that of sample-2, so the two samples were considered as identical in the as-deposited state. The Ni (111) profile was broad and asynmmetric, which suggests that the Ni crystalline particles in the Ni layer were less than ∼10 nm and included residual stress/strain due to sputter deposition. The angular position 2θ at the highest peak slightly differed from the literature value of Ni, probably due to residual stress associated with sputter deposition.
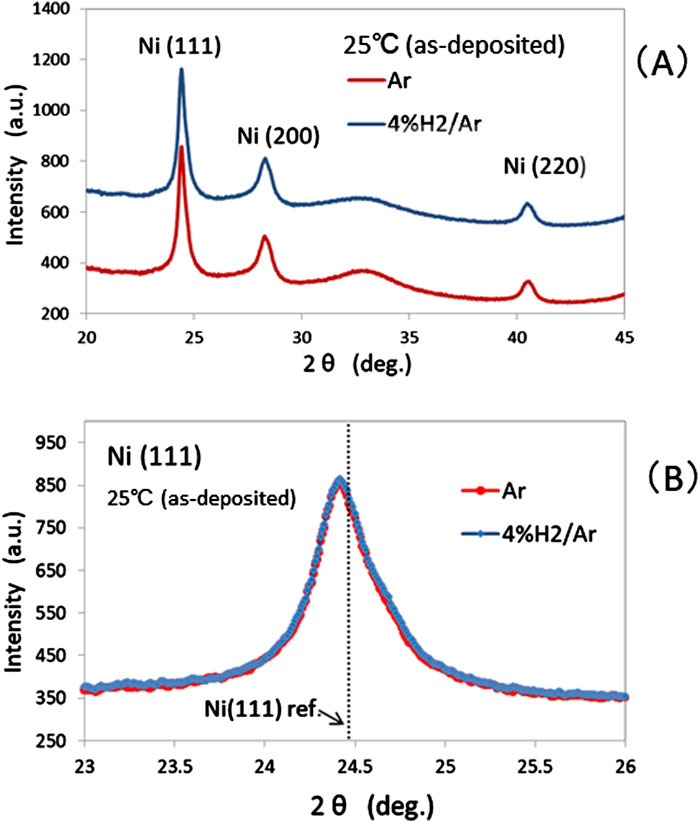
Figure 4. (A) XRD spectra at 25°C in atmospheres of Ar (red line) and 4% H2/Ar (blue line); (B) Ni (111) peak-profiles at 25°C in atmospheres of Ar (red dot) and 4% H2/Ar (blue square).
3.1.2 Changes in XRD spectrum with temperature and effect of hydrogen
Figure 5 shows the change in XRD spectrum with increasing temperature in a hydrogen (4% H2/Ar) atmosphere. Only the peaks that correspond to the FCC structure were observed at every temperature up to 900°C. The broad peaks at 25°C became sharp at 300°C, and satellite peaks were clearly observed in the range of 300–600°C, although the intensity of the satellite peaks decreased at 600°C. At higher temperatures, the (200) and (111) peaks became more intense and significantly sharper, which indicates the preferential growth of crystalline particles. Notably, the appearance of satellite peaks at 300–600°C indicates that the Ni-Cu multilayer structure was maintained with a sharp interface up to at least 600°C (Kano et al., 1993; Xu et al., 2000). A similar variation in the XRD pattern with increasing temperature was also observed for sample-2 in an Ar atmosphere without hydrogen.
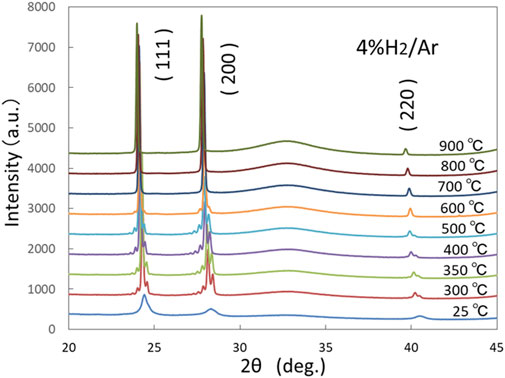
Figure 5. Variation of XRD spectra for sample-1 with increasing temperature up to 900°C in a hydrogen (4% H2/Ar) atmosphere.
After reaching 900°C, the samples were cooled to approximately 80°C by turning off the input power to the ceramic heater. The XRD spectrum at 80°C was quite similar to that at 900°C, although all peaks shifted to higher 2θ values due to thermal contraction. In Figure 6, the (111) peak profiles at 80°C were compared with those at 25°C in the deposited state. The (111) peak profile became much sharper and more symmetric than the Ni (111) profile in the deposited state. The (111) peak position at 80°C in the hydrogen atmosphere shifted to a lower 2θ value than that in the Ar atmosphere. The peak position for 80°C (Ar) was almost consistent with that for the FCC Ni reference at 25°C, whereas the peak position for 80°C (4% H2/Ar) was almost consistent with that for the FCC Ni0.88Cu0.12 alloy reference at 25°C. This finding suggests that alloying reaction between Ni layer and Cu layer does not occur until approximately 900°C if the multilayer system is heated in a hydrogen-free atmosphere.
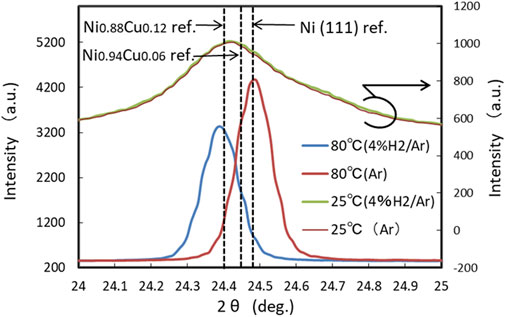
Figure 6. Comparison of (111) profiles at 80°C cooled from 900°C to those at 25°C in the as-deposited state.
From the 2θ value, the lattice constant was calculated for the FCC structure which was observed throughout the tested temperature history in both atmospheres with and without hydrogen. Lattice constant, a, can be calculated based on the Bragg’s condition of diffraction as follows (Equation 1):
where λ is the wavelength of the incident X-ray, and (h, k, l) are the Miller indices of the crystal planes that give rise to the XRD peaks. In Figure 7, the lattice constant of the FCC structure and full width at half maximum (FWHM) of the (111) peak are plotted as functions of temperature. There are three temperature (T) ranges, in which the lattice constant in 4% H2/Ar is greater than that in the Ar atmosphere; (i) 350 < T < 600°C, (ii) T ∼ 900°C, (iii) T ∼ 80°C (cooled from 900°C).
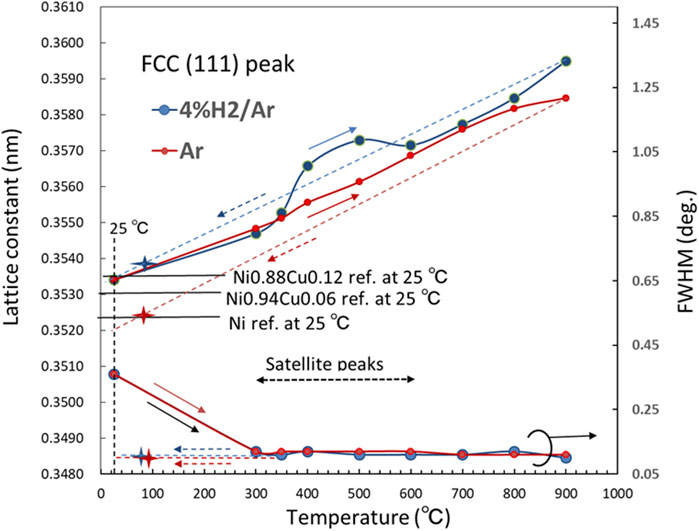
Figure 7. Lattice constant of FCC structure and FWHM (2θ) for XRD (111) peak as functions of temperature in atmospheres of Ar (red dot) and 4% H2/Ar (blue dot). Star marks are for 80°C cooled from 900°C.
There are two possible origins for the observed lattice expansion in a hydrogen atmosphere in range (i). One possibility is the alloying of Ni and Cu; FCC Cu has a larger lattice constant than FCC Ni and the alloying of Cu with Ni expands the FCC lattice. To form a Ni-Cu alloy, interdiffusion of atoms in the Ni and Cu layers should occur; then, the interface between Ni and Cu layers gradually disappears. However, satellite lines were observed at 300–600°C, as shown in Figure 5. The appearance of satellite lines indicates a superlattice structure with a sharp interface (Cho et al., 1999). From the satellite peaks, the super lattice spacing D can be calculated by Equation 2 (Fullerton et al., 1992):
where d is the lattice spacing of the main peak, n is the order of satellite peaks (n = ±1, ±2,···), θn+ and θn- are angular positions of the nth-order positive and negative satellite peaks, respectively, and λ is the X-ray wavelength. In Figure 8, the values of D calculated from the satellite peaks around (111) and (200) peaks were plotted as a function of temperature. The satellite peaks were similarly observed in atmospheres with and without hydrogen. The calculated value of D was (18.5 ± 0.5) nm, which was slightly larger than the nominal value of 16 nm and D tended to slightly increase with temperature. The appearance of satellite peaks up to 600°C indicates that no alloying occurs up to 600°C even in an atmosphere containing hydrogen. These findings also indicate that all XRD peaks in the range of T ≤ 600°C resulted from the crystalline Ni particles in the Ni layer. Therefore, the alloying reaction was excluded as the cause of the observed anomalous lattice expansion in the temperature range (i).
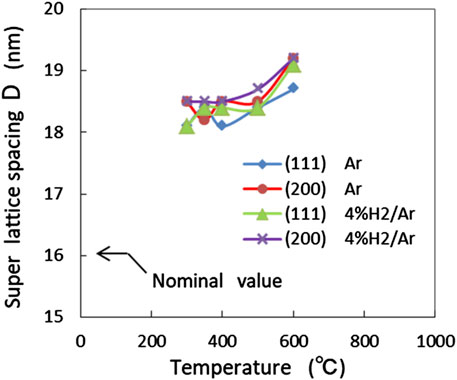
Figure 8. Super lattice spacing D derived from satellite peaks around (111) and (200) peaks, in Ar and 4% H2/Ar atmospheres, as a function of temperature.
Another possibility for the lattice expansion in a hydrogen atmosphere is the uptake of hydrogen into the Ni layer. The volume change ⊿v of a metal with an uptake of hydrogen is ∼2.9 × 10⁻³ nm3 per a hydrogen atom (Westlake, 1983), and x can be estimated by Equation 3,
where x is the hydrogen solubility (hydrogen-atom to metal-atom ratio), and v0 and v are the volume per metal atom before and after hydrogen uptake, respectively. At a temperature T, v and v0 can be calculated from the measured lattice constants under 4% H2/Ar and that under Ar, respectively. At T = 400°C and 500°C, x is estimated to be 0.032 and 0.037, respectively. The solubility of hydrogen, x, in Ni at 500°C under 0.1 MPa hydrogen is ∼2 × 10⁻⁴ (Jones and Pehlke, 1971; Huang et al., 1979). Using Sievert’s law (Sievert, 1929), x under 4% H2/Ar is estimated to be ∼4 × 10⁻⁵. Therefore, the x values at 400°C and 500°C are larger than those estimated from the literature by approximately three orders of magnitude. In the present experiment, the 14-nm-Ni layers were sandwiched by the 2-nm-Cu layers with sharp interfaces in temperature range (i) as indicated by the satellite peaks in the XRD profiles. Since Cu has a larger lattice constant and a larger thermal expansion coefficient than Ni, Ni layers are subjected to a significant tensile stress, which eases the penetration of hydrogen into the interstices in the Ni lattice. Thus, we consider that the nanoscale multilayer structure with a sharp interface caused the anomalous lattice expansion in temperature range (i).
The tensile stress is released at temperatures above 600°C because the self-diffusion of Cu in the Cu layer greatly increases when the temperature approaches the melting point of Cu, 1085°C, which is considerably lower than the melting point of Ni, 1455°C (Cheng et al., 2017). When the tensile stress decreases with increasing temperature above 600°C, the hydrogen solubility in Ni decreases to an undetectable level as the XRD peak shifts between 4% H2/Ar and Ar.
At T = 900°C in range (ii), the lattice constant in 4% H2/Ar is significantly greater than that in Ar, as shown in Figure 7, because Ni and Cu became fully alloyed at 900°C in the hydrogen atmosphere, whereas the alloying was incomplete or did not occur at all in the Ar atmosphere. Thermodynamically, the change in Gibbs free energy, ⊿G, for the alloying reaction of, 6 × {Ni(14 nm)/Cu(2 nm)} + 4% H2/Ar → Ni0.88Cu0.12 (∼96 nm) + 4% H2/Ar, becomes negative when the temperature reaches 900°C, whereas ⊿G for the alloying reaction in Ar, 6 × {Ni (14 nm)/Cu (2 nm)} + Ar → Ni0.88Cu0.12 (∼96 nm) + Ar, is positive even at 900°C. The chemical states at the highest temperature of 900°C are considered fairly stable if the temperature is maintained below 900°C.
At T = 80°C (cooled from 900°C) in range (iii), the XRD (111) peak position for the sample in 4% H2/Ar was consistent with that of the Ni0.88 Cu0.12 alloy, whereas the (111) peak position for the sample in Ar was consistent with that of Ni as shown in Figure 6, which suggests that Ni and Cu layers did not mix.
The elemental analysis by SEM/TEM-EDX for sample-1 after the XRD experiments shows that the Cu concentration at the surface layer, Cu/(Ni + Cu), was almost consistent with the nominal value of 0.12. Meanwhile, the value was ∼0.06 for sample-2, which experienced the same temperature history in the atmosphere without hydrogen. As shown in Figure 6, this difference is reflected in the difference in 2θ angular positions of the XRD (111) peaks at 80°C for the samples cooled from 900°C. Figure 7 shows the lattice constants at 25°C that were estimated with Vegard’s law (Denton and Ashcroft, 1991) as a reference for pure Ni, and FCC alloys of Ni0.88Cu0.12 and Ni0.94Cu0.06. The experimental lattice constant for sample-1 is consistent well with the reference value of Ni0.88Cu0.12. Thus, the initial Ni/Cu multilayer structure becomes a single-layer of Ni-Cu alloy with a nominal atomic ratio, if the temperature of the sample is increased to ∼900°C in an atmosphere containing hydrogen. Meanwhile, the experimental lattice constant for sample-2 was more consistent with that of pure Ni than with the value of the Ni0.94Cu0.06 alloy. This finding suggests that an alloy reaction between Ni and Cu does not occur even when the multilayer sample is subjected to a high temperature of 900°C if the sample is heated in an atmosphere without hydrogen. These differences in alloying behavior in atmospheres with and without hydrogen are attributed to the hydrogen-assisted enhancement of the interdiffusion of atoms (Hayashi et al., 1998; Fukumuro et al., 2013), which originates from the ease of abundant vacancy formation in metals that contain dissolved hydrogen (Iida et al., 2005). In the present experiment, as suggested in Figure 7, for sample-1, the alloy reaction between Ni and Cu gradually proceeded above 600°C and completed at temperatures as high as approximately 900°C as a consequence of the increased hydrogen-assisted interdiffusion.
Figure 7 also shows the FWHM for the (111) XRD profile as a function of temperature. The FWHM was large at 25°C in the as-deposited state. This was because the Ni crystallites were less than ∼10 nm and their crystallinity was low. With increasing temperature, it significantly decreased until approximately 300°C, became almost constant until 900°C. When the temperature was cooled from 900°C to 80°C, the FWHM at 80°C was approximately consistent with the value at 900°C. This phenomenon indicates that nanocrystalline evolution in the Ni and Cu layers mostly occurred when the temperature increased to approximately 300°C, i.e., the residual stress/strain associated with sputter deposition was released and the crystallinity of the Ni crystallites was increased. As seen in Figure 5, the (111) and (200) peaks became much higher than (220) at temperatures higher than 300°C, which suggested that the Ni crystallites had preferred orientations. When the temperature increased to 900°C and decreased to room temperature, no peeling or cracking of the Ni-Cu film occurred.
3.2 SEM-EDX analyses of the samples after the XRD measurements
After the XRD measurements, the samples (hereafter denoted as sample-1_4% H2/Ar and sample-2_Ar) were subjected to SEM observation. As shown in Figures 9A, B, the surface morphology of sample-1_4% H2/Ar consisted of flat regions and many holes with diameters of 0.5–5 μm. The surface morphology of sample-2_Ar had flat regions, many holes, and many particles 3–5 μm in size that were randomly distributed on the flat surface, as shown in Figures 9C, D. SEM-EDX elemental analyses were performed at many spots in these areas. The detected elements at the holes (for example; 005 and 006 in Figure 9B, and 002 in Figure 9D) were Si (98 at%), O (1.6 at%), and Ni (0.4 at%), on average. The holes were clearly the area where the substrate Si covered with α-SiO2 was exposed. For sample-1_4% H2/Ar, elemental analyses were performed at various spots in flat regions. Table 1 shows the result averaged over 6 spots. Similarly, for the sample-2_Ar, elemental analyses were performed at 8 spots in flat regions and 8 spots on particles and the average concentrations of the detected elements are also shown in Table 1. The relative concentration of Cu, Cu/(Ni + Cu), for sample-1_4% H2/Ar was 0.12, which is consistent with the nominal value. This result is also consistent with the XRD result that the lattice constant for sample-1 cooled from 900°C is close to that of an FCC Ni0.88Cu0.12 alloy. Therefore, the initial Ni-Cu multilayer became a single-layer of FCC Ni0.88Cu0.12 alloy when the Ni-Cu multilayer was heated to 900°C in an atmosphere with hydrogen. However, for sample 2_Ar, the Cu/(Ni + Cu) ratio for flat regions was 0.060, which was half of the nominal value, and the Cu/(Ni + Cu) ratio for particles was 0.73 which was approximately 6 times larger than the nominal value. These findings suggest that Cu atoms in the Cu layer migrate to condense at the sites of the particles when the samples are heated to 900°C in an atmosphere without hydrogen. The number density of the particles was on the order of 103 ∼ 104/mm2. Notably, the oxygen concentration in the particle was more than 3 times greater than that in the flat region.
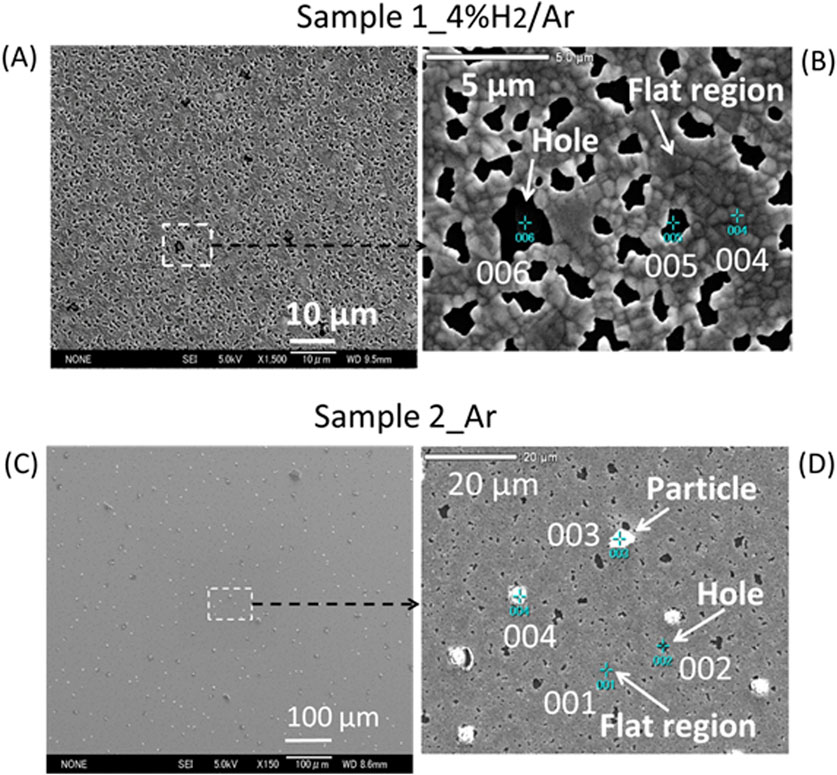
Figure 9. (A) A distant SEM view, which shows flat regions and many holes on the surface of sample-1_4% H2/Ar; (B) Enlarged image of the dotted square in (A), which shows 3 numbered-green-cross-spots, where elemental analyses were performed by SEM-EDX; (C) A distant SEM view which shows flat regions, many holes and many particles randomly distributed on the surface of sample-2_Ar; (D) Enlarged image of the dotted square in (C), which shows 4 numbered-green-cross-spots where elemental analyses were performed by SEM-EDX.

Table 1. Concentration of the detected elements averaged over several analysis spots classified by shape (flat region or particle) for sample-1_4% H2/Ar and sample-2_Ar.
Thus, the surface morphology of the multilayer sample after heating to 900°C notably varies depending on the atmosphere where heating is performed. Many particles with a size of ∼5 μm were randomly distributed on the surface of the sample heated in the atmosphere without hydrogen. In this case, the value of Cu/(Ni + Cu) was 0.06; therefore the atomic composition was Ni0.94Cu0.06. However, as indicated by XRD, the (111) peak angular position was approximately consistent with that of FCC Ni, but not FCC Ni0.94Cu0.06, as shown in Figures 6, 7. Therefore, the surface structure of the flat region in sample 2_Ar is a modified multilayer structure denoted by approximately 6 ×{Ni(∼14 nm)/Cu(∼1 nm)}/α-SiO2(10 nm)/Si. Notably, the Ni and Cu layers did not mix even at temperatures as high as 900°C in a hydrogen-free environment.
Many holes appeared on the surfaces of sample-1_4% H2/Ar and sample-2_Ar. The formation mechanism of the holes is not clear, but the difference in thermal expansion coefficient between substrate Si and metallic multilayer film is large, so the metal film may be subjected to a large tensile stress during the cooling process from 900°C. The holes may form to relieve the tensile stress during the cooling process. A metallic substrate would have much fewer or no holes or cracks.
3.3 STEM-EDX analyses of the samples after XRD measurements
3.3.1 Sample-1_4% H2/Ar
To examine the cross-sectional structure, a test piece was cut from a flat region, including a hole, using FIB as shown in Figure 10A, for sample-1_4% H2/Ar. The surface metal layer was slightly wavy as shown in Figure10B. STEM-EDX elemental analyses were performed for point 1 in a flat region, as shown in Figure 10B. Figure 10C shows a bright field (BF) image for point 1. The surface layer was 120–124 nm thick around point 1 as shown in Figure10C. These values are significantly larger than the nominal value of 96 nm and slightly larger than the value of 111 (±3) nm that was estimated from the XRD satellite peaks (Figure 8). Elemental analyses were performed by dividing the cross-sectional area into 3 parts in the depth direction; top, middle and bottom, as shown in Figure 10D. Table 2 shows the results. The total concentration of Ni and Cu, (Ni + Cu), was 97 at% and these atoms may be uniformly distributed in the depth direction. The Cu/(Ni + Cu) value was 0.13, which was close to the nominal value of 0.12. These findings and the XRD results suggest that the surface layer was a Ni0.88Cu0.12 alloy with a FCC structure. This result is consistent with the SEM observations in the previous section. As impurity elements, 2.3 at% Si and 0.7 at% Al were detected on average, although the results are not shown in Table 2. Si might be introduced by the FIB process.
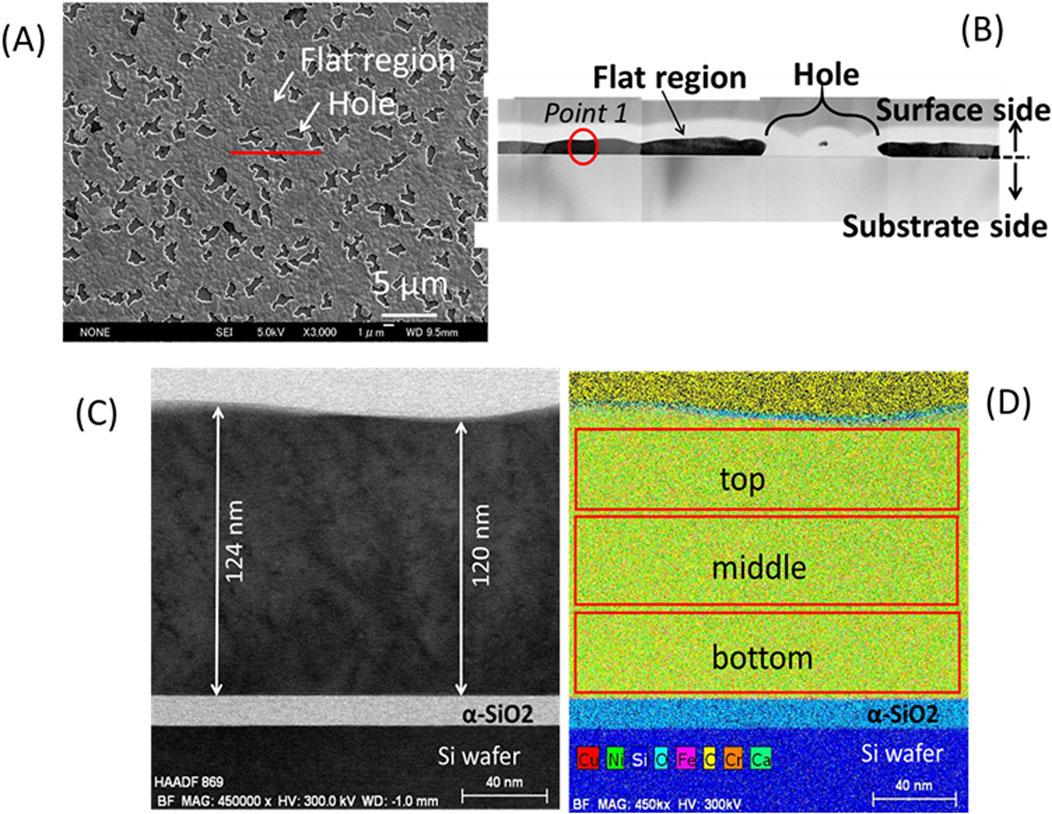
Figure 10. Cross sectional TEM observations for sample-1_ (4% H2/Ar): (A) A test piece for TEM was cut along the red line in a flat region including a hole; (B) A TEM image of the flat region including the hole; (C) A BF image for point 1shown in (B) with a red circle; (D) 3 areas scanned with STEM-EDX for elemental analyses.

Table 2. Atomic concentrations of Ni and Cu for point 1 (Figure 10B) in a flat region of sample-1_4% H2/Ar by STEM-EDX.
3.3.2 Sample-2_Ar: flat region
Sample-2_Ar had many particles distributed randomly on the surface. Two test pieces for TEM were prepared for this sample. A test piece was cut from a flat region including a hole as shown in Figure 11A. Figure 11B shows a cross-sectional view for this test piece. Elemental analyses were performed at point-1 in a flat region, as shown in Figure 11B. Figure 11C shows an enlarged BF image for point-1. The surface layer around point-1 was 104–115 nm thick. These values are smaller than those of sample-1_4% H2/Ar, and the surface metal film on average was thinner for the sample heated to 900°C in the atmosphere without hydrogen than that heated in the atmosphere with hydrogen. Elemental analyses were performed for 3 areas of the surface layer (top, middle and bottom in the depth direction) as shown in Figure 11D. Table 3 shows the results. The total concentration of Ni and Cu, (Ni + Cu), was 98 at%, which is almost consistent with that of the flat region of sample-1_4% H2/Ar. However, the relative concentration of Cu, Cu/(Ni + Cu), was 0.064, which is approximately half of the value observed for the sample-1_4% H2/Ar. Therefore, the relative Cu concentration in the surface metal layer is clearly different between the samples after heating up to 900°C in the atmosphere with and without hydrogen. The average Cu/(Ni + Cu) value of 0.064 suggests that the amount of Cu in the flat region decreased to approximately half of the amount in the as deposited state. This result was consistent with the TEM observation that the surface layer thickness for sample-2_Ar was smaller than that for sample-1_4% H2/Ar.
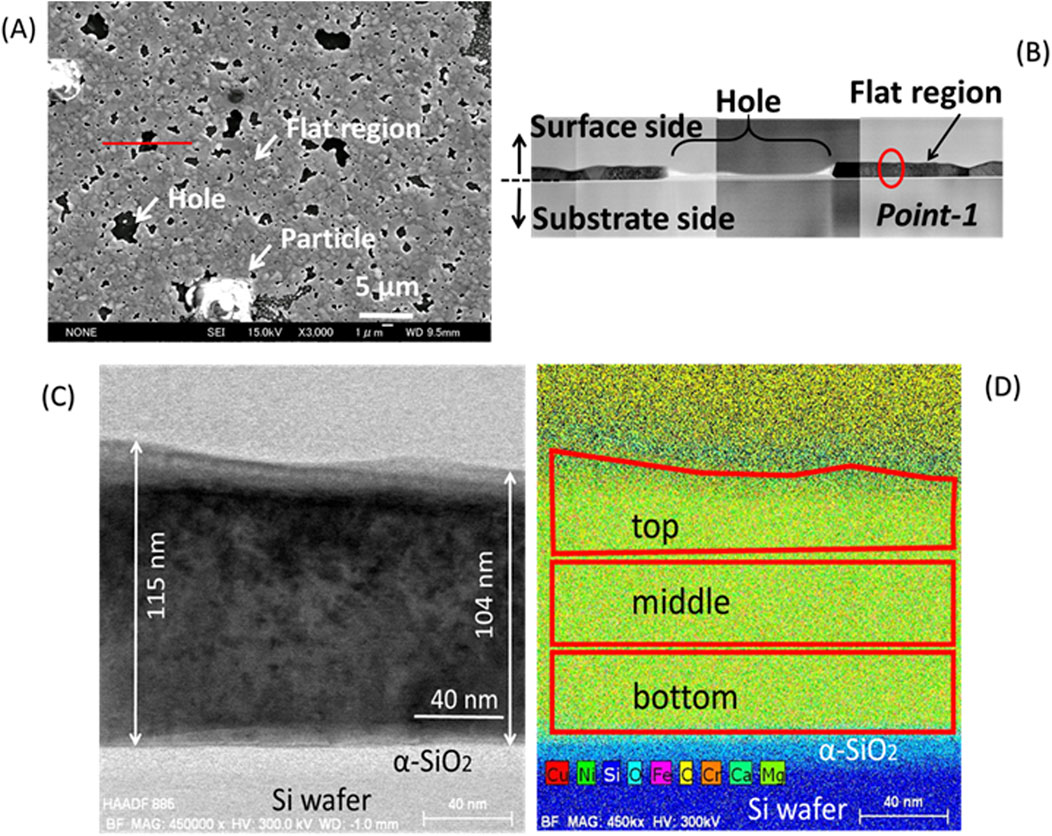
Figure 11. Cross sectional TEM observations for a flat region of sample-2_ (Ar): (A) A test piece for TEM was cut along the red line in sample-2_Ar; (B) A TEM image for the flat region including a hole; (C) A BF image for point-1shown in (B) with a red circle; (D) 3 areas scanned with STEM-EDX for elemental analyses.

Table 3. Atomic concentrations of Ni and Cu for point-1 (Figure 11B) in a flat region of sample-2_Ar by STEM-EDX.
3.3.3 Sample-2_Ar: particle
Another test piece for TEM was cut from a particle with a diameter approximately 6 μm as shown in Figure 12A. The bright field (BF) and high angle annular dark field (HAADF) images in Figures 12B, C, respectively, show that the particle formed a mountain-shaped mound above the surface, sank deep into the substrate below the surface, and consisted of several domains that overlap one another. The particle from the substrate surface was ∼2 μm high, and the overall longitudinal length of the particle was 5.5 μm, which was more than 50 times larger than the thickness of the flat region (∼100 nm) of the sample. The SEM top view suggests that the bottom surface of the particle was a square (Figure 12A). Therefore, the shape of the particle in the substrate side is considered a square pyramid, and overall shape of the particle was an asymmetric octahedron. The HAADF image in Figure 12C clearly shows that the particle consisted of several domains with different elemental compositions. As Figure 13 shows, elemental mapping images of Ni, Cu, and O for the cross section qualitatively suggest that there were clearly separated Ni-rich and Cu-rich domains with a size of ∼1 μm. Oxygen was observed in the outer edge of the octahedron and in the Cu-rich domains. The oxygen concentration at the tip of the square pyramid in the substrate side was comparatively high. Detailed elemental analyses were performed by STEM-EDX for the cross section of the particle. The areas surrounded by 5 numbered-squares as indicated by red lines in Figure 13A were scanned, and Table 4 shows the concentrations for detected elements in each area. The Ni-rich domains (#1 - #2) dominantly consisted of 54 at%-Si and 43 at% - (Ni + Cu) with Cu/(Ni + Cu) ratios near the nominal value. These two components may exist as separate particles of Si and ∼Ni0.88Cu0.12 alloy or might form a silicate with an approximate composition of (Ni0.88Cu0.12)43Si54. The Cu-rich domains (#3 - #5) had a large atomic concentration of Cu (71–74 at%) and smaller concentrations of Si (16 at%) and O (7.4–9.1 at%). O atoms were clearly included in the Cu-rich domains as shown in Figures 13C, D. The relative concentration of Cu, Cu/(Ni + Cu), was close to 1.0 in the Cu-rich domains. The large amount of Cu in the Cu-rich domains suggests that the domain consisted of pure Cu crystalline particles, which were protected by a film of Cu oxide such as Cu2O or CuO.
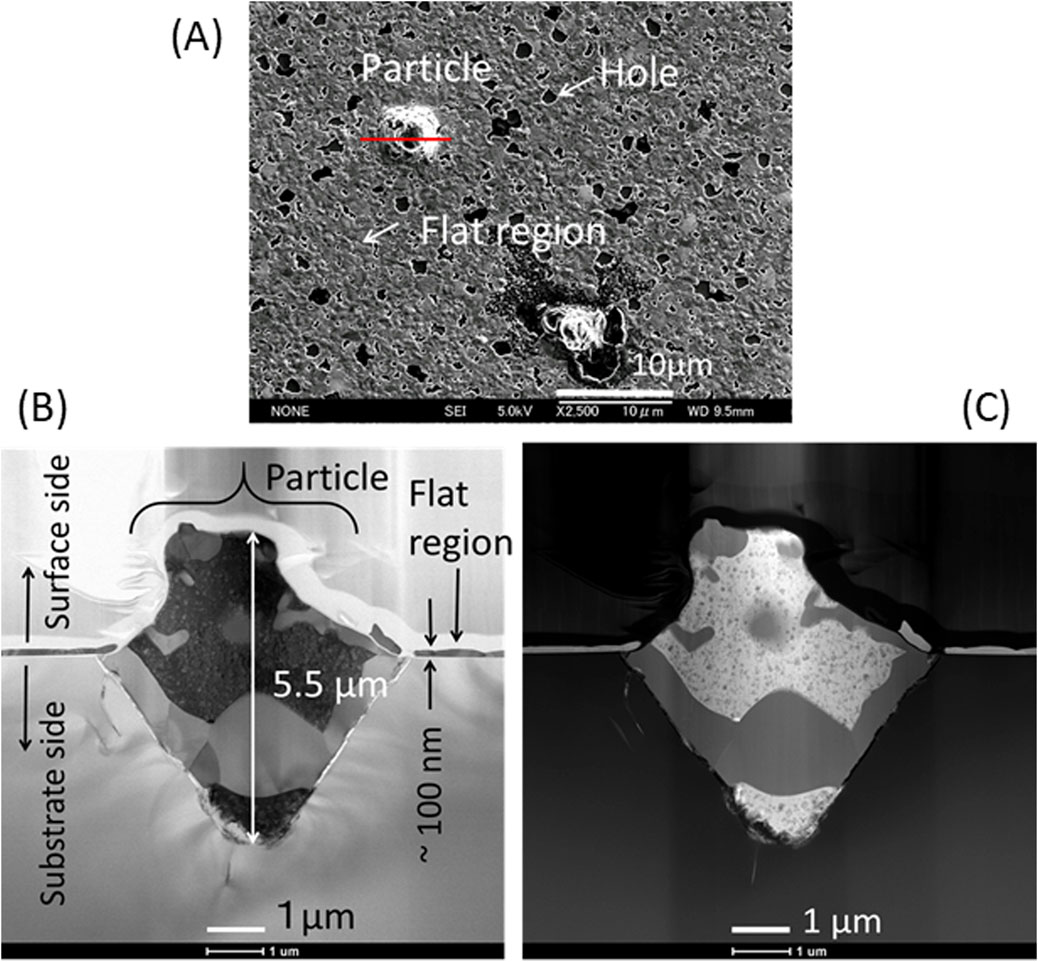
Figure 12. Cross sectional TEM observations for a particle of sample-2_ (Ar): (A) A SEM image of a particle from which a TEM test piece was cut along the red line; (B) A BF image of the cross section; (C) A HAADF image of the cross section.
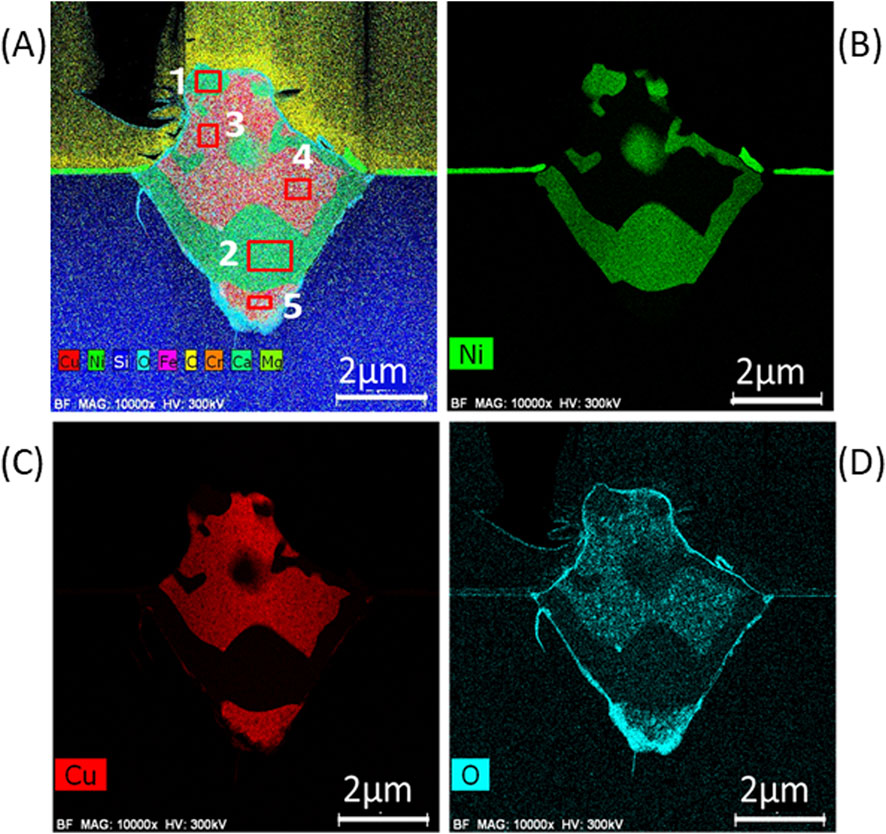
Figure 13. (A) 9 elements (Cu, Ni, Si, O, Fe, C, Cr, Ca, Mo) mapping for the cross section of the particle shown in Figure 12; (B) Ni element mapping; (C) Cu element mapping; (D) O element mapping.

Table 4. Concentrations of the elements for the numbered-square area (Figure 13A) by STEM-EDX.
When a Ni-Cu multilayer sample was heated in the atmosphere without hydrogen, interatomic diffusion between Ni and Cu layers did not occur; instead, more Cu atoms in the Cu layer migrated with increasing temperature. At 900°C, which is fairly close to the melting point of Cu (1085°C), Cu atoms migrated and agglomerated at an irregular site such as a pin hole in the multilayer film. After Cu had begun agglomerating at the site, Cu atoms accumulated on the surface and penetrated into substrate side along the (111) plane of the Si crystal. The Cu agglomeration proceeded until the thickness of the Cu layer decreased to approximately half of its initial value of 2 nm. This result indicates that the flat region of sample 2_Ar maintained a multilayer structure, which is approximately denoted as 6 × {Ni (∼14 nm)/Cu (∼1 nm)}, although the modified multilayer structure was not clearly observed in the TEM image of Figure11C.
4 Discussion
4.1 Effect of hydrogen on the alloying behavior of the Ni-Cu multilayer
In the AHG experiments using hydrogen gas and a material system of a Ni-Cu multilayer film formed on a Ni sheet, AHG was triggered by rapidly heating the hydrogen-preloaded system to several hundred °C and simultaneously evacuating the chamber in which the system was set (Iwamura et al., 2024). This experiment was based on a hypothesis that a hydrogen flux diffusing through the Ni-Cu interface is one of the key factors to induce the AHG phenomenon. Hydrogen atoms absorbed in the Ni-Cu multilayer system including a Ni substrate are forced to diffuse by the rapid heating and simultaneous evacuation. Then, AHG is expected to be triggered if the flux of hydrogen through the multilayer exceeds a critical value. Hydrogen atoms are expected to be trapped at the interface of the multilayer, because an interface generally involves imperfections such as vacancies, dislocations, voids, impurities, which work as hydrogen-trapping sites (Angelo et al., 1995; Iwamura et al., 2024). Based on these assumptions, it is considered from materials point of view that the multilayer structure is also a key factor for inducing AHG. Therefore, in the case of Ni-Cu multilayer system, in order to prevent the interface from disappearing, alloying reaction between Ni and Cu layers should be suppressed.
In the present experiment, the structure of a nano-sized Ni-Cu multilayer film was greatly affected by the atmosphere in which the film was heated up to 900°C for the first time after the deposition of the multilayer. In the atmosphere containing hydrogen, the multilayer eventually became a single-layer of a Ni-Cu alloy with the nominal composition. This system may not be good for generating anomalous heat because there is no interface in the surface layer. This result may be true even if the substrate is Ni, i.e. an {∼100 nm single-layer of FCC Ni0.88Cu0.12 alloy on a Ni substrate} system may hardly generate anomalous heat because there is only one interface between the single-layer and the Ni substrate. Furthermore, only one interface would disappear in a short time during an AHG operation because in this case, alloying between the single-layer of Ni0.88Cu0.12 alloy and the Ni substrate should easily proceed and Cu would be diluted in Ni. Then, the system would become similar to a Ni substrate, which was used as a reference material that generated almost no anomalous heat in AHG experiments (Kasagi et al., 2023).
In addition, the present experiment found that the Ni-Cu multilayer structure was maintained up to 900°C, if the system was heated in an atmosphere without hydrogen after forming the multilayer structure. In this case, the surface after cooling to room temperature from 900°C consisted of flat regions with a modified multilayer structure of 6 × {Ni(∼14 nm)/Cu(∼1 nm)}, many particles with sizes around ∼5 μm and many holes with sizes of 0.5 ∼5 μm. The surface structure achieved by heating the system to 900°C was thermally stabilized, and the structure was not easily altered even in a hydrogen-containing atmosphere if the temperature was below 900°C. In this case, the interface between Ni and Cu layers similar to the initial one was suggested to be maintained in the flat region, although the thickness of the Cu layer decreased to approximately half of the initial value. The reduced Cu atoms agglomerated at an irregular site such as a pin hole in the multilayer film to form a particle with a mountain shape. TEM observations showed that the particle sank deep into the substrate and formed a square pyramid by folding several domains. Therefore, there were interfaces in the particles because the particles were formed by folding several domains of different metal compositions.
These features of structural and compositional changes with temperature may be similar even when the substrate is changed from Si to Ni. Therefore, to generate anomalous heat, the multilayer system should be heated to approximately 900°C in an atmosphere without hydrogen immediately after its construction. This pre-heat treatment is expected to stabilize the Ni-Cu multilayer structure and suppress the alloying reaction to proceed in the subsequent processes to stimulate the AHG. Hydrogen charging should be performed afterwards. The typical experimental procedure in AHG experiments until now is as follows (Iwamura et al., 2022, Iwamura et al., 2024; Itoh, T. et al., 2022): nano-structured metal multilayer composite samples are placed in a chamber and baked for 2–3 days at 900°C in a vacuum atmosphere (base pressure <10−6 Pa). After this baking process, hydrogen gas is introduced into the chamber to load the sample with hydrogen. Therefore, the baking process in the AHG experiments corresponds to the present experimental condition in sample-2 where the sample temperature was increased to 900°C for the first time after deposition in an atmosphere without hydrogen. The difference is that the atmosphere without hydrogen was Ar in the present experiment and vacuum in actual AHG experiments.
4.2 Surface morphology and hot spot for AHG
Due to the baking process at 900°C in a hydrogen-free atmosphere, many particles are produced even when a Ni sheet is used as the substrate instead of a Si wafer. In an atmosphere without hydrogen, interdiffusion between Cu layer and Ni layer including the Ni substrate will not occur even at 900°C. Therefore, a multilayer structure similar to the initial multilayer structure will remain even when the temperature reaches 900°C. Cu atoms in the Cu layer actively migrate in the Cu layer when the temperature approaches the melting point of Cu. Similar to the case of the Si-substrate, Cu atoms agglomerate at an irregular point such as a pin hole of the multilayer film and form a mountain-shape particle on the surface. At the same irregular point, Cu atoms penetrate into the Ni substrate along a specific crystal plane of Ni. Thus, many particles will be randomly produced on the surface. If the particles are formed by folding several domains of different metal compositions, anomalous heat may be generated at the particles. Therefore, because the flat region contains interfaces between Ni layer and reduced Cu layer and the particles contain interfaces between domains of different metal compositions, both flat region and particles may be hot spots for AHG. In the recent report by Iwamura et al. (2024), regions of high oxygen concentration (RHOCs) were observed on the surface of samples that exhibited better AHG performance. RHOCs were randomly distributed on the surface with sizes of approximately 5 μm (Iwamura et al., 2024). The appearance of RHOCs appears similar to the particles in the present experiment. The average oxygen concentration at the particles was more than 3 times larger than that at flat regions, as shown in Table 1. Therefore, the particles might more efficiently function as hot spots than the flat regions.
5 Conclusion
(1) A multilayer film of 6 × {Ni(14 nm)/Cu(2 nm)} deposited on an α-SiO2-coated Si wafer was suggested to eventually become an ∼100 nm-single-layer film of a FCC alloy with a nominal composition of Ni0.88Cu0.12, when the system was heated to temperatures above 600°C in an atmosphere with hydrogen. In this case, the initial multilayer system loses the potential for AHG according to the assumption that AHG is triggered by a flux of hydrogen passing through or traveling along an interface formed by different metals or alloys.
(2) When the multilayer system was heated to approximately 900°C in an atmosphere without hydrogen immediately after the multilayer film had formed, the initial multilayer structure was modified such that the thickness of the Cu layer decreased to ∼1/2 of the initial value, i.e., 6 × {Ni (∼14 nm)/Cu (∼1 nm)}, and many particles were randomly distributed on the surface. The particles were typically ∼5 μm in size and consisted of several Cu-rich and Ni-rich domains that overlapped one another. In this case, the particles as well as the flat regions were suggested to have metallic interfaces, and may be candidate hot spots for AHG. For the system of Ni-Cu multilayer on Ni sheet, the pretreatment of baking in a hydrogen-free environment at a high temperature like 900°C immediately after the film formation is suggested advantageous to induce AHG.
(3) In an atmosphere with hydrogen, the change in the Ni-Cu multilayer structure with temperature was attributed to the ease of abundant vacancy formation in metals with dissolved hydrogen, which enhanced the interdiffusion among atoms in the Ni and Cu layers.
(4) In a hydrogen-free atmosphere, the surface structure achieved by heating the Ni-Cu multilayer system to approximately 900°C is considered because Cu has a significantly lower melting point than Ni. A combination of metals with significantly different melting points may be effective for preserving the bimetallic interface at high temperatures.
Data availability statement
The original contributions presented in the study are included in the article/supplementary material, further inquiries can be directed to the corresponding author.
Author contributions
TH: Investigation, Methodology, Writing–original draft, Data curation. YI: Conceptualization, Investigation, Project administration, Writing–original draft. TI: Conceptualization, Investigation, Methodology, Writing–original draft. MS: Formal Analysis, Writing–review and editing, Methodology. SY: Formal Analysis, Writing–review and editing, Data curation. TT: Methodology, Writing–review and editing, Investigation. JK: Project administration, Supervision, Conceptualization, Writing–original draft.
Funding
The author(s) declare that no financial support was received for the research, authorship, and/or publication of this article.
Acknowledgments
TH would like to thank Dr. S. Towata, Dr. T. Noritake, Prof. T. Motohiro and Prof. M. Kawasumi for valuable discussions.
Conflict of interest
Authors TH, TI, MS, SY, and TT were employed by Clean Planet Inc.
The remaining authors declare that the research was conducted in the absence of any commercial or financial relationships that could be construed as a potential conflict of interest.
Publisher’s note
All claims expressed in this article are solely those of the authors and do not necessarily represent those of their affiliated organizations, or those of the publisher, the editors and the reviewers. Any product that may be evaluated in this article, or claim that may be made by its manufacturer, is not guaranteed or endorsed by the publisher.
References
Alexandrov, D. (2021). Low-energy nuclear fusion reactions in solids: experiments. Int. J. Energy Res. 45 (8), 12234–12246. doi:10.1002/er.6356
Angelo, J. E., Moody, N. R., and Baskes, M. I. (1995). Trapping of hydrogen to lattice defects in nickel. Model. Simul. Mater. Sci. Eng. 3, 289–307. doi:10.1088/0965-0393/3/3/001
Arata, Y., and Zhang, Y. (2008). The establishment of solid nuclear fusion reactor. J. High. Temp. Soc. 34, 85–93. doi:10.7791/jhts.34.85
Celani, F., Marano, E. F., Ortenzi, B., Pella, S., Bartalucci, S., Micciulla, F., et al. (2014). Cu-Ni-Mn alloy wires, with improved sub-micrometric surfaces, used as LENR device by new transparent, dissipation-type calorimeter. J. Condens. Matter Nucl. Sci. 13 (1), 56–67.
Celani, F., Spallone, A., Lorenzetti, C., Purchi, E., Fiorilla, S., Cupellini, S., et al. (2022). Electromagnetic excitation of coaxially-coiled constantan wires by high-power, high-voltage, microsecond pulses. J. Condens. Matter Nucl. Sci. 36 (1), 408–435.
Cheng, T., Fang, D., and Yang, Y. (2017). A temperature-dependent surface free energy model for solid single crystals. Appl. Surf. Sci. 393, 364–368. doi:10.1016/j.apsusc.2016.09.147
Cho, S., Kim, Y., DiVenere, A., Wong, G. K., Ketterson, J. B., and Hong, J.-I. I. (1999). Bi/Sb superlattices grown by molecular beam epitaxy. J. Vac. Sci. Technol. A 17, 2987–2990. doi:10.1116/1.581971
Denton, A. R., and Ashcroft, N. W. (1991). Vegard's law. Phys. Rev. A 43 (6), 3161–3164. doi:10.1103/PhysRevA.43.3161
Fukumuro, N., Yokota, M., Yae, S., Matsuda, H., and Fukai, Y. (2013). Hydrogen-induced enhancement of atomic diffusion in electrodeposited Pd films. J. Alloys Compd. 580, 555–S57. doi:10.1016/j.jallcom.2013.02.111
Fullerton, E. E., Schuller, I. K., Vanderstraeten, H., and Bruynseraede, Y. (1992). Structural refinement of superlattices from x-ray diffraction. Phys. Rev. B 45 (16), 9292–9310. doi:10.1103/PhysRevB.45.9292
Hayashi, E., Kurokawa, Y., and Fukai, Y. (1998). Hydrogen-induced enhancement of interdiffusion in Cu-Ni diffusion couples. Phys. Rev. Lett. 80, 5588–5590. doi:10.1103/PhysRevLett.80.5588
Hioki, T., Takahashi, N., Kosaka, S., Nishi, T., Azuma, H., Hibi, S., et al. (2013). Inductively coupled plasma mass spectrometry study on the increase in the amount of Pr atoms for Cs-Ion-Implanted Pd/CaO multilayer complex with deuterium permeation. Jpn. J. Appl. Phys. 52, 107301. doi:10.7567/JJAP.52.107301
Huang, Y. C., Fujita, K., and Uchida, H. (1979). Phase diagrams of metal-hydrogen systems. Bull. Jpn. Inst. Metals 18 (10), 694–703. doi:10.2320/materia1962.18.694
Iida, T., Yamazaki, Y., Kobayashi, T., Iijima, Y., and Fukai, Y. (2005). Enhanced diffusion of Nb in Nb–H alloys by hydrogen-induced vacancies. Acta Mater. 53, 3083–3089. doi:10.1016/j.actamat.2005.02.049
Itoh, T., Shibasaki, Y., Takahashi, T., Saito, M., Kasagi, J., and Iwamura, Y. (2022). Optical observation of spontaneous heat burst phenomena during hydrogen desorption from nano-sized metal composite. J. Condens. Matter Nucl. Sci. 36 (1), 274–284.
Iwamura, Y., Ito, T., Kasagi, J., Murakami, S., and Saito, M. (2020). Excess energy generation using a nano-sized multilayer metal composite and hydrogen gas. J. Condens. Matter Nucl. Sci. 33, 1–13.
Iwamura, Y., Itoh, T., Kasagi, J., Kitamura, A., Takahashi, A., Takahashi, K., et al. (2019). Anomalous heat effects induced by metal nano-composites and hydrogen gas. J. Condens. Matter Nucl. Sci. 29, 119–128.
Iwamura, Y., Itoh, T., Yamauchi, S., and Takahashi, T. (2024). Anomalous heat generation that cannot be explained by known chemical reactions produced by nano-structured multilayer metal composites and hydrogen gas. Jpn. J. Appl. Phys. 63, 037001. doi:10.35848/1347-4065/ad2622
Iwamura, Y., Kasagi, J., Itoh, T., Takahashi, T., Saito, M., Shibasaki, Y., et al. (2022). Progress in energy generation research using nano-metal with hydrogen/deuterium gas. J. Condens. Matter Nucl. Sci. 36 (1), 285–301.
Iwamura, Y., Sakano, M., and Itoh, T. (2002). Elemental analysis of Pd complexes: effects of D2 gas permeation. Jpn. J. Appl. Phys. 41, 4642–4650. doi:10.1143/JJAP.41.4642
Jones, F. G., and Pehlke, R. D. (1971). Solubility of hydrogen in solid Ni-Co and Ni-Cu alloys. Metall. Trans. 2, 2655–2663. doi:10.1007/BF02814909
Kano, H., Kagawa, K., Suzuki, A., Okabe, A., Hayashi, K., and Aso, K. (1993). Substrate temperature effect on giant magnetoresistance of sputtered Co/Cu multilayers. Appl. Phys. Lett. 63, 2839–2841. doi:10.1063/1.110791
Kasagi, J., Itoh, T., Shibasaki, Y., Takahashi, T., Yamauchi, S., and Iwamura, Y. (2023). Photon radiation calorimetry for anomalous heat generation in NiCu multilayer thin film during hydrogen gas desorption. doi:10.48550/arXiv.2311.18347
Kitamura, A., Miyoshi, Y., Sakoh, A., Taniike, A., Furuyama, Y., Takahashi, A., et al. (2014). Recent progress in gas-phase hydrogen absorption/adsorption experiments. J. Condens. Matter Nucl. Sci. 13, 277–289.
Kitamura, A., Nohmi, T., Sasaki, Y., Taniike, A., Takahashi, A., Seto, R., et al. (2009). Anomalous effects in charging of Pd powders with high density hydrogen isotopes. Phys. Lett. A 373, 3109–3112. doi:10.1016/j.physleta.2009.06.061
Kitamura, A., Takahashi, A., Takahashi, K., Seto, R., Hatano, T., Iwamura, Y., et al. (2018). Excess heat evolution from nanocomposite samples under exposure to hydrogen isotope gases. Int. J. Hydrogen Energy 43, 16187–16200. doi:10.1016/j.ijhydene.2018.06.187
Takahashi, A., Ido, H., Hattori, A., Seto, R., Kamei, A., Hachisuka, J., et al. (2020). Latest progress in research on AHE and circumstantial nuclear evidence by interaction of nano-metal and H (D)-gas. J. Condens. Matter Nucl. Sci. 33 (1), 14–32.
Tanzella, F., Godes, R., Liu, J., and George, R. (2020). Mass and heat flow calorimetry in Brillouin’s reactor. J. Condens. Matter Nucl. Sci. 33 (1), 33–45.
van Ingen, R. P., Fastenau, R. H. J., and Mittemeijer, E. J. (1994). Laser ablation deposition of Cu-Ni and Ag-Ni films: nonconservation of alloy composition and film microstructure. J. Appl. Phys. 76, 1871–1883. doi:10.1063/1.357711
Westlake, D. J. (1983). Site occupancies and stoichiometries in hydrides of intermetallic compounds: geometric considerations. J. Less-Common Metals 90, 251–273. doi:10.1016/0022-5088(83)90075-9
Keywords: Ni-Cu multilayer, interface, hydrogen, anomalous heat, in-situ XRD, atmosphere, high temperature, structure
Citation: Hioki T, Iwamura Y, Itoh T, Saito M, Yamauchi S, Takahashi T and Kasagi J (2024) Changes in the structure and composition of nano-sized Ni-Cu multilayer films with increasing temperature in an atmosphere with and without hydrogen. Front. Mater. 11:1407810. doi: 10.3389/fmats.2024.1407810
Received: 27 March 2024; Accepted: 27 November 2024;
Published: 19 December 2024.
Edited by:
Dhiren Kumar Pradhan, The University of Tennessee, Knoxville, United StatesReviewed by:
Dimiter Alexandrov, Lakehead University, CanadaProloy Taran Das, Helmholtz Association of German Research Centres (HZ), Germany
Proloy Taran Das, Helmholtz Association of German Research Centres (HZ), Germany
Copyright © 2024 Hioki, Iwamura, Itoh, Saito, Yamauchi, Takahashi and Kasagi. This is an open-access article distributed under the terms of the Creative Commons Attribution License (CC BY). The use, distribution or reproduction in other forums is permitted, provided the original author(s) and the copyright owner(s) are credited and that the original publication in this journal is cited, in accordance with accepted academic practice. No use, distribution or reproduction is permitted which does not comply with these terms.
*Correspondence: T. Hioki, aGlva2lAY2xlYW5wbGFuZXQuY28uanA=
 T. Hioki
 Y. Iwamura
 T. Itoh1,3
 J. Kasagi