
94% of researchers rate our articles as excellent or good
Learn more about the work of our research integrity team to safeguard the quality of each article we publish.
Find out more
ORIGINAL RESEARCH article
Front. Mater., 13 February 2024
Sec. Polymeric and Composite Materials
Volume 11 - 2024 | https://doi.org/10.3389/fmats.2024.1358630
This article is part of the Research TopicNano Science and Technology in Concrete CompositesView all 5 articles
 Yunhui Fang1,2,3
 Zhaopeng Wang1Dongming Yan3*Huazhen Lai1Xiuxing Ma1Junying Lai3
 Yi Liu4Lina Zhong1Zhanhua Chen1Xiaofang Zhang1Zhijun Lin1Dongye Wang5
A series of polycarboxylate superplasticizers (PCEs) with different side-chain densities, main chain polymerization degrees, and side-chain lengths were designed and synthesized using a novel highly active ethylene glycol mono vinyl ether polyethylene glycol as the ether monomer. The influence of polycarboxylate ether on the rheological properties, interface adsorption, and hydration characteristics in cement paste was investigated through characterization of charge density, rheological properties, adsorption behavior, and hydration heat. The results indicate that the adsorption process of PCE on cement particles is spontaneous physical adsorption, and the hydration kinetics fitting reveals that the geometric crystal growth exponent n is in the range of 1–2, with needle-like and lamellar hydration products formed. With a decrease in side-chain density, the broadening of molecular weight distribution and the increase of charge density accelerate the flow of slurry, reduces saturation adsorption, and delays cement hydration. A decrease in main chain polymerization degree results in a downward trend in molecular weight and charge density, leading to larger molecular conformations, reduced slurry flow, decreased saturation adsorption, and delayed cement hydration. As the side-chain length of PCE (molecular weight) increases, the charge density decreases, and the molecular conformation exhibits a compact structure with reduced slurry flow, decreased saturation adsorption, and delayed cement hydration. In cases of low side-chain density, short side chains, and low molecular weight, enhanced adsorption capacity and faster adsorption rates are observed, resulting in the lower viscosity and a delay in the cement hydration process.
With the rapid development of the economy, large-scale infrastructure projects (such as super high-rise buildings, landmark buildings, bridges, tunnels, etc.) are accelerating their landing, and modern concrete plays a key role. Concrete admixtures are closely related to modern concrete technology, which not only affects the workability of concrete in the fresh state but also improves the structure of hardened concrete at the micro and sub-micro level, thus meeting the requirements of construction performance, mechanical performance, and durability of concrete.
Polycarboxylate superplasticizer (PCE) (Ng et al., 2020; Li et al., 2021; Xu et al., 2021) as an important concrete admixture is currently most commonly used as a large monomer, which can be mainly divided into two types: polyester-based and ether-based. The following three types of large monomers are commonly used: The first type is the traditional polyester-based monomer, represented by methoxy polyethylene glycol ether (MPEG) (Tian Y F et al., 2014), which is mainly prepared by esterification and polymerization reactions, with complex processes, low efficiency, and low polymerization activity. The second type is the traditional ether-based monomer, represented by allyl polyethylene glycol ether (APEG), isobutylene polyethylene glycol ether (HPEG), and isopentenyl polyethylene glycol ether (TPEG), but the retention rate of double bonds is relatively low (90%), which has a negative impact on monomer conversion, resulting in lower molecular weight of PCE (Zhao et al., 2018). The third type is a new type of ether-based monomer, ethylene glycol mono ethylene ether polyethylene glycol (EPEG) (Cui et al., 2022), which has higher polymerization activity and is currently in the early stage of application promotion, and there are still many technical aspects of preparation and application that need to be further studied.
The polymerization activity of polyether is affected by the distribution of electronic cloud density, as shown in Table 1, where the impact of different substituent groups on the distribution of electronic cloud density on double bonds is presented. The new EPEG monomer forms an ethylene ether bond structure with a stronger electron-donating effect from the alkoxyl group than traditional monomers with an alkoxyl structure, leading to a more significant influence on the electronic cloud density on the double bond and a larger deviation tendency in the electronic cloud distribution, resulting in an increased double bond activity (Liu, 2020), which increases the polymerization activity of EPEG monomer. Liu et al. (2020) prepared an uneven block copolymer PCE with EPEG by free radical copolymerization. The results showed that compared to traditional PCE, EPEG monomer has a higher copolymerization activity, which can significantly reduce the copolymerization temperature, shorten the production cycle, improve copolymerization efficiency and have better dispersibility in cement slurries. Wang et al. (2020) conducted free radical copolymerization reactions of three monomers, APEG, IPEG, and EPEG, with acrylic acid, and prepared copolymers with low conversion rate (<15%) to calculate the polymerization activity of monomers based on the competing reaction rates. The experimental results showed that EPEG monomer had a higher reactivity ratio and displayed higher activity in the chain growth stage.
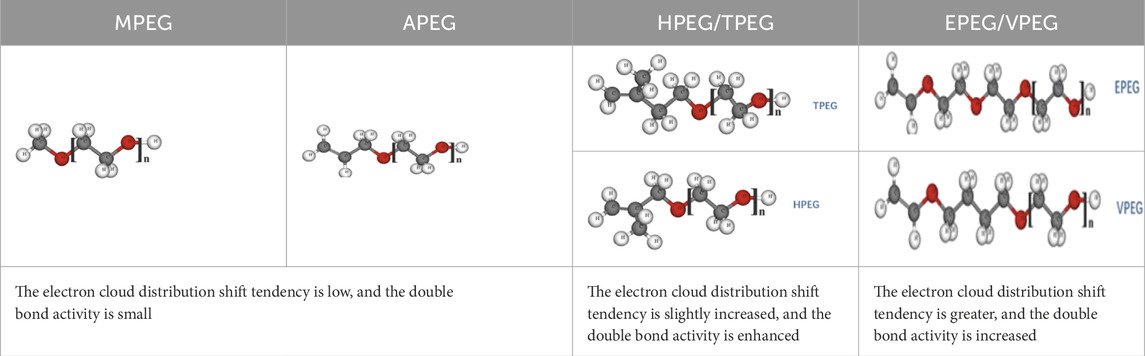
TABLE 1. Chemical structures of different polyether monomers.
The complex molecular structure and designability of PCE determine its molecular conformation, interfacial adsorption state, rheological and dispersing properties in cement hydration environment, which are affected by different main chain polymerization degree, main chain charge density, side chain type, side chain length, and side chain branching density (Ran et al., 2010a). Studies by Ran et al. (2010b) have found that the side chain density structure of the water-reducing agent has a significant impact on its adsorption and dispersing ability. Researchers such as Zingg et al. (2009); Ran et al. (2019); Ng and Plank, (2012); Ran Q. et al. (2010); Winnefeld et al. (2007) have shown that as the side chain density of PCE increases, its adsorption performance on cement particles decreases. Research by Ji et al. (2020) has shown that PCE with longer side chains can better disperse cement particles in cement slurry due to its significant steric hindrance effect and high charge density. Kinoshita and Nawa, (2000) found that the shorter the side chain length, the slower the adsorption rate, but the better the dispersion stability. Yamada et al. (2000) believes that the longer the side chain length, the faster the cement hydration progresses, resulting in poorer flow retention. However, scholars such as Wu, (2012); He et al. (2018) believe that the longer the side chain length, the stronger the electrostatic repulsion and steric hindrance effects, resulting in better-dispersing ability. The reason why different researchers have reached different conclusions is that the main chain adsorption group content or type of copolymers with different side chain lengths are different, resulting in completely different rheological and interfacial adsorption properties on cement. Therefore, it is necessary to comprehensively analyze the influence of different microstructures of EPEG-type PCE on the performance of cement slurry.
The rheological properties of cement slurries directly impact the workability of concrete. Various factors influence the rheological properties of cement slurries, such as cement particle concentration or density, particle size distribution, temperature, pH value, electrolyte concentration, auxiliary cementitious materials, and chemical admixtures, among others. Rheological models are the most direct means to evaluate the rheological performance of cement slurries, as indicated in Table 2 for commonly used rheological models (Nazar et al., 2020).
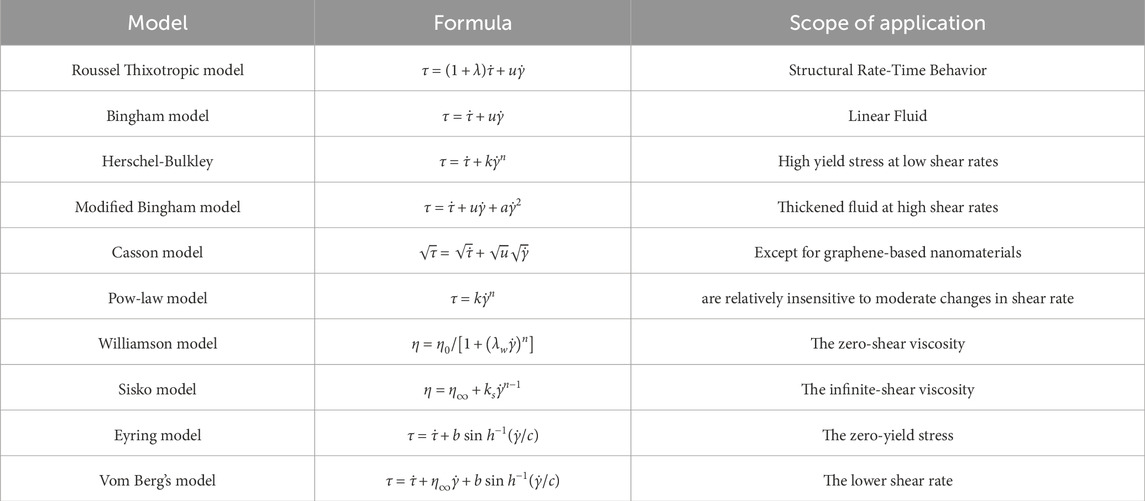
TABLE 2. Common fundamental rheological models.
Qian et al. (2018) analyzed the dispersibility and viscosity reduction effects of polycarboxylate ether (PCE) by combining the Herschel-Bulkley model and found that reducing the molecular weight and side chain length of PCE and introducing hydrophobic groups could improve the dispersibility and viscosity reduction effect. Huo et al. (2017) balanced the dispersibility and viscosity reduction performance of PCE by controlling the length of the main chain and prepared a polycarboxylate-based water reducer with good dispersibility and viscosity reduction performance. Liu (2013) believed that increasing the carboxyl density would lead to an increase in shear stress and apparent viscosity, which would promote cement hydration. In addition, the effects of modifying the monomer molar ratio, side chain length, and anionic anchoring groups on the rheological properties of fresh cement paste have also been reported. Yamada et al. (2000) found that polymers with longer PEG side chains, lower main chain polymerization degrees, and higher sulfonic acid contents had higher dispersibility, smaller yield stress, and plastic viscosity of cement paste, indicating better rheological properties. Yu et al. (2020) showed that PCE had an optimal molecular weight range, and the residual viscosity of the cement paste decreased gradually with the increase of PCE molecular weight, resulting in the fluctuation of rheological properties. It is generally believed that PCE with short side chains and high carboxyl density has higher adsorption and dispersibility in mortar, while PCE with long side chains reduces the plastic viscosity of mortar, indicating better rheological properties (Feng et al., 2021).
The basis of PCE interaction with cement particles is adsorption. After PCE adsorbs on the surface of cement particles, it changes the physical and chemical properties of the surface, destroys the flocculation structure between cement particles, and temporarily maintains them in a stable state of uniform distribution, thereby improving the rheological properties, structure, and uniformity of fresh cement paste. The adsorption of PCE on cement particles exists in three forms. Firstly, it participates in the formation of hydration products, affecting the structure and morphology of hydration products. Secondly, it adsorbs on the surface of cement particles or hydration products to form an adsorption layer, mainly dispersing cement particles. Thirdly, it remains in the solution, maintaining a dynamic balance with the adsorption layer and supplementing the water reducer consumed by cement hydration (Zingg, 2008). Therefore, the dispersing effect of PCE on cement is mainly due to the second part, and the adsorption amount generally refers to the sum of the first and second parts.
The PCE has a direct or indirect impact on the hydration of cement in all stages due to its different adsorption amounts, adsorption forms, and adsorption equilibria. Cement hydration mainly consists of five stages (Zhang, 2011; Han, 2015). During the early induction period, gypsum dissolves rapidly in water, and the first heat release peak is formed. During the induction period, C-S-H and CH are in the nucleation stage. During the acceleration period, the hydration of tricalcium silicate (C3A) mainly occurs, forming the second heat release peak. During the deceleration period, the transformation of AFt to AFm occurs, and the generated hydration products fill the space between cement particles, gradually forming a network structure. During the stable period, the cement hydration rate and cumulative heat release tend to be stable, and the microstructure gradually becomes denser, forming a hardened paste structure. Tian et al. (2019) studied the effect of PCE on the flowability and early hydration of Portland cement and sulfoaluminate cement systems, showing that PCE can significantly inhibit the early formation of AFt crystals in sulfoaluminate cement paste. Scrivener Karen L. et al. Studied the basic role of each stage of hydration and showed that the growth of the main hydration product C-S-H is the main factor controlling the main heat evolution peak as an explanation of the induction period based on geochemical dissolution theory (Scrivener et al., 2015).
The impact of PCE on cement hydration varies depending on its different structures. Lei and Plank, (2014) found that the shorter the side chain and the lower the side chain density, the more severe the inhibitory effect of PCE on cement hydration. Zhang, (2019) believed that polyacrylic acid significantly inhibits the cement hydration process, and the adsorption capacity of PCE increases with the carboxyl content, showing the same rule for inhibiting cement hydration.
In summary, the molecular structure of polycarboxylate superplasticizers (side-chain density, main chain polymerization degree, side-chain length, etc.) determines their dispersion effect, fluidity, and adsorption state on cement particles. In this paper, a new type of polyether monomer EPEG was used to adjust the side chain density, side chain length, and main chain length, and EPEG-based polycarboxylate superplasticizers were designed and synthesized to systematically study the influence of PCE microstructure on the rheology, interfacial adsorption, and early cement hydration of cement paste.
Ethylene glycol monoethyl ether polyethylene glycol ether (EPEG, Mn 3,000 and 6,000) from Jiakai Chemical Co., Ltd.; Ethylene glycol monoethyl ether polyethylene glycol ether (EPEG, Mn 4,000) from Jiangyin Ruiji New Material Co., Ltd.; Acrylic acid (AA), hydrogen peroxide (HP), mercaptoethanol (ME), ascorbic acid (ASA), and ferrous sulfate heptahydrate (FeSO4·7H20, FSH) from Aladdin Reagent Co., Ltd. Deionized water was used for all experiments.
The cement used in this study was provided by China Building Materials Science Research Institute Co., Ltd., and its chemical composition was determined by X-ray fluorescence (XRF) and is listed in Table 3.
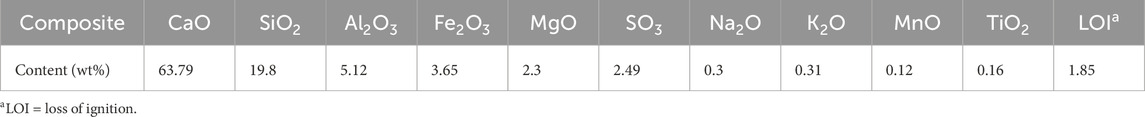
TABLE 3. Chemical composition of reference cement.
EPEG and H2O were added to a reaction vessel and heated with stirring for 30 min in a water bath to ensure the complete dissolution of the sample. The temperature was then lowered to 15°C, and the reaction was maintained at that temperature. Before the start of dripping, a certain amount of FSH and AA was added to the reaction vessel as co-initiators. The aqueous solution of acrylic acid, oxidant, and reductant was dripped into the flask at a constant rate, and the reaction continued for a period of time to complete free radical polymerization. After insulation, a PCE aqueous solution was obtained. The reaction schematic is shown in Figure 1 (Zhang et al., 2015), and the PCE synthesis and preparation are presented in Table 4. From Table 4, it is evident that by adjusting the acid-ether ratio, side-chain density PCE can be prepared, while controlling the chain transfer agent quantity allows for the preparation of main chain polymerization degree PCE. Additionally, side-chain length PCE can be prepared by manipulating the monomer’s molecular weight.

FIGURE 1. Schematic representation of the EPEG reaction.
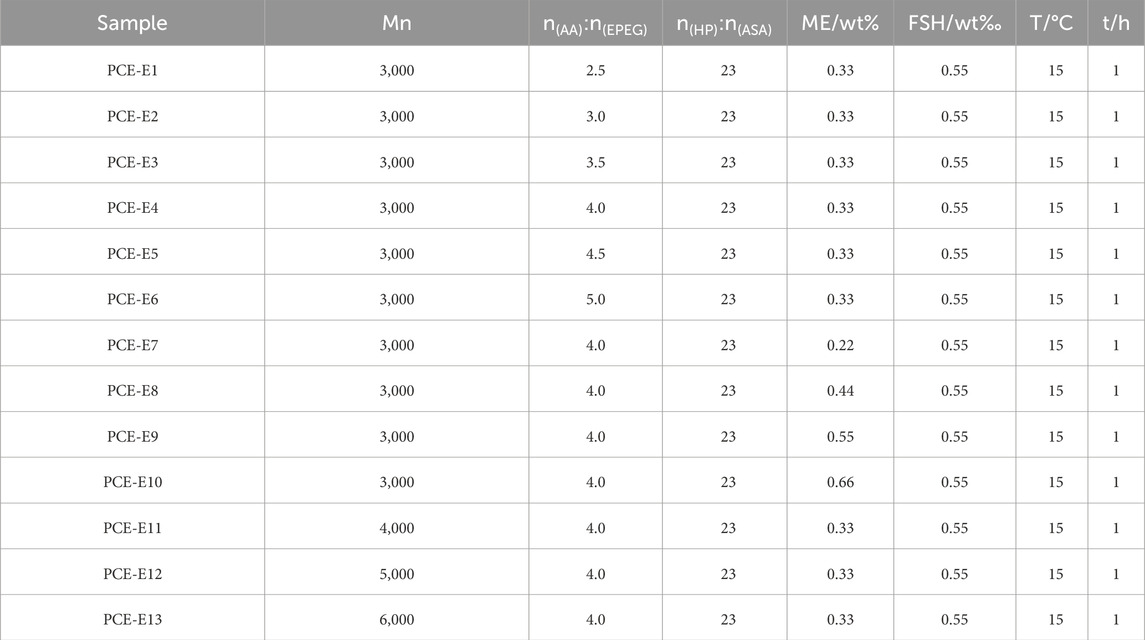
TABLE 4. Preparation of PCE.
PCE molecular weight and its conformation were determined by Gel Permeation Chromatography (GPC) using a gel permeation chromatograph (1,515, Waters, United States) equipped with a differential detector and a multi-detector system (Malvern Viscotek 270 Dual Detector) with viscosity and low angle laser light scattering detectors. Glucose polymers with different molecular weights were used as calibration standards and the flow rate was controlled at 0.5 ml/min. A 5 mg/ml PCE solution was prepared using a 0.1 mol/L sodium nitrate solution, and 0.2 ml of the sample was injected into the loop for detection.
The charge density of PCE was measured using a particle charge detector (PCD 05, Mütek Analytic, Germany) by titrating PCE (0.1wt%) with a 0.001 mol/L solution of poly (allylamine hydrochloride) in water.
Sample preparation: Cement slurries with a w/c of 0.29 were prepared according to the method in GB/T 8077-2012. PCE was added to the slurry at a dosage of 0.25 mg/g cement. Rheological measurements were performed using a rotational rheometer (Rheolab QC, Anton Paar, Austria), and the prepared cement slurry was immediately poured into the cylinder.
Test process: The instrument was stabilized at 20 °C for 60 s. Then, the sample was pre-sheared at 5 rad/min for 30 s to minimize the influence of thixotropy. After that, the shear rate increased from 0 to 131 rpm and was held for 1 min. Then, the shear rate was held at 131 rpm for 18 s, followed by a decrease from 131 to 0 rpm and an increase back to 131 rpm for 1 min. The experimental environment was maintained at a temperature of 20°C ± 2°C and humidity of 60 ± 5%. Each cement slurry was tested three times. The yield stress and viscosity were determined using the Bingham model formula (1).
Where τ is the shear stress (Pa);
Thixotropic behavior: During the rheological testing process, a closed loop formed by an increase in shear rate from 5 to 131 rpm followed by a decrease from 131 to 5 rpm is referred to as the thixotropic ring area.
Total organic carbon (TOC) analysis was performed using a TOC analyzer (Elementar, Germany) to determine the adsorption amount. The adsorption amounts of PCE at different concentrations and at different times were studied. Different concentrations of PCE solution were prepared, and 20 g of Portland cement was added to 40 ml of the PCE solution. After thorough mixing, an appropriate amount of the liquid was transferred to a centrifuge tube and centrifuged for 10 min at 5,000 r/min. The adsorption amount of polycarboxylate superplasticizer on cement particles was calculated according to Equation 2:
where
By employing an adsorption model, the adsorption performance of PCE was analyzed. Detailed formulas and parameters can be found in Table 5.
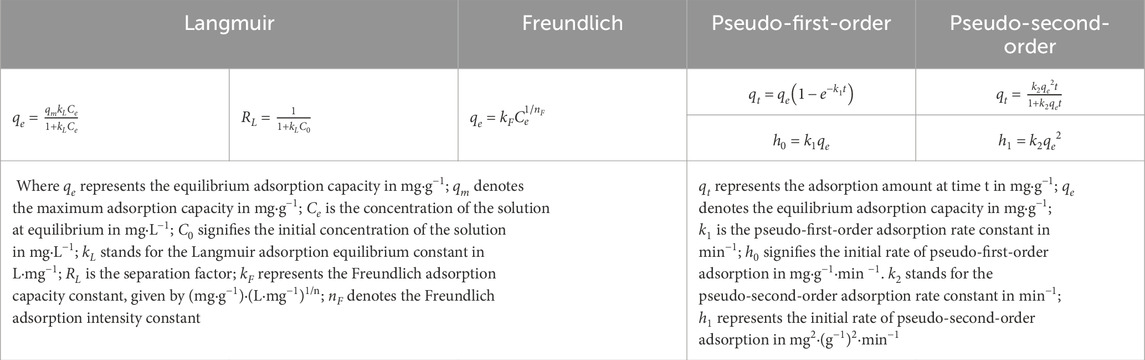
TABLE 5. The formulas and parameters of adsorption model.
The isothermal calorimetry (TAM air, TA, United States) was used to monitor the hydration heat curve of cement. Before the experiment, the TAM temperature was adjusted to 20°C, and the experimental materials were placed in a room at the same temperature for 24 h to reduce experimental errors. Deionized water and PCE (0.2wt%) were mixed with cement for 1 min, and the w/c ratio was fixed at 0.35. The prepared cement paste (3.0000 g) was placed in an ampoule with a volume of 20 ml, and the hydration heat was recorded for 72 h.
Test process: The blank sample (without PCE) and the experimental sample are placed into the instrument, followed by temperature setting. After reaching a stabilized baseline, a hydration test is conducted for 72 h.
By using a hydration kinetics model, the hydration reaction is divided into stages of crystallization nucleation and crystal growth (NG), phase boundary reaction (I), and diffusion reaction (D), corresponding to equations 3 and (4), (5):
where
The Cement slurries of fluidity test were according to GB/T 8077-2012 which was similar to section 2.3.3 in Sample preparation.
Molecular weight and its distribution are critical factors that affect the dispersibility of PCE in cement slurries. If the molecular weight is too small, it will affect the slump of the concrete, and if the molecular weight is too large, it will affect the dispersibility of the cement slurry. Therefore, PCE can exhibit good performance only when its molecular weight is within the appropriate range (Zhang et al., 2022). The gel permeation chromatography (GPC) test results of the prepared PCE are shown in Table 6.
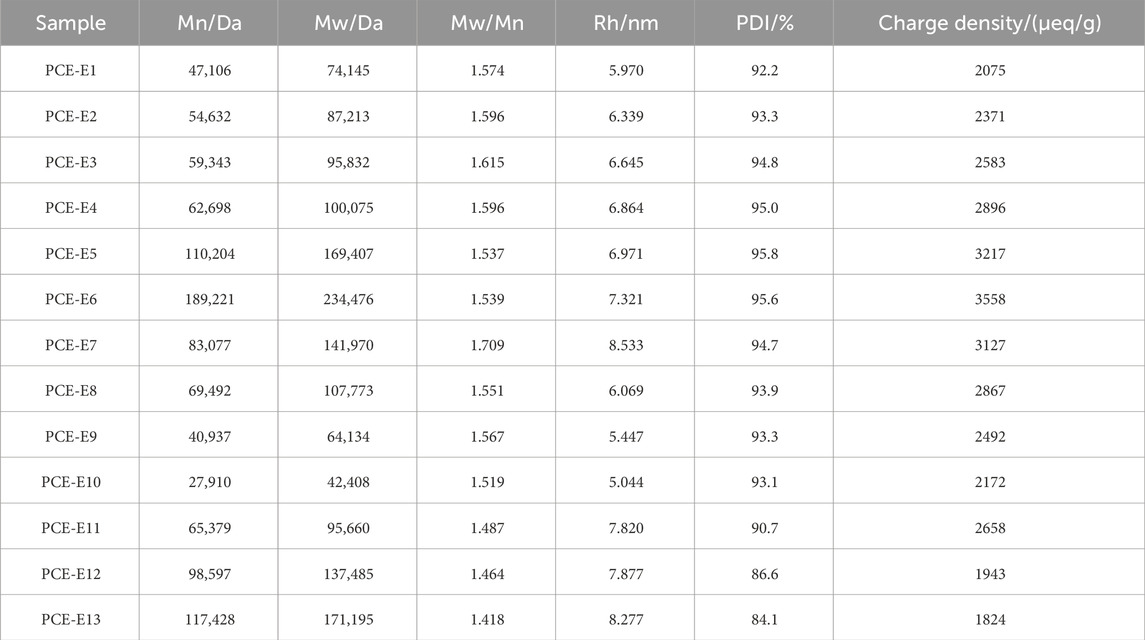
TABLE 6. GPC test data for PCE.
As the side chain density decreases, the Mn, Mw, Mn/Mw, conversion rate (PDI), and charge density of PCE show an increasing trend, and the hydrodynamic radius (Rh) gradually increases, indicating a more expanded structure. Due to the spatial steric hindrance between large monomers, a certain amount of small monomers must be interspersed between adjacent large monomers to compensate for this effect. In addition, the polymerization reaction rate of EPEG monomers with acrylic acid increases, leading to an increase in the length of the PCE main chain and a further increase in molecular weight, resulting in an increase in charge density in the PCE molecular structure. The changes in Mn/Mw and monomer conversion rate (both around 90%) among the samples are relatively small, indicating that the reaction between EPEG and AA is sufficiently complete when the acid ether ratio reaches 2.5.
In contrast, the trend of the main chain polymerization degree change is exactly opposite to that of side chain density. This is because, with an increase in ASA content, the number of chain-terminating free radicals in the solution increases, resulting in a decrease in polymerization degree, shortening of the PCE main chain, a decrease in molecular weight, and a reduction in carboxyl group content, resulting in a decrease in charge density. When the side chain is longer, its stretchability is affected, resulting in a higher viscosity and larger Rh, whereas when the side chain is shorter, the viscosity is smaller and Rh is correspondingly smaller. The trend of side chain length change is consistent with that of side chain density, except for the Mn/Mw, conversion rate, and charge density, which show a decreasing trend. This is because, at lower molecular weights, there are relatively fewer carboxyl groups in the PCE molecular structure, resulting in a low charge density and a reduction in the co-polymerization of AA and large monomers, leading to a decrease in monomer conversion rate and a larger Rh.
The Mark-Houwink curve is an important curve used to characterize polymer structure, the relevant formula (6) is as follows:
where
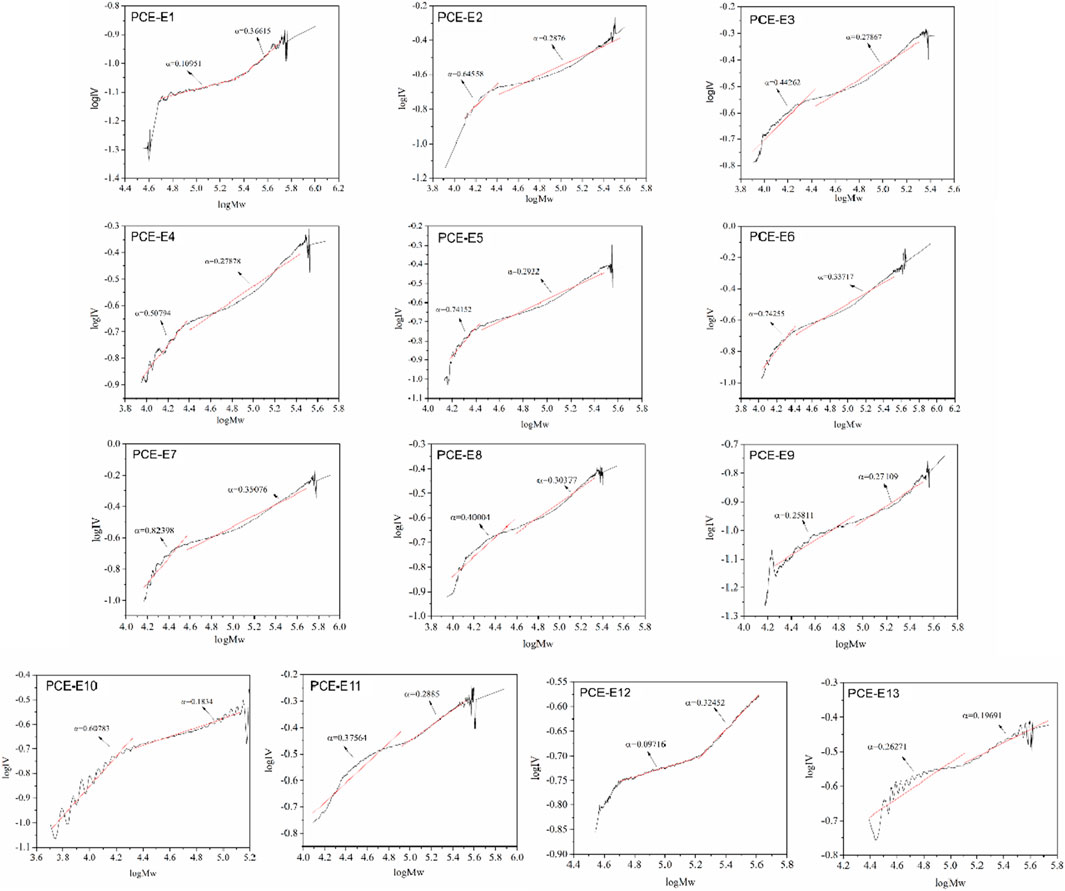
FIGURE 2. The Mark-Houwink curves and fitting curves of PCE with different microstructures.
From Figure 2, it can be seen that the Mark-Houwink curves for PCE with different side chain densities are not a straight line for the entire molecular weight range, indicating that the molecular conformation is not the same in different molecular weight segments. Therefore, the Mark-Houwink curve was fitted in segments. In the entire molecular weight range, α was less than 0.8 for all PCE samples, indicating that PCE is in a compact conformation or a flexible random coil conformation. This is because there are many carboxyl groups on the PCE molecular chain, which can ionize in an aqueous solution to produce a large number of charges. Electrostatic repulsion causes repulsion between molecular chain segments, making the molecular chain expand gradually from a compact conformation to a flexible random coil conformation. At low molecular weight, the flexibility of the molecular chain itself is greater than the electrostatic repulsion, resulting in a larger α value, tending towards a flexible random coil conformation. The similar conformation observed for different acid-ether ratios indicates that the conformational change is not affected by the acid-ether ratio.
According to PCE of different main chain polymerization degrees, α gradually decreases with the increase of ASA in the low molecular weight stage, because the molecular weight of PCE is larger when the main chain polymerization degree is short, the rotation ability of the molecular chain is poor, and the bending and stretching of the molecular chain are affected to some extent, and the α value decreases gradually from rigid chain to flexible chain and compact molecular chain. At the high molecular weight stage, the α trend is not obvious with the increase of the main chain polymerization degree, which may be because the molecular chain is more chaotic and irregular when the molecular weight is relatively high, indicating that different main chain polymerization degree has a greater effect on the molecular conformation.
From the different PCEs with varying side chain lengths, it can be observed that throughout the entire range of molecular weight, α values are all smaller than 0.3, indicating that the PCEs at different molecular weights are all densely packed in a compact structure. At low molecular weights, the α values are small because α is related to the type of PCE, and at low molecular weights, the flexibility of the polymer chain dominates. As the molecular weight increases, electrostatic repulsion between molecular chains occurs. Therefore, when the molecular weight is higher, the α value, which characterizes the compactness of the molecular configuration, will also increase, indicating a more irregular molecular configuration.
The effect of different microstructures of PCE on the rheological properties was studied. PCE dosage was 0.20% (by weight of cement), and the temperature was controlled at 20°C. The changes in the viscosity and yield stress of cement paste were measured at shear rates of 0–131 rpm. The yield stress and plastic viscosity of cement paste with different microstructures of PCE were fitted using rheological models, as shown in Figure 3 and Table 7.
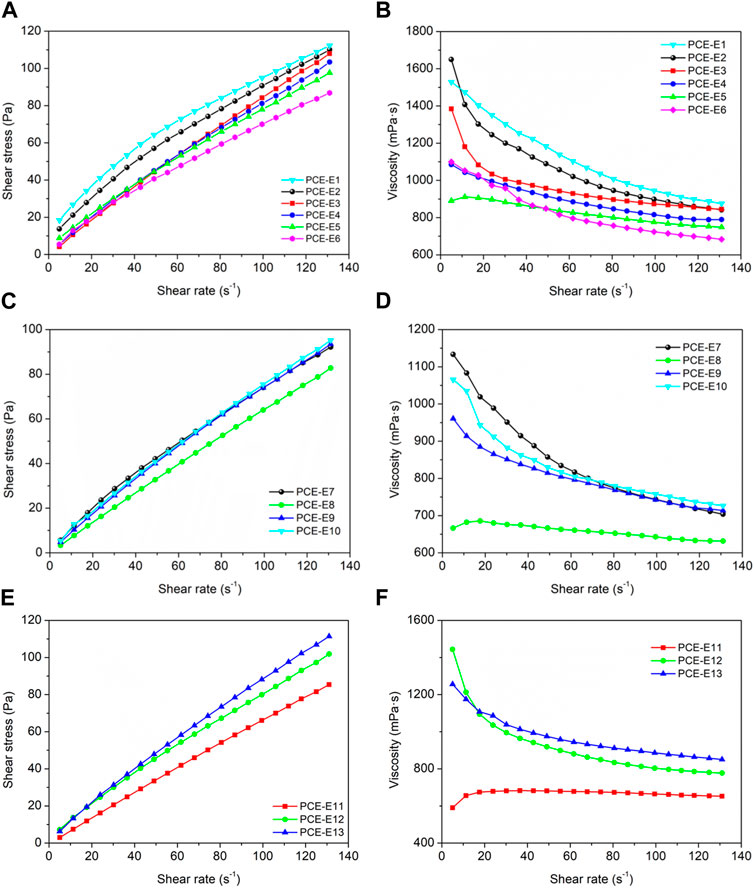
FIGURE 3. Influence of different PCE microstructures on the rheological properties of cementitious suspensions, (A, B) side chain densities; (C, D) main chain polymerization degrees and (E, F) side chain lengths.
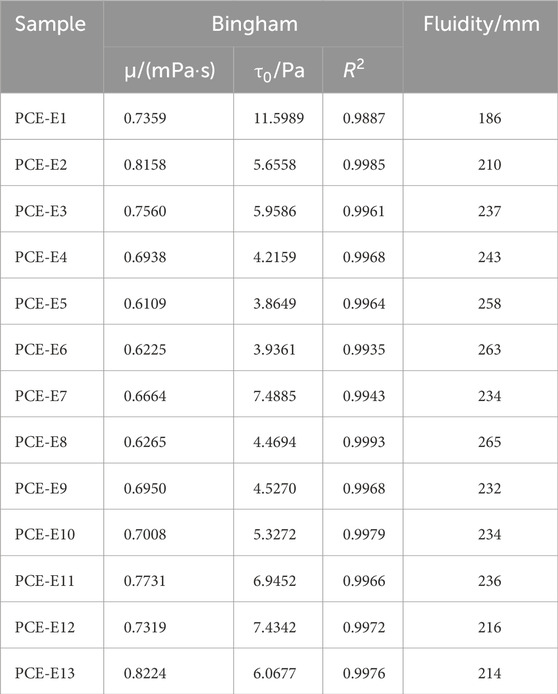
TABLE 7. The rheological parameters of the slurry under Bingham model and fludity.
As shown in Figure 3, the shear stress and shear rate exhibit a linear relationship. The Bingham was used for fitting, and the fitting results from Table 7 show that Bingham fluid model have high correlation coefficients greater than 0.98 when fitting the shear rate-shear stress curve of cementitious suspensions.
With the decrease of the side chain density, the plastic viscosity (μ) and yield stress (τ0) both decreased. This is attributed to the introduction of PCE, which reduces the anchoring groups on the main chain of the cementitious suspension. The absence of effective anchoring groups may lead to fluid instability, diminishing intermolecular interactions and internal friction, resulting in a decrease in plastic viscosity and yield stress. When the acid-ether ratio is 5.0(PCE-E6), τ0 increases again, indicating that the dispersion of PCE deteriorates. This is due to the decrease in the carboxyl density of PCE molecules when the carboxyl density is too high, the steric hindrance effect decreases, and the dispersibility decreases.
As the degree of polymerization of the main chains decreases, both μ and τ0 show a decrease followed by an increase and the fluidity of cement slurry show the opposite trend (Table 7). This is because the higher the degree of polymerization of the main chain, the longer the PCE molecular chains and the more stretched out their conformations. The increase of anionic groups in the main chain leads to an increase in the amount of PCE adsorbed onto the surface of cement particles, which is beneficial for improving the initial flowability of PCE. However, as the degree of polymerization of the main chain continues to increase, it becomes more difficult for PCE to unfold and absorb in the cement slurry (for example the value of μ for PCE-E9 and PCE-E10), because the PCE may cause disruption of the network structure, weakening the spatial steric hindrance effect of PCE molecules on the cement particle surface, thus reducing the flowability. Therefore, an appropriate degree of polymerization of the main chain is optimal for the dispersion performance of the cement slurry, which is consistent with the trend exhibited by the adsorption amount.
Subsequently, as the monomer molecular weight (side chain length) increases, both μ and τ0 show an increase. The cement particles have good dispersibility, which inhibits the hydration reaction of the cement and hinders the formation of a flocculation structure, but the increase in resistance is limited, leading to an increase in viscosity (Cheng, 2020). This is because the smaller the molecular weight of the PCE, the smaller the initial adsorption amount, and the more PCE is retained in the solution, allowing the “supplementary adsorption” effect to play a role, weakening the damage to the flocculation network structure but still hindering the overlay of the flocculation structure, resulting in a gradual decrease in viscosity. Therefore, the PCE with larger molecular weights has higher initial adsorption amounts, poorer dispersibility, and increased viscosity.
The thixotropic behavior of the cement paste can be characterized by the size of the thixotropic ring area, which reflects the amount of energy required to break down the flocculated and networked structures of the paste when it flows. Studying the influence of different microstructures of PCE on the thixotropic behavior of the cement paste is crucial for a better understanding of the cement setting process. The test results are shown in Figure 4.
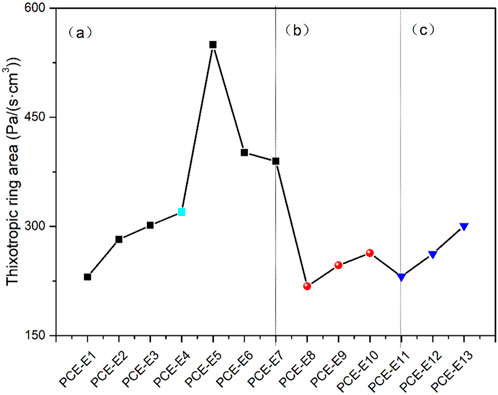
FIGURE 4. Effects of different microstructures of PCE on the Thixotropic ring area of cement paste.
As shown in Figure 4, with the decrease in the side-chain density, the Thixotropic ring area of the cement paste gradually increases, while the changes in μ and τ0 show the opposite trend, resulting in the formation of weak flocculation of particles. With an increase in shear rate, this flocculation structure is destroyed, leading to an increase in yield stress and a decrease in viscosity. With a decrease in the main chain polymerization degree, the area of the yield stress loop decreases, similar to μ and τ0, and the particles are forced to contact with each other during the shearing process, temporarily biting together in the overlap arrangement. As the shear resistance increases during the shearing process, the yield stress weakens and the viscosity increases. When the monomer molecular weight increases, the yield stress area first decreases and then increases, which is similar to μ and τ0, indicating that weak flocculation of particles is initially formed. When the flocculation structure is destroyed, the viscosity decreases, and the yield stress increases. This is consistent with the change of fluidity.
Figure 5 shows the dispersion mechanism of PCE on cement particles. The addition of PCE has a positive effect on the dispersibility of cement particles (Zhu et al., 2021), reducing the yield stress and plastic viscosity of cement slurry and significantly optimizing the rheological properties of the slurry. This is mainly due to the dual effect of van der Waals force and electrostatic repulsion. Small particles form a flocculated structure and electrostatic interactions occur between particles (Zhang and Kong, 2015). Moreover, PCE adsorbed on the surface of cement particles results in steric hindrance and electrostatic repulsion effects (Fernández et al., 2013). The flocculated structure formed in the slurry is loosened, releasing flocculation water, and the particles become smaller and evenly distributed in the slurry (Plank and Hirsch, 2007; Zhang et al., 2018), significantly improving the rheological properties of the cement slurry. This is related to early hydration and will be studied in later sections.
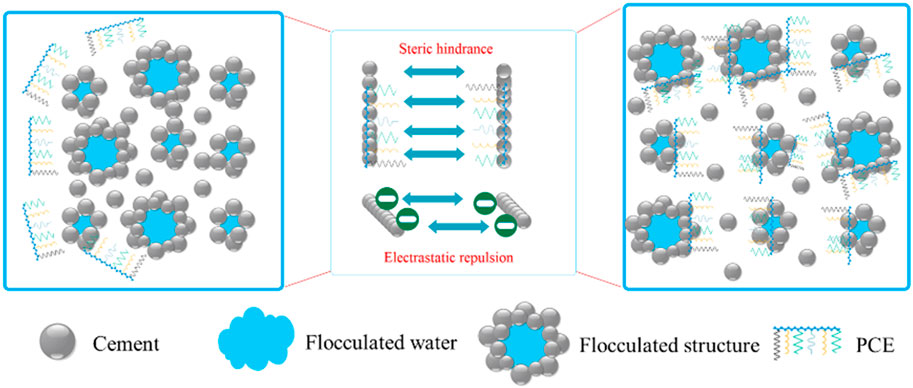
FIGURE 5. Dispersion mechanism of PCE.
The adsorption of different PCE with different microstructures on the surface of cement at different concentrations was tested, and the isotherm curves were fitted using the isothermal adsorption equation to explore the adsorption modes and saturation adsorption amounts of different microstructure PCE on the surface of cement, as well as to study the adsorption characteristics of PCEs on cement particles and their influencing laws. The measurement results obtained the isothermal adsorption equilibrium curves of PCE molecules on the surface of cement particles as shown in Figure 6.
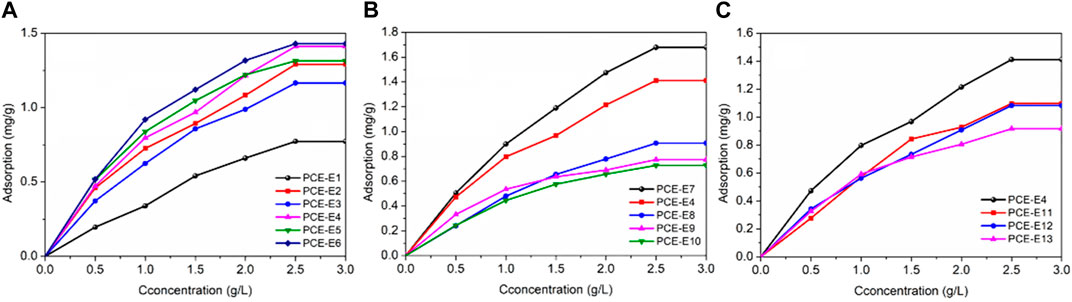
FIGURE 6. Relationship between adsorption amount and different microstructures of PCE, (A) side chain densities; (B) main chain polymerization degrees and (C) side chain lengths.
The adsorption amount of PCE on the surface of reference cement increases with the concentration of the water reducer. As the concentration of the water reducer gradually increases, the adsorption amount of the powder on the water reducer increases, and the water reducer occupies most of the active adsorption sites on the powder surface, reducing the active adsorption sites on the powder surface and decreasing the adsorption rate of the powder. The adsorption amount tends to saturate (Wei, 2018). When the concentration of the water reducer is small (0 g/L∼1.5 g/L), the adsorption amount increases rapidly with the increase of the concentration of the water reducer. During this period, the surface of the cement particles is more active and contains more vacancies, resulting in a relatively high adsorption rate. When the water reducer concentration is 2.5 g/L, the growth rate of the adsorption amount becomes slow. This is mainly because the solid particle surface has more active adsorption points, and the adsorption rate is faster at low concentrations. The active adsorption points on its surface tend to reach a saturation state, which produces electrostatic repulsion and spatial hindrance, so that the adsorption amount no longer increases (Zhu, 2017). Therefore, the adsorption of polycarboxylate superplasticizer (PCE) on the surface of cement particles or its hydration products forms an adsorption layer, thereby increasing the steric repulsion force between particle clusters and achieving the effect of dispersion.
As the side chain density decreases, the overall adsorption capacity increases and changes little with dosage (except for PCE-E1). This is mainly due to the increased carboxyl density, which provides more adsorption sites through the strong anionic group effect of carboxylic acid groups, resulting in increased adsorption capacity. However, when the carboxyl density increases to a certain extent, the adsorption capacity on the cement surface tends to stabilize (Feng, 2022).
With a decrease in the main chain polymerization degree, PCE is less likely to adsorb on the cement particle surface. This is mainly due to the change in the main chain polymerization degree, as PCE with lower the main chain polymerization degree has lower adsorption density. During the adsorption process, long side chains shield carboxyl groups, inhibiting adsorption and resulting in lower adsorption density (Ran et al., 2012). At 1.0 g/L, PCE-E9 has a greater adsorption capacity than PCE-E8, while at concentrations greater than 1.5 g/L, it is PCE-E8 that has a greater adsorption capacity than PCE-E9. This is because upon the addition of PCE molecules, their high negative charge rapidly adsorbs onto the surface of the cement particles and early hydration products, resulting in electrostatic repulsion, which on one hand delays the hydration of cement particles, and on the other hand releases the cement particles that are enveloped by the hydration products. When the PCE concentration is sufficient, the flocculated structure in the cement system is completely disintegrated, and the cement particles are well dispersed, resulting in maximum adsorption. Moreover, with the continued addition of the superplasticizer, the adsorption capacity remains unchanged.
To further investigate the effect of different morphologies PCEs on the isothermal adsorption and the properties of the adsorption plateau, the Langmuir isothermal adsorption equation and the Freundlich isothermal adsorption equation were used to fit the curves, and the fitting data are shown in Table 8.
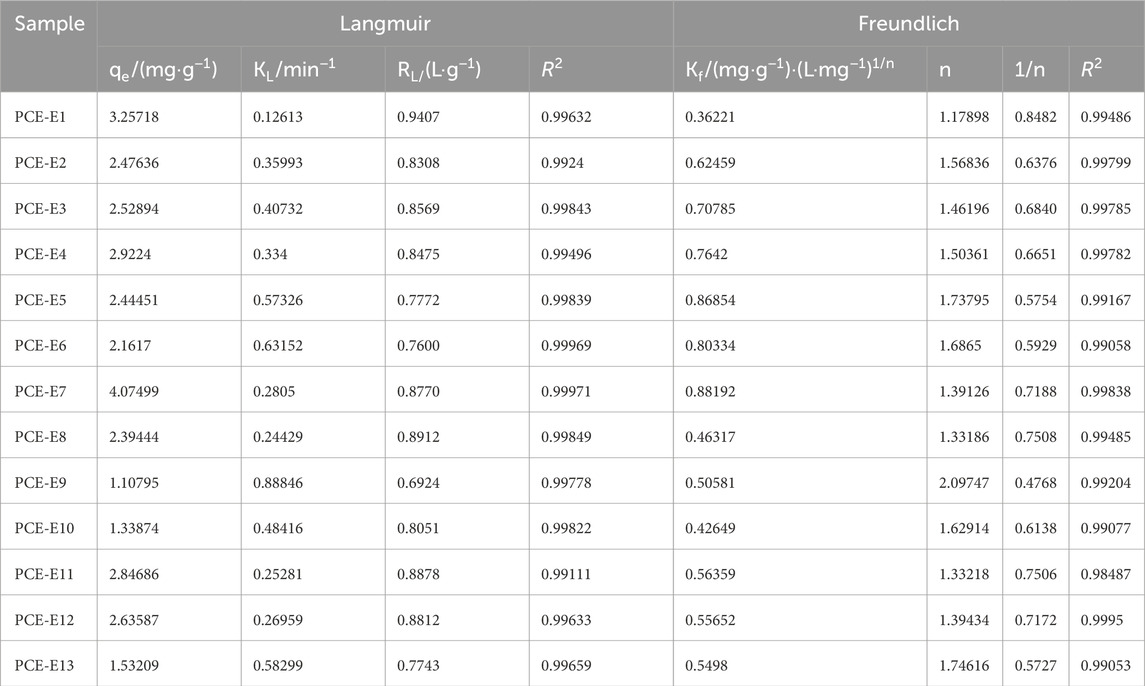
TABLE 8. Fitting parameters of PCE isothermal adsorption.
The Langmuir monolayer adsorption model of PCE on the reference cement was fitted, and the R2 values were all higher than 0.99, indicating that the adsorption of PCE on the surface of cement particles is mainly characterized by Langmuir adsorption, that is monolayer adsorption. This is mainly because the adsorption driving forces between PCE molecules and cement particle surfaces are mainly electrostatic interactions and coordination complexation, so the adsorption can only be monolayer adsorption.
As the microstructure parameters of PCE change (the side chain density and main chain polymerization degree decrease and the side chain length increase), the saturated adsorption amount on cement shows a decreasing trend (PCE-E7 has the highest, PCE-E9 has the lowest), which is opposite to the increasing trend of KL (PCE-E9 has the highest). This indicates that decreasing the side chain density is beneficial for PCE adsorption on cement. This is mainly because the higher the carboxyl group density, the more PCE adsorbed on cement and cement hydration products through electrostatic repulsion; while the shorter side-chain length is favorable for PCE adsorption on cement, mainly because short side-chain polymers have a higher carboxyl group content, resulting in a spiral conformation at high salt concentration, thereby reducing its adsorption sites (Ran et al., 2009). When the main chain polymerization degree is too lower, the degree of molecular spatial curling increases, which shields some functional groups and adsorbs on multiple active sites on the surface of cement particles, increases the flocculation effect between cement particles, reduces the dispersion ability, and weakens the adsorption capacity.
As the microstructural parameters change, the separation factor RL decreases to less than 1, which is favorable for PCE adsorption on cement. The Kf is the Freundlich adsorption constant, and a higher value indicates a greater degree of adsorption. With the changed of microstructural parameters (main chain polymerization degree decrease and the side chain length increase), Kf shows a decreasing trend, indicating an increase in the degree of PCE adsorption on cement. In contrast to the results of the side chain density (Kf) displays an increasing trend and weakens the adsorption degree.
As the reduction in side-chain density, decrease in main chain polymerization degree, and increase in side-chain length, the adsorption constant n shows an increasing trend and is greater than 1, indicating that the adsorption mode is single-layer adsorption. In the Freundlich model, 1/n reflects the strength of cement’s adsorption on PCE, and a larger 1/n indicates a weaker binding force between PCE and cement, while a smaller 1/n indicates a stronger adsorption force. As PCE’s microstructure changes, 1/n gradually decreases (maximum for PCE-E1, minimum for PCE-E9), indicating an increase in the binding force between PCE and cement, and thus a greater adsorption force.
The Langmuir adsorption model was used to fit the adsorption isotherms of different microstructures EPEG-type PCEs on the surface of cement particles at temperatures of 298 K, 308 K, 318 K, and 328 K. The values of ΔG, ΔH, and ΔS were obtained through corresponding fitting of thermodynamic parameters (Fang et al., 2023a), as shown in Table 9.
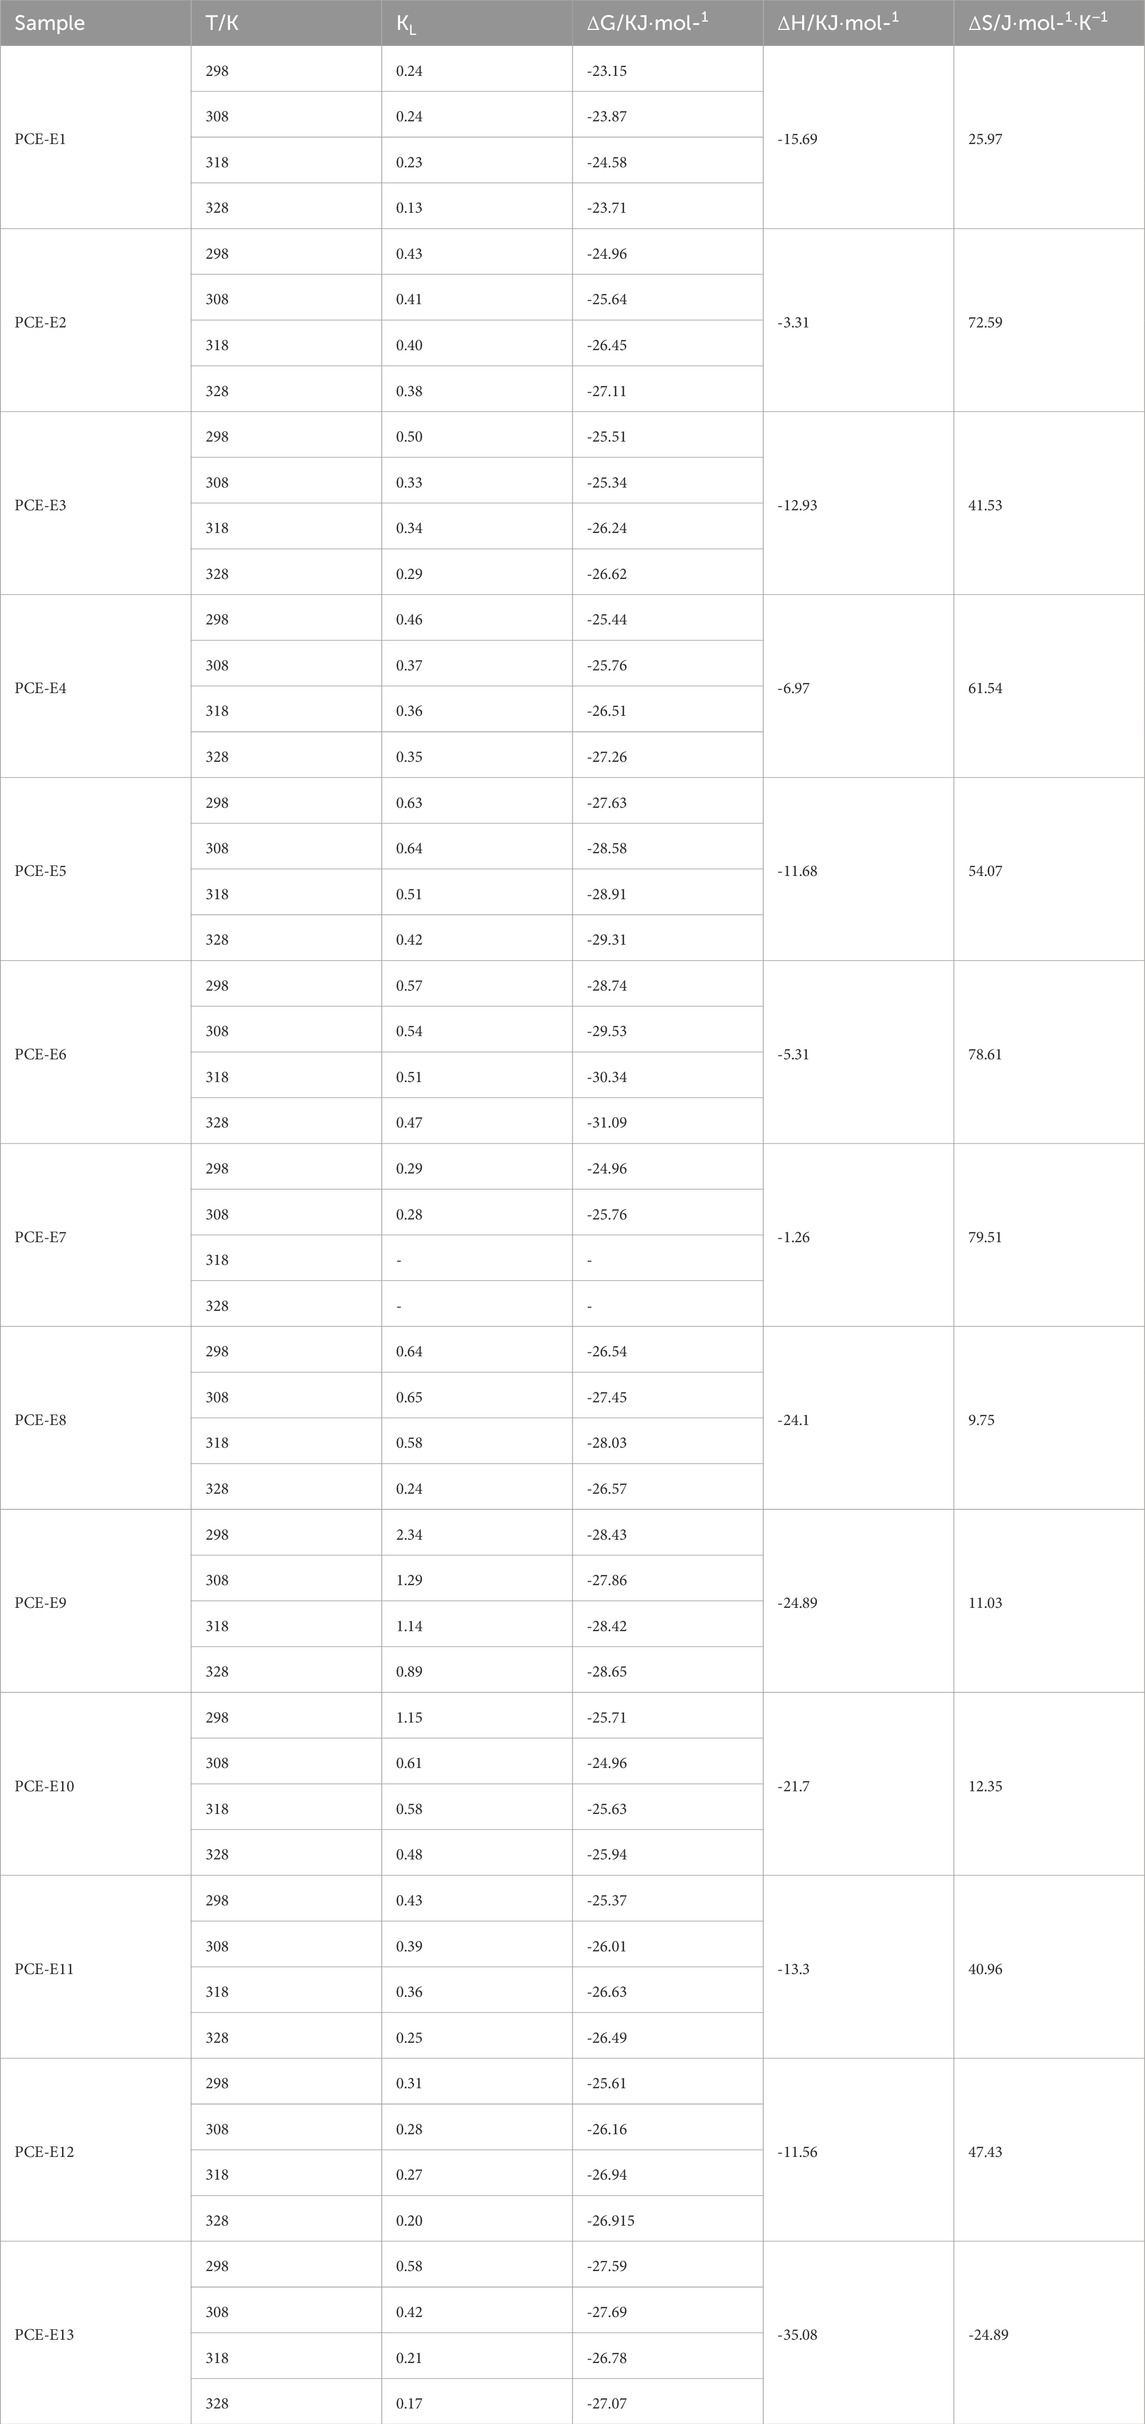
TABLE 9. Fitting parameters of adsorption thermodynamics for different microstructures of PCE.
In the case of identical samples, with increasing temperature, the apparent equilibrium constant (KL) exhibits a decreasing trend, while the absolute value of ΔG shows an increasing trend. The adsorption enthalpy change (ΔH) is negative, indicating an exothermic adsorption process, leading to a reduction in the system’s Additionally, the entropy change (ΔS) is positive, indicating an increase in the system’s disorder during the adsorption process. This could be attributed to a desolvation process, wherein the solute transitions from the solution to the surface of the adsorbent (Yi et al., 2012).
With the decrease in side-chain density, there is an increasing trend in the absolute value of ΔG and the absorption value of PCE, whereas the ΔH value shows an opposite trend. This indicates that, under these conditions, the hydrophobic groups in the side chains of PCE limit the contact between the main chain and cement minerals, reducing chemical adsorption, primarily due to the introduction of physical adsorption. Meanwhile, the overall trend of ΔS shows an increase, suggesting that the reduction in side-chain density decreases the orderliness of PCE adsorption.
With the decrease in main chain polymerization degree, there is an increasing trend in the absolute value of ΔH, opposite to the trend observed in ΔS values and the absorption value of PCE. This is primarily attributed to the enhancement of interactions between polymer main chains and adsorbates as the main chain length increases with higher polymerization degrees. The longer main chain results in improved segment interactions or adsorption, leading to a more ordered molecular arrangement and lower system disorder.
As the molecular weight increases, the absolute value of ΔH tend to become larger, while ΔS values show a decreasing trend and the absorption value of PCE. Higher molecular weight PCEs typically possess longer main chains, which may lead to better orientation and ordered arrangement on the adsorbent surface, reducing the system’s disorder, and resulting in a smaller ΔS. In the case of PCE-E13, a negative ΔS value is observed. This is mainly due to possible interactions between adsorbate molecules leading to the formation of aggregates or structural rearrangements, reducing molecular freedom. Alternatively, when the number of adsorbate molecules exceeds the number of available sites, competitive effects and repulsion between molecules may limit their arrangement, resulting in reduced system disorder, decreased entropy, and the occurrence of a negative entropy change.
The adsorption amounts of PCEs with different microstructures on cement surfaces were tested over time, as shown in Figure 7.
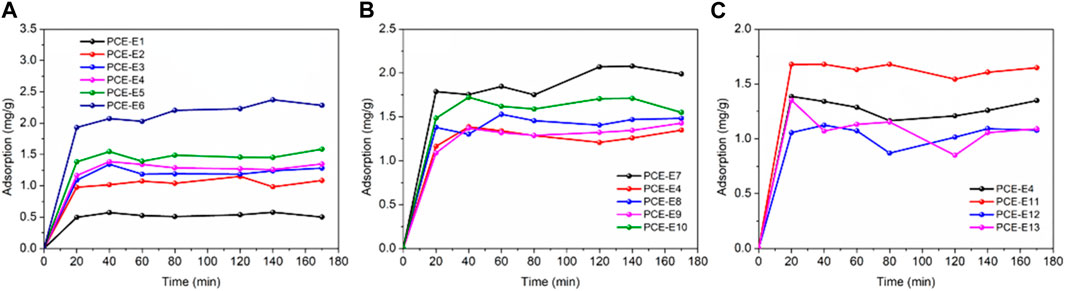
FIGURE 7. Adsorption kinetics of different PCEs on cement surface over time, (A) side chain densities; (B) main chain polymerization degrees and (C) side chain lengths.
From Figure 7, it can be observed that different PCEs show similar regularity in adsorption kinetics on the cement surface. The adsorption amount of PCEs at the cement/water interface increases rapidly and then slowly with continuous changes in adsorption time. It reaches equilibrium after approximately 1 h and reaches equilibrium after approximately 2 h. PCE-E7 has the highest adsorption capacity, followed by PCE-E10, and the lowest is PCE-E4, which may be related to the side chain length of PCE in addition to the complex adsorption of carboxyl groups with Ca2+ on the cement surface through electrostatic interactions. At the beginning of adsorption, PCE is mainly adsorbed on the outer surface of cement particles, and the adsorption rate is faster, mainly controlled by the diffusion step. As adsorption proceeds, some PCE is wrapped by hydration products, causing a gradual decrease in concentration, and the adsorption process is mainly controlled by chemical adsorption. At the same time, the increase in thickness of the hydration product layer leads to increasing diffusion resistance, and the adsorption rate is mainly controlled by diffusion. Therefore, the adsorption rate gradually slows down. In the later stages of adsorption, the concentration difference, which is the driving force, becomes smaller and smaller, and adsorption reaches equilibrium.
The adsorption kinetics of different superplasticizers with different microstructures on cement particles were fitted using a pseudo-first-order rate equation and pseudo-second-order rate equation, and the characteristic parameters obtained from the fitting are shown in Table 10. According to the results in Table 10, the accuracy (R2) of the fitting by PFO (pseudo-first-order kinetic equation) and PSO (pseudo-second-order kinetic equation) is similar, both in the range of 0.95–0.99, but for the same sample, the R2 of PSO is higher than that of PFO, indicating that PSO is more suitable for the pseudo-second-order kinetic equation. The equilibrium adsorption amounts obtained by PFO and PSO are close to the actual measured values. As the side chain density decreases, the equilibrium adsorption amount shows an increasing trend (PCE-E2 is the smallest, and PCE-E6 is the largest). This is mainly because the carboxylic acid groups on the side chains play a strong anionic group effect, providing more adsorption sites, and resulting in an increase in the adsorption amount of PCE on the cement surface. The values of k1 and k2 show a decreasing trend (opposite to the equilibrium adsorption amount, PCE-E2 is the largest), indicating that the rate of reaching the saturation adsorption amount becomes slower as the acid-ether ratio increases, which is consistent with the trend shown by the side chain length and the main chain polymerization degree of PCE. The side chain density h0 shows an increasing trend (PCE-E5 is the largest), and the initial adsorption rate is accelerated; the main chain polymerization degree (PCE-E9 is the smallest), and the side chain length (PCE-E13 is the smallest) show a decreasing trend, indicating that the larger the monomer molecular weight and the longer the side chain length, the slower the initial adsorption rate.
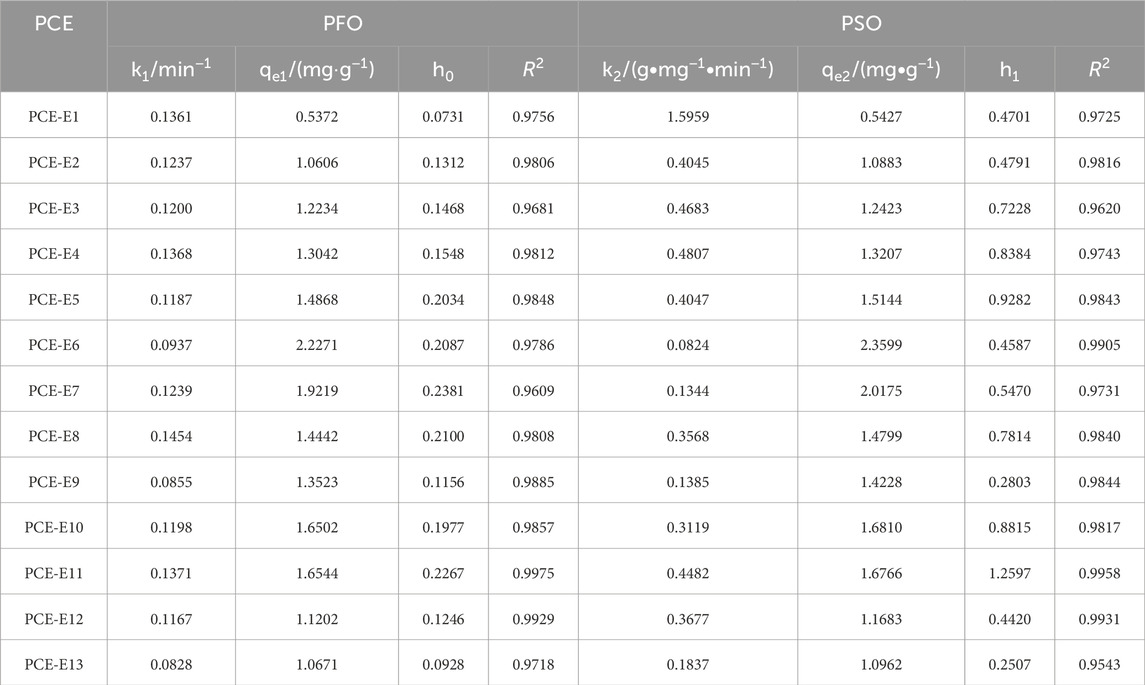
TABLE 10. Fitting parameters of adsorption kinetics for different microstructures of PCE.
Isothermal adsorption and adsorption kinetics studies were conducted on PCEs with different microstructures, and the influence of the microstructure was further elucidated through mechanism analysis, as shown in Figure 8.
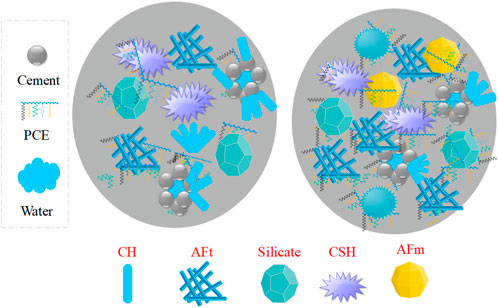
FIGURE 8. The adsorption mechanism of PCE.
There are two forms of PCE adsorption: physical adsorption and chemical adsorption in Figure 10. Physical adsorption refers to the electrostatic attraction between PCE and the surface of hydrated cement particles, which generate negatively charged silicate hydrate and positively charged aluminum hydrate (Vovk et al., 1997). Chemical adsorption, on the other hand, mainly occurs through the binding of carboxyl groups with Ca2+ ions to form relatively stable chelation complexes (such as Aft, AFM, etc.), which have high chemical reactivity and provide enough binding sites in the hydration products of cement. Chemical adsorption is more likely to occur (Fang et al., 2022).
Isothermal calorimetry (TAM) can effectively characterize the influence of polycarboxylate-based superplasticizers on the early hydration process of cement paste. The hydration of cement can be divided into five stages, as shown in Figure 9. The effect of PCE on the hydration performance was studied through the hydration heat release rate curve, in which t0、t2 and t3 represent the end time of the induction period, the time of maximum slope in the acceleration period curve and acceleration period, respectively, and q0, q2, q3, Q0, Q2, and Q0-3 represent the corresponding exothermic rate and cumulative exothermic amount at these points. K2 denotes the transverse slope between 0 and 2, indicating the nucleation rate during the acceleration period.
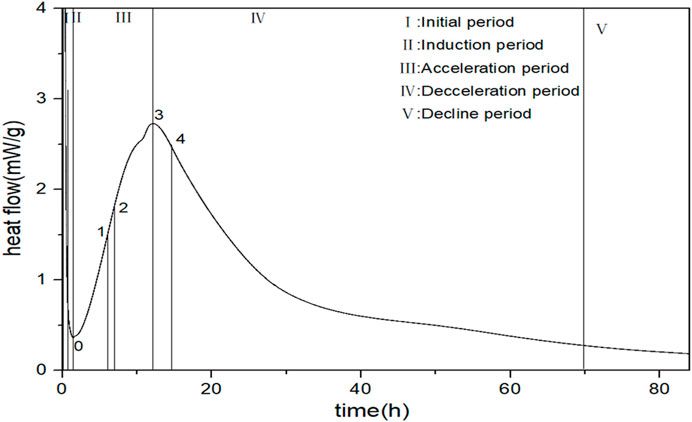
FIGURE 9. Five stages of cement hydration.
The impact of PCE with different microstructures on the hydration performance was investigated, and the hydration heat curves are shown in Figure 9. The specific parameters are shown in Table 11.
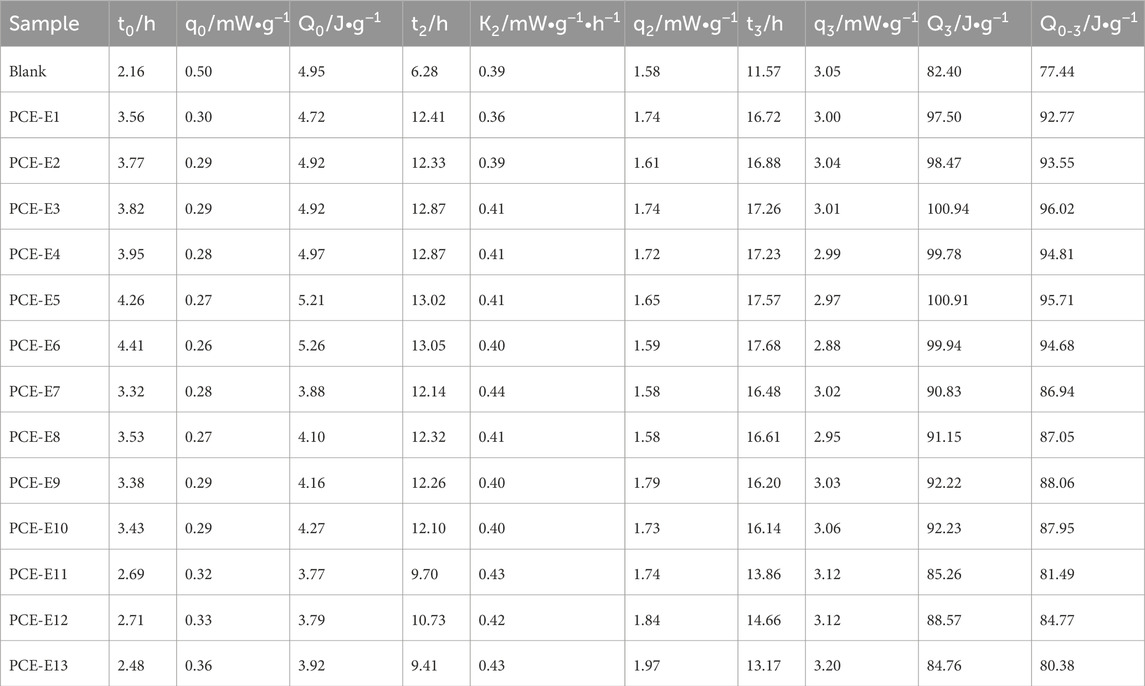
TABLE 11. The hydration heat curve values of PCEs with different microstructures.
As shown in Figure 10 and Table 11, after mixing PCE with cement (blank sample), the first exothermic peak (t0) of all the pastes occurs at 3.5 ± 1.0 h, which is attributed to the initial contact between cement and water, the rapid dissolution of C3S, and the hydration of C3A (Zhu et al., 2021). When EPEG-type PCEs are mixed with cement, the induction period end time (t0) gradually increases with a decrease in side chain density. This phenomenon is attributed to the increased charge density within the PCE unit, leading to higher adsorption. The carboxyl groups in the polymer molecules form complexes with calcium ions in the solution, inhibiting the nucleation and growth of C-S-H gel, delaying the induction period hydration, and resulting in an increased t0. This trend aligns with the consistency observed in the slump flow, both showing an increasing tendency. According to GPC data, the molecular weight and hydrodynamic radius gradually increase, leading to more pronounced adsorption and a balling effect. This enhances the wetting performance of cement particles, increases fluidity, and consequently enlarges the volume of oversaturated solution at the end of the induction period. This causes a slow growth in Ca2+ concentration, contributing to the extension of the induction period.
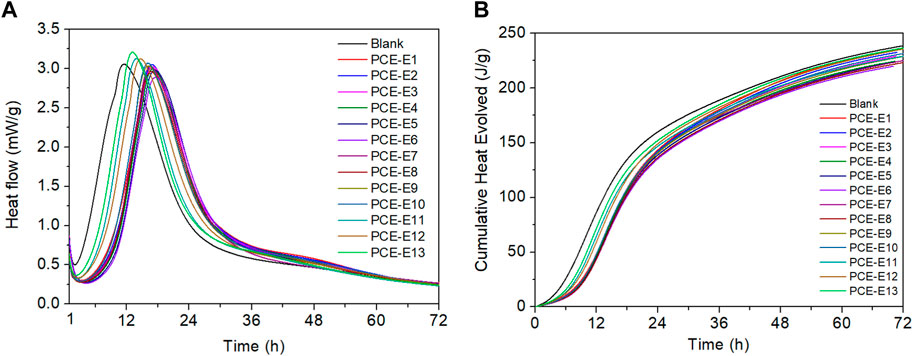
FIGURE 10. Hydration heat curves (A) and cumulative heat curves (B) for different PCE microstructures and blank sample.
With a decrease in main chain polymerization degree, t0 initially increases and then decreases. During this phase, PCE can more rapidly adsorb onto the surface of cement particles, forming a dense protective layer. This indicates that PCE can effectively prolong the induction period, suppressing the dissolution heat of minerals during this period. However, excessively high or low polymerization degrees may lead to PCE adsorbing onto different cement particles, causing a decrease in dispersion. Therefore, the appropriate main chain polymerization degree has a significant impact on t0, demonstrating a strong hydration effect. Different monomer molecular weights exhibit opposite trends with respect to t0 compared to different side-chain densities and main chain polymerization degrees of EPEG-type PCEs. This suggests that the delayed onset of the cement hydration exothermic peak becomes more pronounced (Yang and He, 2021). Smaller molecular weights can rapidly migrate and diffuse to the surface of cement particles, inhibiting the dissolution of minerals during the induction period. On the other hand, higher molecular weights result in slower diffusion rates, failing to effectively suppress the hydration heat release during the induction period.
Compared to the blank sample (the value of q0 has largest), q0 exhibits a decreasing trend with the decrease in side-chain density and main chain polymerization degree, indicating a reduction in nucleation sites and nucleation quantity due to the presence of PCE. However, the variation in q0 is minimal, suggesting that PCE with different side-chain densities uniformly envelop cement particles, resulting in consistent mineral dissolution rates. As side-chain density decreases, the cumulative heat at the end of the induction period increases slowly, but the increment is small. Different main chain polymerization degrees of PCE have a relatively small impact. With an increase in PCE molecular weight, q0 shows an increasing trend, indicating an increase in nucleation sites and nucleation quantity, which is conducive to the hydration process (Wang Z et al., 2013). In comparison to the blank sample, Q0 for different microstructures of PCE is generally larger or comparable. This is primarily attributed to a higher content of carboxyl groups, allowing for the adsorption of more cement minerals to form a denser adsorption layer. This effectively inhibits the dissolution of cement minerals, increases the heat release at the end of the induction period, and promotes cement hydration heat release. This accelerates the formation of C-S-H gel and calcium aluminate crystals (Yamada et al., 2000). As the molecular weight increases, diffusion adsorption is inhibited, accelerating the heat release rate during the induction period. However, while suppressing the heat release during the induction period, it ensures the stable formation of hydration products, resulting in a decreasing trend in heat release values.
The maximum slope during the acceleration period (K2) (He et al., 2019) increases with a decrease in side-chain density, indicating that lower side-chain density can provide more nucleation sites and, concurrently, more nucleation driving force, thereby accelerating the nucleation rate in the early stage. K2 decreases with a decrease in main chain polymerization degree, which is related to the volume of oversaturated solution upon entering the acceleration period. An increase in the oversaturated solution volume accelerates the nucleation rate. Simultaneously, with an increase in molecular weight, K2 shows minor variations, consistently slightly superior to the blank sample (The K2 of PCE of other microstructures is greater than that of blank). This is attributed to the complexation of PCE with calcium ions, further promoting the dissolution and precipitation reactions of cement minerals, thereby accelerating the reactions during the hydration acceleration period.
At the occurrence of the exothermic peak during the acceleration period (t3) at approximately 17 ± 1 h (the blank sample appear in 11.57 h), and with exothermic values approaching consistency, a trend is observed where, with a decrease in side-chain density and main chain polymerization degree, t3 initially increases and then stabilizes, contrasting with the behavior of molecular weight of PCE. These trends collectively indicate a significant impact of PCE addition on the nucleation and growth rates during the acceleration period, reducing the hydration heat release rate, extending the acceleration period. This results in a slowing of early-stage structural development and a delay in the cement hydration process. This is primarily attributed to the precipitation of C-S-H gel and the formation of calcium hydroxide from C3S hydration, hindering the diffusion of water and calcium ions at the cement-solution interface (Li et al., 2012). The exothermic peak value during the acceleration period (q3) exhibits a decreasing trend with changes in microstructural parameters, indicating that crystal grain boundaries are more prone to mutual contact, further compressing the growth space of the grains, leading to a reduction in nucleation quantity in the paste. In contrast to the behavior with molecular weight of PCE, an increase in PCE molecular weight significantly raises the nucleation quantity in the paste, resulting in a faster hydration rate. Additionally, all q3 values are lower than the blank sample, indicating a significant impact of PCE on inhibiting the nucleation of hydrates.
Q3 exhibits an initial increase followed by stabilization with a decrease in side chain density and main chain polymerization degree. This suggests that the addition of PCE results in an increased formation of hydration products, leading to an elevated hydration heat release rate. The overall hydration heat release is not significantly affected (Zhang, 2020), indicating that the nucleation during the acceleration period is not influenced (Fang et al., 2023b). Furthermore, all values are greater than the blank sample, suggesting the potential to enhance hydration during the acceleration period. Conversely, with an increase in PCE molecular weight, Q3 shows a decreasing trend. This is attributed to the reduced dispersibility of larger molecular weight PCE, leading to more release of free water and a decrease in ion concentration during the acceleration period, resulting in a reduction in nucleation quantity. Following this peak, the hydration heat evolution process experiences a decline (deceleration period), quickly reaching a constant value. The hydration heat values are lower (late stage) and relatively stable.
This chapter employs the Krstulovic-Dabic hydration kinetics model to construct a model for cementitious systems based on isothermal microcalorimetry (Han, 2021). The study investigates the variation in reaction parameters of the hydration kinetics model under standard cement conditions for different microstructures of EPEG-type PCE. The hydration process is fitted, revealing the hydration mechanisms and controlling factors of hydration products at different stages for various microstructures of EPEG-type PCEs. The hydration reaction α vs. dα/dt curves of the samples are shown in Figure 11, and the summary of the hydration kinetic parameters is shown in Table 12. The hydration kinetics parameters include n, which represents the reaction order or growth exponent, measured in J·g⁻1, where n = l is needle, n = 2 is sheet and n = 3 is isotropic growth; KNG, KI, and KD, representing the reaction rate constants for the NG, I, and D processes, respectively. Among these, α1 denotes the hydration degree when the reaction control mechanism transitions from NG to I, and α2 represents the hydration degree when the reaction control mechanism shifts from I to D.
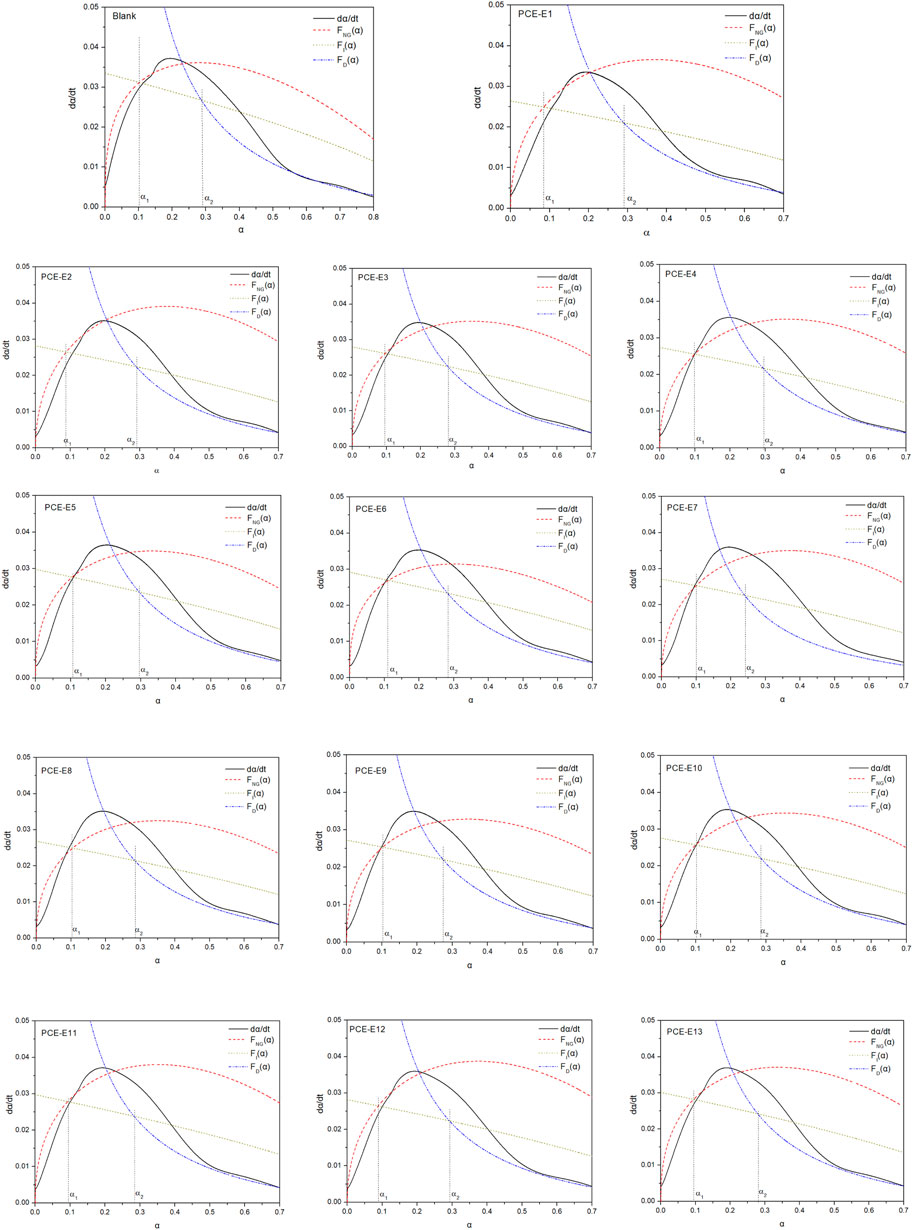
FIGURE 11. The curve of Hydration degree (α)-hydration rate (dα/dt) for PCE with different microstructures.
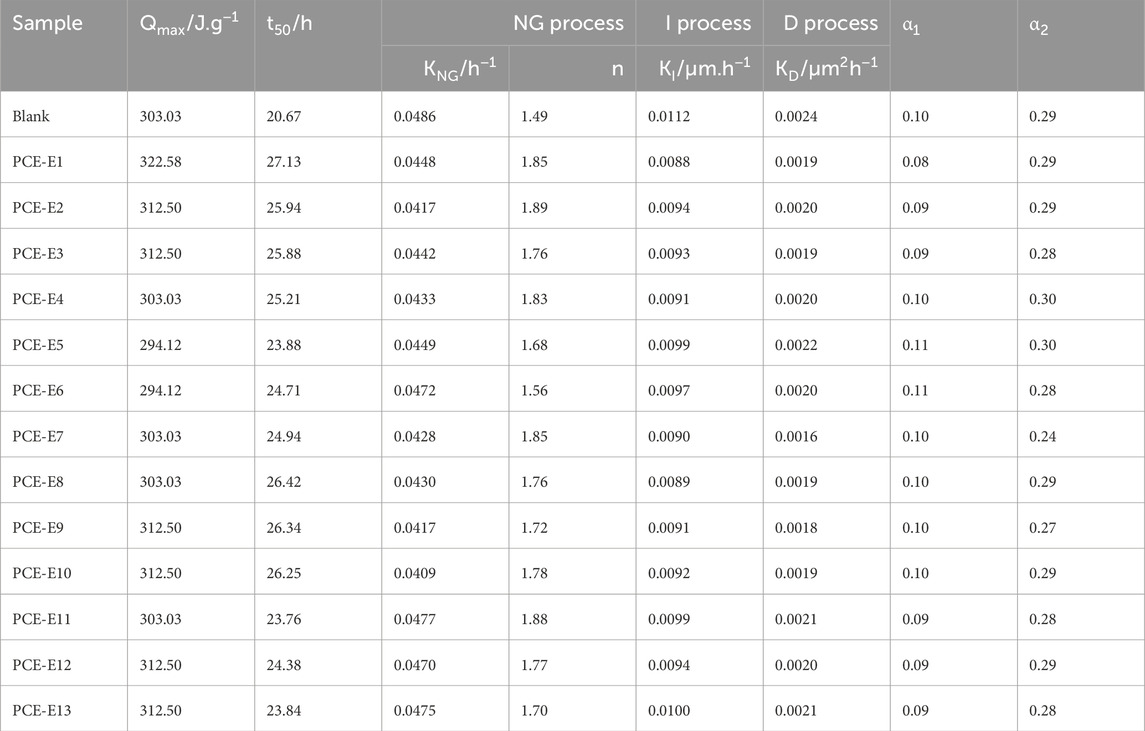
TABLE 12. Hydration kinetic parameters of PCE with different microstructures.
Figure 11 illustrates the fitting of parameters for three processes (NG, I, D) corresponding to different stages of cement hydration. As cement hydration progresses, NG, I, and D coexist, with each process dominating at different stages. The dominant reaction varies with the slowest hydration rate at a given stage. The Q values and t50 for different microstructures of PCE differ. With a decrease in side-chain density, Q and t50 exhibit a decreasing trend, while with a decrease in main chain polymerization degree and an increase in molecular weight, Q and t50 show an increasing trend. The KNG values for all microstructures of PCE are significantly larger than KI and KD. This is primarily attributed to the initial self-catalytic process during the early hydration of cement (Fang et al., 2023c). Rapid cement hydration generates a large amount of C-S-H hydration product, accompanied by a rapid increase in the pH of the pore solution. When CH reaches oversaturation, stable nuclei are formed. As a result, the NG stage dominates the hydration process, and the other processes can be neglected.
Among these, KNG accurately assesses the variation in nucleation points before and after crystal growth, thereby influencing the change in nucleation quantity. A larger KNG indicates a more facile reaction, leading to a significant increase in the formation rate of C-S-H and Ca(OH)2 crystals. With a decrease in side-chain density, KNG shows an increasing trend, resulting in the enlargement of the volume of C-S-H and Ca(OH)2 crystal growth. Concurrently, the n value gradually decreases, with PCE-E6 exhibiting the smallest n value, indicating the least influence of ion concentration on nucleation and growth rates (Han, 2015). Therefore, at the end of the induction period, PCE-E6 has the smallest nucleation quantity.
As the main chain polymerization degree decreases, KNG and n values show a slight decrease, while an increase in molecular weight does not exhibit significant changes, consistent with the trend observed in the analysis of K2. Additionally, the range of n values corresponds to different morphologies of hydration products, and all samples in this chapter fall within the range of 1–2, indicating the presence of needle-like and lamellar hydration products.
In the induction period, a decrease in side-chain density leads to an overall increase in KI. During this period, the interface area between crystals and the pore solution increases, resulting in an augmentation of C-S-H gel. With variations in microstructure (main chain polymerization degree, side-chain length), KI exhibits overall subtle changes, suggesting that PCE has a relatively minor impact on the quantity of C-S-H gel at this stage.
As hydration progresses, during the D process, the porosity and permeability of the paste decrease sharply, causing the C-S-H layer to cover the Ca(OH)2 crystals and unhydrated particles. This increases the resistance between hydrated and unhydrated components, resulting in a relatively small value for KD. The numerical value of KI is approximately 4–5 times that of KD, indicating a slow diffusion rate between cement particles, obviating the need for diffusion through water as a medium. During the deceleration period, the KD values for all microstructure samples are essentially consistent with the blank sample, suggesting a minor impact of PCE on the D process.
By analyzing the hydration heat process of cement with different microstructure PCEs, the hydration situation of the three dominant reaction periods can be roughly inferred, as shown in the hydration mechanism diagram in Figure 12.
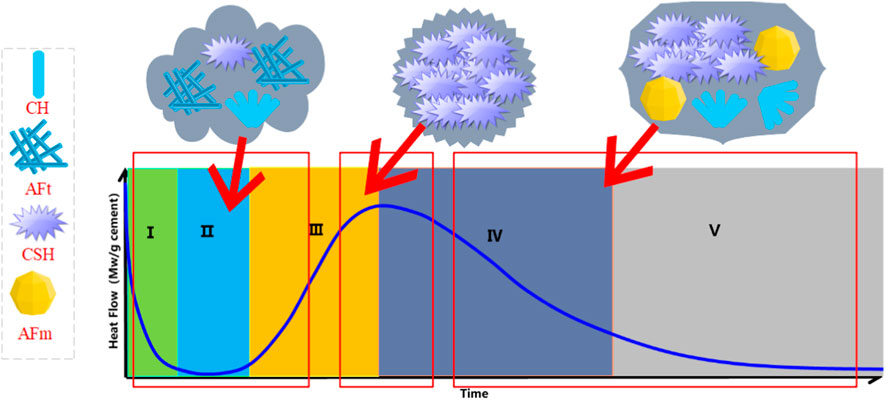
FIGURE 12. PCE-cement hydration mechanism.
Figure 12 illustrates the PCE-cement hydration mechanism proposed (Bazzoni et al., 2014). They proposed that the kinetics of the main exothermic peak are controlled by the growth of C-S-H “needles”. The C-S-H needles form nuclei on the surface of the grains, and as the hydration process progresses, the particle size of C3S gradually decreases, and the growth of C-S-H mainly develops towards the center and gradually stops growing outward. At this point, more and more needle-shaped nuclei will be produced. When the surface is completely covered by needle-shaped objects, C-S-H cannot grow in this way but instead begins to form dense internal products (Scrivener et al., 2015).
In this study, different side chain densities, side chain lengths, and main chain polymerization degree of PCE were prepared using EPEG polyether monomer. The impact of PCE microstructure on the rheology of cement slurry, interfacial adsorption, and early cement hydration was investigated:
The molecular weight distribution of PCE widens with longer side chains and decreases with higher main chain polymerization. Similar trends are noted in Rh (hydrodynamic radius) and charge density. The Mark-Houwink α, relatively stable across acid-ether ratios, indicates side chain density’s negligible impact on molecular conformation. With α values below 0.3, PCEs demonstrate compact conformations. Conversely, α decreases then stabilizes with changing main chain polymerization, suggesting a shift from rigid to flexible, compact chains.
Rheological parameters of cement slurry, μ (viscosity) and τ0 (yield stress), decrease with lower side chain density, enhancing slurry flow and rheology, a trend reversed in longer side chain PCEs. PCEs with reduced main chain polymerization initially show decreased then increased viscosity. Thixotropic ring area trends are generally inverse to rheological parameters, leading to flocculation disruption, increased thixotropy, and improved rheology.
PCE adsorption on cement surfaces rises with concentration, indicating monolayer adsorption. At higher microstructure dosages, adsorption decreases. Enhanced adsorption capacity occurs with lower side chain density, shorter length, and lower molecular weight, speeding up adsorption. Temperature increases negatively impact adsorption, predominantly physical in nature.
The induction period end time (t0) lengthens with reduced side chain density and main chain polymerization, contrasting with side chain length trends, delaying cement hydration peaks. Meanwhile, q0 decreases with lower side chain density and main chain polymerization, enhancing nucleation sites and quantity. K2 rises with lower side chain density and falls with reduced main chain polymerization, accelerating early-stage nucleation. PCE addition significantly impacts nucleation and growth rates, extending the acceleration period and delaying hydration.
In the NG stage, blank samples show the smallest n values, indicating needle-shaped products. PCE-added samples have higher n values, indicating C-S-H product dominance and early-stage hydration delay. KNG marginally decreases with reduced side chain density, main chain polymerization, and length, with n values suggesting needle-like and plate-like hydration products. PCE-E6 shows the least impact on ion concentration and nucleation quantity at induction end.
The original contributions presented in the study are included in the article/Supplementary Material, further inquiries can be directed to the corresponding author.
YF: Conceptualization, Formal Analysis, Project administration, Writing–review and editing. ZW: Methodology, Visualization, Writing–original draft, Writing–review and editing. DY: Resources, Supervision, Writing–review and editing. HL: Investigation, Validation, Writing–review and editing. XM: Methodology, Supervision, Writing–review and editing. JL: Resources, Supervision, Writing–review and editing. YL: Investigation, Methodology, Writing–review and editing. LZ: Validation, Writing–original draft. ZC: Data curation, Validation, Writing–review and editing. XZ: Formal Analysis, Investigation, Writing–original draft. ZL: Formal Analysis, Investigation, Writing–review and editing. DW: Methodology, Validation, Writing–original draft.
The author(s) declare that no financial support was received for the research, authorship, and/or publication of this article.
The authors gratefully acknowledge the contributions from Xiamen Key Laboratory of Engineering Additives and Fujian and Taiwan Traditional Architectural Engineering Research Center of Xiamen City University.
Authors YF, ZW, HL, XM, LZ, ZC, XZ and LZ were employed by the company KZJ New Materials Group Co., Ltd.
The remaining authors declare that the research was conducted in the absence of any commercial or financial relationships that could be construed as a potential conflict of interest.
All claims expressed in this article are solely those of the authors and do not necessarily represent those of their affiliated organizations, or those of the publisher, the editors and the reviewers. Any product that may be evaluated in this article, or claim that may be made by its manufacturer, is not guaranteed or endorsed by the publisher.
Bazzoni, A., Ma, S., Wang, Q., Shen, X., Cantoni, M., and Scrivener, K. L. (2014). The effect of magnesium and zinc ions on the hydration kinetics of C3S. J. Am. Ceram. Soc. 97 (11), 3684–3693. doi:10.1111/jace.13156
Cheng, C. M. (2020). Influences of superplasticizers with different anchoring groups on properties of fresh cement pastes: rheology and temperature sensitivity. Master's Theses. Beijing, China: Beijing Jiaotong University.
Cui, J. Y., He, Z., Zhang, G. Z., and Cai, X. (2022). Rheological properties of sprayable ultra-high performance concrete with different viscosity-enhancing agents. Constr. Build. Mater. 321, 126154. doi:10.1016/j.conbuildmat.2021.126154
Fang, L., Zhou, J., Yang, Z., Yuan, Q., and Que, Y. (2022). Interaction between cement and asphalt emulsion and its influences on asphalt emulsion demulsification, cement hydration and rheology. Constr. Build. Mater. 329, 127220. doi:10.1016/j.conbuildmat.2022.127220
Fang, Y. H., Chen, Z. H., Yan, D. M., Ke, Y. L., Ma, X. X., Lai, J. Y., et al. (2023a). Study on the effect of main chain molecular structure on adsorption, dispersion, and hydration of polycarboxylate superplasticizers. Mater 16 (13), 4823. doi:10.3390/ma16134823
Fang, Y. H., Lin, Z. J., Yan, D. M., Zhang, X. F., Ma, X. X., Lai, J. Y., et al. (2023c). Study on the effect of polycarboxylate ether molecular structure on slurry dispersion, adsorption, and microstructure. Polym 15 (11), 2496. doi:10.3390/polym15112496
Fang, Y. H., ZhangYan, X. F. D. M., Lin, Z. J., Ma, X. X., Lai, J. Y., Lin, Z. J., et al. (2023b). Study on dispersion, adsorption, and hydration effects of polycarboxylate superplasticizers with different side chain structures in reference cement and belite cement. Mater 16 (11), 4168. doi:10.3390/ma16114168
Feng, H. (2022). Study on synthesis, mechanism and properties of vinyl ether polycarboxylic superplasticizers in special environment. Doctor's Theses. Shanghai, China: East China University of Science and Technology.
Feng, H., Feng, Z., Wang, W., Deng, Z., and Zheng, B. (2021). Impact of polycarboxylate superplasticizers (PCEs) with novel molecular structures on fluidity, rheological behavior and adsorption properties of cement mortar. Constr. Build. Mater. 292, 123285. doi:10.1016/j.conbuildmat.2021.123285
Fernández, J. M., Duran, A., Navarro-Blasco, I. I., Lanas, J., Sirera, R., and Alvarez, J. I. (2013). Influence of nanosilica and a polycarboxylate ether superplasticizer on the performance of lime mortars. Cem. Concr. Res. 43, 12–24. doi:10.1016/j.cemconres.2012.10.007
Han, F. H. (2015). Study on hydration characteristics and kinetics of composite binder. Doctor’s Thesis. Beijing, China: China University of Mining & Technology.
Han, J. (2021). Study on hudration properties of multicomponent cementitious system with low water-binder ratio. Master’s Thesis. Urumqi, China: Xinjiang Agricultural University.
Han, J., Zhao, Z. H., Lin, Y. F., Xue, Z. X., and Xia, Y. Z. (2021). Determination of carrageenan molecular weight and dilute solution conformation by tri-detector array gel permeation chromatography. Mar. Sci. 11, 125–131.
He, Y., Kong, Y. N., Wang, X. F., and Shui, L. L. (2018). Influence of polycarboxylate superplasticizers with different carboxylic density on the properties of cement paste. J. Build. Mater. 21 (2), 185–188.
He, Y., Zhang, X., Shui, L. L., Wang, Y. T., Gu, M. D., Wang, X. F., et al. (2019). Effects of PCEs with various carboxylic densities and functional groups on the fluidity and hydration performances of cement paste. Constr. Build. Mater. 202, 656–668. doi:10.1016/j.conbuildmat.2018.12.216
Huo, Z. M., Zhang, J. F., Xu, D. S., and Shen, J. B. (2017). Study on synthesis of low viscosity polycarboxylic acid superplasticizer. Commer. Concr. 14 (Z1), 68–70.
Ji, H. G., Chen, J. Q., and Li, Y. F. (2020). Study on effect influence of different side chain molecular weight to polycarboxylate superplasticizer. Mine Cons. Technol. 41 (01), 40–43. doi:10.19458/j.cnki.cn11-2456/td.2020.01.009
Kinoshita, M., and Nawa, T. (2000). Effect of chemical structure on fluidizing mechanism of concrete superplasticizer containing polyethylene oxide graft chains. CANMET Spec. Publ. 195, 163–180. doi:10.14359/9911
Lei, L., and Plank, J. (2014). Synthesis and properties of a vinyl ether-based polycarboxylate superplasticizer for concrete possessing clay tolerance. Ind. Eng. Chem. Res. 53, 1048–1055. doi:10.1021/ie4035913
Li, R., Lei, L., Sui, T., and Plank, J. (2021). Effectiveness of PCE superplasticizers in calcined clay blended cements. Cem. Concr. Res. 141, 106334. doi:10.1016/j.cemconres.2020.106334
Li, S., Yu, Q. J., and Wei, J. X. (2012). Effect of molecular structure of polycarboxylate water reducers on hydration of cement. J. Chin. Ceram. Soc. 40 (04), 613–619. doi:10.14062/j.issn.0454-5648.2012.04.013
Liu, G. J. (2020). Effect of vinyl ether-based macromonomer on synthesis and properties of polycarboxylate superplasticizer and study on the copolymerization kinetics. Doctor’s Thesis. Shanxi, China: Shanxi Univerisity.
Liu, G. J., Qin, X., Wei, X. H., Wang, Z., and Ren, J. (2020). Study on the monomer reactivity ratio and performance of EPEG-AA (ethylene-glycol monovinyl polyethylene glycol–acrylic acid) copolymerization system. J. Macromol. Sci. Part A. 57 (9), 646–653. doi:10.1080/10601325.2020.1753537
Liu, Z. H. (2013). Research on synthesis, properties and mechanism of different carboxyl density and functionallizing polycarboxylate superplasticizer. Doctor’s Thesis. Beijing, China: China University of Mining & Technology.
Nazar, S., Yang, J., Thomas, B. S., Azim, I., and Rehman, S. K. U. (2020). Rheological properties of cementitious composites with and without nano-materials: a comprehensive review. J. Clean. Prod. 272, 122701. doi:10.1016/j.jclepro.2020.122701
Ng, P. G., Cheah, C. B., Ng, E. P., Oo, C. W., and Heng, L. k. (2020). The influence of main and side chain densities of PCE superplasticizer on engineering properties and microstructure development of slag and fly ash ternary blended cement concrete. Constr. Build. Mater. 242, 118103. doi:10.1016/j.conbuildmat.2020.118103
Ng, S., and Plank, J. (2012). Interaction mechanisms between Na montmorillonite clay and MPEG-based polycarboxylate superplasticizers. Cem. Concr. Res. 42 (6), 847–854. doi:10.1016/j.cemconres.2012.03.005
Plank, J., and Hirsch, C. (2007). Impact of zeta potential of early cement hydration phases on superplasticizer adsorption. Cem. Concr. Res. 37 (4), 537–542. doi:10.1016/j.cemconres.2007.01.007
Qian, S., Yao, Y., Wang, Z., Cui, S., Liu, X., Jiang, H., et al. (2018). Synthesis, characterization and working mechanism of a novel polycarboxylate superplasticizer for concrete possessing reduced viscosity. Constr. Build. Mater. 169, 452–461. doi:10.1016/j.conbuildmat.2018.02.212
Ran, Q., Qiao, M., Liu, J., and Miao, C. (2012). Impact of molecular size of SMA-g-MPEG comb-like polymer on the dispersion of CaCO3 suspensions. Colloid Polym. Sci. 290 (5), 435–443. doi:10.1007/s00396-011-2554-1
Ran, Q., Somasundaran, P., Miao, C., Liu, J., Wu, S., and Shen, J. (2010c). Adsorption mechanism of comb polymer dispersants at the cement/water interface. J. Dispers. Sci. Technol. 31 (6), 790–798. doi:10.1080/01932690903333580
Ran, Q., Somasundaran, P., Miao, C., LiuWu, J. S., and Shen, J. (2009). Effect of the length of the side chains of comb-like copolymer dispersants on dispersion and rheological properties of concentrated cement suspensions. J. Colloid Interface Sci. 336 (2), 624–633. doi:10.1016/j.jcis.2009.04.057
Ran, Q. P., Liu, J. P., and Miao, C. W. (2019). Effects of the side chain length of comb-like copolymer superplasticizer on early hydration properties of concentrated cement suspensions. Constr. Build. Mater. 2019 (3), 26–32.
Ran, Q. P., Liu, J. P., and Miu, C. W. (2010b). Effect of the side chain length of comb-like copolymer superplasticizer on early hydration properties of concentrated cement suspensions. J. Chin. Ceram. Soc. 40 (9), 1718–1722. doi:10.14062/j.issn.0454-5648.2010.09.029
Ran, Q. P., Liu, J. P., Miu, C. W., Zhou, D. L., and Mao, Y. L. (2010a). Mechanism and effect of length of side chain in comb-like copolymer dispersants on dispersability retention of concentrated cement pastes. J. Southeast. Univ. Engl. Ed. 40 (S2), 138–143.
Scrivener, K. L., Juilland, P., and Monteiro, P. J. M. (2015). Advances in understanding hydration of Portland cement. Cem. Concr. Res. 78, 38–56. doi:10.1016/j.cemconres.2015.05.025
Tian, H., Kong, X., Su, T., and Wang, D. (2019). Comparative study of two PCE superplasticizers with varied charge density in Portland cement and sulfoaluminate cement systems. Cem. Concr. Res. 115, 43–58. doi:10.1016/j.cemconres.2018.10.003
Tian, Y. F., Zhu, X. P., Deng, Y. T., and Wang, K. (2014). Copolymerization kinetics of polyetyhylenglycol allylether type polycarboxylate superplasticizer. Adv. Mater. Res. Trans. Tech. Publ. Ltd. 936, 1393–1398. doi:10.4028/www.scientific.net/amr.936.1393
Vovk, A. I., Vovk, G. A., and Usherov-marshak, A. V. (1997). Regularities of hydration and structure formation of cement pastes in presence of superplasticizers with different molecular mass. Am. Concr. Inst. 173, 763–780. doi:10.14359/6212
Wang, X. L., Chen, X. L., Wang, L., and Chen, X. H. (2013). Determination of EVA absolute molecular weight and its distribution by multi-detector GPC/SEC. Nat. Gas. Chem. Ind. 38, 84–86.
Wang, Z., Lu, Z. C., Lu, F., Liu, X., and Li, H. (2013). Effect of backbone length on properties of comb-shaped structure polycarboxylate superplasticizers. J. Chin. Ceram. Soc. 41 (11), 1534–1539. doi:10.16865/j.cnki.1000-7555.2020.0223
Wang, Z. M., Zhang, L., Liu, X., and Mao, Q. J. (2020). Monomer reactivity and copolymer microstructural compositions of polycarboxylate ether superplasticizers. Polym. Mater. Sci. Eng. 36 (10), 7.
Wei, J. (2018). Effect of functional monomer on polycarboxylate superplasticizer for enhancing clay tolerance. Master's Theses. Shanxi, China: Shaanxi University of Science and Technology.
Winnefeld, F., Becker, S., Pakusch, J., and Götz, T. (2007). Effects of the molecular architecture of comb-shaped superplasticizers on their performance in cementitious systems. Cem. Concr. Compos. 29, 251–262. doi:10.1016/j.cemconcomp.2006.12.006
Wu, H. (2012). Influence mechanism of clay on the performance of polycarboxylate superplasticizer and control measures. Master’s Thesis. Beijing, China: Beijing University of Technology.
Xu, C., Li, H., Yang, X., Dong, B., and Wang, W. (2021). Action of the combined presence of CS-Hs-PCE and triethanolamine on the performances of cement paste/mortar. Constr. Build. Mater. 269, 121345. doi:10.1016/j.conbuildmat.2020.121345
Yamada, K., Takahashi, T., Hanehara, S., and Matsuhisa, M. (2000). Effects of the chemical structure on the properties of polycarboxylate-type superplasticizer. Cem. Concr. Res. 30 (2), 197–207. doi:10.1016/s0008-8846(99)00230-6
Yang, R., and He, T. (2021). Influence of liquid accelerators combined with mineral admixtures on early hydration of cement pastes. Constr. Build. Mater. 295, 123659. doi:10.1016/j.conbuildmat.2021.123659
Yi, C. H., Tang, Q. Q., Huang, X., and Qiu, X. Q. (2012). Adsorption behavior of polycarboxylate superplasticizer on cement particle surfaces. CIESC J. 63 (8), 2460–2468.
Yu, X. H., Zhang, Q. Q., and Liu, J. P. (2020). Effects of molecular weight of polycarboxylate superplasticizers on rheological properties of cement pastes. J. Southeast Univ. Engl. Ed. 50 (3), 482–487.
Zhang, D., Zhao, J., Wang, D., Xu, C., Zhai, M., and Ma, X. (2018). Comparative study on the properties of three hydraulic lime mortar systems: natural hydraulic lime mortar, cement-aerial lime-based mortar and slag-aerial lime-based mortar. Constr. Build. Mater. 186, 42–52. doi:10.1016/j.conbuildmat.2018.07.053
Zhang, H., Liu, C., Ren, X., Yang, H., and Lin, S. (2022). Synthesis of polycarboxylic ether superplasticizers based on the high conversion of EPEG in a transition metal oxide heterogeneous catalytic system. Colloids Surf. A 643, 128780. doi:10.1016/j.colsurfa.2022.128780
Zhang, S. M. (2019). Study on the hydration process and rheological properties of high-iron and low-calcium Portland cement. Master's Theses. Wuhan, China: Wuhan University of Science and Technology.
Zhang, X. L. (2011). Thermokinetic study on hydration of cementitious materials. Master’s Thesis. Wuhan, China: Wuhan University of Technology.
Zhang, Y., and Kong, X. (2015). Correlations of the dispersing capability of NSF and PCE types of superplasticizer and their impacts on cement hydration with the adsorption in fresh cement pastes. Cem. Concr. Res. 69, 1–9. doi:10.1016/j.cemconres.2014.11.009
Zhang, Y. R., Kong, X. M., Lu, Z. B., Lu, Z. C., and Hou, S. S. (2015). Effects of the charge characteristics of polycarboxylate superplasticizers on the adsorption and the retardation in cement pastes. Cem. Concr. Res. 67, 184–196. doi:10.1016/j.cemconres.2014.10.004
Zhang, Z. T. (2020). Study on the performance of polycarboxylate water reducer on ordinary Portland cement-sulfoaluminate cement composite system. Concr 2020 (01), 115–118.
Zhao, H. W., Liao, B., Nian, F. W., Wang, K., Guo, Y., and Pang, H. (2018). Investigation of the clay sensitivity and cement hydration process of modified HPEG-type polycarboxylate superplasticizers. J. Appl. Polym. Sci. 135 (32), 46572. doi:10.1002/app.46572
Zhao, Z. H., Meng, Z. H., Zhang, Z. J., Sun, J. X., Geng, C. Z., and Xia, Y. Z. (2021). Determination of molar mass, distribution and conformational properties of alginate by TDA-GPC. J. Mol. Sci. 37, 453–460. doi:10.13563/j.cnki.jmolsci.2021.05.401
Zhu, H. J. (2017). Study on preparation and properties of polycarboxylic superplasticizer possessing enhanced clay tolerance. Master's Theses. Shanxi, China: Shaanxi University of Science and Technology.
Zhu, J., Hui, J., Luo, H., Zhang, B., Wei, X., Wang, F., et al. (2021). Effects of polycarboxylate superplasticizer on rheological properties and early hydration of natural hydraulic lime. Cem. Concr. Compos. 122, 104052. doi:10.1016/j.cemconcomp.2021.104052
Zingg, A. (2008). Cement-superplasticizer interaction: link between macroscopic phenomena and microstructural data of the early cement hydration. Doctor’s Thesis. Switzerland: Swiss Federal Institute of Technology Zurich ETH, Rapperswil, BE.
Keywords: EPEG, rheology, adsorption, hydration, microstructure
Citation: Fang Y, Wang Z, Yan D, Lai H, Ma X, Lai J, Liu Y, Zhong L, Chen Z, Zhang X, Lin Z and Wang D (2024) Study on rheological, adsorption and hydration properties of cement slurries incorporated with EPEG-based polycarboxylate superplasticizers. Front. Mater. 11:1358630. doi: 10.3389/fmats.2024.1358630
Received: 20 December 2023; Accepted: 22 January 2024;
Published: 13 February 2024.
Edited by:
Siqi Ding, Hong Kong Polytechnic University, Hong Kong SAR, ChinaCopyright © 2024 Fang, Wang, Yan, Lai, Ma, Lai, Liu, Zhong, Chen, Zhang, Lin and Wang. This is an open-access article distributed under the terms of the Creative Commons Attribution License (CC BY). The use, distribution or reproduction in other forums is permitted, provided the original author(s) and the copyright owner(s) are credited and that the original publication in this journal is cited, in accordance with accepted academic practice. No use, distribution or reproduction is permitted which does not comply with these terms.
*Correspondence: Dongming Yan, ZG15YW5Aemp1LmVkdS5jbg==
Disclaimer: All claims expressed in this article are solely those of the authors and do not necessarily represent those of their affiliated organizations, or those of the publisher, the editors and the reviewers. Any product that may be evaluated in this article or claim that may be made by its manufacturer is not guaranteed or endorsed by the publisher.
Research integrity at Frontiers
Learn more about the work of our research integrity team to safeguard the quality of each article we publish.