 Mingfeng Xu
 Hui Li
 Ru Mu2,3
- 1State Key Laboratory of Building Safety and Built Environment and National Engineering Research Center of Building Technology, Beijing, China
- 2School of Civil and Transportation Engineering, Hebei University of Technology, Tianjin, China
- 3Tianjin Key Laboratory of Prefabricated Building and Intelligent Construction, Hebei University of Technology, Tianjin, China
The magnetic field method for preparing aligned steel fiber-reinforced concrete (ASFRC) by solenoid coil has a limitation, which is that the specimen must be placed inside the solenoid coil, limiting its practical engineering application. To overcome this shortcoming, this study proposes a method for preparing ASFRCs using an external magnetic field created by assembled magnets. A theoretical model is proposed to predict the distribution of the external magnetic field and the orientation coefficient of ASFRCs prepared by assembled magnets. The predicted results are compared with the experimental results to verify the proposed model. Finally, flexural tests are used to compare the mechanical characteristics of ASFRCs prepared using assembled magnets and solenoid coil. The results indicate that the assembled magnets can be used to prepare the ASFRC with an orientation coefficient of 0.9 or higher, and the flexural strength is similar to that of the ASFRC prepared by the solenoid coil.
1 Introduction
Adding steel fibers to concrete can improve ductility, tensile and shear strength, fatigue strength, and impact resistance (Altun et al., 2007; Zhao et al., 2018; Zhang et al., 2021a). In recent years, with the development of ultra-high-performance concrete (UHPC), steel fibers have been widely used to enhance composites and prevent cracking (Zhang et al., 2021b; Wang et al., 2022; Zhang et al., 2022).
The reinforcement efficacy of steel fibers in cement-based materials depends on many factors, such as fiber properties, content, and distribution characteristics (Wu et al., 2019; Huang et al., 2021; Meng et al., 2022). The fiber distribution, particularly the orientation, significantly influences the performance of the composites (Mara et al., 2019; Teng et al., 2022). The steel fibers oriented in the direction of tensile stress provide full play to improve the tensile strength of the composites. In contrast, strengthening the tensile strength by fibers perpendicular to the direction of tensile stress has little impact (Mu et al., 2019). To enhance the performance of the composites, controlling fiber alignment in fresh cement-based composites has become a focus of study. The most efficient and popular technique is magnetic fields for aligning steel fibers (Hatta and Yamashita, 1988). In the 1970s, Miller used electric fields to align steel fibers (Miller and Fritz, 1977). Knoblach (Knoblach, 1989), Bayer (Bayer, 1988) and West (West et al., 2005) proposed aligning steel fibers using a magnetic field in concrete following Miller. Subsequently, Mu (Mu et al., 2017) improved the control method for preparing high-performance steel fiber-reinforced concrete called aligned steel fiber-reinforced concrete (ASFRC). In this method, the mixture is placed inside an empty interior chamber looped by a square solenoid coil and the steel fibers are aligned by the uniform magnetic field offered by the solenoid. The orientation coefficient of ASFRC prepared by the square solenoid coil can exceed 0.9, and the ASFRC exhibits flexural strengths of 88% greater than SFRC when the fiber volume fractions are 0.8% (Mu et al., 2018). According to Qing et al. (Qing et al., 2019), the dosage of steel fibers can be decreased by at least 40% if the tensile strength of ASFRC utilizing aligned steel fiber technology is equal to that of SFRC (it may even be somewhat greater).
The solenoid coil provides a perfectly uniform magnetic field inside its cavity (called internal magnetic field in this study) to prepare the ASFRC. However, the specimen must be placed inside the solenoid coil during casting, limiting its practical engineering application. Still, the size of the internal magnetic field is limited by the size of the solenoid coil, limiting the size of the prepared ASFRC specimen. To overcome this shortcoming, Mu proposed a preparation method for ASFRC using assembled magnets (Mu et al., 2021), using the magnetic field formed around the assembled magnets (called the external magnetic field in this study) to achieve orientation control of steel fibers. The external magnetic field offered by the assembled magnets is not evenly distributed, in contrast to the solenoid’s uniform magnetic field, and the magnetic induction direction and strength change with respect to the distance from the magnetic field source (Grant and Phillips, 2013). When an external magnetic field is employed to align the fibers in composites, the magnetic field variation has a significant impact on the alignment of the fibers. Therefore, the key to effectively using an external magnetic field to prepare an ASFRC is to learn and understand the magnetic field distribution of assembled magnets.
This study aims to study the relationship between the distribution of magnetic field created by assembled magnets and the fiber orientation of ASFRC prepared by assembled magnets to provide a calculation model for designing the size and magnetic field strength of assembled magnets according to the actual needs in ASFRC preparation of practical engineering.
The objective of this study is to investigate the correlation between the distribution of magnetic field produced by magnets assembled and the fiber orientation of ASFRC prepared by assembled magnets, with the aim of developing a calculation model that can be used to design the size and magnetic field strength of assembled magnets based on the actual requirements in practical engineering for ASFRC preparation. A theoretical prediction model is proposed to predict the distribution of the external magnetic field offered by assembled magnets. The orientation coefficients of the ASFRC under an external magnetic field created by assembled magnets are computed using a theoretical model based on mechanics and electromagnetics. Then, ASFRC is prepared using the assembled magnets. The influence of the magnetic field created by assembled magnets on the fiber orientation of ASFRC is investigated according to the variation of the fiber orientation coefficient in ASFRC under the different sizes of assembled magnets. Finally, flexural tests are used to compare the mechanical characteristics of the ASFRCs prepared by the assembled magnets and solenoid coil.
2 Theoretical analysis
2.1 Magnetic field distribution around the assembled magnets
When exposed to a magnetic field, the steel fibers become magnetized with N and S poles at each end. The steel fiber rotates and turns in a direction that coincides with the magnetic induction lines of the magnetic field. Therefore, forming a magnetic field with a fixed direction of the magnetic induction lines is essential for aligning steel fibers using a magnetic field. The bar magnet with a rectangular cross-section (bar magnet for short in this study) creates a zone where the magnetic induction lines are almost straight, as shown in Figure 1. That means the intensity of the magnetic field components in the Y- and X-directions is much smaller than in the Z-direction. These components are so small that they can be ignored. However, due to the limitation of the dimension, a single bar magnet cannot provide sufficient size and intensity of the magnetic field to rotate the steel fibers in fresh cement-based materials. Then, the connection of a series of bar magnets is required to ensure that the magnetic field is sufficiently strong and big. In addition, using multiple magnets creates a more flexible magnetic field that can easily adapt to the size of engineering structures. When bar magnets are connected in series, the magnetic fields of the magnets superpose, and the magnetic induction lines become flat and dense. In addition, wavy magnetic induction lines are formed between the gaps of two adjacent magnetic poles (i.e., the magnetic leakage), as shown in Figure 1. The wavy magnetic induction lines can be neglected when the gap spacing between two adjacent magnetic poles is small enough. The magnetic field with quasi-straight magnetic induction lines at the lower side of the assembled magnets can then be used to align the fibers to prepare ASFRCs.

FIGURE 1. Magnetic induction line distribution of the single magnet and assembled magnets.
Liu (Li et al., 2008) derived an analytical equation to describe the magnetic field distribution around a single magnet based on Biot-Savart’s law and Ampere’s molecular circulation hypothesis. This study derives an analytical expression of the magnetic field distribution around the assembled bar magnets based on Liu’s work. Figure 2 illustrates a rectangular-cross section bar magnet with dimensions a, b, and h.
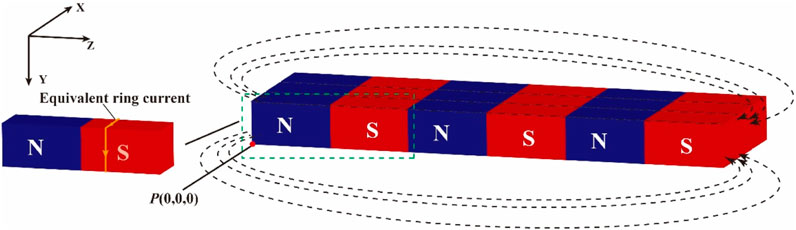
FIGURE 2. Formation of the magnetic field around assembled bar magnets.
According to Ampere’s molecular circulation hypothesis (Young et al., 1996; Tang et al., 2021), the closed current loop on the side surface of the bar magnet excites the magnetic field outside the bar magnet. The magnetic induction at any point P(x, y, z) outside the bar magnet can be expressed as Eqs 1–3 (Li et al., 2008):
The auxiliary functions' expressions are expressed by Eqs 4–6:
where μ0 is the vacuum permeability, equals to 4π×10–7(H/m), and Js is the magnetization current density (A·m) in the loop, which is related to the magnetic properties of permanent magnet materials.
Assuming that the assembled magnets are arranged in m rows and n columns. The superimposed magnetic induction intensity at any point P (x, y, z) outside the assembled magnets can be expressed using the Eqs 7-18:
where Bxt, Byt, and Bzt are the magnetic induction components of the assembled magnets along the X-, Y-, and Z-direction, respectively, at any point (T); Bxai, Bxbj, and Bxck are the magnetic induction components of any square magnet in the assembled magnets along the X-direction at any point (T); Byai, Bybj, and Byck are the magnetic induction components of any square magnet in the assembled magnets along the Y-direction at any point (T); Bzai, Bzbj, and Bzck are the magnetic induction components of any square magnet in the assembled magnets along the Z-direction at any point (T); and sd is the distance between the combined bar magnets (mm).
2.2 Rotational behavior of steel fibers in fresh cement-based materials under the magnetic field created by the assembled magnets
When a sufficiently large external magnetic field created by the assembled magnets is applied to fresh steel fiber-reinforced cement-based materials, the fiber overcomes the yield stress of the cement to rotate. At this stage, the steel fiber is subjected to magnetic force, flow resistance, gravity, and buoyancy, as shown in Figure 3. Gravity and buoyancy are in the vertical direction and have no influence on the rotation of the steel fibers, but only on the motions of sinking or floating.
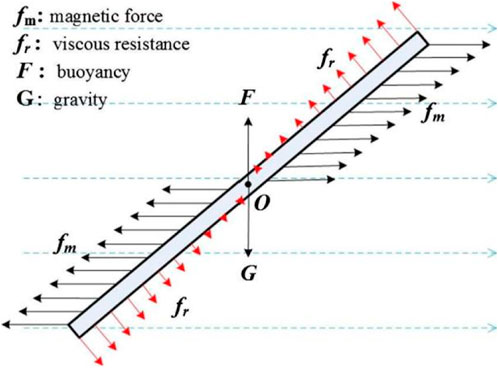
FIGURE 3. The forces on a steel fiber in cement mortar when a magnetic field is applied (Mu et al., 2017).
2.2.1 Magnetic force
Based on Ampere’s molecular circulation hypothesis (Grant and Phillips, 2013), magnetic molecules typically have a haphazard molecular current orientation. The magnetic fields produced by them cancel out each other and do not exhibit external magnetism. After being placed in a magnetic field, the influence of neighboring currents between molecules in the steel fiber is canceled, whereas the effect of surface currents is not canceled, causing the steel fiber to exhibit external magnetism, as shown in Figure 4.
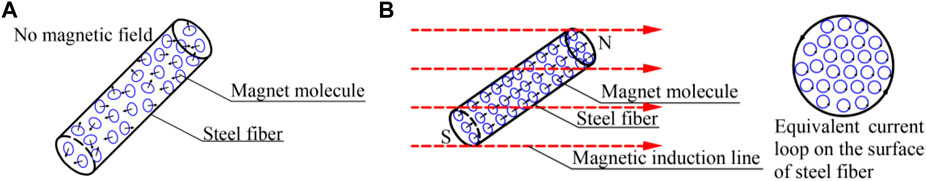
FIGURE 4. Molecular circulation of steel fiber (A) Molecular circulation (no magnetic field applied), (B) Molecular circulation (applied magnetic field).
The magnetized fiber is then subjected to a magnetic moment in a magnetic field, and the magnetic torque of the steel fiber can be represented by Eq. 19 (Mu et al., 2017):
where T1 is the magnetic torque acting on the steel fiber (N·m), M is the magnetization intensity (molecular magnetic moment per unit volume) (A/m), S is the cross-sectional area of the steel fiber (m2), B is the magnetic induction intensity, l is the length of the steel fiber (m), and φ(t) is the angle between the steel fiber and magnetic induction line at time t (rad).
The magnetization intensity of a ferromagnetic material, M, varies with the external magnetic field and is also correlated with the material properties (Grant and Phillips, 2013). This can be expressed using Eq. 20:
where µ is the relative permeability (H/m).
The expression of the magnetic torque acting on the steel fiber can be obtained when substituting Eq. 20 into Eq. 19, which is expressed by Eq. 21:
2.2.2 Flow resistance
During the rotation of steel fibers in fresh cement-based materials under an external magnetic field, fresh cement paste plays a role in resisting the rotation of the steel fibers. Because the cement-based material is a Bingham fluid (Roussel, 2011), the shear stress acting on the steel fiber caused by the cement-based material can be expressed by Eq. 22 (Bingham, 1917; Yang et al., 2021):
where τ is the shear stress (Pa), dv/dy is the shear rate (s-1), η is the viscosity coefficient (Pa·s), and τ0 is the yield stress (Pa).
The resistance moment acting on the steel fiber caused by the shear stress of fresh cement-based materials can be expressed by Eq. 23:
where D is the steel fiber diameter (m).
2.2.3 Rotation of steel fiber
As mentioned above, the rotation of steel fibers is a consequence of the magnetic torque (driving force) and resistance moment (caused by fresh cement-based materials). According to the angular momentum theorem (Eq. 24):
The moment of inertia of steel fiber is expressed by Eq. 25 (Jones, 2013):
where J is the moment of inertia of the steel fiber (m4), α is the angular acceleration of the steel fibers (rad/s), ρ1 is the steel fiber density (kg/m3), and R is the steel fiber radius (m).
The starting value on the right-hand side of Eq. 24 appears to be greater than zero for the fiber to rotate. As the steel fiber rotates in the magnetic field direction, the magnetic torque acting on the fiber gradually decreases and eventually reaches zero. Therefore, the rotation of the steel fiber is accelerated first and then decelerates when the magnetic torque is lower than the resistance moment. Finally, the steel fiber stopped rotating in a direction nearly parallel to the magnetic field at the position of the fiber centroid, as shown in Figure 5.
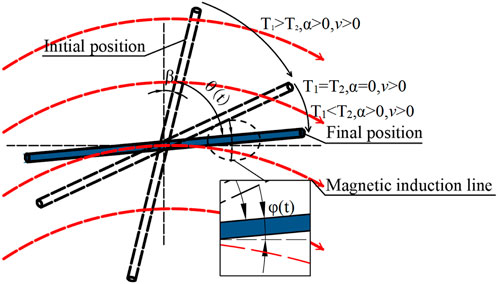
FIGURE 5. Diagram of steel fiber rotation in fresh cement-based material under magnetic field.
According to Eqs 21-25, the equation of angular momentum has been transformed into Eq. 26:
During rotation, the following relationship exists between the angular displacement of the steel fiber θ(t) (rad), angular velocity ω(t) (rad/s), and angular acceleration α(t) (rad/s2) are expressed by Eqs 27, 28:
In every case, the included angle φ(t) and steel fiber angular displacement θ(t) are maintained as Eq. 29:
where β is the initial angle of the steel fiber (rad).
Eq. 26 can be solved by combining Eqs 27, 29, then the angular acceleration of steel fiber at time t can be expressed by Eq. 30:
2.2.4 Characterization of fibers orientation
The orientation coefficient is generally used to character the fiber orientation distribution in steel fiber-reinforced concrete. It is the ratio of the sum of the effective lengths of the steel fibers projected in the direction of tensile stress to the total length of all fibers, which can be calculated using Eq. 31.
where ηθ is the orientation coefficient, n is the number of fibers, and θi is the angle between the ith steel fiber and the magnetic induction line.
Obviously, under the a certain magnetic field for a certain time, the final rotation angles of all the steel fibers in the fresh cement-based materials determine the orientation coefficient of the steel fiber-reinforced concrete, which can be expressed as Eq. 32.
where φi(t) is the angle between the ith steel fiber and the magnetic induction line after the magnetic field acts for time t, (°).
Assuming that the initial direction of the steel fiber in the matrix is completely random, the orientation coefficient of the steel fiber-reinforced concrete is the average value of the final rotation direction of the steel fiber at various initial angles (0°–90°). Eq. 15 and 30 are substituted into Eq. 32, the orientation coefficient of steel fiber-reinforced concrete under a certain magnetic field can be predicted by Eq. 33.
where Bi is the magnetic induction intensity at the position of the ith steel fiber.
In the area below the assembled magnets, the magnetic induction lines are a quasi-straight line at positions far from both ends of the assembled magnets, while it is a curve at positions close to both ends of assembled magnets, as shown in Figure 1. The zone with magnetic lines as quasi-straight is used to prepare ASFRC. Therefore, the component magnetic induction intensity in the Y- and X-direction of the magnetic field in this zone is small enough to be neglected. The final orientation of steel fibers is assumed to depend only on the component of magnetic induction intensity in the Z-direction. Basing on this assuming, the calculation (prediction) equation of the orientation coefficient of the steel fiber-reinforced concrete under a magnetic field offered by assembled magnets is obtained, as shown in Eq. 34:
where Bzti is the component of the magnetic induction intensity along the Z-direction of the assembled magnets at the position of the ith steel fiber.
3 Experimental program
Eqs 7–18 and Eq. 34 can be used to character the magnetic field distribution around assembled magnets and to predict the fiber orientation coefficient of ASFRC prepared by assembled magnets. To verify the accuracy of Eqs 7–18 and Eq. 34, a series of experiments described below were carried out. The theoretical calculation and experimental results described below were also used to investigate the influence of the magnetic field offered by assembled magnets on the fiber orientation in ASFRC.
3.1 Raw materials and mixes
Ordinary Portland cement type P∙O 42.5 (Chinese Standard of GB 175–2007) and river sand with a fineness modulus of 2.5 (Chinese Standard of GB 14684–2022) were used to prepare steel fiber-reinforced cement mortar. A straight steel fiber with a length of 30 mm and 0.5 mm diameter was used, and the properties of steel fiber were listed in Table 1.
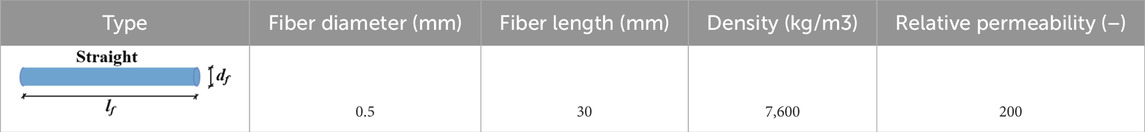
TABLE 1. Properties of steel fiber.
A superplasticizer was used to control the rheology of the cement mortar with a 0.36 water-cement ratio. Two reference mortar mixes were designed with a water-cement ratio of 0.36 and 0.42, respectively (Table 2). The rheology properties of these mortars are also tested by using the rheometer ViskomatTM NT, following the method proposed by (Banfill, 1994). The rheology properties of cement mortar with different W/C were also listed in Table 2.
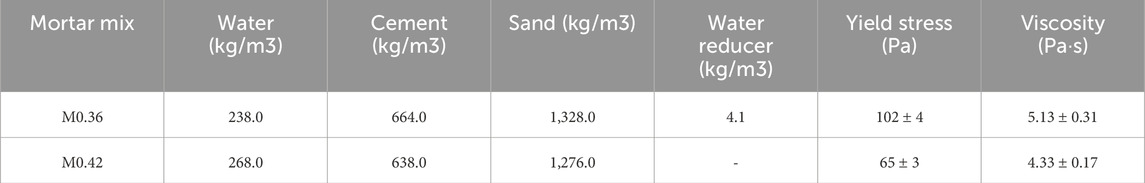
TABLE 2. Mixing proportion of cement mortar.
Each reference mortar mix was used to prepare four types of steel fiber-reinforced specimens by incorporating steel fibers at volume fractions of 0.4%, 0.8%, 1.2%, and 1.6%. For each steel fiber-reinforced cement mortar mix, three types of fiber orientation of specimens were prepared from the same batch: SFRC with random fiber orientation (RSFRC), ASFRC prepared using an internal uniform magnetic field offered by solenoid coil (I-ASFRC), and ASFRC prepared using an external magnetic field offered by assembled magnets (E-ASFRC).
3.2 Procedure of preparing ASFRC
The I-ASFRC was prepared following the method proposed by Mu (Mu et al., 2017). During the preparation of the I-ASFRC, an aligning setup with an electric magnetic coil and adjustable DC power was used to provide an approximately uniform magnetic field with adjustable magnetic field strength, as shown in Figure 6. After mixing, fresh composites were poured into a plastic mold. The plastic mold was placed inside the electric magnetic coil device. Then, the mold, together with the device of the electric magnetic coil, was placed on the compacting table. The aligning setup and compacting table were turned on for approximately 40 s, and then the compacting table was first switched off. When the compacting table completely stopped, the alignment setup was switched off. The plastic mold was pulled out from the coil and placed in a curing room.
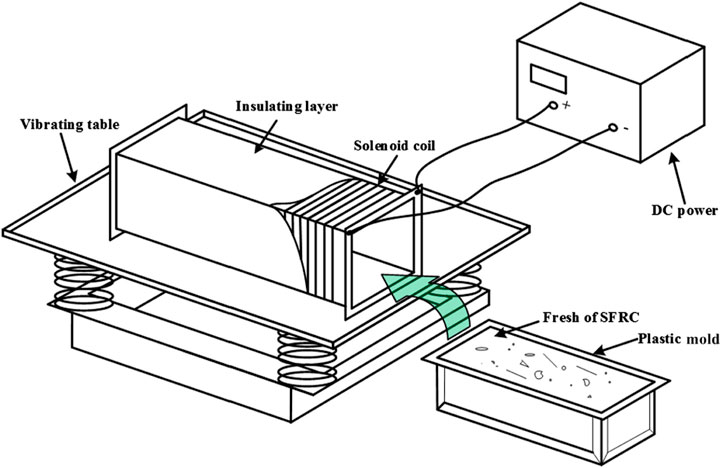
FIGURE 6. Experimental device for aligning steel fibers in concrete with a uniform magnetic field offered by solenoid coil (Mu et al., 2017).
To prepare the E-ASFRC, the assembled magnets shown in Figure 7 were used to offer a stable external magnetic field. The device consists of rubidium iron boron magnet pieces. The size of the rubidium iron boron magnet was 20 mm × 20 mm×5mm, and the surface magnetic density of the magnet was 280 mT. Several rubidium iron boron magnets are assembled into bar magnets, and several bar magnets are combined to form a square device that offers an external magnetic field. The device’s dimensions can be adjusted by controlling the number of iron boron magnet pieces and iron boron magnet pieces to meet the preparation requirements of E-ASFRC with different sizes. The advantage of the assembled magnets is that the size of the assembled magnets (or the number of rubidium iron boron magnets) can be flexibly adjusted according to the size of the specimen to be prepared. The larger the size of the specimen, the greater the size of the assembled magnet and the number of magnetic sheets required. The size of the specimens used in this study was 100 mm × 100 mm × 400 mm. Based on the size of this specimen, assembled magnets with dimensions of 130 mm × 150 mm × 26 mm, 130 mm × 450 mm × 26 mm, and 390 mm × 150 mm × 26 mm were prepared to investigate the influence of the device dimensions on the magnetic field distribution of the external magnetic field and the influence of magnetic field on the fiber orientation of E-ASFRC preparation.
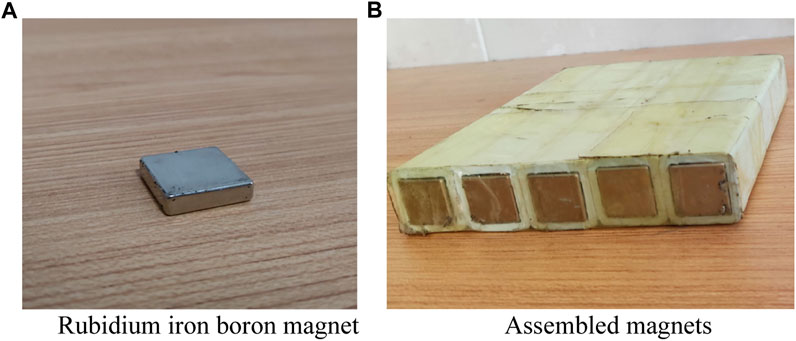
FIGURE 7. Assembled magnets (A) Rubidium iron boron magnet, (B) Assembled magnets.
The E-ASFRC was prepared using the magnet assembled above. In the preparation of E-ASFRC, the fully mixed fresh composites were poured into a plastic mold, and the mold was placed on the compacting table. A partition board was placed on the plastic mold to prevent the steel fiber in the mixture from being taken up by the assembled magnets. After the assembled magnets and partition board were placed appropriately on the mold, the compacting table was turned on to vibrate. After vibration, the assembled magnets and partition board were removed and the specimen was demolded after curing for 24 h. To investigate the influence distance between the assembled magnets and specimen surface, E-ASFRCs were prepared using assembled magnets with heights of 0, 10, 20, and 30 mm, respectively, as shown in Figure 8. The specimen was divided into four distinct regions with a height of 25 mm in each region to investigate the variation in fiber orientation with different height positions (as shown in Figure 8). The fiber orientation was separately measured for each region. The fractured cross-section and fiber distribution of the prepared E-ASFRC and I-ASFRC are shown in Figure 9. As shown in Figure 9, the steel fibers in both E-ASFRC and I-ASFRC are aligning well and homogeneously distributed in the matrix. The fiber orientation factor is calculated according to the angle between the fiber and the normal vector of the fractured cross-section, and the angle of each fiber was measured using a protractor.
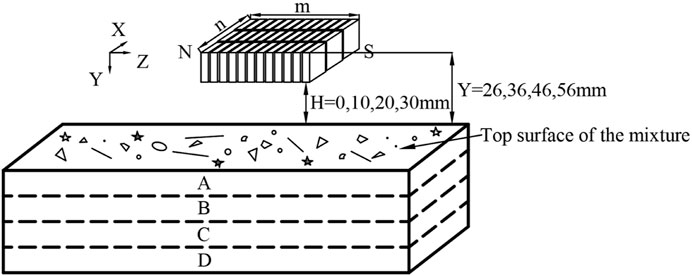
FIGURE 8. Preparation process of ASFRC using assembled magnets.
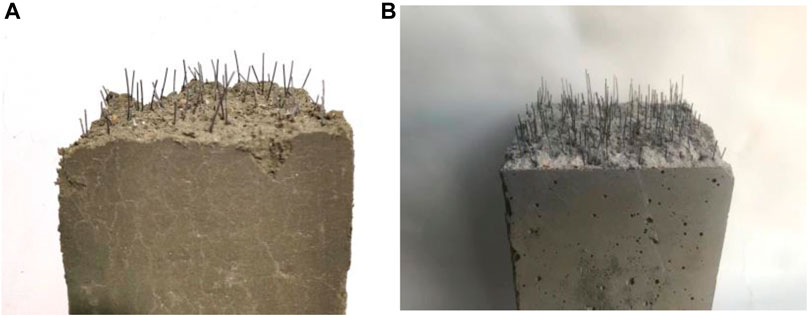
FIGURE 9. Fractured cross-section and fiber distribution of the E-ASFRC and I-ASFRC (A) E-ASFRC, (B) I-ASFRC.
3.3 Experiment method
3.3.1 Measurement of the magnetic field distribution of the assembled magnets
A transparent acrylic frame was used to measure the magnetic field distribution of the assembled magnets, as shown in Figure 10. The assembled magnets with different sizes and numbers of iron boron magnet pieces were placed at the bottom of the frame.
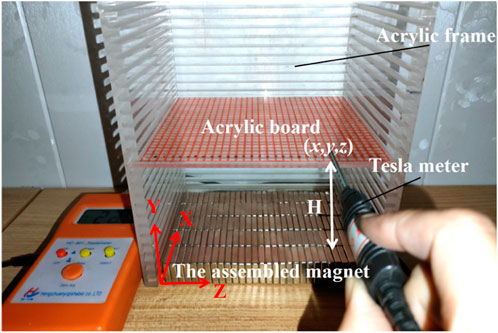
FIGURE 10. Coordinate determination device.
There was a little between the measured assembled magnets and the assembled magnets used to prepare E-ASFRC. That was, the assembled magnets used to prepare E-ASFRC had a certain gap spacing between two assembled adjacent bar magnets, while there was almost no space between two assembled bar magnets. This purpose of this processing is to reduce the interference of magnetic leakage caused by the gap spacing between two assembled adjacent bar magnets on the measurement of the magnetic field distribution. A movable transparent board was placed at a certain height in the frame, and equidistant grids were drawn on the surface of the board to express the coordinates of different positions at the same height. Then, the magnetic field intensity generated by the assembled magnets device at any position was measured by a T m. The position can be recorded as the coordinate values of (x, y, z).
3.3.2 Test method for flexural strength
The flexural strengths of the RSFRC, I-ASFRC, and E-ASFRC were determined by three-point bending tests according to ASTM C1609 (ASTM C1609/C1609M-12, 2012), using prisms of 100 mm × 100 mm × 400 mm. The loading device is shown in Figure 11. The fiber orientation in I-ASFRC and E-ASFRC was perpendicular to the loading direction to give full play to the reinforcing and crack resistance effects of fibers. Using displacement control method, the initial loading speed is 0.1 mm/min. When the mid-span deflection reaches 3 mm, the loading speed is adjusted to 0.5 mm/min. Owing to the large dispersion of the cement-based composite materials, the arithmetic mean of the test results of each group of three specimens was used as the flexural strength of each group of specimens in this test. The flexural strength was calculated using Eq. 35:
where ffc is the flexural strength (MPa), Fmax is the peak load (kN), L is the distance between the supports of the specimen (300 mm), A is the specimen section width (100 mm), and H is the specimen section height (100 mm).
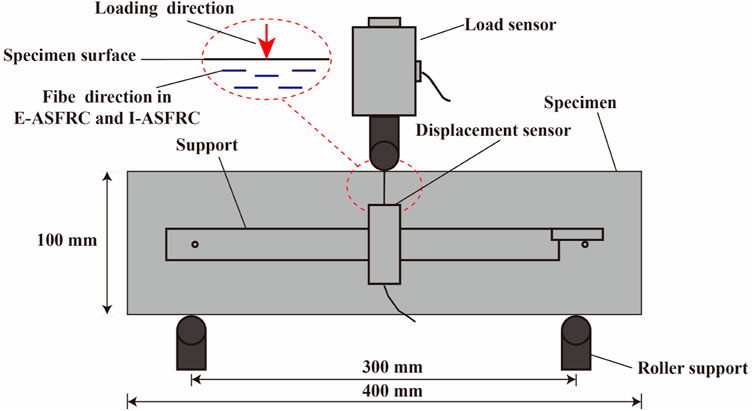
FIGURE 11. Schematic diagram of three point bending test device.
According to ASTM C1609 (ASTM C1609/C1609M-12, 2012), the flexural toughness can be evaluated by the toughness index T150 and residual flexural strength determined from flexural tests. The toughness index T150 is the area under the load-deflection curve up to a deflection of 1/150 of the span length of the specimen, which is expressed by Eq. 36.
where P150 and P600 represent the residual loads at deflections L/150 and L/600, respectively (MPa).
4 Results and discussion
4.1 Magnetic field distribution of the assembled magnets
Figure 12 shows the variation of the component of magnetic induction intensity in the Z-direction offered by assembled magnets with sizes of 130 mm × 150 mm × 26 mm, as calculated theoretically and measured experimentally. The theory calculation results are in excellent agreement with the experimental results, with an error of less than 5%. A possible cause of the low errors in the simulation may be that the magnetic leakage between two adjacent magnets disturbs the magnetic field distribution in a real situation. As shown in Figure 12, the magnetic induction intensity component in the Z-direction exceeded 10 mT at a position near the assembled magnets (Y = 26 mm), and the maximum value can reach 65 mT. As the distance between the measured height and the assembled magnets increases, the magnetic induction intensity component along the Z-direction decreases, and the minimum magnetic induction intensity component along the Z-direction decreases to 3 mT at the plane of Y = 126 mm.
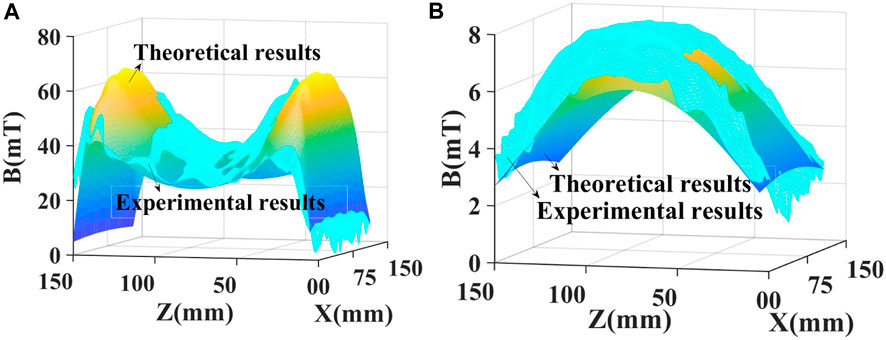
FIGURE 12. Variation of the component of magnetic induction intensity along Z-direction Bzt generated by the device of assembled magnets with sizes of 130 mm × 150 mm × 26 mm at the plane of (A) Y = 26 mm, and (B) Y = 126 mm.
The variations of the magnetic induction intensity component in the X-direction, Bxt, generated by the assembled magnets with sizes of 130 mm × 150 mm × 26 mm at the plane of Y = 26 mm and Y = 126 mm are shown in Figure 13. The results indicate that the magnetic induction intensity component in the X-direction is very small (less than 10 mT), except for the four corner areas of the plane. Therefore, the magnetic induction intensity component along the X-direction has little effect on aligning steel fibers for ASFRC, consistent with the analysis and assumptions in Section 2. The external magnetic field generated by the device of the assembled magnets can realize the alignment of steel fibers in a certain direction (the Z direction) to realize the preparation of E-ASFRC.
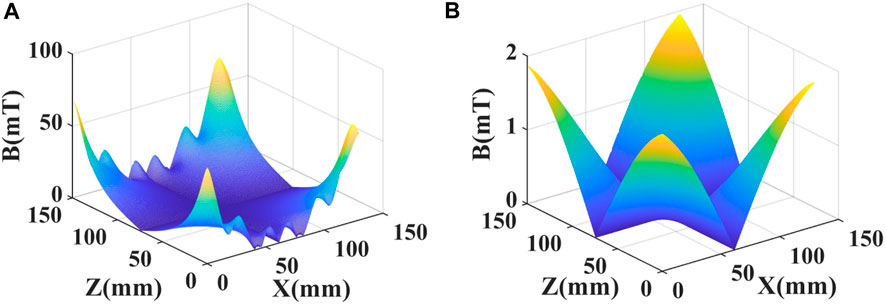
FIGURE 13. Variation of the component of magnetic induction intensity along x direction Bxt generated by the device of assembled magnets at the plane of (A) Y = 26 mm, and (B) Y = 126 mm.
The variations in the magnetic induction intensity component along the Z-direction with the height for different assembled magnet sizes are shown in Table 3. The results indicate that at a position near the assembled magnets, the magnetic induction intensity component along the Z-direction at both ends of the plane is higher than that in the middle zones. As the height (Y) increased, the decay rate of the induction intensity component along the Z-direction at both ends was faster than that in the middle zones. The difference in magnetic induction intensity between both ends and the middle zone gradually decreases, or even the magnetic induction intensity component along the Z-direction in the middle zone exceeds that at both ends when the height (Y) is greater than 76 mm (except for the assembled magnets of dimensions 130 mm × 450 mm × 26 mm). The results also indicate that increasing the length of the magnetic pieces (along the Z-direction) increases the magnetic field intensity of each area. Referring to the study by Mu (Mu et al., 2021), assembled magnets with dimensions of 130 mm × 150 mm × 26 mm can be used to prepare the E-ASFRC specimen with dimensions of 100 mm × 100 mm × 400 mm. However, increasing the width of the magnetic pieces (along the X-direction) does not increase the magnet induction intensity. Instead, it increased the decay rate of the magnetic induction intensity in the height (Y) direction. Therefore, it is unnecessary to increase the width of the magnetic devices. In applications, the width only needs to meet the size of the prepared E-ASFRC.
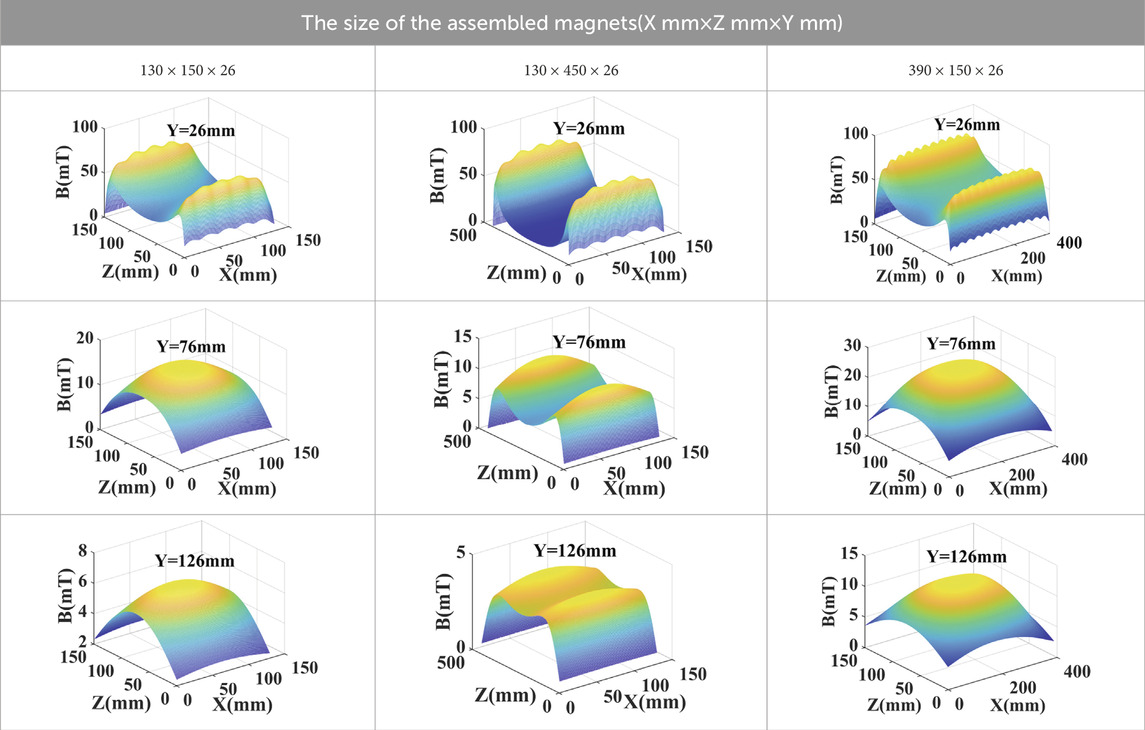
TABLE 3. Magnetic field distribution of the device of assembled magnets with different sizes.
4.2 Fiber orientation of E-ASFRC
The variation of fiber orientation with the assembled magnets device (130 mm × 150 mm×26 mm) for E-ASFRC with different water-cement ratios and fiber contents is predicted by Eq. 34, and the experiment. The parameters used in Eq. 34 are listed in Table 4, and the calculated and experimental results are listed in Table 5.
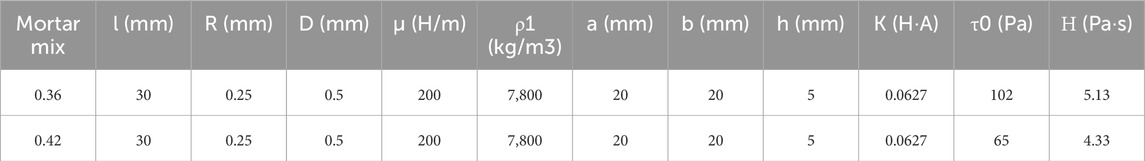
TABLE 4. Input parameters.

TABLE 5. Orientation distribution of steel fibers in sections A, B, C and D of E-ASFRC.
The results indicate that the calculation results agree well with the experimental results. This model can predict the fiber orientation coefficient of an E-ASFRC prepared using the assembled magnets. As the distance between assembled magnets and specimen surface (i.e., the height of assembled magnets) increases, the fiber orientation coefficient of the four measured regions in the E-ASFRC decreases. For 0.36 of water-cement ratio, the largest decay of the fiber orientation coefficient is observed in region D, which decreases from 0.893 to 0.649 when the height of assembled magnets and specimen surface increases from 0 to 30 mm. For the E-ASFRC prepared using the 0 mm height of the assembled magnets device, the orientation coefficient of region D reaches 0.953. However, some steel fibers on the substrate surface of the matrix are attracted by the assembled magnets device, which is almost perpendicular to the substrate surface of the matrix, as shown in Figure 14. The phenomenon that the steel fibers stick out from the surface is caused by the magnetic leakage between the two adjacent rubidium iron boron magnets. Although the leakage between adjacent magnetic sheets is small, when the assembled magnet is very close to the surface of the specimen, this leakage is sufficient to attract steel fibers to expose the surface of the specimen. Therefore, the orientation coefficient of region A is only 0.642 when the distance between the assembled magnets and the specimen surface is 0 mm. For the E-ASFRC prepared using the 10 mm height of the assembled magnets device, the orientation coefficients of the four regions are higher than 0.9, and the magnets do not attract the steel fiber on the substrate surface of the matrix. Therefore, a height of 10 mm is optimum for preparing E-ASFRC with dimensions of 100 mm × 100 mm × 400 mm. This height can be used when preparing test pieces of other sizes, and the required magnetic field strength can be calculated using Eq. 34. In addition, the orientation coefficient also decreases as the water-cement ratio decreases. Therefore, a stronger magnetic field is needed to prepare the E-ASFRC with a lower water-cement ratio.
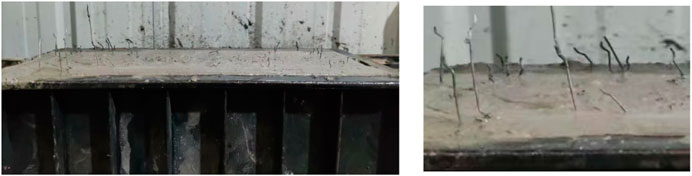
FIGURE 14. Steel fibers sticking out from the specimen surface when the distance between the surface and the assembled magnets is too small.
4.3 Flexural strength
The flexural load-deflection curves of E-ASFRC prepared using a magnet with a height of 10 mm and size of 130 mm × 150 mm×26 mm, I-ASFRC, and RSFRC are shown in Figures 15, 16. The flexural strength changes with fiber content and water-cement ratio are shown in Figure 17. Because the fiber orientation coefficient of E-ASFRC is closer to that of I-ASFRC, the flexural strength and deflection curve of E-ASFRC are closer to those of I-ASFRCs and are much higher than those of RSFRC. These results indicate that using the assembled magnets to prepare ASFRCs can replace the solenoid coil.
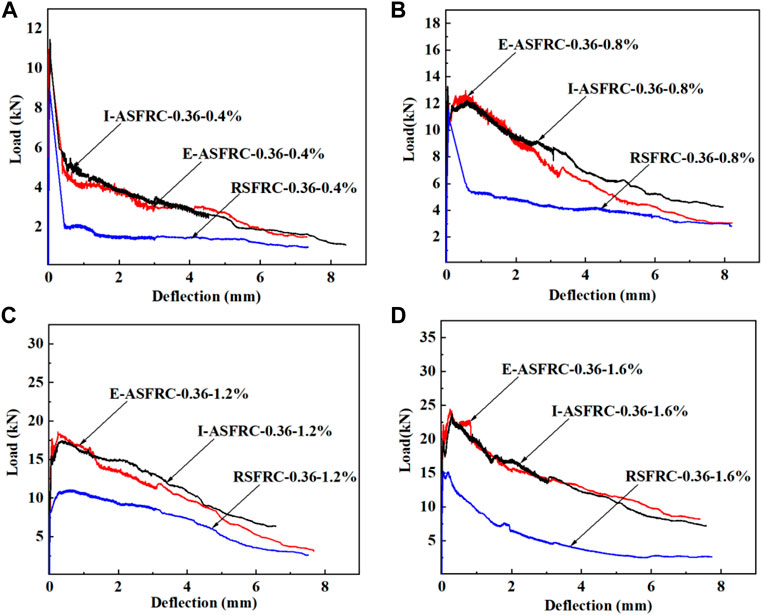
FIGURE 15. Load vs. deflection of steel fiber reinforced cement-based composite specimens with different fiber content (w/c = 0.36) (A) Vf = 0.4%, (B) Vf = 0.8%, (C) Vf = 1.2%, (D) Vf = 1.6%.
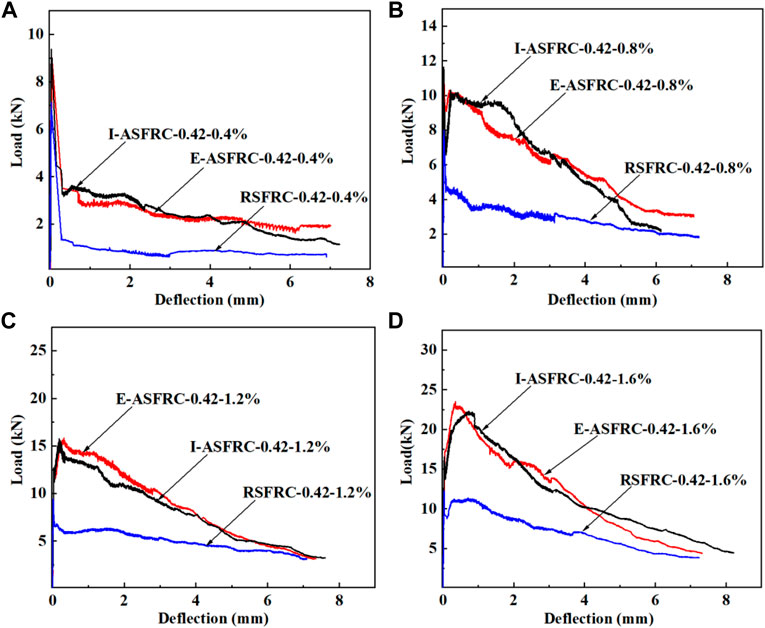
FIGURE 16. Load vs. Deflection of steel fiber reinforced cement-based composites specimens, with different fiber content (w/c = 0). (A) Vf = 0.4%, (B) Vf = 0.8%, (C) Vf = 1.2%, (D) Vf = 1.6%.
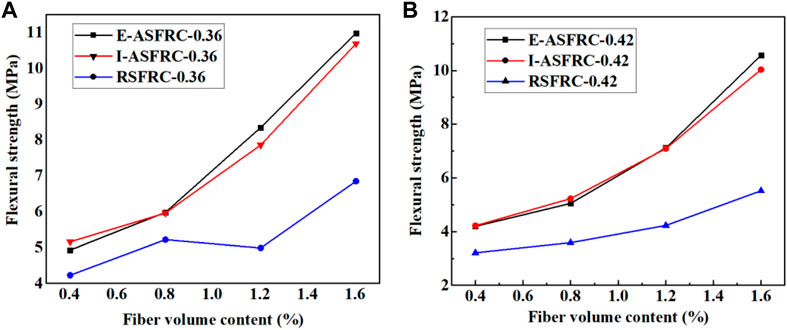
FIGURE 17. Flexural strength vs. Fiber volume content of steel fiber reinforced cement-based composite specimens (A) w/c = 0.36, (B) w/c = 0.42.
For a water-cement ratio of 0.42, compared to that of the RSFRC with the same fiber content, the flexural strength of E-ASFRC with 0.4, 0.8, 1.2 and 1.6 vol% fiber content increases to 30.8%, 40.7%, 68.3%, and 91.3%, respectively (as shown in Figure 16). For a water-cement ratio of 0.36, compared to that of the RSFRC with the same fiber content, the flexural strength of E-ASFRC with 0.4, 0.8, 1.2, and 1.6 vol% fiber content increases to 16.5%, 14.6%, 67.3%, and 60.3%, respectively. As the water-cement ratio decreases, the bonding strength between the steel fiber and matrix increases (Li et al., 2022), increasing the bridging effect of the steel fiber and resulting in a more pronounced increase in the flexural strength of E-ASFRC with lower water-cement ratios, as shown in Figure 17.
Table 6 shows the toughness indices of RSFRC, E-ASFRC, and I-ASFRC. For a water-cement ratio of 0.42, compared to that of the RSFRCs with the same fiber content, the flexural toughness of E-ASFRCs with 0.4, 0.8, 1.2, and 1.6 vol% fiber content increases to 135.7%, 129.8%, 148.2%, and 87.3%, respectively. For a water-cement ratio of 0.36, compared to that of the RSFRCs with the same fiber content, the flexural toughness of E-ASFRCs with 0.4, 0.8, 1.2, and 1.6 vol% fiber content increases to 69.8%, 92.9%, 54.8%, and 95.2%, respectively. In conclusion, the flexural toughness of E-ASFRC and I-ASFRC are similar and significantly improved compared to RSFRC.
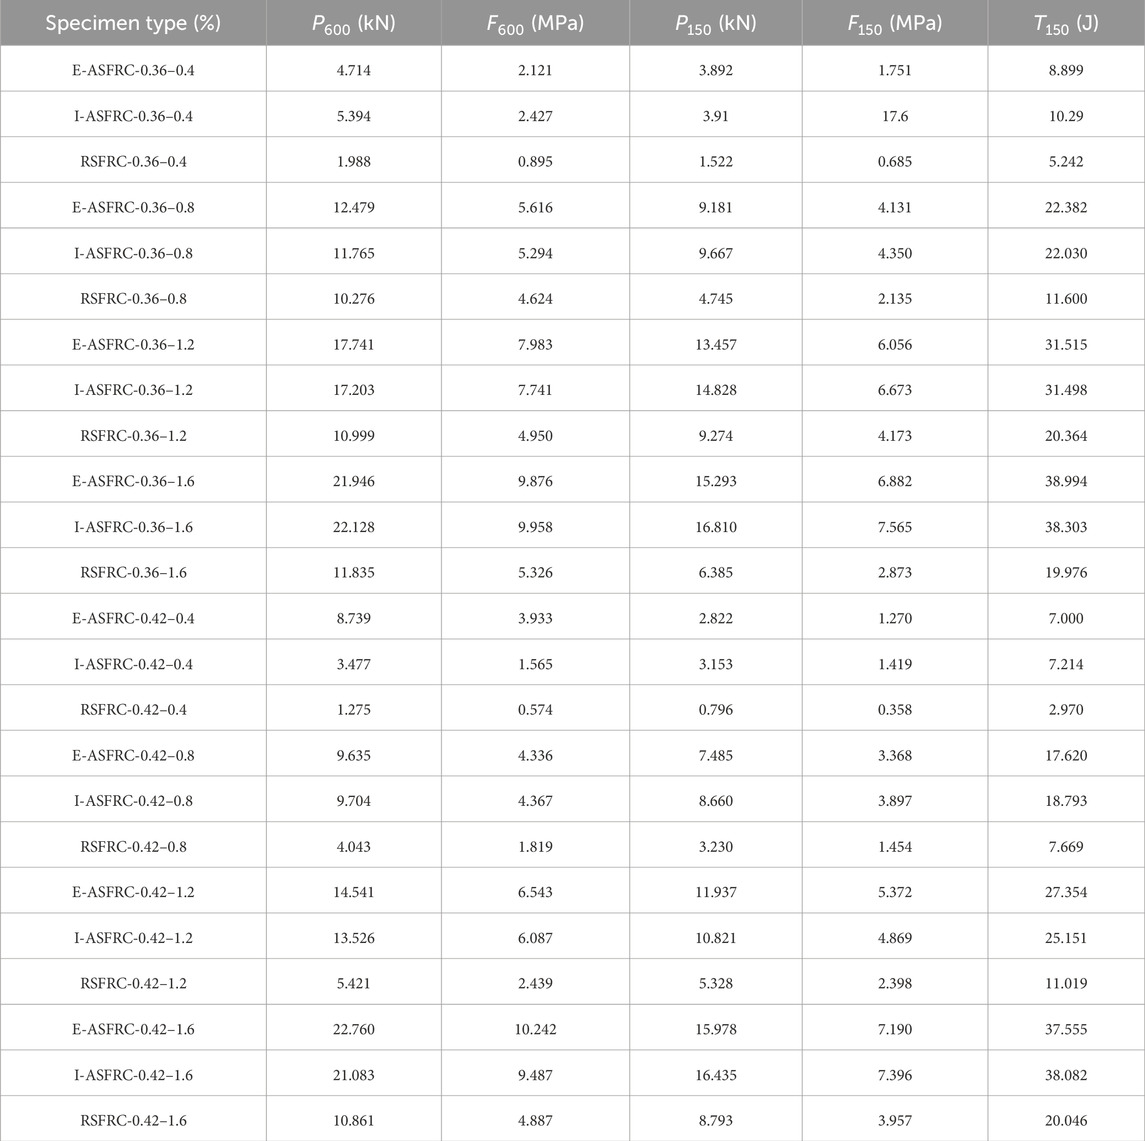
TABLE 6. Toughness index of RSFRC, E-ASFRC and I-ASFRC.
5 Conclusion
This study proposed a model to characterize the magnetic field distribution pattern in the zone below the assembled magnets and the relationship between the magnetic field created by assembled magnets and the fiber orientation of ASFRC. The calculation results were compared with the experimental results to verify the proposed model. Finally, flexural tests were performed to compare the mechanical characteristics of ASFRC prepared using assembled magnets and solenoid coil. The following conclusions can be drawn based on the theoretical and experimental results.
(1) The proposed model can accurately predict the distribution of the magnetic field created by assembled magnets. The error between the calculated results and the experimental results is less than 5%. In addition, the calculation and experiment results indicate that increases in the length of the assembled magnetic (i.e., the length of the assembled magnetic along the fiber alignment direction) will increase the magnetic field intensity of each area. Meanwhile, increases in the width of the assembled magnets (i.e., increases in the length of the assembled magnets perpendicular to the fiber alignment direction) do not increase the magnet induction intensity. Instead, it increased the decay rate of the magnetic induction intensity in the depth direction of the specimen. Therefore, it is necessary to increase the width of the magnetic devices. In applications, the width only needs to meet the size of the prepared E-ASFRC.
(2) The model being proposed has the ability to accurately predict the fiber orientation coefficient of ASFRC that has been prepared by assembled magnets. The error between the calculation and experimental results is less than 5%, except when the assembled magnet is too close to the specimen surface. When the assembled magnet is too close to the specimen surface, the steel fibers on the substrate surface of the matrix are attracted by the assembled magnets and stick out from the specimen surface. That phenomenon cannot be predicted by the proposed model and needs to be avoided since it decreases the enhancement of steel fiber on the composites. Therefore, the assembled magnets must be placed at an optimal distance from the surface of the mixture. For instance, for assembled magnets consisting of rubidium iron boron magnet pieces with dimensions of 130 mm × 150 mm × 26 mm, a height of 10 mm is optimal for preparing an E-ASFRC with dimensions of 100 mm × 100 mm × 400 mm. The fiber orientation coefficient of ASFRCs prepared by assembled magnets of the above specifications is around 0.9, and the flexural strength is closer to that of ASFRCs prepared by the energized solenoid.
(3) The proposed model can be used to design the size and magnetic field strength of assembled magnets based on the actual requirements in engineering for ASFRC preparation. The size and intensity of the magnetic field of assembled magnets can be calculated by Eq. 34 and adjusted by controlling the number of rubidium iron boron magnet pieces according to the size of ASFRC members in particle engineering. In addition, a certain distance between the assembled magnets and the mixture surface needs to be maintained during casting to avoid the fiber sticking out due to the magnetic leakage between two adjacent magnet pieces.
Data availability statement
The original contributions presented in the study are included in the article/Supplementary material, further inquiries can be directed to the corresponding author.
Author contributions
MX: Conceptualization, Writing–original draft. HL: Investigation, Writing–original draft. RM: Investigation, Methodology, Writing–original draft, Writing–review and editing.
Funding
The author(s) declare financial support was received for the research, authorship, and/or publication of this article. The authors gratefully acknowledge the fundings supported by the Opening Funds of State Key Laboratory of Building Safety and Built Environment and National Engineering Research Center of Building Technology (Grant No. BSBE2021-01), the Hebei Natural Science Foundation (E2022202124), and the National Nature Science Foundation of China (Grant No. 52008150 and Grant No. 52008151).
Conflict of interest
The authors declare that the research was conducted in the absence of any commercial or financial relationships that could be construed as a potential conflict of interest.
Publisher’s note
All claims expressed in this article are solely those of the authors and do not necessarily represent those of their affiliated organizations, or those of the publisher, the editors and the reviewers. Any product that may be evaluated in this article, or claim that may be made by its manufacturer, is not guaranteed or endorsed by the publisher.
References
Altun, F., Haktanir, T., and Ari, K. (2007). Effects of steel fiber addition on mechanical properties of concrete and RC beams. Constr. Build. Mat. 21, 654–661. doi:10.1016/j.conbuildmat.2005.12.006
ASTM, (2012). Standard test method for flexural performance of fiber-reinforced concrete (using beam with third-point loading). ASTM International, West Conshohocken, PA, USA,
Banfill, P. (1994). Rheological methods for assessing the flow properties of mortar and related materials. Constr. Build. Mat. 8, 43–50. doi:10.1016/0950-0618(94)90007-8
Bayer, A. (1988). Patent No. DE 3641828 A1.Process for producing a prepreg with aligned short fibres, https://patents.google.com/patent/DE3641828A1/en,
Bingham, E. (1917). An investigation of the laws of plastic flow. US Government Printing Office. Washington, DC, USA,
Hatta, H., and Yamashita, S. (1988). Fiber orientation control by means of magnetic moment. Journal of Composite Materials 22, 484–500. doi:10.1177/002199838802200507
Huang, H., Gao, X., Khayat, K., and Su, A. (2021). Influence of fiber alignment and length on flexural properties of UHPC. Constr. Build. Mat. 290, 122863. doi:10.1016/j.conbuildmat.2021.122863
Knoblach, G. (1989). Using electric fields to control fiber orientation during the manufacturing of composite materials. Tomorrow's Mater. Today. 34, 385–396.
Li, H., Li, L., Li, L., Zhou, J., Mu, R., and Xu, M. (2022). Influence of fiber orientation on the microstructures of interfacial transition zones and pull-out behavior of steel fiber in cementitious composites. Cem. Concr. Compos. 128, 104459. doi:10.1016/j.cemconcomp.2022.104459
Li, X., Xu, J., and Liu, H. (2008). Three-dimensional magnetic field distribution around a rectangular permanent magnet. Journal of BJUT-Beijing University of Technology 34, 1–6.
Mara, M., Lovichova, R., and Fornusek, J. (2019). The influence of fibre orientation on the mechanical properties of cement composites, Advances in Engineering Materials, Structures and Systems: Innovations, Mechanics and Applications. Cape Town: CRC Press
Meng, S., Jiao, C., Ouyang, X., Niu, Y., and Fu, J. (2022). Effect of steel fiber-volume fraction and distribution on flexural behavior of ultra-high performance fiber reinforced concrete by digital image correlation technique. Construction and Building Materials 320, 126281. doi:10.1016/j.conbuildmat.2021.126281
Miller, A., and Fritz, R. (1977). Method of reinforcing concrete with fibres. Patent No. 4062913. 1977.
Mu, R., Dong, R., Liu, H., Chen, H., Cheng, Q., and Fan, C. (2021). Preparation of aligned steel-fiber-reinforced concrete using a magnetic field created by the assembly of magnetic pieces. Cryst 11, 837. doi:10.3390/cryst11070837
Mu, R., Li, H., Qing, L., Lin, J., and Zhao, Q. (2017). Aligning steel fibers in cement mortar using electro-magnetic field. Constr. Build. Mat. 131, 309–316. doi:10.1016/j.conbuildmat.2016.11.081
Mu, R., Wei, L., Wang, X., Li, H., Qing, L., and Zhou, J., (2018). Preparation of aligned steel fiber reinforced cementitious composite and its flexural behavior. J. Vis. Exp. 56307, doi:10.3791/56307
Mu, R., Xue, Y., Qing, L., Li, H., Zhao, Y., and Zhou, J., (2019). Preparation and mechanical performance of annularly aligned steel fiber reinforced cement-based composite pipes. Constr. Build. Mat. 211, 167–173. doi:10.1016/j.conbuildmat.2019.03.146
Qing, L., Yu, K., Mu, R., and Forth, J. (2019). Uniaxial tensile behavior of aligned steel fibre reinforced cementitious composites. Mater. Struct. 52, 70–12. doi:10.1617/s11527-019-1374-5
Tang, W., Xiao, L., Xia, D., Yang, W., and Wang, Z. (2021). 2-D and 3-D analytical calculation of the magnetic field and levitation force between two Halbach permanent magnet arrays. IEEE Trans. Magn. 57, 1–8. doi:10.1109/tmag.2021.3053646
Teng, L., Huang, H., Khayat, K., and Gao, X. (2022). Simplified analytical model to assess key factors influenced by fiber alignment and their effect on tensile performance of UHPC. Cem. Concr. Compos. 127, 104395. doi:10.1016/j.cemconcomp.2021.104395
Wang, X., Zhan, Z., Mu, R., Qing, L., Xu, H., and Cao, G., (2022). Improving reinforcement of cement-based composite continuous beam using adaptively distributed steel fibers. Constr. Build. Mat. 384, 128684. doi:10.1016/j.conbuildmat.2022.128684
West, R., Zhang, S., Mandl, J., Dhir, R., Harrison, T., and Newlands, M. (2005). Aligning long steel fibres in fresh concrete, Cement Combinations for Durable Concrete. Scotland: Thomas Telford Publishing, 467–476. doi:10.1680/ccfdc.34013.0052
Wu, Z., Shi, C., and Khayat, K. (2019). Investigation of mechanical properties and shrinkage of ultra-high performance concrete: influence of steel fiber content and shape. Compos Part B. Eng. 174, 107021. doi:10.1016/j.compositesb.2019.107021
Yang, Z., Chen, M., Ding, Y., Yang, Y., Zhu, Y., and Guo, Y., (2021). Influence of coupling effects of time and water-to-cement ratio on rheological Properties of bingham cement grouts. Adv. Mater. Sci. Eng. 2021, 1–10. doi:10.1155/2021/5781753
Young, H., Freedman, R., and Sandin, T. (1996). University physics with modern physics in SI units 15ed 2020, Reading, MA, USA: University physics, Addison-Wesley.
Zhang, P., Wang, C., Wu, C., Guo, Y., Li, Y., and Guo, J. (2022). A review on the properties of concrete reinforced with recycled steel fiber from waste tires. Rev. Adv. Mater. Sci. 61, 276–291. doi:10.1515/rams-2022-0029
Zhang, P., Wang, J., Li, Q., Wan, J., and Ling, Y. (2021a). Mechanical and fracture properties of steel fiber-reinforced geopolymer concrete. Sci. Eng. Compos. Mater. 28, 299–313. doi:10.1515/secm-2021-0030
Zhang, P., Zhang, H., Cui, G., Yue, X., Guo, J., and Hui, D. (2021b). Effect of steel fiber on impact resistance and durability of concrete containing nano-SiO2. Nanotechnol. Rev. 10, 504–517. doi:10.1515/ntrev-2021-0040
Keywords: aligned steel fiber-reinforced concrete, assembled magnets, magnetic field distribution, orientation coefficient, flexural properties
Citation: Xu M, Li H and Mu R (2024) An investigation of magnetic field distribution for assembly of magnets and its effect on alignment of steel fiber in aligned steel fiber-reinforced concrete. Front. Mater. 11:1351980. doi: 10.3389/fmats.2024.1351980
Received: 07 December 2023; Accepted: 01 February 2024;
Published: 27 February 2024.
Edited by:
Viktor Gribniak, Vilnius Gediminas Technical University, LithuaniaReviewed by:
Lukas Ledderose, Technical University of Braunschweig, GermanyPeng Zhang, Zhengzhou University, China
Copyright © 2024 Xu, Li and Mu. This is an open-access article distributed under the terms of the Creative Commons Attribution License (CC BY). The use, distribution or reproduction in other forums is permitted, provided the original author(s) and the copyright owner(s) are credited and that the original publication in this journal is cited, in accordance with accepted academic practice. No use, distribution or reproduction is permitted which does not comply with these terms.
*Correspondence: Mingfeng Xu, eHVtaW5nZmVuZzE5ODlAMTYzLmNvbQ==