 Longqi Liu
 Zhenhao Fan
 Linhu Yao
 Yunshu Yang
- 1Transportation Institute, Inner Mongolia University, Hohhot, China
- 2Key Laboratory of Green Resource Utilization of Civil Engineering Wastes of Inner Mongolia Autonomous Region, Inner Mongolia University, Hohhot, China
Alluvial-diluvial soil-rock mixture (ADSRM) is a unique geological material primarily consisting of pebbles, gravel, and soil. Gradation design significantly enhances the shear strength of ADSRM, offering significant implications for sustainable construction of transportation infrastructure in mountainous regions. Hence, the N-method of gradation theory was employed for the gradation design of ADSRM fillers in this study. Macro-mechanical testing reveals that the graded sample exhibits significantly higher shear strength, equivalent cohesion, and friction angle compared to the ungraded sample, with more pronounced shear dilatancy. Meso-shear properties suggest that the graded sample has a lower percentage of pore area compared to the ungraded sample, but a higher percentage of small pores relative to total pores, and more crushed rock blocks under the same normal stress conditions. Pore abundance indicates that the majority of pores on the shear plane are oblate in shape. The findings from the equivalent diameter and fractal dimension of the rock block contour suggest improved grinding roundness of rock blocks in the graded sample post-shearing. In summary, the quantity of pores and broken rock blocks primarily impacts the strength and equivalent cohesion of the filler, while the abundance, roundness, shape coefficient, and fractal dimension of rock block contour mainly affects the internal friction angle.
1 Introduction
Loose deposits are commonly used in constructing highway and railway infrastructure in mountainous regions. The construction of transportation infrastructure along these routes can lead to various disasters like slope instability, collapse, uneven settlement, debris flow, landslides, etc. Alluvial-diluvial deposits, a primary type of loose deposits, consist mainly of pebbles, gravel, and soil. Geologically, alluvial-diluvial deposits are relatively recent formations, but in terms of soil genesis, they exhibit a wide range of particle sizes from small clay particles to large pebbles. The good roundness of coarse particles is a key characteristic of alluvial-diluvial deposits, resulting from water scouring and flood transportation. Using an alluvial-diluvial soil-rock mixture (ADSRM) for subgrade filling poses challenges in achieving optimal compactness, potentially causing uneven settlement and slope collapse.
There are various factors affecting the mechanical properties of ADSRM, such as rock particle content, water content, shear rate, density, particle size distribution, and so on (Wang et al., 2013; Houzhen et al., 2018; Liu et al., 2019). Since the late 1990s, YILMAZ I. (1997) (Yilmaz and Karacan, 1997) had carried out a series of experiments to study the index properties, shear strength, and consolidation characteristics of some undisturbed and disturbed new and old alluvial (Quaternary) deposit samples (Campolunghi et al., 2007). also pointed out that alluvial deposits in the City of Rome are mostly consolidated, and more subjected to settlement. According to the work of Moufida (El May et al., 2015), the spatial variability of geotechnical parameters, physical properties, and mechanical parameters of the quaternary alluvial deposits in Tunis City (Tunisia) has been evaluated detailed. The same applies to the work of (Masoud, 2015), who also studied the geotechnical variability of the alluvial soils for urban land management zonation in Gharbiya governorate, Egypt in 2015. Vertical plate load tests, standard penetration tests, and traditional test pit borings were conducted by (Ziaie and Janbaz, 2011) to analyze the relationship between subgrade reaction modulus Ks, elasticity modulus Es and corrected standard penetration test blow count N of the cemented gravelly deposits of Tehran alluvium (Yao et al., 2022). studied the influence of gravel content and shape on the shear strength of soil-rock mixtures under different stress conditions through indoor experiments and DEM numerical methods. Single particle crushing tests were performed on carbonate gravel particles by (Liu et al., 2023) to study the influence of size and shape effects on its crushing strength.
At present, the meso-mechanical properties of SRM are mainly analyzed through digital image processing technology and numerical simulation(Meng et al., 2018). presented a digital image processing (DIP)-based discrete element method (DEM) for the analysis of a soil and rock mixture. The X-ray computerized tomography (X-ray CT) method is a feasible way adopted by many researchers to observe the deformation of tested SRM samples (Y. Wang (Wang et al., 2015; Wang et al., 2018a; Wang et al., 2018b; Xu et al., 2016) studied the mechanical behavior of soil-rock mixtures (S-RM) in a landslide dam using a discrete element method (DEM) numerical simulation (Xing et al., 2018). adopted large-scale indoor triaxial tests and PFC simulation to analyze the macro–meso freeze-thaw damage mechanism of soil–rock mixtures with different rock contents (Wu et al., 2023). carried out a series of discrete element method (DEM) simulations of mini-triaxial tests to analyze the particle shape effect on the deformation and failure characteristics of SRM. Based on the MPM-DEM(material point method-discrete element method) method, Jianguo (Li et al., 2024) analyzed the influence of factors such as friction and cohesion, rock content, and rock size on the failure mechanism of soil rock mixture slopes. The results indicate that this method can effectively handle complex problems such as soil rock interfaces, and is well applied.
The gradation has a significant impact on the shear strength of soil rock mixtures. Through reasonable gradation design, the shear strength of soil rock mixtures can be significantly enhanced. Among gradation design theories, the maximum density curve theory is one of the popular gradation theories in current practice. L J Wang et al. (2010) (Wang et al., 2010; Zhao et al., 2012) applied Fuller’s ideal grading curve and Talbol’s formula to the design of the asphalt mixture. Fuller’s maximum density theory was also used to determine the mix proportions of concrete block production from construction and demolition waste by (Sabai et al., 2013) The commonly used theoretical models of maximum density curve theory mainly include the Fuller curve theory, the N method, the K method, and the I method in the existing studies. Some literature has shown that the range of parameter n in the N method is 0.3–0.7 (such as (Deng et al., 2014; Yi, 2007) conducted a series of tests to design the gradation of asphalt stabilized macadam base through N method, I method, Bailey method, and Superpave method, and the results show that the water stability and fatigue resistance of asphalt-stabilized macadam base designed by The N method was the best. Traditionally, gradation theory has been primarily used for designing the gradation of asphalt, concrete, and mineral mixtures, but it has not been utilized in subgrade filler design. Hence, designing the gradation of ADSRM fillings is crucial.
Numerous important studies have investigated the shear properties of SRM in the mentioned state-of-the-art review. However, most studies on the influencing factors of SRM focus on rock particle content, water content, density, and breakage, often overlooking the impact of gradation. Previous studies tended to analyze from either a macro or meso perspective, rarely integrating both aspects. The grain size distribution of a natural deposit is immutable, but when utilized as subgrade filler, it can undergo treatment via the sieving method or targeted sieve holes to lessen the significant workload. Implementing the N method for grading design can significantly enhance the shear strength of subgrade filler.
The primary aim of the paper is to examine how gradation impacts the macro-meso shear properties of the alluvial-diluvial soil-rock mixture (ADSRM), crucial for the sustainable progress of transportation infrastructure in mountainous regions.
2 Gradation design of ADSRM fillers
2.1 Materials
The ADSRM samples in this study were collected from a cut slope of diluvium in Shangluo, Shaanxi Province, characterized by inadequate particle sorting but good roundness. The filler comprises coarse particles like gravel, pebbles, and block stones, along with fine particles such as sand and clay. Each rock block exhibits varying parent rock composition, strength, and properties, illustrated in Figure 1. Consequently, four types of typical block stones (designated as rock blocks 1, 2, 3, and 4) and fine-grained soil samples with significant content were chosen from the ADSRM filler for XRD diffraction analysis, with the diffraction pattern depicted in Figure 2.
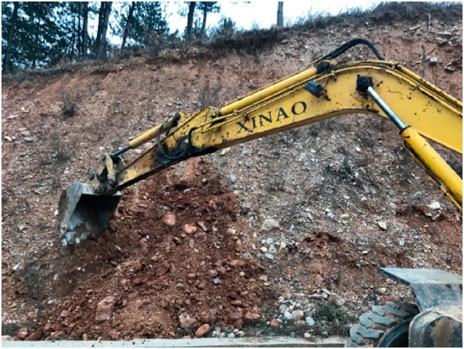
Figure 1. Field sampling of ADSRM filler.

Figure 2. XRD diffraction test results of ADSRM filler.
The analysis shows that the predominant rock-forming minerals in the ADSRM filler are Clinotobermorite, Quartz, Gismondine, and Thaumasite. Rock block No. 1 is grayish white, easily scratched by nails, indicating low hardness. Rock block No. 2 is bluish gray with a relatively soft texture and slightly higher hardness compared to rock block No. 1. Rock block No. 3 is black-green, displaying a greasy luster and moderate hardness. Rock block No. 4 is brownish gray with a high quartz content and a hard texture, possessing the highest hardness among the four rock blocks. The fine-grained soil is mainly composed of Quartz and Gismondine, with the elevated Quartz content suggesting a sandy clay composition. In summary, the material and mineral composition of the ADSRM filler are intricate, with notable variations in rock block strength. Nonetheless, the overall strength of the rock blocks within the filler is relatively high, particularly with rock blocks 3 and 4.
2.2 Gradation design
The N-method is a commonly utilized gradation design derived from the theory of the maximum density curve. Its primary advantage lies in maximizing the mixture’s density and ensuring the mechanical properties align closely with this density. The theory of the maximum density curve is a gradation theory that determines the percentage content of particles in each grain group in continuous gradation. The particles in the sample are arranged based on particle size, with coarse and fine particles juxtaposed to achieve maximum density and minimum voids (Talbot and Richart, 1923 Fuller and Thompson, 1907). enhanced the calculation formula of the N-method using the gradation composition formula from Fuller and Thompson’s ideal maximum density curve. The calculation formula is provided below.
where
The N-method, widely employed to enhance the grading and strength of asphalt, concrete, and mineral mixtures, will be utilized for the grading design of ADSRM fillers due to the analogous nature of loose materials (Liu et al., 2022). Its application in subgrade fillers like ADSRM is novel. ADSRM subgrade fillers share similarities with asphalt and mineral mixtures. Firstly, the material composition of ADSRM resembles that of mineral mixtures, originally targeted by the N-method. Hence, applying the N-method to ADSRM fillers is feasible. Secondly, due to ADSRM’s superior grinding roundness, the interlocking of rock blocks is weaker compared to regular gravels. This affects the compactness of ADSRM fillers, making it challenging to meet subgrade specifications, while the N-method aims for maximum density and minimal porosity. Numerous studies indicate that the shear strength of ADSRM rises significantly with a rock particle content of 30%–80% (Chen et al., 2014). However, beyond a certain point, further increase in rock particle content may not significantly enhance shear strength and could even lead to a decrease. For samples designed using the N-method with a maximum particle size of 60 mm and n values between 0.40 and 0.60, the rock particle content ranges from 63% to 77.5%. The filler designed using the N method exhibits higher shear strength. The non-uniformity coefficient and curvature coefficient of the samples designed with the N method meet the specified requirements.
Based on the analysis above, it is evident that the N method is applicable in the gradation design calculation of ADSRM filler. As the experimental plan evolves, the gradation design methodology will be suitable for fillers with enhanced shear strength. Two sample groups were chosen in this study to analyze the impact of gradation on shear strength. One group underwent grading using the N method, while the other group remained ungraded; however, both groups had identical rock particle content (with a 5 mm diameter as the threshold). The parameter ‘n' for the N-method graded sample is 0.55. The percentage content of each particle size range was calculated based on Formula (1) as depicted in Figure 3. The grain size distributions and physical property indexes of both sample groups are illustrated in Figure 4 and Table 1, respectively.
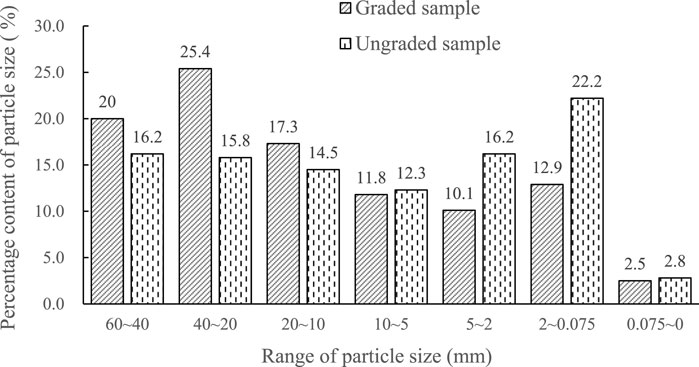
Figure 3. The percentage content of each particle size.
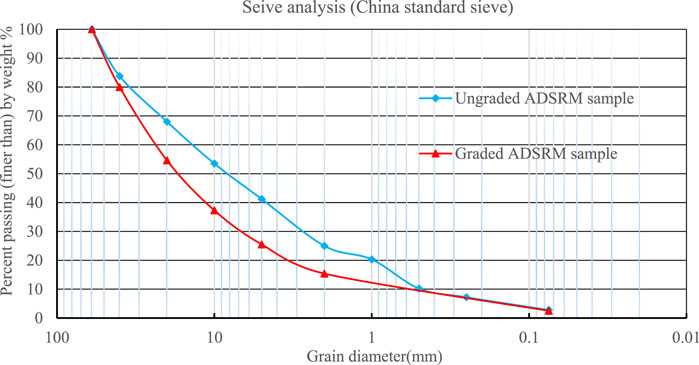
Figure 4. Grain size distributions of the samples.
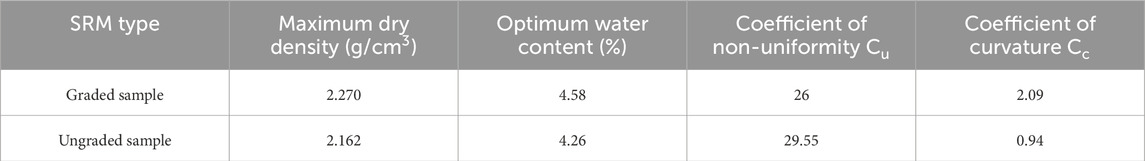
Table 1. Physical property indexes of field samples.
Figures 3, 4 indicate a higher presence of medium and fine “soil” particles in the ungraded sample, whereas the graded sample enhances the ratio of coarse “rock particles” in the filler, with coarse and fine particles arranged in a systematic manner based on size, resulting in a smooth grading curve and effective gradation.
3 Experimental apparatus and test scheme
The large-scale direct shear equipment used in the test includes a main frame, measurement system, and data acquisition system (Figure 5). All test data are automatically collected and saved by special software. The size of the shear box is 300 mm in diameter and 300 mm in height. Compared with the traditional direct shear apparatus, this one has remarkable advantages, especially in the shape of the shear box. A disk sample has a clearer stress state than a cubic sample in the plane strain condition. Besides, load sensors and high-precision displacement measuring systems can automatically collect the test data effectively and accurately. The test scheme is shown in Table 2. Test samples should be prepared in advance according to the test plan and kept for 24 h to ensure the uniform distribution of water. The sample filling process needs to meet the requirements of test methods of soils for highway engineering/JTG 3430-2020 (Liu et al., 2022), especially the compaction (Liu et al., 2020).
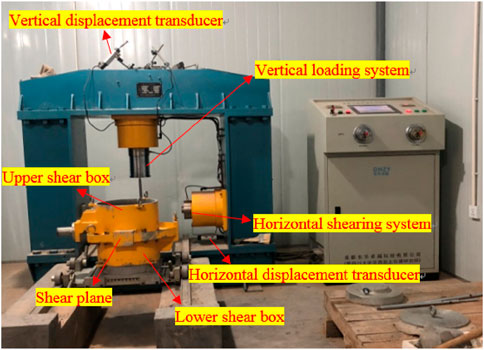
Figure 5. Photo of the large-scale direct shear test apparatus.
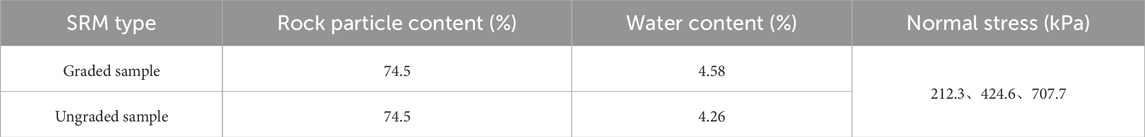
Table 2. Test scheme of ADSRM samples.
4 Macro-shear properties
4.1 Stress-strain behavior
Figure 6 displays the shear stress versus horizontal displacement curves of the two samples at various normal stresses.
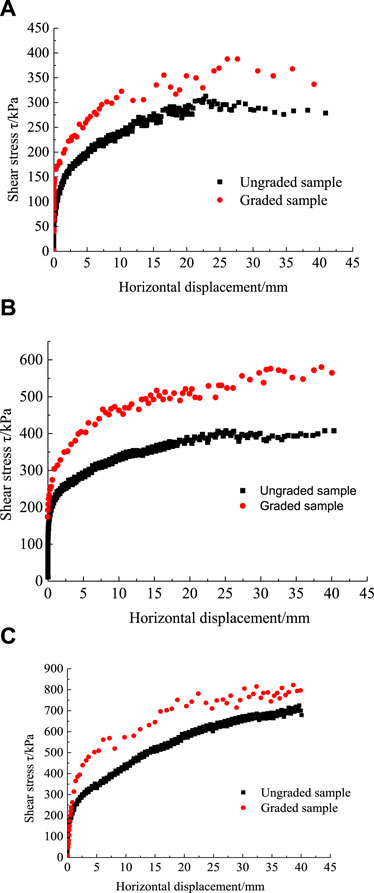
Figure 6. Shear stress VS horizontal displacement curves of the two samples. (A) Normal stress 212.3 kPa. (B) Normal stress 424.6 kPa. (C) Normal stress 707.7 kPa.
Figure 6 reveals that both samples exhibit three clear stages: linear elastic, yielding, and strain-hardening stages (Liu et al., 2019). At a normal stress of 212.3 kPa, both samples exhibited minimal softening behavior during the later stages of shearing. With an increase in normal stress to 424.6 kPa, the stress-strain curves of both samples tended to flatten (stress remains constant, strain increases) in the later shear stages, but exhibited hardening phenomena as the normal stress rose to 707.7 kPa.
The shear strength of the graded sample significantly surpasses that of the ungraded sample, highlighting the substantial impact of gradation on the shear strength of ADSRM. Primarily, this difference arises from the excessive presence of fine-grained “soil” in the ungraded sample, whereas the graded sample enhances the ratio of coarse-grained “rock particles” in the filler, with the strength of coarse-grained “rock particles” significantly exceeding that of fine-grained “soil”. On the other hand, the coarse and fine particles in the ungraded sample are irregularly arranged, whereas those in the graded sample are organized based on particle size, forming a dense structure that enhances shear deformation resistance and strength of ADSRM.
4.2 Dilatancy and shrinkage behavior
The shear dilation and shrinkage behavior of the two samples can be analyzed using the vertical versus horizontal displacement curves, as depicted in Figure 7. Positive ordinate values indicate shrinkage, while negative values indicate dilatancy.
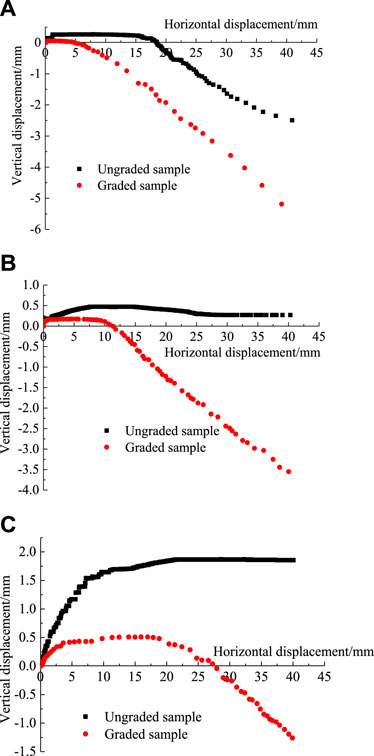
Figure 7. Vertical VS horizontal displacement curves of the two samples. (A) Normal stress 212.3 kPa. (B) Normal stress 424.6 kPa. (C) Normal stress 707.7 kPa.
In Figure 7, the ungraded sample initially exhibited shrinkage followed by dilatancy at 212.3 kPa, whereas it displayed shrinkage followed by stabilization throughout the shear process under the other two stresses. Conversely, the graded sample showed shrinkage followed by dilatancy consistently under all normal stresses, highlighting its more pronounced shear dilatancy compared to the ungraded sample. Additionally, the higher shear strength of the graded sample is attributed mainly to its significantly greater density than that of the ungraded sample. Increased normal stress on the ungraded sample leads to further compaction, resulting in greater shear shrinkage. Volumetric strain characteristics once again confirm the superior shear strength of the graded sample over the ungraded sample.
4.3 Shear strength parameters
ADSRM is a mixture of cohesive soil and cohesionless rock-like particles. Hence, the cohesion of ADSRM comprises the cohesion of cohesive soils and the force of interlocking and rubbing (or “the bitten force”) between the rock particles. Therefore, it is inaccurate to label the intercept of the Mohr failure envelope as “cohesion”. Liu (2019) and colleagues conducted a detailed analysis of the cohesion and Mohr failure envelope of SRM, labeling its intercept as “equivalent cohesion”. The shear strength, equivalent cohesion, and friction angle of the two samples have been computed, with the results presented in Table 3.
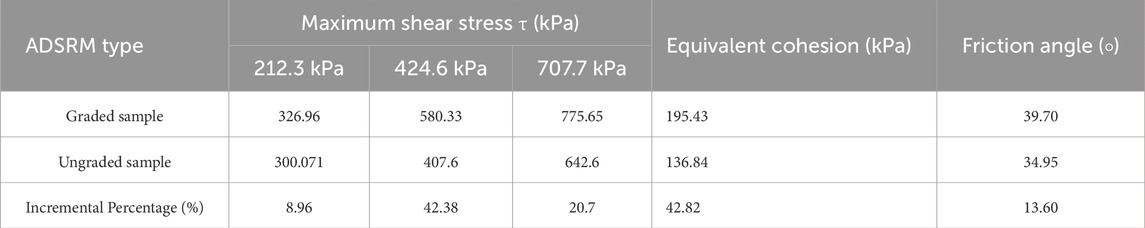
Table 3. Shear strength and parameters of two ADSRM samples.
When comparing the two sample types, the shear strength, equivalent cohesion, and friction angle of the graded sample significantly exceed those of the ungraded sample, particularly the maximum shear stress at 424.6 kPa and the equivalent cohesion, with incremental percentages of approximately 42.38% and 42.82%, respectively. The graded sample primarily enhances the mass ratio of coarse-grained “rock particles”, which exhibit significantly greater strength compared to fine-grained “soil”. The rise in the content of “rock particles” substantially enhances the force of interlocking and rubbing between these particles. Additionally, the dense structure comprising coarse and fine particles in the graded sample interact during the shear process. In conclusion, gradation design has a remarkable effect on improving the shear strength of ADSRM.
5 Meso-shear properties of shear plane
The meso-structural characteristics of a shear plane can reflect the macro-mechanical properties of ADSRM. These characteristics are determined by the structural parameters of rock block arrangement, shape, contact mode, and porosity. Changes in mesostructure, such as size, shape, and arrangement of rock blocks and pores, typically reflect macro-deformation in samples. This section analyzes meso-shear properties based on the morphological characteristics of pore size and rock blocks on the shear plane.
5.1 Image processing
Image digital processing technology involves converting image information into a digital signal using computer image processing software. In this study, we used IPP (Image-Pro Plus), a widely used software that can capture image data from various devices. IPP offers robust calibration functions for tasks such as counting, measuring, and analysis. The study leveraged IPP software’s capabilities to examine the morphological attributes of rock blocks on the shear plane (Longqi et al., 2022). Figure 8 illustrates the primary processing flow of a shear plane.
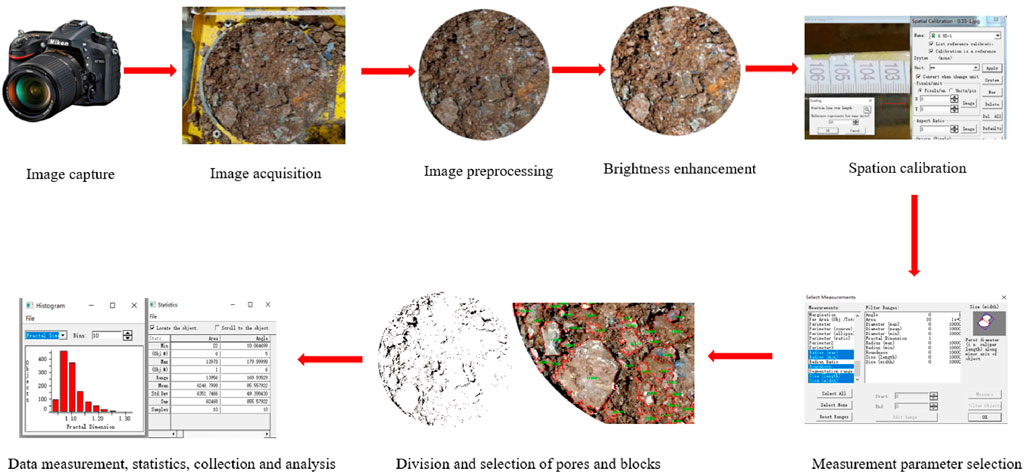
Figure 8. An example of a shear plane image processing.
5.2 Pore analysis of shear plane
Pores result from incomplete filling of voids left by rock and soil particles during shearing. Under horizontal shear force, some pores are filled, some are stretched along the shear direction, and others are compressed into small pores. Analyzing the shape, size, area, quantity, and connectivity of pores on the shear plane allows for indirect analysis of the filler’s compactness. Additionally, pore characteristics are crucial factors influencing soil permeability. The pore condition can be assessed using microstructural parameters like pore area ratio, pore abundance, average diameter, roundness, and shape coefficient on the shear surface. Alterations in pore structure significantly impact the shear strength of ADSRM.
(1) Pore area analysis
Figure 9 displays the pore distribution on two shear planes under 424.6 kPa using IPP processing (taking a normal stress of 424.6 kPa as an illustration).
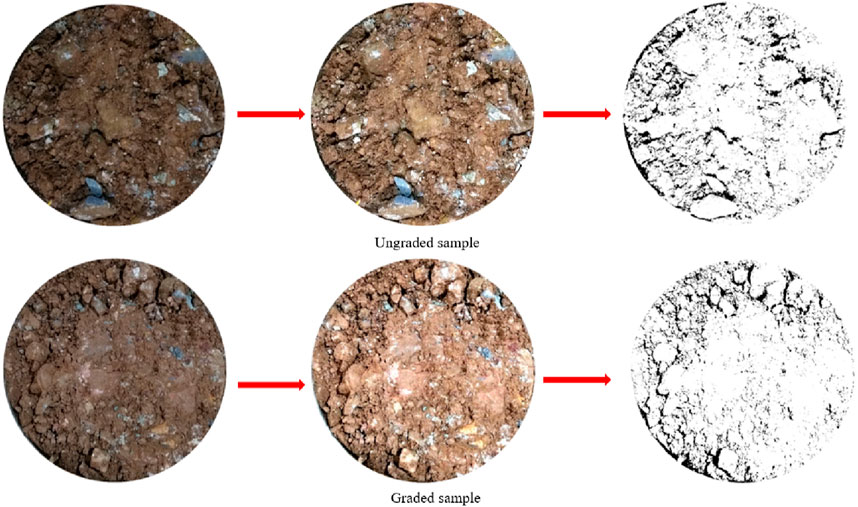
Figure 9. Image preprocessing and pore distribution of shear plane.
Figure 9 demonstrates significant variation in the size of pores on the shear plane, with the presence of large pores. IPP can calculate the pore area, designating a pore area below 3 mm2 as small (with a diameter around 1 mm). Calculation results of the area proportion of the total pore and the percentage of the number of the small pore to the total pore are shown in Figure 10.
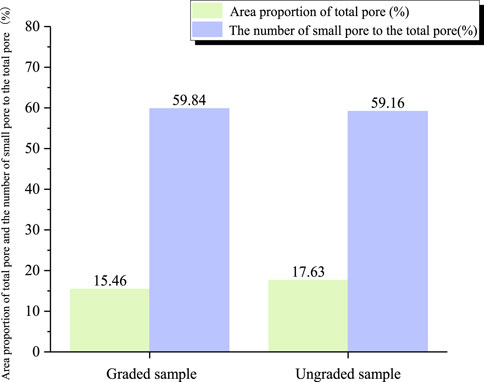
Figure 10. Calculation results of area proportion of total pore and the percentage of the number of the small pore to the total pore.
The pore area percentage in the graded sample is lower than in the ungraded sample. However, the percentage of small pores compared to total pores is higher in the graded sample due to larger pore diameters and discontinuous internal particle gradation in the ungraded sample. The pore size on the shear plane correlates with particle size distribution and normal stress. The number of small pores shows minimal variation between the two samples, suggesting that gradation primarily alters the condition of large pores on the shear plane with minimal impact on small pores. This occurs primarily because fine-grained “soil” mainly causes small pores, whereas coarse-grained “rock” leads to large pores, with the “rock particle” having a more significant impact on the filler. The force of “interlocking” and “rubbing” among rock particles in graded samples is stronger, making it challenging for particles to “rotate,” “roll over,” “climb,” or “crossover” others. The most likely failure mode for rock blocks is direct cutting (breakages) during shear movement. Subsequently, the gaps between rock particles can be filled with adequate breakages and soil, reducing the number of pores. The filling of particles leads to the division of large pores into smaller ones, consequently increasing the overall number of small pores. The quantity of pores on the shear plane serves as an indicator of the material’s macroscopic mechanical shear strength. Generally, a higher pore count corresponds to reduced shear strength in the filler material.
(2) Mean equivalent pore diameter
The equivalent diameter of pores serves as a reflection of their size. In the context of the IPP software, various diameter parameters, including maximum, minimum, and equivalent diameters, are automatically computed. The maximum diameter represents the longest distance between two points passing through the centroid position on the outer contour of a pore. On the other hand, the minimum diameter signifies the shortest distance between two points passing through the centroid position of a pore. The equivalent diameter is the average value of the two maximum diameters and the minimum diameter, as shown in Figure 11.
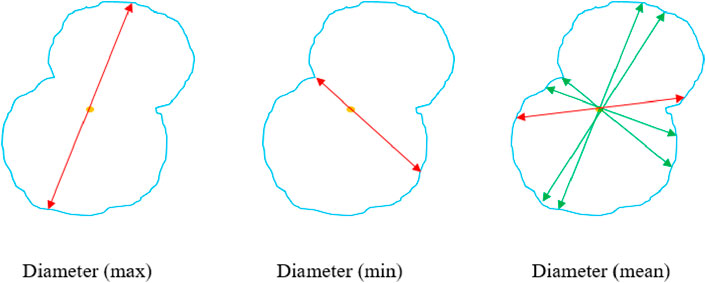
Figure 11. Schematic diagram of pore diameter in IPP.
The pore diameter calculation results on the shear plane of the two samples are shown in Figure 12. Analysis of pore diameter calculations on the shear plane reveals that the maximum and equivalent diameters of pores in the graded sample are smaller compared to the ungraded sample, while the minimum diameter shows minimal difference. Notably, the content of rock particles remains consistent between the two samples. However, the graded sample exhibits an increase in coarse particles within the 10–60 mm range to maintain particle gradation continuity (Figure 3; Figure 4), unlike the ungraded sample which lacks gradation design, leading to irregular pore formation due to particle combination. Conversely, the graded sample showcases better particle matching and compactness, resulting in relatively smaller and uniform pores between particles.
(3) Pore abundance, roundness, and shape coefficient
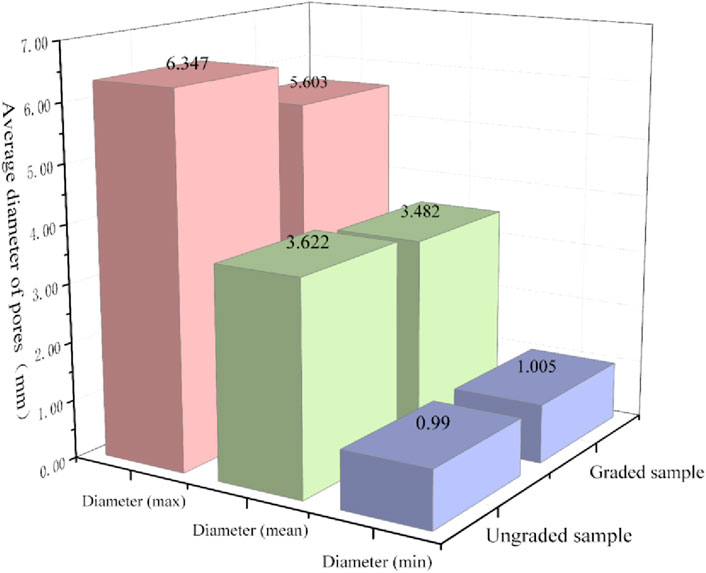
Figure 12. Calculation results of sample pore diameter.
Pores exhibit diverse shapes such as strips, ellipses, and equiaxed forms. Pore abundance is defined as the ratio of the short axis size (ferret diameter) to the long axis size (caliper length) of a pore, ranging from 0 to 1. This parameter reflects the shape characteristics of the pore, as depicted in Figure 13. The formula for calculating pore abundance is provided in the research context.
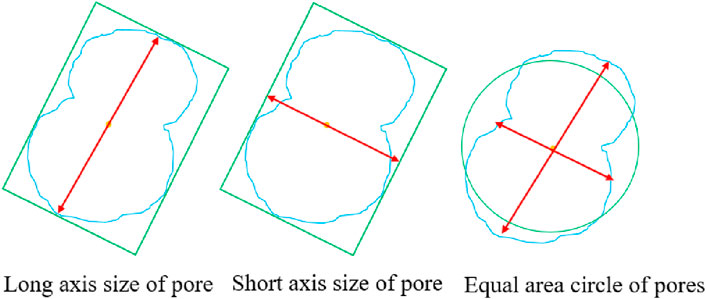
Figure 13. Schematic diagram of pore diameter.
Where,
Roundness is the ratio of the actual area of the pore to the area of the circumscribed circle of the pore (Figure 14), with a value of 0–1, which is a parameter reflecting the degree to which the pores are close to the circle. The larger the value, the closer the shape is to the circle. The calculation formula is as follows. A represents the actual area of the pore, and A′ represents the area of the unit body or the circumscribed circle of the pore.

Figure 14. Two shapes with the same abundance and different roundness.
The shape coefficient can reflect the complexity of the outer contour boundary of the pore, which refers to the ratio of the circumference of the equal area circle of the pore (Figure 14) to the actual circumference of the pore. The smaller the pore shape coefficient, the more complex the outer contour boundary of the pore. The calculation formula is as follows.
Where F represents the shape coefficient of the pores; P is the circumference of the circle with an equal area of the pore; C is the actual perimeter of pores, and n is the number of pores.
The calculation results of the average value of pore abundance, roundness, and shape coefficient for two samples are shown in Figure 15.
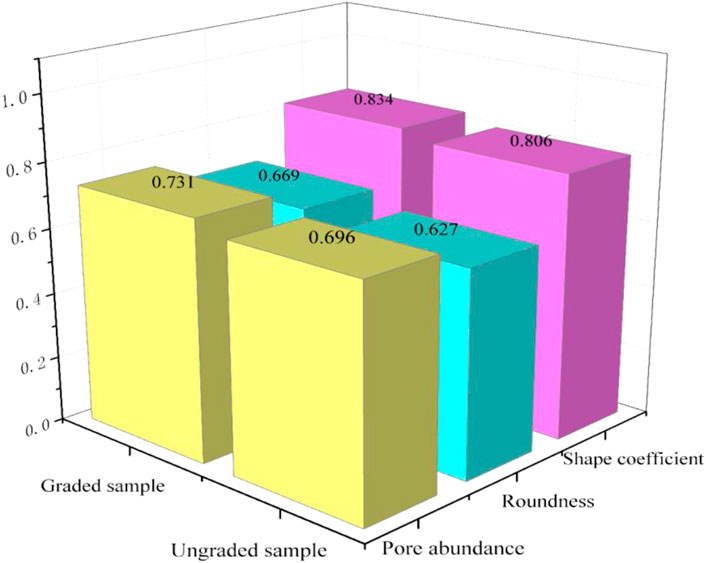
Figure 15. The average value of pore abundance, roundness, and shape coefficient.
The average pore abundance, roundness, and shape coefficient values in the graded sample are higher than those in the ungraded sample, although the difference between the two sets of values is not statistically significant. Pore abundance peaks in the range of 0.3–0.8, followed by 0.8–1, and is lowest in the range of 0–0.3. This indicates that the majority of pores on the shear plane are oblate, followed by near-equiaxed, and least commonly long-strip in shape. The graded sample contains slightly more near-equiaxed pores compared to the ungraded sample. This is primarily due to the filling of voids in the graded sample with fine particles resulting from the “cutting” or breakage of some rock particles. The average values for roundness and shape coefficient indicate that the pores in both samples are predominantly round, with relatively simple outer boundaries, particularly in the graded sample. This is largely attributed to alterations in the internal structure of the gradation design. The rock blocks in the ADSRM exhibit a relatively uniform shape, primarily equiaxed or nearly equiaxed, with good roundness. Consequently, the pores formed by the skeleton will not be overly complex.
5.3 Rock block analysis of shear plane
Rock blocks significantly impact the shear strength of ADSRM. The interlocking and rubbing forces between them contribute to increased shear strength. Hence, it is crucial to assess the breakage, shape, abundance, and diameter of rock blocks on the shear plane to understand the shear properties of ADSRM.
(1) Total area of rock block and proportion of broken rock block area
Calculating the area of a broken rock block during rock block breakage analysis poses challenges. Nonetheless, it can be differentiated and quantified based on the color of the crushed rock block. The IPP selects the crushed rock blocks using a predetermined threshold, and any missed or incorrectly selected crushed rock blocks can be manually identified (see Figure 16). The proportion of the area occupied by broken rock blocks can be determined as described below.
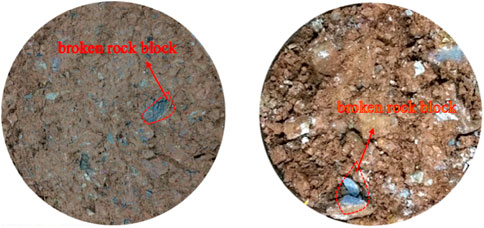
Figure 16. Broken rock block on the shear plane.
Where,
The total area of the rock block and the proportion of the broken rock block area are shown in Figure 17.
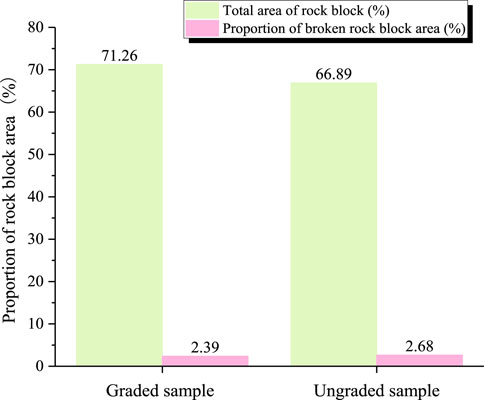
Figure 17. The total area of rock block and proportion of broken rock block area.
The Figure illustrates that the total rock block area on the shear surface of the graded sample surpasses that of the ungraded sample, highlighting the graded sample’s emphasis on coarse-grained “rock block” content. The broken area of rock blocks in both samples is relatively minor, attributed to the high strength of the “rock block” within the ADSRM filler (confirmed by XRD test results). Therefore, the filler can resist large shear stress during the shear process without causing too many rock blocks to be cut or broken, which is also consistent with the shear strength test of the filler. Typically, higher normal stress results in an increased presence of crushed rock blocks. Under elevated normal stress, particles find it challenging to “rotate,” “roll over,” “climb,” or “crossover,” making rock blocks susceptible to crushing under greater shear forces.
(2) Morphological characteristics of rock block
The morphological characteristics of the rock block are primarily analyzed through the calculation of the equivalent diameter, abundance, and fractal dimension of the rock block contour. Equivalent diameter represents the average diameter of all rock blocks. Abundance has been discussed earlier. The fractal dimension of the rock block contour reflects the shape and roundness of the rock block. Higher roundness of the rock block corresponds to a smaller fractal dimension value of the contour, while rougher rock blocks result in larger fractal dimension values of the contour. The morphological parameters of rock blocks (mean value) are shown in Table 4.
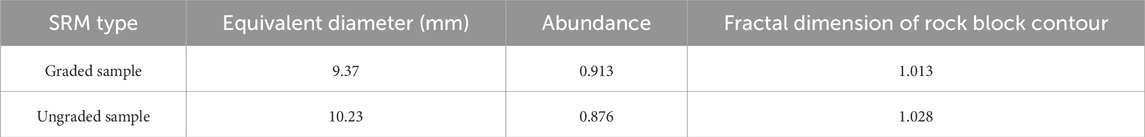
Table 4. Morphological parameters of rock blocks (mean value).
The equivalent diameter of the graded sample is smaller than that of the ungraded sample, suggesting that larger rock blocks were removed in the graded sample. There is minimal difference in the abundance of rock blocks between the two samples, suggesting that most rock blocks are oblate in shape. However, the value for the graded sample is higher than that of the ungraded sample, indicating a transition in the shape of rock blocks from oblate to near-equiaxed due to the removal of edges and corners of some blocks. The fractal dimension of the rock block contour in the graded sample is lower, suggesting improved roundness of the rock block in the graded sample, aligning with the findings on rock block abundance and equivalent diameter (mm).
6 Comparative analysis of macro-meso shear properties
The influence of the meso morphological characteristics of the filler on its macro shear strength properties was analyzed by examining the relationship between pore and rock block morphology on the shear plane and shear strength parameters.
The quantity of pores and fractured rock blocks on the shear plane primarily influences the strength and equivalent cohesion of the filler. Additionally, the abundance, roundness, shape coefficient, and fractal dimension of the rock block contour predominantly impact the internal friction angle, with some influence on its equivalent cohesion. From Table 5, it is evident that when the strength of the rock block is consistent or similar, a lower quantity of fractured rock blocks and a smaller proportion of the total pore area lead to higher equivalent cohesion of the filler. The equivalent cohesion shows an inverse relationship with the proportion of the total pore area. The internal friction angle typically correlates positively with abundance, roundness, and shape coefficient, and inversely with the fractal dimension of the profile. Given the high values of equivalent cohesion and internal friction angle in the graded sample, its shear strength is correspondingly high.

Table 5. Morphological parameters and shear strength parameters of the shear plane.
7 Conclusion
The N-method of gradation theory is utilized for the gradation design of ADSRM fillers in this study, leading to the following conclusions.
1) The macro-mechanical tests demonstrate a significant enhancement in the shear strength of ADSRM due to gradation design. The graded sample boosts the presence of coarse particles ranging from 10–60 mm, with a focus on augmenting the larger particles internally to ensure particle gradation continuity. Compared to the ungraded sample, the shear strength of the graded sample is substantially higher, exhibiting more pronounced shear dilatancy. Notably, the graded sample displays significantly elevated equivalent cohesion and friction angle values compared to the ungraded sample, particularly in terms of maximum shear stress and equivalent cohesion, showing an increase of approximately 42.38% and 42.82%, respectively.
2) The meso-shear properties reveal that the graded sample has a lower percentage of pore area compared to the ungraded sample, but a higher percentage of small pores relative to the total pores. An increase in the number of pores results in reduced shear strength of the filler. The graded sample exhibits higher average values for pore abundance, roundness, and shape coefficient than the ungraded sample, suggesting that most pores on the shear plane are oblate, followed by near-equiaxed, with fewer long-strip shapes, and the outer boundary of the pores is relatively uncomplicated, particularly in the graded sample.
3) With increasing normal stress, the quantity of crushed rock blocks also increases. The graded sample contains more crushed rock blocks compared to the ungraded sample under identical normal stress conditions. Additionally, the graded sample exhibits a smaller equivalent diameter and fractal dimension for the rock block contour, along with a higher abundance of rock blocks, suggesting improved grinding roundness of rock blocks in the graded sample and predominantly oblate shapes for most rock blocks.
4) The strength and equivalent cohesion of the filler are primarily influenced by the quantity of pores and broken rock blocks, whereas the internal friction angle is mainly impacted by the abundance, roundness, shape coefficient, and fractal dimension of the rock block contour.
Data availability statement
The raw data supporting the conclusion of this article will be made available by the authors, without undue reservation.
Author contributions
LL: Funding acquisition, Supervision, Writing–original draft. ZF: Data curation, Investigation, Writing–original draft. YY: Software, Writing–review and editing. LY: Formal Analysis, Writing–review and editing.
Funding
The author(s) declare that financial support was received for the research, authorship, and/or publication of this article. This work was supported by the National Natural Science Foundation of Inner Mongolia (2021BS05001).
Conflict of interest
The authors declare that the research was conducted in the absence of any commercial or financial relationships that could be construed as a potential conflict of interest.
Publisher’s note
All claims expressed in this article are solely those of the authors and do not necessarily represent those of their affiliated organizations, or those of the publisher, the editors and the reviewers. Any product that may be evaluated in this article, or claim that may be made by its manufacturer, is not guaranteed or endorsed by the publisher.
References
Campolunghi, M. P., Capelli, G., Funiciello, R., and Lanzini, M. (2007). Geotechnical studies for foundation settlement in Holocenic alluvial deposits in the City of Rome (Italy). Eng. Geol. 89 (1-2), 9–35. doi:10.1016/j.enggeo.2006.08.003
Chen, J., Dai, F., Xu, L., Chen, S., Wang, P., Long, W., et al. (2014). Properties and microstructure of a natural slip zone in loose deposits of red beds, southwestern China. Eng. Geol. 183, 53–64. doi:10.1016/j.enggeo.2014.10.004
Deng, J. X., Zhou, X. D., Huang, Y. T., Liu, Y., and Fan, W. M. (2014). Discrete element simulation and analysis for max density curve theory of mineral aggregate mixtures. Appl. Mech. Mater. 668-669, 12–16. doi:10.4028/www.scientific.net/amm.668-669.12
El May, M., Souissi, D., Said, H. B., and Dlala, M. (2015). Geotechnical characterization of the quaternary alluvial deposits in Tunis City (Tunisia). J. Afr. Earth Sci. 108, 89–100. doi:10.1016/j.jafrearsci.2015.05.003
Fuller, W. B., and Thompson, S. E. (1907). The laws of proportioning concrete. Trans. Am. Soc. Civ. Eng. 59 (2), 67–143. doi:10.1061/taceat.0001979
Houzhen, W., Wenjie, X., Changfu, W., and Meng, Q. (2018). Influence of water content and shear rate on the mechanical behavior of soil-rock mixtures. Sci. China Technol. Sci. 61 (8), 1127–1136. doi:10.1007/s11431-017-9277-5
JTG 3430-2020 (2020). Test methods of soils for highway engineering. Beijing, China: Ministry of Transport of the People’s Republic of China.
Li, J., Wang, B., Pan, P., Chen, H., di, W., and Penglin, C. (2024). Failure analysis of soil-rock mixture slopes using coupled MPM-DEM method. Comput. Geotechnics 169, 106226. doi:10.1016/j.compgeo.2024.106226
Liu, L., Mao, X., Xiao, Y., Wang, T., and Nie, M. (2020). Influence of water and rock particle contents on the shear behaviour of a SRM. Transp. Saf. Environ. 2 (1), 29–43. doi:10.1093/tse/tdaa003
Liu, L., Mao, X., Xiao, Y., Wu, Q., Tang, K., and Liu, F. (2019). Effect of rock particle content on the mechanical behavior of a soil-rock mixture (SRM) via large-scale direct shear test. Adv. Civ. Eng. 2019 (3), 1–16. doi:10.1155/2019/6452657
Liu, L., Yang, Y., Mao, X., and Nie, M. (2022). Macro-meso shear properties of alluvial-diluvial soil-rock mixture (ADSRM) subgrade fillers based on field investigation and N-method. Case Stud. Constr. Mater. 17, e01694. doi:10.1016/j.cscm.2022.e01694
Liu, X., Li, S., and Yao, T. (2023). Laboratory investigation on the single particle crushing strength of carbonate gravel incorporating size and shape effects. Géotechnique, 1–17. doi:10.1680/jgeot.23.00038
Masoud, A. A. (2015). Geotechnical evaluation of the alluvial soils for urban land management zonation in Gharbiya governorate, Egypt. J. Afr. Earth Sci. 101, 360–374. doi:10.1016/j.jafrearsci.2014.10.009
Meng, Q., Wang, H., Xu, W., et al. (2018). A coupling method incorporating digital image processing and discrete element method for modeling of geomaterials. Eng. Comput. 00-00. doi:10.1108/EC-11-2016-0390
Sabai, M. M., Cox, M. G. D. M., Mato, R. R., Egmond, E., and Lichtenberg, J. (2013). Concrete block production from construction and demolition waste in Tanzania. Resour. Conservation Recycl. 72, 9–19. doi:10.1016/j.resconrec.2012.12.003
Talbot, A. N., and Richart, F. E. (1923). The strength of concrete: its relation to the cement aggregates and water. Ill. Univ. Eng. Exp. Sta Bull. 137.
Wang, J., Zhang, H., Tang, S., and Liang, Y. (2013). Effects of particle size distribution on shear strength of accumulation soil. J. Geotechnical Geoenvironmental Eng. 139 (11), 1994–1997. doi:10.1061/(ASCE)GT.1943-5606.0000931
Wang, L. J., Liu, H., and Zhao, S. Y. (2010). Aggregate gradation design of asphalt mixture with stone-to-stone contact based on fuller’s model. J. Shanghai Univ. Engl. Ed. 14 (5), 387–390. doi:10.1007/s11741-010-0664-3
Wang, Y., Li, C. H., and Hu, Y. Z. (2018a). Use of X-ray computed tomography to investigate the effect of rock blocks on meso-structural changes in soil-rock mixture under triaxial deformation. Constr. Build. Mater. 164, 386–399. doi:10.1016/j.conbuildmat.2017.12.173
Wang, Y., Li, C. H., and Hu, Y. Z. (2018b). X-ray computed tomography (CT) observations of crack damage evolution in soil-rock mixture during uniaxial deformation. Arabian J. Geosciences 11 (9), 199. doi:10.1007/s12517-018-3561-z
Wang, Y., Li, X., and Wu, Y. F. (2015). Damage evolution analysis of SRM under compression using X-ray tomography and numerical simulation. Taylor Francis Group 18. doi:10.1080/19648189.2014.945044
Wu, M., Zhou, F., and Wang, J. (2023). DEM modeling of mini-triaxial test on soil-rock mixture considering particle shape effect. Comput. Geotechnics 153, 105110. doi:10.1016/j.compgeo.2022.105110
Xing, K., Zhou, Z., Yang, H., and Liu, B. (2018). Macro–meso freeze-thaw damage mechanism of soil–rock mixtures with different rock contents. Int. J. Pavement Eng. 21, 9–19. doi:10.1080/10298436.2018.1435879
Xu, W. J., Hu, L. M., and Gao, W. (2016). Random generation of the meso-structure of a soil-rock mixture and its application in the study of the mechanical behavior in a landslide dam. Int. J. Rock Mech. Min. Sci. 86, 166–178. doi:10.1016/j.ijrmms.2016.04.007
Yao, Y., Li, J., Ni, J., Liang, C., and Zhang, A. (2022). Effects of gravel content and shape on shear behaviour of soil-rock mixture: experiment and DEM modelling. Comput. Geotechnics 141, 104476. doi:10.1016/j.compgeo.2021.104476
Yi, Z. (2007). Study on the technical performance of asphalt stabilized macadam base. Chang’an University. (in Chinese).
Yilmaz, I., and Karacan, E. (1997). Geotechnical properties of alluvial soils: an example from South of Sivas (Turkey). Bull. Int. Assoc. Eng. Geol. - Bull. de l’Association Int. de Géologie de l’Ingénieur 55 (1), 159–165. doi:10.1007/bf02635418
Zhao, Y., Xu, T., Huang, X., and Li, Z. (2012). Gradation design of the aggregate skeleton in asphalt mixture. J. Test. Eval. 40, 20120142. doi:10.1520/JTE20120142
Keywords: alluvial-diluvial soil-rock mixture (ADSRM), N-method, gradation design, macro-meso shear properties, shear plane, rock block
Citation: Liu L, Fan Z, Yao L and Yang Y (2024) Effect of gradation on macro-meso shear properties of the alluvial-diluvial soil-rock mixture (ADSRM). Front. Mater. 11:1351954. doi: 10.3389/fmats.2024.1351954
Received: 11 December 2023; Accepted: 03 June 2024;
Published: 25 June 2024.
Edited by:
Ákos Török, Budapest University of Technology and Economics, HungaryCopyright © 2024 Liu, Fan, Yao and Yang. This is an open-access article distributed under the terms of the Creative Commons Attribution License (CC BY). The use, distribution or reproduction in other forums is permitted, provided the original author(s) and the copyright owner(s) are credited and that the original publication in this journal is cited, in accordance with accepted academic practice. No use, distribution or reproduction is permitted which does not comply with these terms.
*Correspondence: Linhu Yao, bGluaHVZMzBAMTYzLmNvbQ==