 Yang Yang
 Long Li
- Key Laboratory of New Technology for Construction of Cities in Mountain Area, School of Civil Engineering, Chongqing University, Chongqing, China
The combination of UAV camera and intelligent algorithm is a promising method for non-contact bridge crack detection. In this paper, an inspection tool based on UAV Image Acquisition Technology (UAVIAT) and Improved Intelligent Target Detection Technology (IITDT) called Improved Intelligent Real-Time Crack Detection Method for Bridges (IIRTCDMB) is proposed for efficient crack detection. The contributions of this paper are (1) The Squeeze-Excitement (SE) attention module is integrated into the target detection algorithm - You Only Look Once version 7 (YOLOv7) model to improve the learning ability of the feature channel. A Focal-efficient intersection over union (Focal-EIoU) loss function is also introduced to improve the regression accuracy of the model. As a result, a new crack image detection algorithm, YOLOv7-CD, is proposed. (2) A training process based on two-stage transfer learning (TSTL) is established, and hyper-parameter optimization of YOLOv7-CD is carried out. The feasibility and excellent performance of the proposed method are verified by applying it on the Cuntan Yangtze River Bridge. The results show that the average precision (AP) of the YOLOv7-CD model is improved by 3.19% compared with the original YOLOv7 model. After TSTL and hyperparameter optimization, the AP of the YOLOv7-CD model for bridge crack detection reaches 98.01%, which is higher than that of the popular target detection models. The IIRTCDMB proposed in this paper can acquire bridge surface images more safely and efficiently, and provide inspectors with more accurate structural crack information with lower computational and hardware requirements, which can provide technical support for the assessment of structural safety conditions and the formulation of maintenance programs.
1 Introduction
Crack disease is one of the most common diseases in concrete bridges, which has an essential impact on bridges’ structural stability and traffic capacity. Therefore, visually inspecting structures is important for bridge operation and maintenance (Ge et al., 2020; Saidin et al., 2022). With the increase in the service life of bridges, the demand for crack detection is also increasing (Mohan and Poobal, 2018). Currently, manual inspection and bridge inspection vehicle inspection are the main methods for bridge inspection. Manual detection has high risk, strong subjectivity, and long periods. At the same time, the bridge inspection vehicle method is not conducive to traffic safety, has limited applicable conditions, and is expensive (Tomiczek et al., 2019).
Recently, the rapid development of unmanned aerial vehicles (UAVs) has made collecting images of bridge conditions trivial (Perry et al., 2020). Its high-resolution camera can quickly and safely obtain high-definition images, which serves as an important basis for subsequent analysis of bridge defects. It has been confirmed that the UAS-based bridge inspection is faster and more objective than the existing technology (Kim et al., 2022). Unmanned aerial vehicles (UAVs) are now a viable option for augmenting bridge inspections (Khaloo et al., 2018; Li et al., 2024). Using UAVs for bridge appearance inspection not only has high accuracy and low cost (Seo et al., 2018) but can also perform all-around inspections (Sanchez-Cuevas et al., 2019; Wang et al., 2020; Yao et al., 2023a) and reduce the danger in the inspection work (Liu et al., 2020; Kao et al., 2022).
Currently, there are some things that could be improved in using traditional digital image processing methods to detect cracks. In the crack identification and extraction process, the main methods are the gray threshold segmentation method based on the gray difference between the crack area and the background (Xuhang et al., 2011) and the Canny iterative method based on the linear features of cracks (Xu et al., 2013). The gray threshold segmentation method can only give the general position of the cracks, and the positioning accuracy is insufficient. The Canny iterative method is susceptible to background clutter, resulting in a high rate of false detection and missed detection. With the evolution of machine learning technology, some scholars have implemented crack detection using crack multi-features combined with three statistical classification methods, namely, Support Vector Machine, AdaBoost, and Random Forest, respectively (Prasanna et al., 2016). However, these methods require the manual design of crack features, resulting in poor adaptability and scalability of the algorithm. The tensor voting algorithm (Guan et al., 2015) that enhances crack features by utilizing the linear difference between cracks and background noise has good results in detecting linear cracks, but it is not sensitive to complex cracks and may miss width information.
Deep learning has shown excellent performance in image recognition (Kim et al., 2018; Wei et al., 2019; Chen et al., 2020; Sun et al., 2021; Yang et al., 2021; Chen et al., 2023). Crack detection algorithms based on deep learning can be divided into two categories. The first category uses object detection networks for crack localization and identification, while the other uses semantic segmentation models for pixel-level recognition of crack images. Research has shown that the You Only Look Once (YOLO) series algorithm performs outstandingly among many object detection networks (Du et al., 2021). In the YOLO model, integrating the attention module or improving the feature extraction network can enhance the sensitivity of the model to the target features (Yao et al., 2019; Yang et al., 2022a; Liu et al., 2022; Zhang et al., 2023a; Kao et al., 2023); combining the depth-separable convolution or replacing the lightweight feature extraction network, a lightweight target detection network for real-time detection of cracks on the structure surface can be obtained (Zhang et al., 2020a; Yao et al., 2021a; Yang et al., 2022b; Zhang et al., 2022; Zhang et al., 2023b; Jin et al., 2023); introducing the focal loss function or transfer learning can improve the recognition accuracy of the model. Deep learning has been gradually applied to bridge crack detection (Zhang et al., 2020b; Yao et al., 2021b; Teng et al., 2022). However, there are still problems, such as difficulty in obtaining crack images, excessive training parameters of network models, long inference time, and low detection accuracy.
In order to obtain bridge surface crack images more efficiently and improve the model’s detection accuracy of cracks, this study proposed an improved intelligent real-time crack detection method for bridges (IIRTCDMB) based on UAVIAT and improved intelligent target detection technology (IITDT). First, the appearance image of the bridge to be detected was obtained through UAVs. Then, the SE attention module was introduced into the YOLOv7 model to enhance the feature extraction ability of cracks, and the Focal-efficient intersection over union (Focal-EIoU) loss function was used to balance positive and negative samples and accelerate loss convergence. The improved model was defined as YOLOv7-CD. To further improve the average precision (AP), the improved model underwent two-stage transfer learning (TSTL) training. The initial training was performed with the COCO2017 dataset to obtain the initial training weights. Then, the publicly available CRACK500 dataset (Eisenbach et al., 2017) was used for pre-training with different hyperparameters to obtain pre-training weights. Finally, the training is performed on the bridge crack dataset (QL_CRACK dataset), and the error is reduced by adjusting the values of hyperparameters to make the model more suitable for bridge crack detection.
2 Methodologies
The IIRTCDMB proposed in this article mainly includes high-definition image acquisition by UAVs and automatic localization and recognition of bridge cracks based on the YOLOv7-CD model. The specific process is shown in Figure 1.
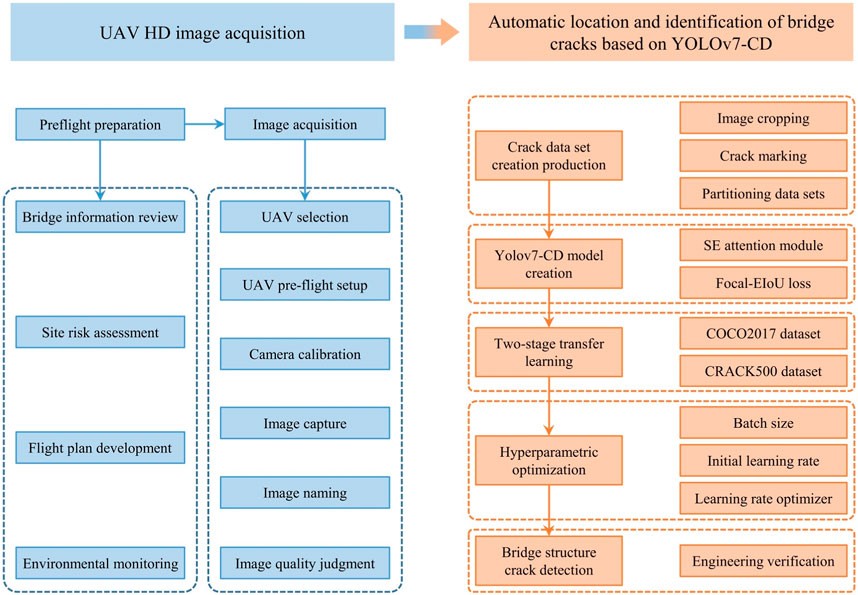
FIGURE 1. The diagram of the improved intelligent real-time crack detection method for bridges.
In the UAVIAT, bridge information review, site risk assessment, flight plan development, and daily environmental monitoring will be conducted. Then, the UAV will be selected, and parameter settings such as shooting distance and flight route will be completed. After camera calibration, the bridge structure’s appearance will be captured, and an automatic naming program will be written to assign position and number to each image. The image quality will be judged based on the proposed image quality evaluation function. The images with qualified quality will be stored in the database according to the preset cycle, and finally, the bridge crack dataset will be obtained. The YOLOv7-CD model will be trained with TSTL and hyperparameter optimization. Finally, cracks will be detected in the images, and their corresponding locations in the actual bridge will be obtained.
2.1 Image acquisition method
2.1.1 UAV selection
Currently, the UAVs mainly used for crack detection include DJ Mavic 2 Pro, DJ M210-RTK, DJ Mini 2, and DJ Mavic Air 2 (Xu et al., 2023a). Due to the large span of bridges inspected by UAVs, the main parameters to consider are hovering time and hovering accuracy. Additionally, since it involves storing appearance images of large-span bridges, there is also a high requirement for memory. Through an analysis of the parameters of the four UAVs, DJ Mavic Air 2 is the best option. Its hover time is 33 min, hover accuracy is ± 0.1, and memory size is 8 GB. To ensure consistent experimental conditions, the distance between the UAV and the target surface is fixed at 5.0m, and the normal direction of the lens is perpendicular to the target surface. The images will be taken in clear weather conditions and natural lighting. To ensure sufficient image data, the UAV will cover the entire bridge deck and tower surface, with a 50% overlap in the images taken.
2.1.2 Camera calibration
In the process of picture-taking and crack detection of concrete bridges, a geometric model of camera imaging is required to determine the interrelationship between the three-dimensional geometric position of a point on the surface of the bridge structure and its corresponding point in the image. In the UAVIAT, the calibration of camera parameters is the key link, and its calculation process and calibration results directly affect the authenticity of the crack detection results. The conversion model of the ground coordinate system to the pixel coordinate system is introduced below.
1) Transformation from ground coordinate system to camera coordinate system.
In order to accurately describe the motion trajectory of the UAV and obtain its position information, a transformation model from the ground coordinate system
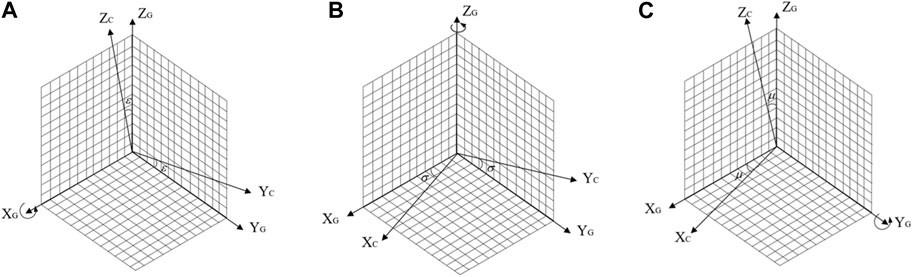
FIGURE 2. UAV motion state description parameters: (A) Rotation around XG axis; (B) Rotation around YG axis; (C) Rotation around ZG axis.
In addition to the rotation transformation, there is also a translation transformation between the UAV and the ground. Therefore, the coordinate transformation matrix from the ground coordinate system to the camera coordinate system is given by Eq. 2.
where
2) Transformation from camera coordinate system to image coordinate system.
As shown in Figure 3A, the transformation from the camera coordinate system to the image coordinate system
3) Transformation from image coordinate system to pixel coordinate system.
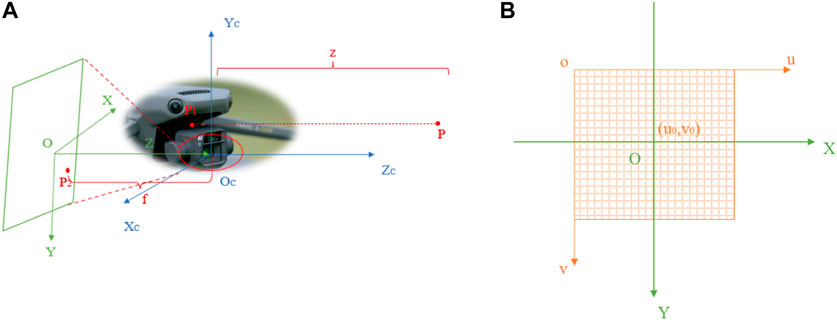
FIGURE 3. Coordinate transformation: (A) Transformation from camera coordinate system to image coordinate system; (B) Transformation from image coordinate system to pixel coordinate system.
The pixel coordinate system reflects the arrangement of pixels in the CMOS chip of the camera, as shown in Figure 3B. The image coordinate system and the pixel coordinate system
where
In summary, the formula for transforming the ground coordinate system to the pixel coordinate system is shown in Eq. 5. Eq. 6 represents the calculation of the intrinsic parameter matrix of the camera.
where
2.1.3 Image quality assessment
In this article, entropy and sharpness are utilized as two image quality parameters to assess the quality of the images captured from the UAV.10 (Duque et al., 2018). The formula for judging the image quality is given by Eq. 7 and Eq. 8. The criteria for judging the image quality are:
1) The image sharpness is greater than the average value of sharpness.
2) The image sharpness is less than the average value of sharpness, but the image entropy is less than the average value of entropy.
The image satisfying any of these points is considered a qualified image.
where N is the total number of captured bridge images,
2.2 Crack detection
2.2.1 YOLOv7-based crack
The bridge surface images that meet the quality requirements are input into the crack detection model YOLOv7. In the beginning, the input image enters the main feature extraction network Backbone, which performs crack feature extraction by convolutional normalization and activation function. In the feature extraction process, the image will be compressed in height and width first, then the channel expansion will be performed, and finally, the three effective crack feature layers will be formed. Then, the three effective crack feature layers obtained at Backbone will be fused by the FPN framework, which aims to combine the crack feature information at different scales for enhanced feature extraction of the image. FPN performs up-sampling and down-sampling on the crack features to achieve the fusion of crack features. After passing through the Backbone and FPN, three enhanced effective crack feature layers will be obtained. Each crack feature layer has a width, height, and number of channels. At this point, the crack feature map can be viewed as a collection of feature points, with three prior boxes at each feature point, each of which has the same number of crack features as the number of channels. Eventually, the RepConv structure is introduced in the Head part to equivalent the complex residual structure to a normal 3 × 3 convolution. This can reduce the complexity of the network while ensuring the same prediction performance.
2.2.2 Attention module
The task of locating and identifying cracks focuses on details such as background color and crack position. Therefore, in order to enhance the model’s perception of crack features and improve the detection effect on small targets, three SE channel attention modules were added to the YOLOv7 model. The SE attention module has three steps:
1) Using adaptive global average pooling to compress the length and width of the crack feature layer, leaving only the information of the channel dimension C.
2) Continuously using two fully connected layers to perform self-attention on the channel information and obtaining a feature map with a dimension of 1*1*C.
3) Performing activation by channel-wise multiplication with weight coefficients on the feature map with channel attention (1*1*C) and the original input feature map (H*W*C), and finally outputting a feature map with channel attention.
2.2.3 Loss functions
Neural network model training is the process of optimizing the parameters in the network and reducing the losses using a backpropagation algorithm. Loss is the penalty for inaccurate predictions during the training process and describes the difference between the model’s predicted results and the actual results. Eq. 9 is the formula for calculating the loss function of YOLOv7 during the training process.
where
where
When calculating the regression loss, the EIoU was used instead of complete intersection over union (CIoU) to consider the effects of overlapping area, centroid distance, and aspect ratio of the target and prediction boxes simultaneously. The EIoU takes into account the width and height loss, which minimizes the difference between the width and height of the target and prediction boxes, thereby accelerating convergence and improving regression accuracy. Since cracks are small and occupy a small proportion of the background, the focal loss function is introduced to balance the proportion of foreground and background data samples (Lin et al., 2020; Wang et al., 2023a). Finally, the Focal-EIoU loss function is obtained, as shown in Eq. 12 and Eq. 13.
where
2.2.4 YOLOv7-CD model
The YOLOv7 model, which integrates the SE attention module and the Focal-EIoU Loss, is named YOLOv7-CD, as shown in Figure 4. The red part indicates the added SE attention module, and the red arrow represents the changed computation path.
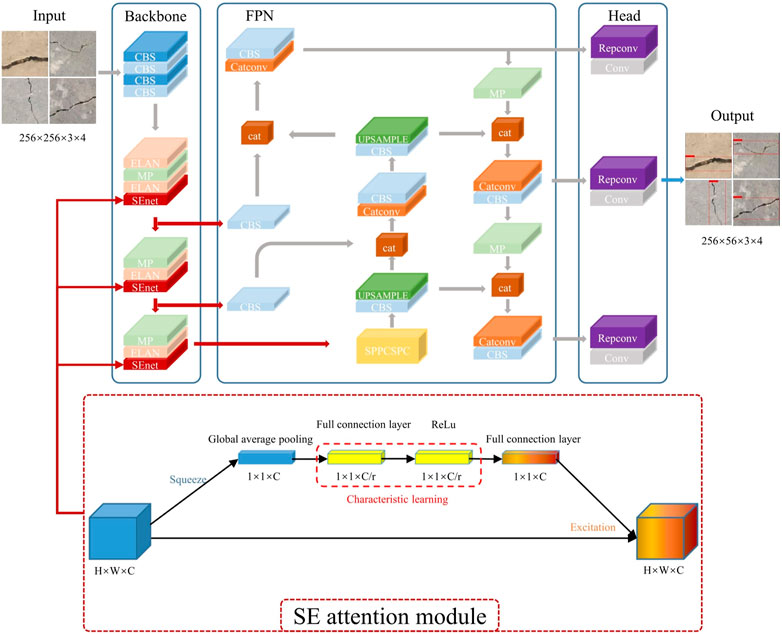
FIGURE 4. YOLOv7-CD model architecture.
2.3 Two-stage transfer learning
The hyperparameters for extracting different features in the same neural network model have good interoperability. In order to improve the training efficiency and prediction accuracy of the model, TSTL is used in this study. The transfer learning process is shown in Figure 5. In Stage 1, the initial training weights are obtained by initializing the model parameters on the COCO2017 dataset. In Stage 2, the model backbone network is frozen, and the batch normalization layer is not updated during feature transfer to reduce the model error and to ensure the transfer effect. The pre-trained model parameters are adjusted by training on the publicly available CRACK500 dataset, which is a pavement crack dataset suitable for target detection. In Stage 3, freeze training and then thaw training is performed on the QL_CRACK dataset.
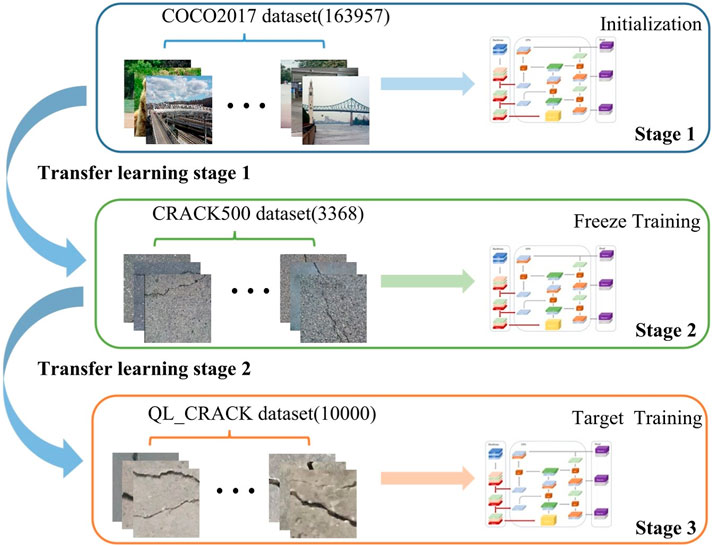
FIGURE 5. Two-stage transfer learning training diagram.
3 Experiments
3.1 Image acquisition
The selected research object of this article is the Cuntan Yangtze River Bridge, which starts from Huangjuewan Interchange in the south, crosses the Yangtze River, and ends at Happy Valley Interchange in the north. The total length of the line is 1.6 km, and the main bridge is 880 m long and 42 m wide.
The DJ Mavic Air 2 UAV was used for bridge crack image acquisition in the experiment, which has high vertical hovering accuracy and horizontal hovering accuracy (Yao et al., 2022). The resolution of captured photos can reach up to 8000*6000, and its high pixels can meet the data requirements of the experiment. In addition, the excellent endurance and stable flight speed of this UAV can ensure the efficiency of image acquisition.
The flight path of DJ Mavic Air 2 is shown in Figure 6.
1) Flew along the path A-B-C-D on the upper bridge deck, then flew to the lower bridge deck to shoot along the same route. After shooting the bridge deck, retrieved the UAV.
2) Flew from the top point E on one side of the bridge tower pylon to the bottom endpoint F, shot the four sides of the pylon back and forth, then flew to another pylon and flew up from the bottom endpoint G to the top point H. Repeated the appeal operation until all the pylons were shot and retrieved the UAV (this path was E-F-G-H).
3) The bridge pier shooting path (I-J-K-L) was similar to the bridge tower. Started flying from the top point I on one side of a bridge pier to the bottom endpoint J. After shooting four sides, flew to the next pier and repeated the aforementioned shooting operation. Finally, retrieved the UAV.
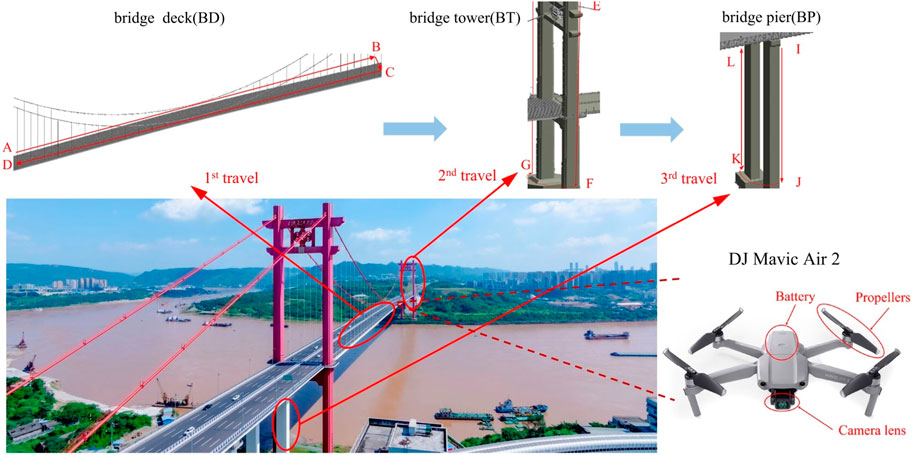
FIGURE 6. UAV shooting route diagram.
After each retrieval of the UAV, the acquired image information was read, and the images were numbered in the order in which they were taken. To obtain clear images of cracks, raw images with occlusions were consciously avoided, and images with occlusions were carefully screened and removed during the dataset creation process.
3.2 Dataset creation
In this experiment, a total of 466 raw images were acquired by DJ Mavic Air 2. In order to improve the training efficiency of the model, this article does some processing on the raw images. A raw image with a resolution of 8000 × 6000 was segmented into 713 sample images of 256 × 256, and then 10000 crack images that meet the criteria are selected as training sample images among the sample images according to the image quality ranking from high to low to create the QL_CRACK dataset. To determine the location of the crack images in the bridge structure, the images were named according to “bridge structure - raw image number - segmented image number”. The bridge structure includes a bridge deck (BD), a bridge tower (BT), and a bridge pier (BP). After obtaining the QL_CRACK dataset, Lamblmg software was used to annotate the image crack areas, and 10,000 annotation files in XML format were obtained after annotation. The COCO2017 public dataset and the publicly available CRACK500 crack dataset were downloaded from the internet as the datasets for transfer learning, with a total of 163,957 images in the COCO2017 dataset and 3,368 images in the CRACK500 dataset. To evaluate the generalization ability of the YOLOv7-CD model, 80% of the 10,000 images were used as the training and validation sets (with 80% of the training set and 20% of the validation set), and 20% were used as the test set according to the five-fold cross-validation principle.
3.3 Model training
The training process of the network model in this study was implemented in the Pytorch deep learning framework built in Windows 11, NVIDIA GeForce RTX 3060 was used for the GPU, AMD Ryzen 7 5800H with Radeon Graphics at 3.20 GHz was used for the CPU, CUDA11.0 and CUDNN8.0 were selected for the calculation platform, RAM specification was 16 GB, and the Deep learning framework was built by PyTorch 1.7.1. Development environment was based on Visual Studio Code 1.73, python3.9.
When training the model, the batch size can only be set to 2, 4, and 8 due to the limitation of the experimental platforms, and a small batch size setting can lead to a large model error and slow down the training speed during the batch normalization operation (Ioffe and Szegedy, 2015; Wu and He, 2018). However, the TSTL approach adopted in this study can solve this problem well. As shown in Figure 5, the approach first trained on the COCO2017 dataset to obtain the initial weights; then froze the backbone network and trained 50 epochs on the CRACK500 dataset to obtain the pre-training weights; and finally froze the backbone network to train 50 epochs on the QL_CRACK dataset and then unfroze it to train 250 epochs.
In order to compare the performance of the YOLOv7-CD model under different conditions, a total of 16 sets of working conditions were set up for comparison experiments, which were (SGD10−2.0)LR-(2 or 4 or 8)BS-(0)TL, (Adam10−2.0)LR-(2 or 4 or 8)BS-(0)TL, (SGD10−5.0)LR-(4)BS-(0) TL, (SGD10−4.0)LR-(4)BS-(0)TL, (SGD10−3.0)LR-(4)BS-(0)TL, (SGD10−1.0)LR-(4)BS-(0)TL, (Adam10−5.0)LR-(4)BS-(0)TL, (Adam10−4.0)LR-(4)BS-(0)TL, (Adam10−3.0)LR-(4)BS-(0)TL, (Adam10−1.0)LR-(4)BS-(0)TL and (Adam10−3.0)LR-(4)BS-(1or2)TL. “LR” and “BS” represent the learning rate and batch size, respectively. “SGD” and “Adam” are shorthand for stochastic gradient descent algorithm and adaptive descent algorithm, respectively. The corresponding parameters are in the front brackets. For example, “(SGD10−2.0)LR-(2)BS” indicates that the SGD learning rate optimization algorithm is chosen with an initial learning rate of 10−2 and a batch size of 2. “(0)TL” denotes TSTL training, “(1)TL” denotes no second stage of transfer learning training, and “(2)TL” denotes no TSTL was performed.
4 Results and discussion
In this article, Precision, Recall, F1, and AP were selected as accuracy evaluation indexes, and frames per second (FPS) were selected as model inference speed evaluation indexes to analyze the performance of the YOLOv7-CD model.
Before introducing the evaluation metrics, we should first introduce the confusion matrix. The confusion matrix itself is a rough evaluation of the prediction results, which can give us a macro understanding of the prediction results and the original data. We will also use the data in the confusion matrix to calculate the evaluation index.
The confusion matrix has four compartments that contain all the possible scenarios of the prediction result when we make a binary prediction.
True Positive (abbreviated as TP) means that the sample is actually Positive and the model predicts the sample as Positive.
True Negative (abbreviated as TN) means that the sample is actually Negative and the model predicts the sample as Negative.
False Positive (abbreviated as FP) means that the sample is actually Negative, but the model predicts it as Positive.
False Negative (abbreviated as FN) means that the sample is actually Positive, but the model predicts it to be Negative.
Precision, also known as the check rate, indicates the proportion of samples predicted to be Positive that are actually Positive. Precision can be seen as a measure of quality. Higher precision means that an algorithm returns more relevant results than irrelevant ones.
The formula is:
Recall, also known as the rate of checking for completeness, indicates the proportion of the number of actual positive samples in the positive sample that the prediction results in a positive sample to the proportion of positive samples in the full sample. Recall can be seen as a measure of quantity. High recall means that an algorithm returns most of the relevant results (whether or not irrelevant ones are also returned).
The formula is:
AP is the area under the Precision-recall curve, usually the better a classifier is, the higher the AP value is.
F1 is a weighted average of precision and recall.
The formula for F1 is as follows:
4.1 Comparative results of YOLOv7 and YOLOv7-CD
To verify the effectiveness of the improvement of the YOLOv7 model, the AP and FPS before and after the improvement with default parameters (batch size = 4, initial learning rate = 0.01 and SGD learning rate optimization algorithm) were compared, and the comparison results are shown in Table 1. Although the inference speed did not change after the model improvement, Precision, Recall, F1, and AP were improved. Among them, Precision improved by 5.50%, Recall improved by 4.24%, F1 improved by 0.09, and AP improved by 3.19%. This indicates that integrating the SE attention module and introducing the Focal-EIoU loss function in the YOLOv7 model can improve detection accuracy. The AP value before model improvement is 94.60% and the AP value after model improvement is 97.79%.
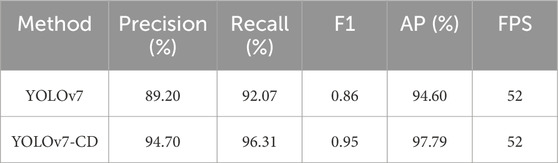
TABLE 1. Performance comparison before and after model improvement.
4.2 Hyperparameter optimization results
The parameters of the neural network are the internal variables of the neural network model, such as weights (w) and bias (b), and they can be obtained by training. The hyperparameters of the neural network are the external parameters of the model, such as learning rate, batch size, number of hidden layers, number of hidden layer units, activation function, momentum, etc. These parameters cannot be obtained from training and must be set manually, and they will affect the values of the obtained parameters w and b. The hyperparameters of the neural network have an important impact on the prediction results, and the appropriate hyperparameters will greatly improve the accuracy and efficiency of the network model.
In structured data, optimizing the batch size and learning rate are effective ways to achieve good performance in deep learning networks. Within a certain range, increasing batch size can improve convergence stability and reduce training time, but as the batch size increases, the number of iterations per epoch decreases, and the model’s accuracy decreases accordingly. The impact of the learning rate on model performance is reflected in two aspects: the size of the initial learning rate and the optimization algorithm for the learning rate. The initial learning rate usually has an optimal value. When the initial learning rate is too small, the model converges slowly, and when it is too large, the model does not converge. The convergence of the model will be different when different learning rate optimization algorithms are chosen. In this article, two optimizers, SGD and Adam, were used to investigate (Shafi and Assad, 2023).
In order to make the model more suitable for bridge crack detection, this method conducts comparison experiments on three variables, batch size, learning rate, and optimization algorithm. In the experiments, the minimum learning rate was always 0.01 times the initial learning rate. A loss function is used to determine the convergence of the model during the hyperparameter optimization.
4.2.1 Batch size optimization
The larger the batch size, the higher the GPU performance requirements and the batch size is usually a power of 2 (Dong et al., 2021). Therefore, in this experiment, the batch size was set to 2, 4, and 8 based on the actual hardware configuration. And the performance of two learning rate optimization algorithms, SGD and Adam, was compared simultaneously. To ensure the reliability of batch size optimization, the initial learning rate was set to 0.01, and 50 epochs were trained in the freezing phase and 250 epochs in the thawing phase on the QL_CRACK dataset. Figure 7 shows the relationship between Precision, Recall, F1, and AP with different batch sizes for different learning rate optimization algorithms. The blue color represents the SGD optimization algorithm, and the grey color represents the Adam optimization algorithm. The results are also summarized in Table 2.
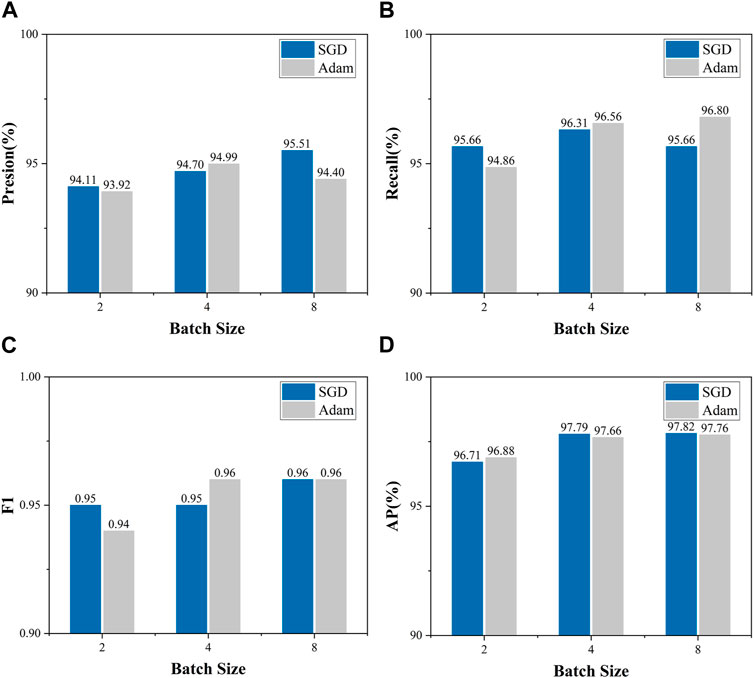
FIGURE 7. Variation of Precision, Recall, F1, and AP with batch size for different learning rate optimization algorithms: (A) Variation of Precision with batch size; (B) Variation of Recall with batch size; (C) Variation of F1 with batch size; (D) Variation of AP with batch size.
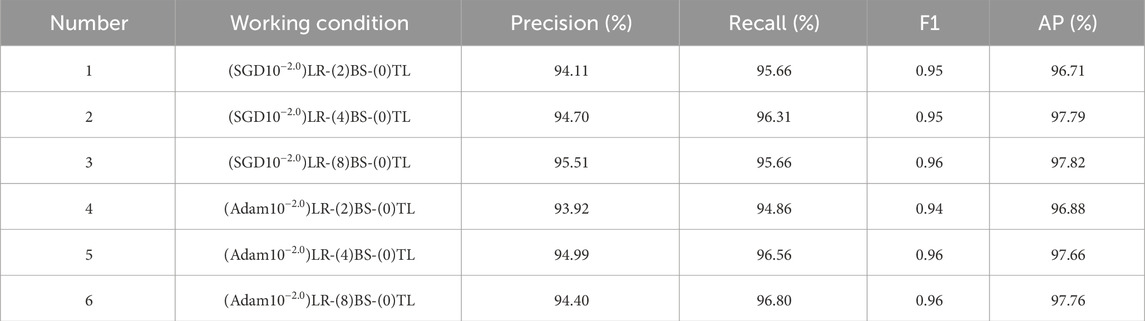
TABLE 2. Precision, Recall, F1, and AP for different working conditions.
Combined with Figure 7 and Table 2, it can be seen that Precision is the largest for Number 3 and Number 5, with 95.51% and 94.99%, respectively; Recall is the largest for Number 5 and Number 6, with 96.56% and 96.80%, respectively; F1 is the largest for Number 3, Number 5 and Number 6, all with 0.96. When the batch size is 4 and 8, the precision, recall, and F1 are all higher than when the batch size is 2.
When the batch size is increased from 2 to 4, the AP for SGD and Adam optimization algorithms improved by 1.08% and 0.76%, respectively, while when the batch size is increased from 4 to 8, the AP only improved by 0.03% and 0.1%, respectively. This indicates that the AP obtained by different optimization algorithms (SGD and Adam) have similar trends with the batch size, both of which have a large change in the batch size from 2 to 4 and a small change in the batch size from 4 to 8. The AP for the SGD and Adam optimization algorithms are the largest at a batch size of 8, but the difference with a batch size of 4 is small. Considering both the saving of video memory and the speed of training, the batch size of the freezing phase was set to 8, and the training batch size of the thawing phase was set to 4 during the experiment.
4.2.2 Learning rate optimization
The learning rate affects how fast the algorithm converges to the regionally minimal value. A suitable learning rate allows the algorithm to descend in the direction of the maximum gradient in appropriate steps, and the learning rate can be effectively optimized by the decreasing gradient of the loss function. Since the YOLOv7 model uses the learning rate optimization algorithm, only the initial learning rate and the optimization algorithm can be considered in the optimization (Wang et al., 2023b).
In this manuscript, the range of the initial learning rate was set from 10−5.0 to 10−1.0, with a step size of 10 set in sequence (Mayr et al., 2018; Xu et al., 2023b; Yao et al., 2023b). The minimum learning rate was set to 0.01 times the initial learning rate. The batch size follows the optimal solution mentioned above (batch size = 4), and the Epoch is set to 100. Table 3 shows the training loss under different working conditions. Figures 8A, B show the convergence of the loss function values with the initial learning rate for the SGD and Adam optimization algorithms, respectively. From Figure 8A, it can be seen that the loss function converges fastest when the initial learning rate is set to 10−3 when the SGD optimization algorithm is used, and the loss function fluctuates more in the early stage when the initial learning rate is 10−1, indicating that the learning rate is set too large at this time and the model does not converge well. From Figure 8B, it can be seen that the convergence curves of the loss function are smooth when the Adam optimization algorithm is used, but in the convergence process, the loss function values of each working condition have the following relationships: Number 14>Number 5, 11and 12>No. 14. When the initial learning rate is 10−3, the model convergence effect is obviously better than other working conditions.
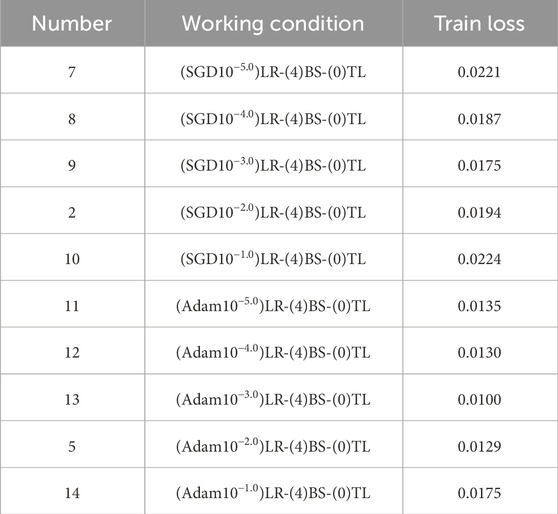
TABLE 3. Train loss under different working conditions.
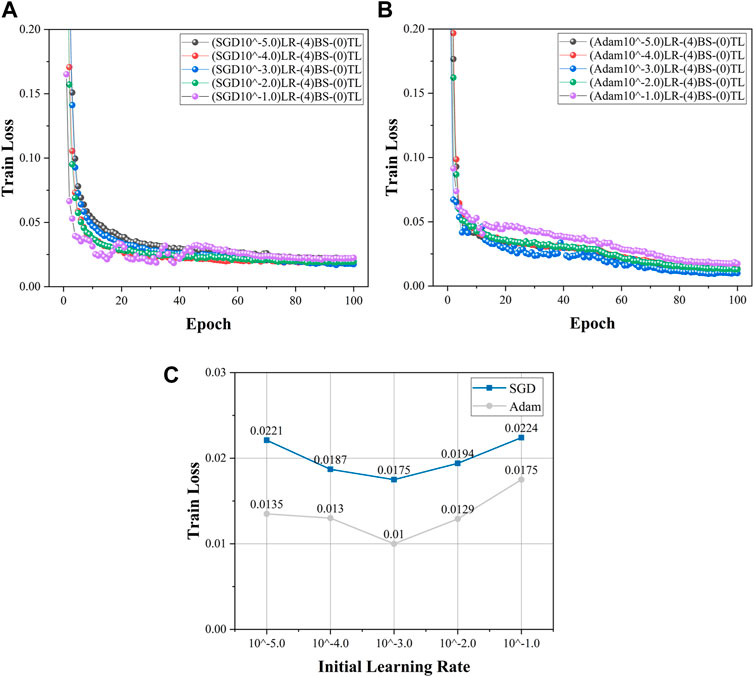
FIGURE 8. Learning rate optimization process: (A) loss variation of SGD optimization algorithm with different initial learning rates; (B) loss variation of Adam optimization algorithm with different initial learning rates; (C) Variation of the loss function with initial learning rate.
Figure 8C shows the variation of the loss function with the initial learning rate when the SGD and Adam optimization algorithms were used. Combining Figure 8C and Table 3, it can be seen that the minimum loss is 0.0175 for an initial learning rate of 10−3, and the maximum is 0.0224 for an initial learning rate of 10−1 when the SGD optimization algorithm was used. And the minimum loss is 0.0100 for an initial learning rate of 10−3, and the maximum is 0.0175 for an initial learning rate of 10−1 when the Adam optimization algorithm was used. The trend of the loss curve with the initial learning rate is similar for the SGD and Adam optimization algorithms, both decreasing first and then increasing, and there is an optimal initial learning rate. In addition, the loss functions of the Adam optimization algorithm are lower than those of the SGD optimization algorithm. The optimal result is that the learning rate optimization algorithm is set to Adam, and the initial learning rate is set to 0.001.
4.3 Transfer learning results
In order to demonstrate the enhancement effect brought by the TSTL approach, a comparison experiment was conducted. The AP under different working conditions are counted in Table 4. “(0)TL” represents TSTL, “(1)TL” represents only transfer learning stage 1, and " (2)TL” represents no transfer learning. The AP of YOLOv7-CD is 98.01% with TSTL, 97.75% with only transfer learning stage 1, and 96.23% with the model without transfer learning.
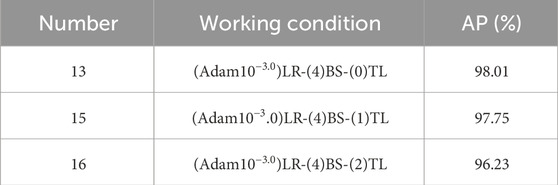
TABLE 4. AP under different transfer learning conditions.
AP of the YOLOv7-CD model with TSTL is 98.01%, AP of the YOLOv7-CD model with only transfer learning stage 1 is 97.75%, AP of the YOLOv7-CD model without transfer learning is 96.23%. For more visual observation of the effect of transfer learning, Figure 9 shows the convergence of the loss function for different transfer learning cases. It can be seen from Figure 9 that there is a relationship of “(2)TL < (1)TL < (0)TL” in the training loss during convergence, indicating that both phases of transfer learning can reduce the value of the loss function of the model and thus improve the model accuracy.
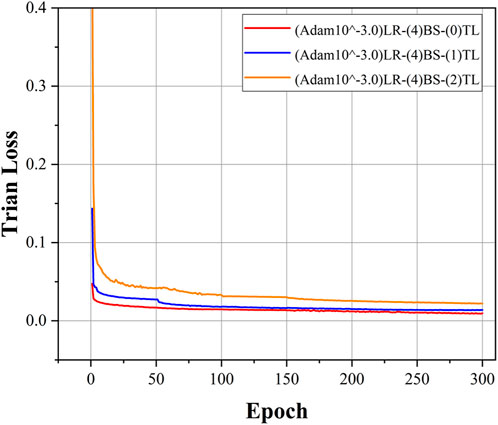
FIGURE 9. YOLOv7-CD model convergence process under different transfer learning cases.
4.4 Crack detection results
In YOLO, confidence is a value between 0 and 1 that indicates how sure the model is about the detected target (Yang et al., 2022c; Yang et al., 2022d; Yang et al., 2023a; Yang et al., 2023b; Yang et al., 2023c; Yang et al., 2024). This method has a good effect on bridge crack detection, and some of the detection results are shown in Figure 10. The naming rule in the figure is “bridge structure location - original image number - segmented image number” For example, “BR-095–164” means the crack is located in the 164th segmented image of the 95th captured image of the bridge deck. This is a good way to determine the location of the crack in the bridge structure. The red box in the image indicates the location of the crack, and the confidence level is marked in the lower left corner.
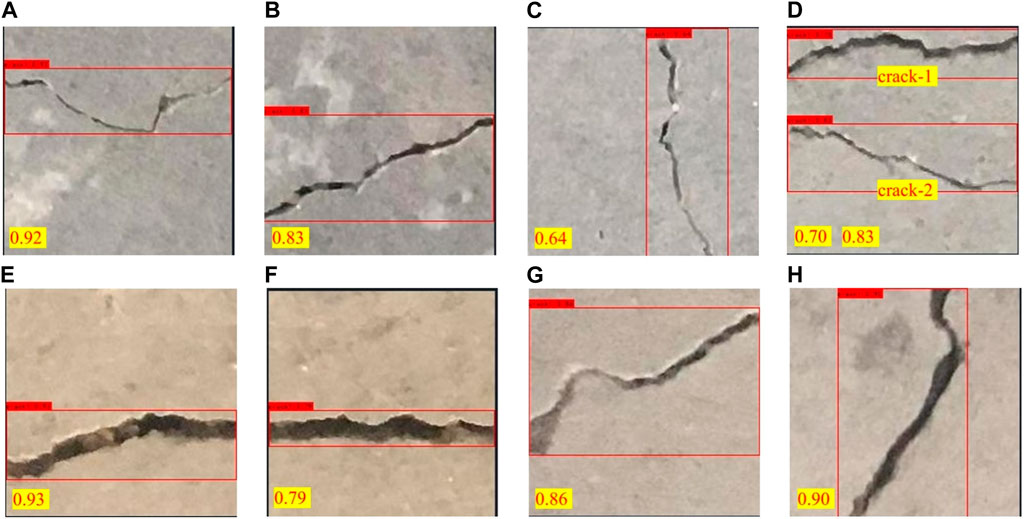
FIGURE 10. Bridge crack detection results: (A) BD-095-164; (B) BD-095-168; (C) BD-107-017; (D) BD-105-13; (E) BP-400-093; (F) BP-400-094; (G) BT-380-283; (H) BT-380-059.
From Figure 10, it can be seen that YOLOv7-CD model has a good detection effect on transverse cracks, vertical cracks, and oblique cracks. The mean confidence rate is 0.83, ranging from 0.60 to 0.96. The cracks in Figures 10A, E, and Figure 10H all have certain curvature, similar to U-shape, and their confidence levels are above 0.9. For the oblique cracks, whether it is the southwest-northeast-trending crack in Figures 10B, G or the northwest-southeast-trending crack “crack-2” in Figure 10D, the confidence level is above 0.8. In contrast, for the transverse crack in Figure 10F and the vertical crack in Figure 10C, the confidence levels are below 0.8. The lowest confidence level is for transverse and vertical cracks, higher for diagonal cracks, and the highest confidence level is for U-shaped cracks, indicating that the model believes that bridge cracks should be more irregularly oriented through crack feature learning. Two cracks are present in Figure 10D, and the model accurately identifies the number and extent of cracks with confidence levels of 0.70 and 0.83. For fine cracks, the confidence level is 0.92 in Figure 10A and 0.64 in Figure 10C; for wide cracks, the confidence level is 0.93 in Figure 10E and 0.79 in Figure 10F. This indicates that the width of the crack does not have a significant effect on the confidence level of crack detection. Overall, YOLOv7-CD can quickly and accurately locate and identify cracks in the acquired images.
4.5 Comparison of different models
The improved model in this study was compared with five currently common target detection networks (YOLOv4, YOLOv5m, YOLOv4-tiny, and MobileNet-SSD) for experiments. The AP, number of parameters (#Param), computation volume (FLOPs), and FPS were used as evaluation metrics, and the comparison results are tallied in Table 5.
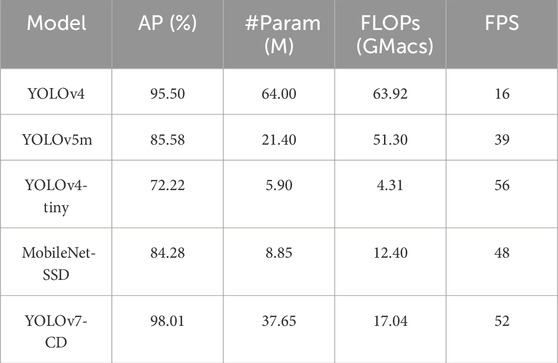
TABLE 5. Performance comparison of different target detection models.
From Table 5, the AP of YOLOv4, YOLOv5m, YOLOv4-tiny, MobileNet-SSD, and YOLOv7-CD are 95.5%, 85.58%, 72.22%, 84.28%, and 98.01%, respectively. The prediction accuracy of YOLOv7-CD is higher than the remaining four target detection models. The parameters of YOLOv4, YOLOv5m, YOLOv4-tiny, MobileNet-SSD, and YOLOv7-CD are 64, 21.4, 5.9, 8.85, and 37.65 M, respectively; the computational volume were 63.92, 51.3, 4.31, 12.4 and 17.04 GMacs, respectively; the ratio of parameter number to the computational volume were 1.00, 0.42, 1.37, 0.71, and 2.21, respectively.
YOLOv7-CD has the largest ratio of parameters to computation volume, and its higher number of parameters maintains a lower computation volume, which will ensure its fast inference capability to a certain extent. The FPS of YOLOv4, YOLOv5m, YOLOv4-tiny, MobileNet-SSD, and YOLOv7-CD are 16, 39, 56, 48, and 52, respectively. YOLOv4-tiny has the fastest inference speed of 56, followed by 52 for YOLOv7-CD. In terms of inference speed, YOLOv7-CD is 7.6% lower than YOLOv4-tiny, but in terms of AP, YOLOv7-CD is 25.79% higher than YOLOv4-tiny. Therefore, among the five object detection models, YOLOv7-CD has the best comprehensive performance in both prediction accuracy and inference speed.
5 Conclusion
In response to the current problems in intelligent bridge crack detection, such as difficulties in acquiring high-quality crack images, long inference time of network models, and detection accuracy to be improved, this article proposes an IIRTCDMB based on UAVIAT and IITDT.
The method proposed in this article can effectively detect cracks with different morphologies and complex backgrounds and has strong robustness as well as background noise filtering capability, which can reduce the problems of noise interference and blurring of UAV images due to the influence of environmental conditions. The adopted crack image naming method can quickly find out the actual location where the cracks appear and maintain them in time.
In order to verify the excellent performance of this method, it was applied to the Cuntan Yangtze River Bridge, and the following conclusions were obtained:
1) The YOLOv7-CD model, which integrates the SE attention module and introduces the Focal EIOU loss function, has an AP improvement of 3.19% compared to the original YOLOv7 model. The comparison experiments of transfer learning show that both stages of transfer learning can reduce the loss of model convergence.
2) The hyperparameter optimization of the YOLOv7-CD model can reduce the model loss to a certain degree and improve the accuracy of the model in detecting bridge cracks. The model performs best when the batch size is 8, the initial learning rate is 0.001, and the learning rate optimization algorithm is Adam. Because the AP difference between the batch size of 4 and 8 is small, the batch size of the freezing phase is set to 8, and the batch size of the thawing phase is set to 4 in order to save computational performance.
3) In the crack localization and identification results, the confidence level of horizontal and vertical cracks is the lowest, the confidence level of oblique cracks is higher, and the confidence level of U-shaped cracks is the highest, which indicates that the model believes that the bridge cracks should be more irregularly oriented through crack feature learning. The average value of the crack detection confidence is 0.83. Overall, the YOLOv7-CD model can quickly and accurately perform crack location and identification on the acquired images.
4) Under the conditions of this article, the AP of the YOLOv7-CD model is 98.01%, and the FPS is 52. Its comprehensive performance is all the better than the current popular target detection models YOLOv4, YOLOv5m, YOLOv4-tiny, and MobileNet-SSD.
In conclusion, the method proposed in this paper solves the current problems of difficult crack image acquisition and high cost of image labeling while improving the performance of the model. The model can focus on the relationship between pixels, improve the robustness of the model, and reduce the time cost of sample labeling. In the future, the model can be further optimized toto improve the segmentation ability of the model for crack edges and small cracks, and to improve the generalization ability of the model.
Data availability statement
The data analyzed in this study is subject to the following licenses/restrictions: The datasets used and analyzed during the current study are available from the corresponding author on reasonable request. Requests to access these datasets should be directed to GY, eWFvZ2FuZ0BjcXUuZWR1LmNu.
Author contributions
YY: Writing–review and editing, Conceptualization, Methodology. LL: Writing–original draft, Formal Analysis, Software. GY: Writing–review and editing, Conceptualization, Methodology. HD: Writing–original draft. YC: Writing–original draft. LW: Writing–original draft.
Funding
The author(s) declare financial support was received for the research, authorship, and/or publication of this article. This research was funded by Chongqing City Infrastructure Construction Investment Co., Ltd. Grant number CQCT-JSA-GC-2021-0140 and Central Universities Basic Research Operating Expenses (2023CDJXY-031).
Conflict of interest
The authors declare that the research was conducted in the absence of any commercial or financial relationships that could be construed as a potential conflict of interest.
The reviewer [XL] declared a shared affiliation with the authors to the handling editor at the time of review.
The author(s) declare financial support was received for the research, authorship, and/or publication of this article. This research was funded by Chongqing City Infrastructure Construction Investment Co., Ltd. Grant number CQCT-JSA-GC-2021-0140 and Central Universities Basic Research Operating Expenses (2023CDJXY-031). The funder had the following involvement in the study: data collection and analysis.
Publisher’s note
All claims expressed in this article are solely those of the authors and do not necessarily represent those of their affiliated organizations, or those of the publisher, the editors and the reviewers. Any product that may be evaluated in this article, or claim that may be made by its manufacturer, is not guaranteed or endorsed by the publisher.
References
Chen, L. K., Chen, W. X., Wang, L., Zhai, C. C., Hu, X. L., Sun, L. L., et al. (2023). Convolutional neural networks (CNNs)-based multi-category damage detection and recognition of high-speed rail (HSR) reinforced concrete (RC) bridges using test images. Eng. Struct. 276, 115306. doi:10.1016/j.engstruct.2022.115306
Chen, X. X., Ye, Y., Zhang, X., and Yu, C. C. (2020). Bridge damage detection and recognition based on deep learning. J. Phys. Conf. Ser. 1626 012151 doi:10.1088/1742-6596/1626/1/012151
Dong, X. P., Shen, J. B., Wang, W. G., Shao, L., Ling, H. B., and Porikli, F. (2021). Dynamical hyperparameter optimization via deep reinforcement learning in tracking. Ieee Trans. Pattern Analysis Mach. Intell. 43 (5), 1515–1529. doi:10.1109/tpami.2019.2956703
Du, Y. C., Pan, N., Xu, Z. H., Deng, F. W., Shen, Y., and Kang, H. (2021). Pavement distress detection and classification based on YOLO network. Int. J. Pavement Eng. 22 (13), 1659–1672. doi:10.1080/10298436.2020.1714047
Duque, L., Seo, J., and Wacker, J. (2018). Bridge deterioration quantification protocol using UAV. J. Bridge Eng. 23 (10). doi:10.1061/(asce)be.1943-5592.0001289
Eisenbach, M., Stricker, R., Seichter, D., Amende, K., Debes, K., Sesselmann, M., et al. (2017). “How to get pavement distress detection ready for deep learning? A systematic approach,” in Proceedings of the 2017 International Joint Conference on Neural Networks (IJCNN), Anchorage, AK, USA, May 2017.
Ge, L., Dan, D., and Li, H. (2020). An accurate and robust monitoring method of full-bridge traffic load distribution based on YOLO-v3 machine vision. Struct. Control Health Monit. 27 (12). doi:10.1002/stc.2636
Guan, H. Y., Li, J., Yu, Y. T., Chapman, M., Wang, H. Y., Wang, C., et al. (2015). Iterative tensor voting for pavement crack extraction using mobile laser scanning data. Ieee Trans. Geoscience Remote Sens. 53 (3), 1527–1537. doi:10.1109/tgrs.2014.2344714
Ioffe, S., and Szegedy, C. (2015). Batch normalization: accelerating deep network training by reducing internal covariate shift. Available at: https://arxiv.org/abs/1502.03167.
Jin, Q. L., Han, Q. B., Su, N. A., Wu, Y., and Han, Y. F. (2023). A deep learning and morphological method for concrete cracks detection. J. Circuits Syst. Comput. 32. doi:10.1142/s0218126623502717
Kao, S. P., Chang, Y. C., and Wang, F. L. (2023). Combining the YOLOv4 deep learning model with UAV imagery processing technology in the extraction and quantization of cracks in bridges. Sensors 23 (5), 2572. doi:10.3390/s23052572
Kao, S.-P., Wang, F.-L., Lin, J.-S., Tsai, J., Chu, Y.-D., and Hung, P.-S. (2022). Bridge crack inspection efficiency of an unmanned aerial vehicle system with a laser ranging module. Sensors 22 (12), 4469. doi:10.3390/s22124469
Khaloo, A., Lattanzi, D., Cunningham, K., Dell'Andrea, R., and Riley, M. (2018). Unmanned aerial vehicle inspection of the Placer River Trail Bridge through image-based 3D modelling. Struct. Infrastructure Eng. 14 (1), 124–136. doi:10.1080/15732479.2017.1330891
Kim, I. H., Jeon, H., Baek, S. C., Hong, W. H., and Jung, H. J. (2018). Application of crack identification techniques for an aging concrete bridge inspection using an unmanned aerial vehicle. Sensors 18 (6), 1881. doi:10.3390/s18061881
Kim, I.-H., Yoon, S., Lee, J. H., Jung, S., Cho, S., and Jung, H.-J. (2022). A comparative study of bridge inspection and condition assessment between manpower and a UAS. Drones 6 (11), 355. doi:10.3390/drones6110355
Li, Q., Yang, Y., Yao, G., Wei, F., Xue, G., and Qin, H. (2024). Multiobject real-time automatic detection method for production quality control of prefabricated laminated slabs. J. Constr. Eng. Manag. 150 (3), 05023017. doi:10.1061/jcemd4.coeng-14089
Lin, T.-Y., Goyal, P., Girshick, R., He, K., and Dollar, P. (2020). Focal loss for dense object detection. IEEE Trans. pattern analysis Mach. Intell. 42 (2), 318–327. doi:10.1109/tpami.2018.2858826
Liu, L. S., Ke, C. Y., Lin, H., and Xu, H. (2022). Research on pedestrian detection algorithm based on MobileNet-YoLo. Comput. Intell. Neurosci. 2022, 1–12. doi:10.1155/2022/8924027
Liu, Y.-F., Nie, X., Fan, J.-S., and Liu, X.-G. (2020). Image-based crack assessment of bridge piers using unmanned aerial vehicles and three-dimensional scene reconstruction. Computer-Aided Civ. Infrastructure Eng. 35 (5), 511–529. doi:10.1111/mice.12501
Mayr, A., Klambauer, G., Unterthiner, T., Steijaert, M., Wegner, J. K., Ceulemans, H., et al. (2018). Large-scale comparison of machine learning methods for drug target prediction on ChEMBL. Chem. Sci. 9 (24), 5441–5451. doi:10.1039/c8sc00148k
Mohan, A., and Poobal, S. (2018). Crack detection using image processing: a critical review and analysis. Alexandria Eng. J. 57 (2), 787–798. doi:10.1016/j.aej.2017.01.020
Perry, B. J., Guo, Y., Atadero, R., and van de Lindt, J. W. (2020). Streamlined bridge inspection system utilizing unmanned aerial vehicles (UAVs) and machine learning. Measurement 164, 108048. doi:10.1016/j.measurement.2020.108048
Prasanna, P., Dana, K. J., Gucunski, N., Basily, B. B., La, H. M., Lim, R. S., et al. (2016). Automated crack detection on concrete bridges. Ieee Trans. Automation Sci. Eng. 13 (2), 591–599. doi:10.1109/tase.2014.2354314
Saidin, S. S., Jamadin, A., Abdul Kudus, S., Mohd Amin, N., and Anuar, M. A. (2022). An overview: the application of vibration-based techniques in bridge structural health monitoring. Int. J. Concr. Struct. Mater. 16 (1), 69. doi:10.1186/s40069-022-00557-1
Sanchez-Cuevas, P. J., Ramon-Soria, P., Arrue, B., Ollero, A., and Heredia, G. (2019). Robotic system for inspection by contact of bridge beams using UAVs. Sensors 19 (2), 305. doi:10.3390/s19020305
Seo, J., Duque, L., and Wacker, J. (2018). Drone-enabled bridge inspection methodology and application. Automation Constr. 94, 112–126. doi:10.1016/j.autcon.2018.06.006
Shafi, S., and Assad, A. (2023). “Exploring the relationship between learning rate, batch size, and epochs in deep learning: an experimental study,” in Soft computing for problem solving (Singapore: Springer Nature Singapore).
Sun, Y. J., Yang, Y., Yao, G., Wei, F. J., and Wong, M. P. (2021). Autonomous crack and bughole detection for concrete surface image based on deep learning. Ieee Access 9, 85709–85720. doi:10.1109/access.2021.3088292
Teng, S., Liu, Z. C., and Li, X. D. (2022). Improved YOLOv3-based bridge surface defect detection by combining high- and low-resolution feature images. Buildings 12 (8), 1225. doi:10.3390/buildings12081225
Tomiczek, A. P., Whitley, T. J., Bridge, J. A., and Ifju, P. G. (2019). Bridge inspections with small unmanned aircraft systems: case studies. J. Bridge Eng. 24 (4). doi:10.1061/(asce)be.1943-5592.0001376
Wang, C. Y., Bochkovskiy, A., and Liao, H. Y. M. (2023a). “YOLOv7: trainable bag-of-freebies sets new state-of-the-art for real-time object detectors,” in Proceedings of the IEEE/CVF Conference on Computer Vision and Pattern Recognition (CVPR), Vancouver, CANADA.
Wang, H.-F., Zhai, L., Huang, H., Guan, L.-M., Mu, K.-N., and Wang, G.-p. (2020). Measurement for cracks at the bottom of bridges based on tethered creeping unmanned aerial vehicle. Automation Constr. 119, 103330. doi:10.1016/j.autcon.2020.103330
Wang, Z.-J., Gao, H.-B., Wang, X.-H., Zhao, S.-Y., Li, H., and Zhang, X.-Q. (2023b). Adaptive learning rate optimization algorithms with dynamic bound based on Barzilai-Borwein method. Inf. Sci. 634, 42–54. doi:10.1016/j.ins.2023.03.050
Wei, F. J., Yao, G., Yang, Y., and Sun, Y. J. (2019). Instance-level recognition and quantification for concrete surface bughole based on deep learning. Automation Constr. 107, 102920. doi:10.1016/j.autcon.2019.102920
Xu, H. K., Tian, Y., Lin, S., and Wang, S. C. (2013). “Research of image segmentation algorithm applied to concrete bridge cracks,” in Proceedings of the International Conference on Information Science and Technology (ICIST), Yangzhou, China, March 2013.
Xu, Z., Wang, H., Xing, C., Tao, T., Mao, J., and Liu, Y. (2023b). Physics guided wavelet convolutional neural network for wind-induced vibration modeling with application to structural dynamic reliability analysis. Eng. Struct. 297, 117027. doi:10.1016/j.engstruct.2023.117027
Xu, Z., Wang, Y., Hao, X., and Fan, J. (2023a). Crack detection of bridge concrete components based on large-scene images using an unmanned aerial vehicle. Sensors (Basel) 23 (14), 6271. doi:10.3390/s23146271
Xuhang, T., Jie, G., Yun, L., and Zhouping, Y. (2011). “A new image-based method for concrete bridge bottom crack detection,” in Proceedings of the 2011 International Conference on Image Analysis and Signal Processing, Hubei, October 2011.
Yang, Y., Li, Q., and Yao, G. (2022b). Intelligent identification and detection method of prefabricated laminated slab. J. Civ. Environ. Eng. 44 (01), 87–93. doi:10.11835/j.issn.2096-6717.2020.187
Yang, Y. Y., Ling, Y., Tan, X., Wang, S., and Wang, R. Q. (2022d). Damage identification of frame structure based on approximate metropolis–hastings algorithm and probability density evolution method. Int. J. Struct. Stab. Dyn.
Yang, Y. H., Lu, X., Tan, H. K., Chai, R., Wang, , and Zhang, Y. (2022c). Fundamental mode shape estimation and element stiffness evaluation of girder bridges by using passing tractor-trailers. Mech. Sys. Sig. Pr. 169.
Yang, Y. H., Lu, X., Tan, R., Wang, , and Zhang, Y. (2023b). Mode shape identification and damage detection of bridge by movable sensory system. IEEE trans. Intell. Transp. Syst. 24 1299–1313.
Yang, Y. Z., Wang, Q., Yang, X., Tan, , and Gao, Y. (2024). Bridge bearing damage identification based on statistical moment change rate. Mech. Sys. Sig. Pr. 206, 110898.
Yang, Y. Z., Wang, B., Xian, H. K., Chai, Z., Yu, Y., Zhang, , et al. (2023a). Baseline-free detection method for change of lateral stiffness of high-rise building based on statistical moment curvature. Struct. Control. Health Monit. 4373174.
Yang, Y., Yang, L., and Yao, G. (2021). Post-processing of high formwork monitoring data based on the back propagation neural networks model and the autoregressive—moving-average model. Symmetry 13 (8), 1543. doi:10.3390/sym13081543
Yang, Z., Ni, C. S., Li, L., Luo, W. T., and Qin, Y. (2022a). Three-stage pavement crack localization and segmentation algorithm based on digital image processing and deep learning techniques. Sensors 22 (21), 8459. doi:10.3390/s22218459
Yao, G., Li, R., and Yang, Y. (2023a). An improved multi-objective optimization and decision-making method on construction sites layout of prefabricated buildings. Sustainability 15 (7), 6279. doi:10.3390/su15076279
Yang, Y., Xu, W., Gao, Z., Yu, Z., and Zhang, Y. (2023c). Research progress of SHM system for super high-rise buildings based on wireless sensor network and cloud platform. Remote Sens. 15 (6) 1473.
Yao, G., Sun, W., Yang, Y., Wang, M., Li, R., and Zheng, Y. (2023b). Multi-volume variable scale bitmap data object classification algorithm architectural concrete color difference detection. J. Intelligent Constr. 1 (2), 9180010. doi:10.26599/jic.2023.9180010
Yao, G., Sun, W. T., Yang, Y., Sun, Y. J., Xu, L. J., and Zhou, J. (2022). Chromatic aberration identification of fair-faced concrete research based on multi-scale lightweight structured data algorithm. Front. Mater. 9. doi:10.3389/fmats.2022.851555
Yao, G., Sun, Y. J., Wong, M. P., and Lv, X. N. (2021b). A real-time detection method for concrete surface cracks based on improved YOLOv4. Symmetry-Basel 13 (9), 1716. doi:10.3390/sym13091716
Yao, G., Sun, Y. J., Yang, Y., and Liao, G. (2021a). Lightweight neural network for real-time crack detection on concrete surface in fog. Front. Mater. 8. doi:10.3389/fmats.2021.798726
Yao, G., Wei, F., Yang, Y., and Sun, Y. (2019). Deep-learning-based bughole detection for concrete surface image. Adv. Civ. Eng. 2019, 1–12. doi:10.1155/2019/8582963
Zhang, C. B., Chang, C. C., and Jamshidi, M. (2020b). Concrete bridge surface damage detection using a single-stage detector. Computer-Aided Civ. Infrastructure Eng. 35 (4), 389–409. doi:10.1111/mice.12500
Zhang, J., Qian, S. R., and Tan, C. (2022). Automated bridge surface crack detection and segmentation using computer vision-based deep learning model. Eng. Appl. Artif. Intell. 115, 105225. doi:10.1016/j.engappai.2022.105225
Zhang, J., Qian, S. R., and Tan, C. (2023b). Automated bridge crack detection method based on lightweight vision models. Complex and Intelligent Syst. 9 (2), 1639–1652. doi:10.1007/s40747-022-00876-6
Zhang, Y., Sun, Y. P., Wang, Z., and Jiang, Y. (2023a). YOLOv7-RAR for urban vehicle detection. Sensors 23 (4), 1801. doi:10.3390/s23041801
Keywords: bridge crack detection, target detection algorithm, transfer learning, hyperparameter optimization, unmanned aerial vehicle
Citation: Yang Y, Li L, Yao G, Du H, Chen Y and Wu L (2024) An modified intelligent real-time crack detection method for bridge based on improved target detection algorithm and transfer learning. Front. Mater. 11:1351938. doi: 10.3389/fmats.2024.1351938
Received: 07 December 2023; Accepted: 09 January 2024;
Published: 05 February 2024.
Edited by:
Jialuo He, Washington State University, United StatesReviewed by:
Zidong Xu, Southeast University, ChinaXiaohua Li, Chongqing University, China
Junlin Heng, University of Birmingham, United Kingdom
Copyright © 2024 Yang, Li, Yao, Du, Chen and Wu. This is an open-access article distributed under the terms of the Creative Commons Attribution License (CC BY). The use, distribution or reproduction in other forums is permitted, provided the original author(s) and the copyright owner(s) are credited and that the original publication in this journal is cited, in accordance with accepted academic practice. No use, distribution or reproduction is permitted which does not comply with these terms.
*Correspondence: Gang Yao, eWFvZ2FuZ0BjcXUuZWR1LmNu