 Mithul Naidu
 Ajit Bhosale2
 Sachin Salunkhe
 Robert Čep
 Emad Abouel Nasr
95% of researchers rate our articles as excellent or good
Learn more about the work of our research integrity team to safeguard the quality of each article we publish.
Find out more
ORIGINAL RESEARCH article
Front. Mater. , 06 February 2024
Sec. Polymeric and Composite Materials
Volume 11 - 2024 | https://doi.org/10.3389/fmats.2024.1348265
NAO brake friction materials with 4%, 5%, and 6% (w/v) sodium hydroxide treated hemp fiber reinforcement having 25% wt. fiber loading and fixed percentage of phenol formaldehyde resin content (20% wt.) along with other fillers have been studied and reported by the authors earlier. However, the effect of variations in the resin content on the tribological performance has been studied and reported in the present paper. Five variants were prepared with varying percentages of phenol formaldehyde resin from 12% wt. to 22% wt. with incremental steps of 2% wt, along with the optimum of 6% (w/v) sodium hydroxide treated hemp fibers and other fillers. The prepared test variants’ tribological characterization was done using Taguchi’s L25 orthogonal array on a pin-on-disc experimental setup, as per ASTM G99, at room temperature and compared with the best of the earlier studied friction composite. Fade and recovery tests of the best of the earlier studied and present ones were performed on a chase tribology tester per SAE J661 standards. The results revealed moderate coefficient of friction of 0.4496, lower wear rate of 0.57 gm, and better fade recovery for the HF25P20 variant compared to its counterparts studied here.
Brake pads are part of the brake system components along with the master cylinder, wheel cylinder, and hydraulic control system. Brake pads have attracted much research interest due to their nature and impact on the environment (Naidu et al., 2023). Binders, friction modifiers, fillers, and reinforcements are four categories of materials used in the manufacture of brake pads (Aranganathan and Bijwe, 2016; Ibukun Olabisi, 2016; Mutlu, 2009). Biomass from agricultural activities like vegetables, animal excrement, agricultural residue, leaves, stems, fruits, seeds, grasses, and reeds are trending materials for producing commercially accepted brake pads that are environmentally friendly. Palm kernel shells, bamboo, corn stalks, sugar cane bagasse, banana, cashew nut shell, coir (coconut shell), rice straw, pineapple, rice husks, hemp, etc. form the reinforcing agents. Friction modifiers or fillers in natural fibre friction materials (Joshi et al., 2023). The present authors prepared and investigated the properties of brake friction material with 4,5% and 6% (w/v) NaOH-treated hemp fiber reinforcements having 25% wt. fiber loading and with 20% wt. of phenol formaldehyde resin content, along with other fillers, in order to understand the effect of the variation in the concentration of sodium hydroxide (NaOH) on the tribological performance of 20% wt. phenol formaldehyde binder contained friction material (Naidu et al., 2023). The results revealed better properties for the friction material with 6% (w/v) NaOH-treated hemp fibers. However, to further understand the influence of gradual increment of the resin content between 10% and 20% wt., wherein results with 10% wt. were already available with the authors, the present paper focuses on studying the effect of phenol formaldehyde resin content variation on the 6% (w/v) NaOH-treated hemp fibers reinforced friction composite with similar filler contents. Five variants were prepared with varying percentages of phenol formaldehyde resin from 12% wt. to 22% wt. with incremental steps of 2% wt and 6% (w/v) NaOH-treated hemp fibers and other fillers. Tribological characterization of properties, namely, Specific Wear Rate (SWR) and Coefficient of Friction (COF) of the prepared test variants was done using a pin-on-disc experimental setup, as per ASTM G99, at room temperature and compared with the best of the earlier studied friction composite, namely, HF25P20 (earlier named HF6P20) having SWR of 3.5417 × 10⁻⁵ mm3/Nm and COF of 0.4496. Fade and recovery tests of the best of the earlier studied friction composite, namely, HF25P20 and the present one, were performed on a chase tribology tester as per SAE J661 standards. The results revealed moderate COF (within acceptable standard limits), lower wear rate, and better fade recovery for the HF25P20 variant compared to its counterparts studied here.
Hemp fibers were sourced from Hemp Affair Pvt. Ltd. in Varanasi and underwent a chemical treatment for 24 h using sodium hydroxide (NaOH) aqueous solution with a concentration of 6% (w/v). Following this treatment, they were thoroughly rinsed with distilled water and dried under sunlight for 10 h. The hemp fibers were cut into lengths ranging from 3 to 5 mm Table 1 displays the components’ proportions used in creating the test composites. These components include barium sulfate as a non-functional filler, hemp fibers for reinforcement, phenol-formaldehyde serving as a binder, graphite acting as a dry lubricant, and vermiculite and alumina serving as property modifiers (Naidu et al., 2023; Rajak et al., 2019; Singh et al., 2019). However, to understand the influence of gradual increment of the resin content between 10% and 20% wt., wherein 10% wt. results were already available with the authors; the increment of resin was done from 12% wt. onwards. Increment steps of 2% wt. was selected as it was understood that at least 2% wt. step was required to observe the influence of the resin variations on the tribological performance of the friction composites.
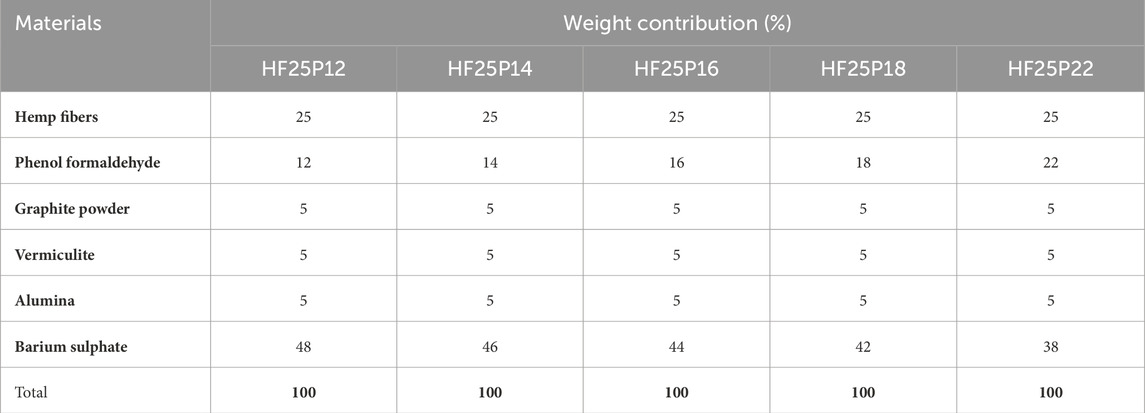
TABLE 1. Material composition.
Five compositions (variants) were developed using the ingredients shown in Table 1, HF25P12, with 12%wt. phenol formaldehyde (PF) resin, HF25P14–with 14%wt. PF resin, HF25P16–with 16%wt. PF resin, HF25P18–with 18%wt. PF resin and HF25P22–with 22%wt. PF resin. 6% (w/v) alkali pre-treated hemp fibers with 25%wt. fiber loading was used for all these compositions. The PF content compensated for the barium sulphate content. HF25P20 was already fabricated and tested in the authors’ earlier work (Naidu et al., 2023), which was then termed HF6P20; hence, it was not refabricated here.
All the components were meticulously measured using a digital scale (Wensar® et al.: 0–220 g, Least Count: 0.01 g). The chopped fibers and the phenolic powder formulations were subjected to a dry mixing process for 15 min at a rotational speed ranging from 250 to 500 revolutions per minute (rpm) using a mechanical stirrer to attain a uniform blend. Figure 1A illustrates that the mixtures were then subjected to compression in a compression molding machine (Manufacturer: Santec). The mixes were cured for 10 min, with four breathings of applied pressure at 15 MPa and a temperature of 155°C. For 3 h, a post-curing process was carried out in a hot air oven (Manufacturer: Athena Technology), as depicted in Figure 1B, at 170°C. This step was performed to eliminate moisture and release any trapped gases that may have formed during the polymerization process of the matrix constituents, thereby relieving induced compressive stresses (Singh et al., 2019).
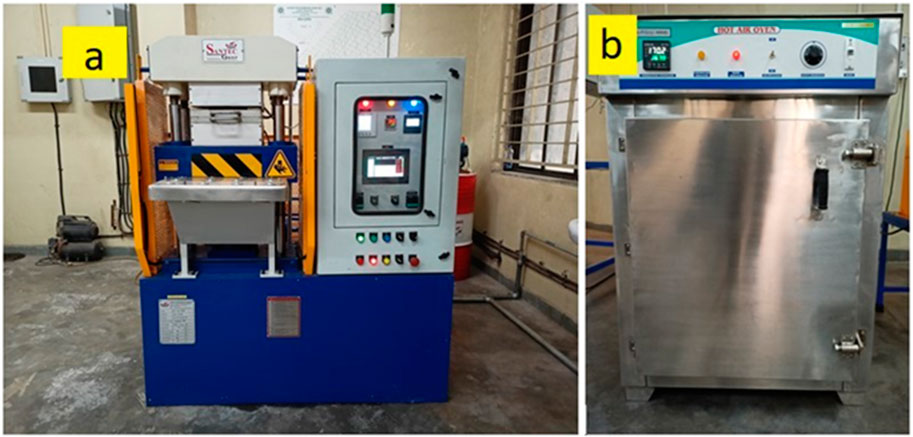
FIGURE 1. (A) Compression moulding machine (B) Hot air oven.
Plates of five different compositions, identified as HF25P12, HF25P14, HF25P16, HF25P18, and HF25P22, with dimensions measuring 100 × 100 × 10 mm in thickness, were fabricated utilizing the compression molding method. From each type of composition, specimens for conducting a pin-on-disc test by ASTM G 99 and a fade and recovery test as outlined in SAE J661 were extracted from these 100 × 100 × 10 mm plates. Three test specimens of each type were extracted. A sample of this is illustrated in Figure 2.

FIGURE 2. Sample specimen for pin on disc test.
Tribological properties, particularly specific wear rate (SWR) and coefficient of friction (COF) were analyzed using the Taguchi experiment design. Taguchi’s experiment design considers factors it terms as “signals,” which control the process response evaluated at different levels. Composition, normal (braking) load, and sliding velocity influenced SWR and COF. The values of the sliding velocities and the normal loads were decided from earlier literature (Rashid et al., 2017a; Shanmughasundaram, 2017). Table 2 shows the factors and levels selected for the friction composites.
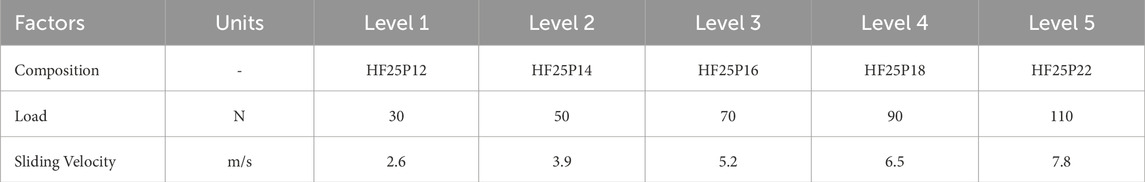
TABLE 2. Factors and levels.
To assess the tribological performance of SWR and COF of the prepared hemp/PF friction bio-composites at room temperature, they were tested on a pin-on-disc experimental setup (DUCOM™ TR-20LE) as per ASTM G 99 standards, as shown in Figure 3. A track diameter of 100 mm for a 5,000 m sliding distance was selected. The test trials were conducted per Taguchi L25 orthogonal array combinations, wherein three factors were evaluated for five levels, as shown in Table 2.
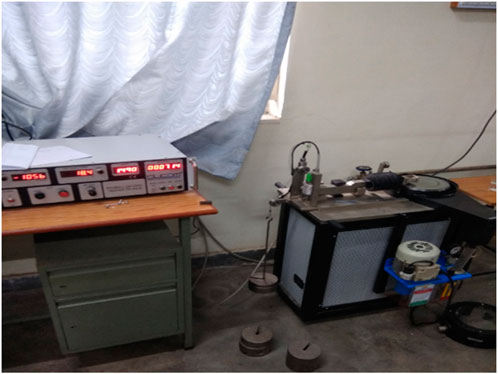
FIGURE 3. Pin-on-Disc Experimental setup.
Specifications of the pin-on disc setup used.
Make: DUCOM™ TR-20LE.
➢ Disc speed: 200rpm–2000rpm (in step of 1 rpm)
➢ Disc size: Dia.165 × 8 mm thick
➢ Disc material: J431 (22–24 HRC, ground to 1.6 Ra surface roughness)
➢ Normal load: 2 kg–20 kg (step of 0.5 kg by dead weights)
➢ Friction force: 0–200N (least count: 0.1N)
➢ Wear: 0–2000 microns (least count: 1 micron)
Mass loss arising from rubbing of the test specimens against the rotor of the pin-on disc setup was measured using an analytical weighing balance (Wenser make, model MAB 201) with an accuracy of 0.1 mg. The mass loss so obtained for three different test specimens of each type of composition were used to calculate their respective SWR using the relation (a).
Fade and recovery analysis of the composites performing better at room temperature amongst those investigated were done on a Chase dynamometer following SAE J661 standards at Indian Friction Material Engineering Company, Noida, India. A Chase dynamometer comprises a spinning drum with a 25.4-mm-square friction pad pressed against its inner circumference using an air pressure mechanism. A minor portion of the friction material contacts the drum to collect information regarding friction and wear (Akincioğlu et al., 2021).
Taguchi Design of Experiments (D.O.E.) was conducted with three factors - composition, load and sliding velocity, and each factor with five varying levels as shown in Table 2. L25 orthogonal array was suggested by Taguchi design of experiment method for three factors and five levels. The derived experiments were used for tribological testing on a Pin-on-Disc tribo-machine (as per ASTM G99) at room temperature. Subsequently, Specific Wear Rate (SWR) and Coefficient of Friction (COF) were obtained using the Eqs 1, 2 as shown below and analyzed using S/N ratios to decide the optimum parameters.
Where,
The SWR and COF values were transformed into Signal-to-Noise (S/N) ratios, with the goal of minimizing both of them, making use of the “Smaller is Better” quality characteristic. The formula for computing the corresponding S/N ratio is represented by Eq. 3 as shown.
Where, y = SWR or COF n = Number of trials.
The purpose is to compute the highest signal-to-noise ratio which means there are minimum random factors (noise) affecting the required parameters. The values of S/N ratios are tabulated in Table 3.
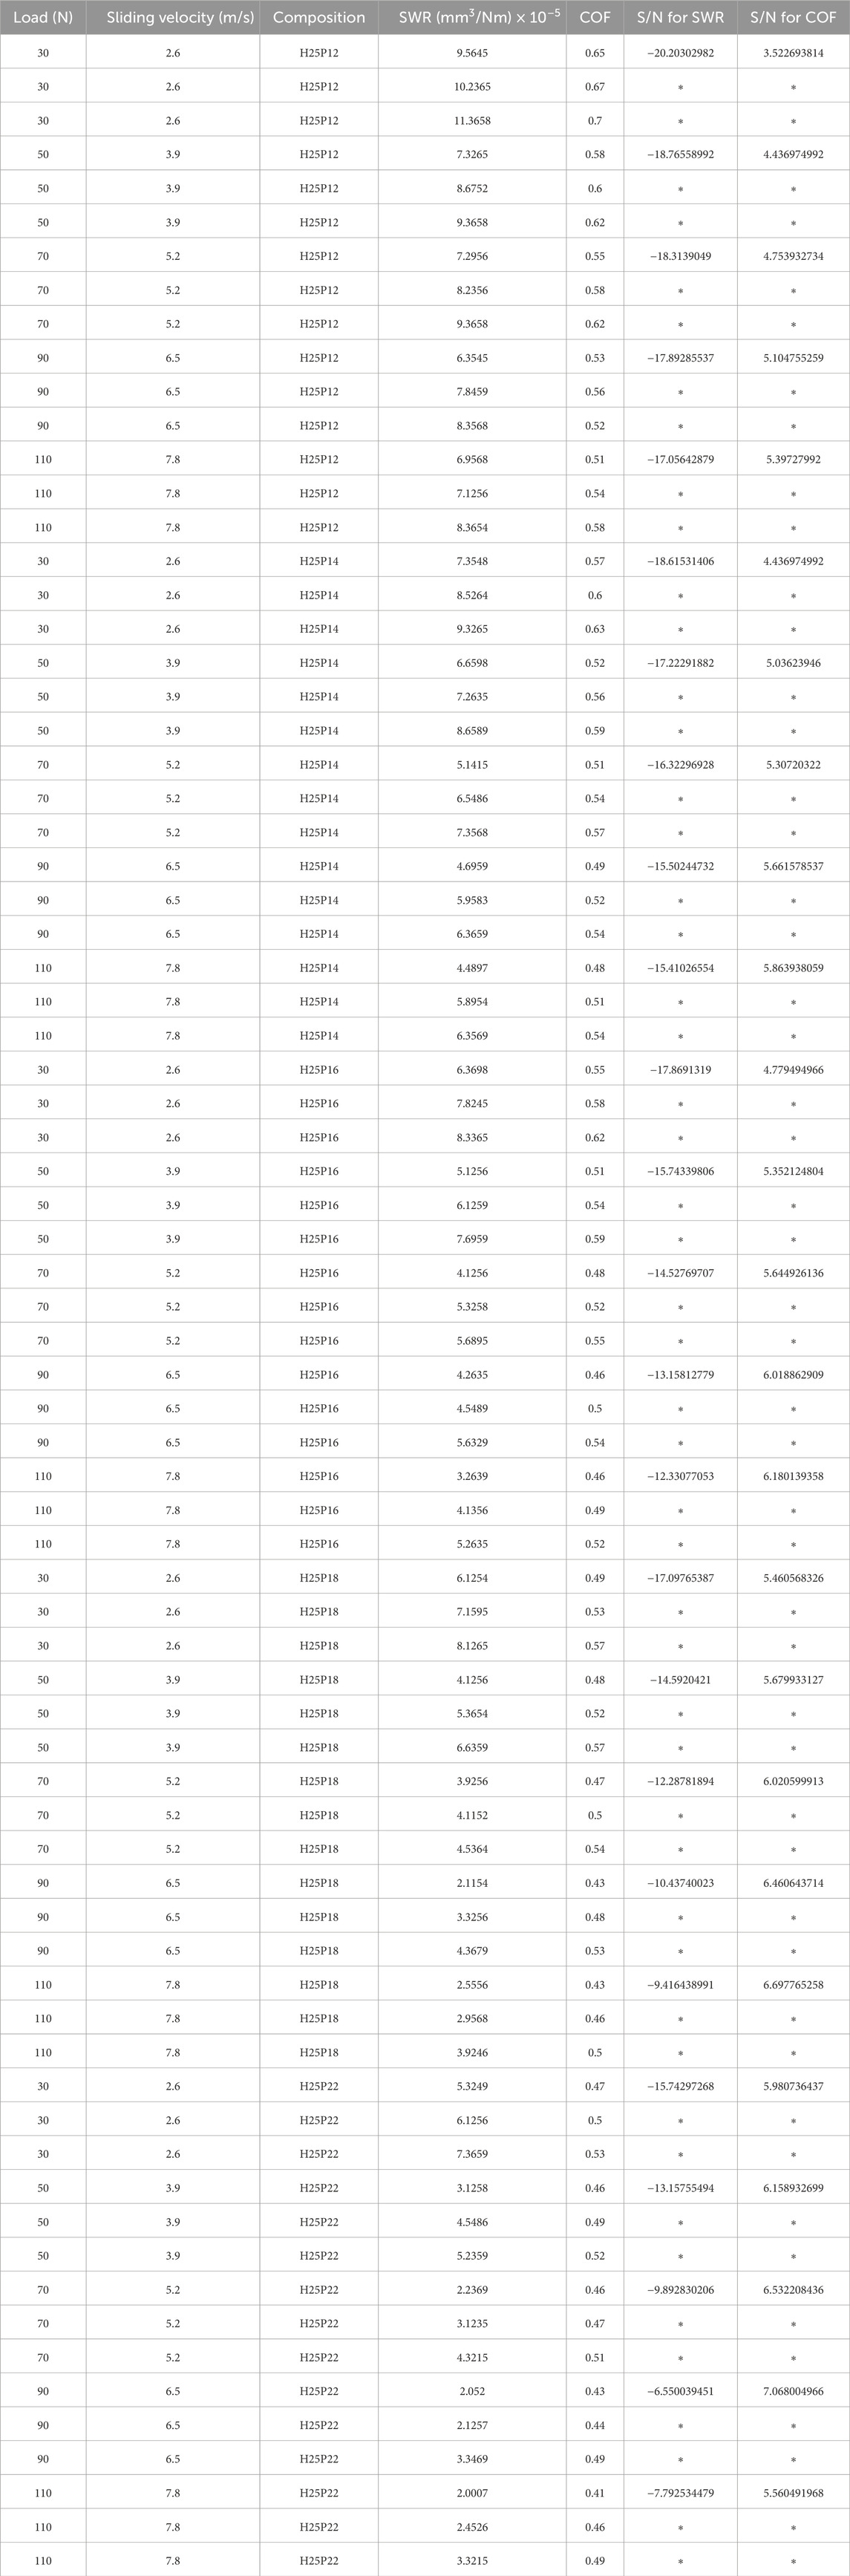
TABLE 3. Specific wear rate (SWR) and coefficient of friction (COF) using L25 orthogonal array with 3 replicates.
Variation of friction force with respect to time were recorded for all five compositions at 30 N, 50 N, 70 N, 90 N, and 110 N normal loads as shown in Figures 4A–E for HF25P12, HF25P14, HF25P16, HF25P18 and HF25P22 respectively.
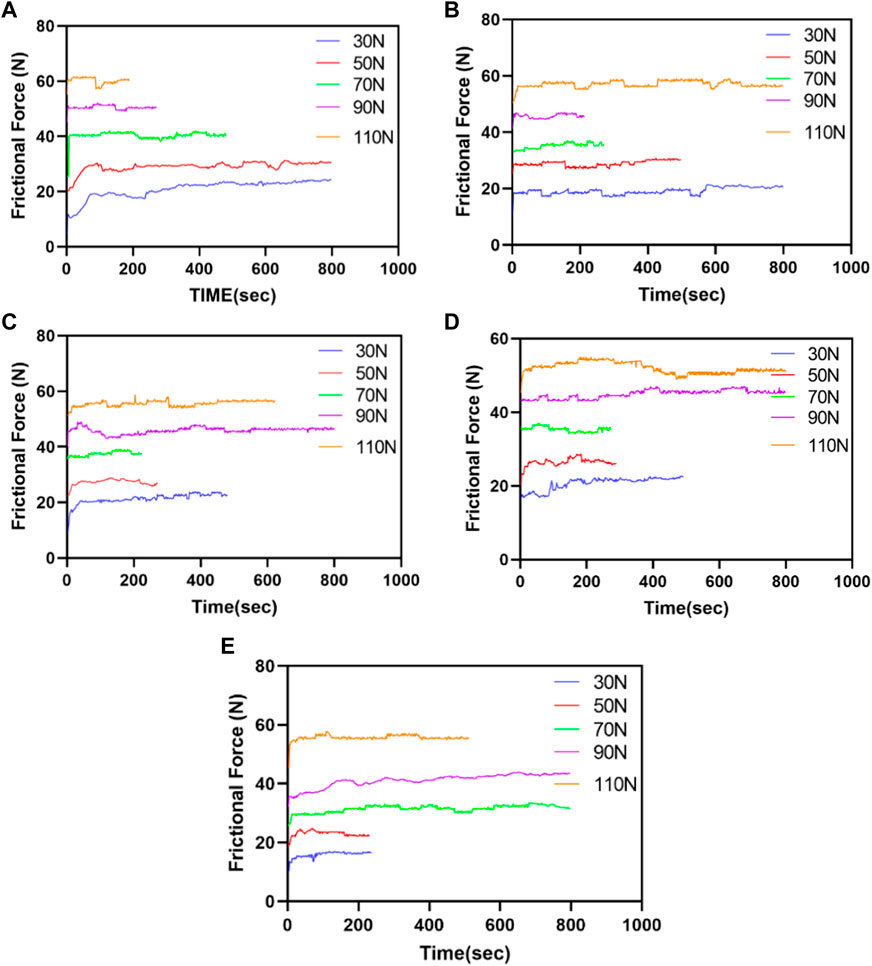
FIGURE 4. (A) Friction force v/s time for HF25P12. (B) Friction force v/s time for HF25P14. (C) Friction force v/s time for HF25P16. (D) Friction force v/s time for HF25P18. (E) Friction force v/s time for HF25P22.
The results typically showed two friction regimes, initially a running-in period followed by a steady-state period similar to those reported in earlier literature for sliding friction cases (Chand and Fahim, 2008). These regimes were due to the higher initial adhesive forces between the test materials and the metal rotor, followed by a steady state showing consistent friction forces concerning time for all three normal load conditions observed in HF25P12, HF25P14, HF25P16, HF25P18, and HF25P22 as shown in Figures 4A–E respectively. Friction force trends show a direct relation to the applied normal loads. As evident from these figures, friction forces increased with the increase in normal loads. Mean values of SWR and COF were plotted at five different load values: 30 N, 50 N, 70 N, 90 N, and 110 N, as shown in Figure 5, 6, respectively. The sliding velocity was not considered in this case because of its negligible influence on the response behavior, as shown in Tables 4, 5.
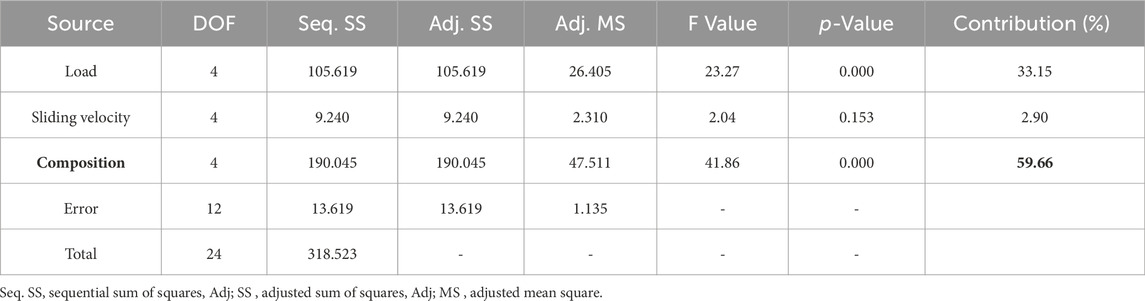
TABLE 4. ANOVA for S/N ratio of specific wear rate.
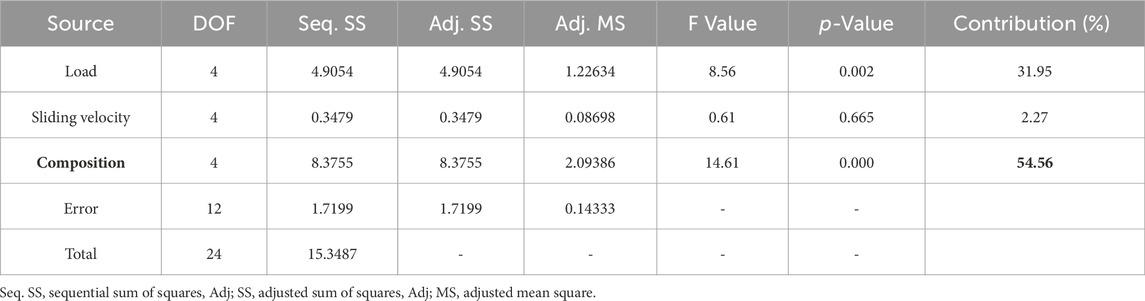
TABLE 5. ANOVA for S/N ratio of coefficient of friction.
Figure 5 shows higher Specific Wear Rate (SWR) values for HF25P12 followed successively by HF25P14, HF25P16, and HF25P18, and lowest for HF25P22. This might be due to an improved percentage in the phenol formaldehyde resin, as a result of which improved interfacial bonding between fibres and matrix might have formed (Chand and Fahim, 2008). The drop in the SWR with the rise in the normal load from 30 N to 110 N is expected, as seen for most of the compositions here. This is because, as per equation (a), SWR is inversely proportional to the normal load, and also, the wear type at the initial stage is likely to be adhesive type, which gradually changes to abrasive type with an increase in the asperity contact temperatures at the interface of the friction composites and the metal counter face (Karthikeyan et al., 2017). Further, it is observed that beyond 90 N load, SWR increases for HF25P22. This is attributed to the overloading of the phenol-formaldehyde resin content beyond the suggested range of 20–25%vol, which is approximately 20–21%wt. for phenolic resins, as suggested in the early reported literature (Blau, 2001).
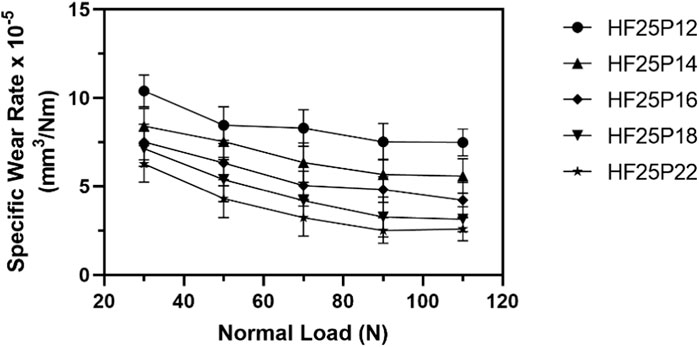
FIGURE 5. Variation of specific wear rate (SWR) with respect to normal load.
In Figure 6, COF values for HF25P12 are higher, followed successively by HF25P14, HF25P16, HF25P18, and lowest for HF25P22. Also, all five compositions show a decreasing trend with the increase in the normal load from 30 N to 110 N, following the mathematical relation shown in equation (b). This might be due to worn surface modification due to a transfer layer that might have formed on the friction surface. Also, the rise in asperity contact temperature at higher loads could be another possible reason for the drop in COF (Chand and Fahim, 2008). Amongst these compositions, HF25P22 shows lower and more stable values of COF up to 90 N, which might be due to a higher percentage of phenol formaldehyde resin making better fiber–matrix bonding compared to its counterparts studied here. However, beyond 90 N, a rise in the COF value is seen, which might be due to the overloading of the PF content beyond 20 %wt. as reported by earlier literature (Blau, 2001).

FIGURE 6. Variation of coefficient of friction (COF) with respect to normal load.
Analysis of variance (ANOVA) is a statistical process to acquire the contribution of composition, load, and velocity in the performance characteristics viz SWR and COF. Tables 4, 5 show the SWR and COF’s ANOVA results, respectively. The percentage contribution of factors is the ratio of the Sum of Squares of the factor to the total Sum of Squares. For SWR, composition plays the most significant role (59.66%), followed by normal load (33.15%) and finally by sliding velocity of the disc (2.90%).
Whereas for COF, composition has highest contribution (54.56%), followed by the normal load (31.95%) and lastly the sliding velocity (2.27%).
The optimum levels suggested by Taguchi’s optimum design for Specific Wear Rate and Coefficient of Friction factors were obtained from respective main effects plots for S/N ratios. Figure 7, 8 represent optimum factor levels for SWR and COF, respectively. Figure 7 shows the composition of HF25P22, an applied load of 110 N, and a sliding velocity of 5.2 m/s as the combination for optimum SWR. In contrast, Figure 8 shows the composition of HF25P22, an applied load of 90 N, and a sliding velocity of 7.8 m/s for optimum COF. These optimum factors have been tabulated in Table 6.
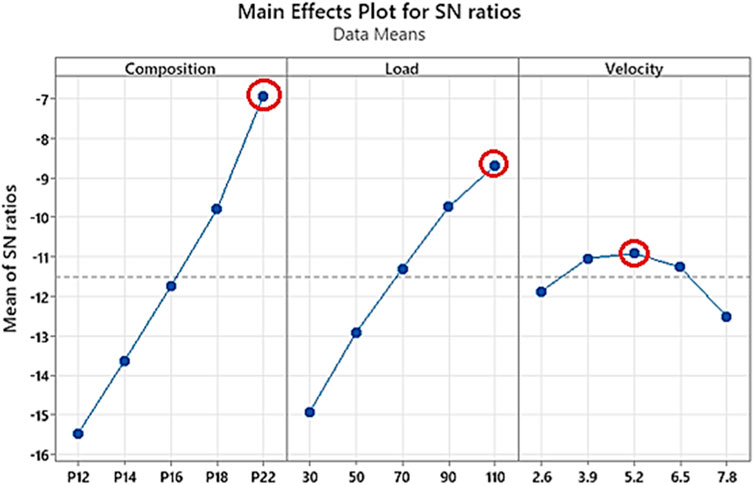
FIGURE 7. Main effects plot for SWR.
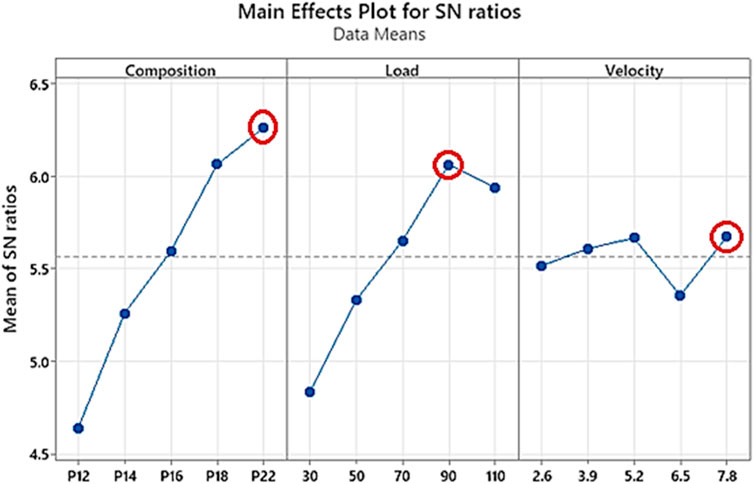
FIGURE 8. Main effects plot for COF.
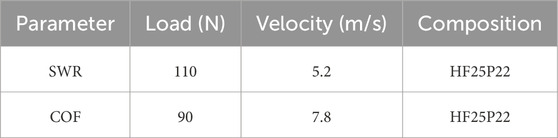
TABLE 6. Optimum factors as per main effect plots for S/N ratio.
The Taguchi method predicted optimum SWR and COF values, as shown in Figure 7 and 8, and regression Eqs 4, 5 were experimentally verified and tabulated, as shown in Table 7. The values predicted using the Eqs 4, 5 showed close agreement with those of the actual (experimental) values of SWR and COF, which were found to be within the acceptable limit of 10% error and hence valid.

TABLE 7. Experimental validation of optimum factors.
Table 8 shows optimum results of SWR and COF of the earlier prepared HF25P20 (HF6P20) studied in author’s earlier work (Naidu et al., 2023) with those of the currently prepared HF25P22.
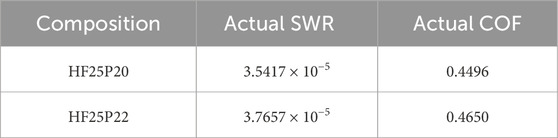
TABLE 8. Comparison of optimized actual SWR and COF.
Table 8 shows the comparison of the actual optimized SWR and COF values as suggested by Taguchi design optimization, which reveals the fact that the values of COF for HF25P20 is comparable to that of HF25P22, but its SWR is less than that of the later.
Micrographs of the worn surfaces of the test specimens viz. HF25P12, HF25P14, HF25P16, HF25P18, and HF25P22 subjected to the Pin-on-Disc setup under a peak load of 110 N were captured using a Scanning Electron Microscope (Zeiss et al. 15). The wear mechanism of polymer matrix composites can be described by different modes such as fiber pullouts, fiber-matrix de-bonding, matrix debris formation, matrix crack and contact plateau formation.
Figure 9 shows the micrograph of HF25P12 where discontinuous transfer layers, a considerable amount of wear particles, wear debris, and some fiber pullout were observed. This might be due to poor fiber-matrix bonding due to a lower percentage of phenol formaldehyde resin of 12%wt. Thus providing lower wettability to the 25% wt. Hemp fibers. This might have led to a higher SWR, as shown in Figure 5. Also, coherent transfer layers and smaller primary contact plateaus might have led to higher levels of COF, which is evident in Figure 6 (Rashid et al., 2017b).
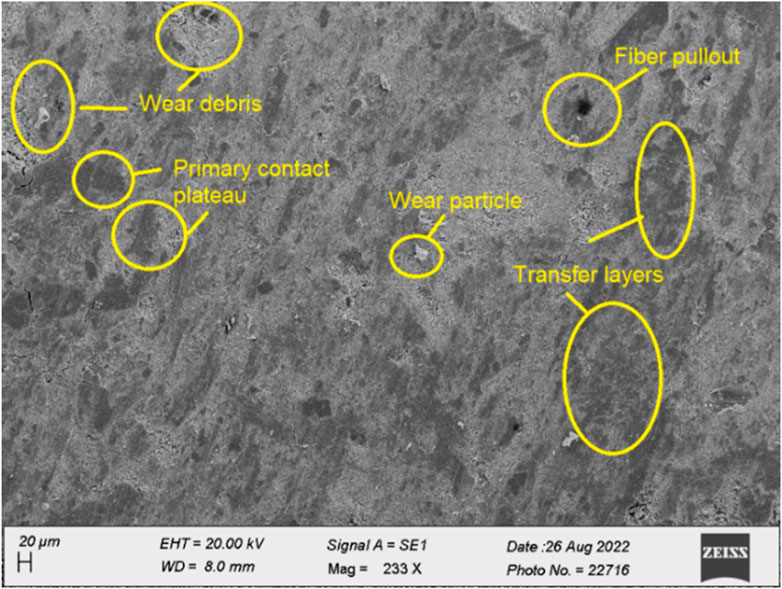
FIGURE 9. Worn surface micrograph of HF25P12.
Figure 10 shows the micrograph of HF25P14, where larger and more consistent transfer layers were observed due to better matrix compaction. This might be due to the improved content of the phenol-formaldehyde resin of 14%wt. Compared to the earlier 12%wt. in H25P12, which is evident in Figures 5, 6. The consistent transfer layers kept the COF values lower than HF25P12 but higher than those of the remaining counterparts. Also, the SWR of HF25P14 is lower than HF25P12 due to better fiber-matrix bonding compared to HF25P12. SWR is higher than the rest of the formulations, possibly due to larger secondary contact plateaus, as seen in the micrograph. Some particle pull-out was also seen (Chand and Fahim, 2008).
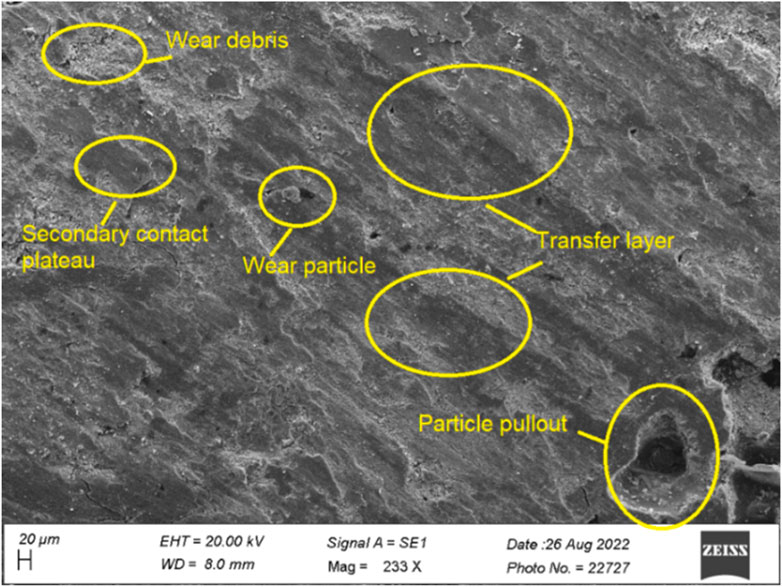
FIGURE 10. Worn surface micrograph of HF25P14.
Figures 11, 12 shows the micrographs of HF25P16 and HF25P18, respectively. The micrograph of HF25P16 shows a significant amount of large secondary contact plateaus compared to that of HF25P18, indicating better compaction of the matrix in HF25P18 than in HF25P16. This might be due to the improved phenol formaldehyde resin content from 16% wt. to 18% wt. A significant amount of large secondary contact plateaus might be the reason for higher SWR in HF25P16 compared to that of HF25P18, as seen in Figure 5 (Chand and Fahim, 2008). The SWR of HF25P16 is lower than that of HF25P14, which might also be due to the considerable difference in the number of secondary contact plateaus between them. Consistent transfer layers and prominent primary contact plateaus are seen in HF25P18 as compared to HF25P16, which might have kept the COF of HF25P18 at lower values than HF25P16 and thus also in comparison to the earlier formulations studied here, as seen in Figure 6 (Rashid et al., 2017b). Matrix de-bonding was also seen in some instances due to mechanical vibrations.
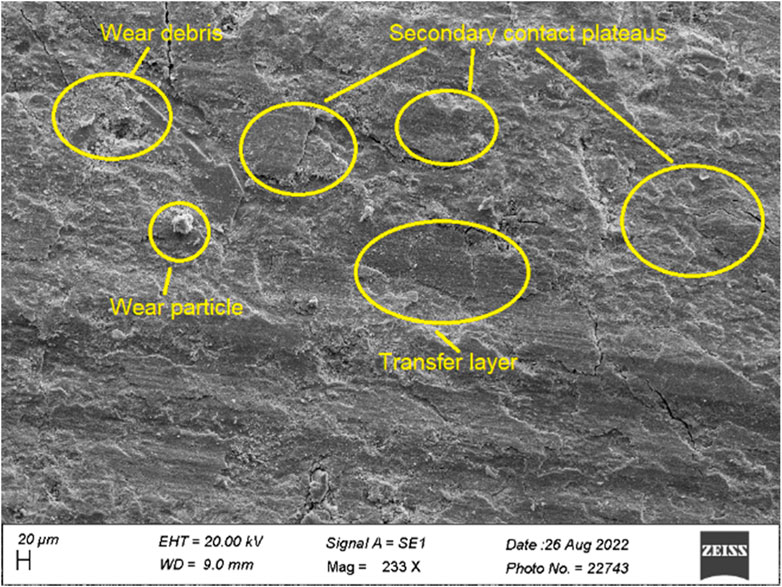
FIGURE 11. Worn surface micrograp of HF25P16.
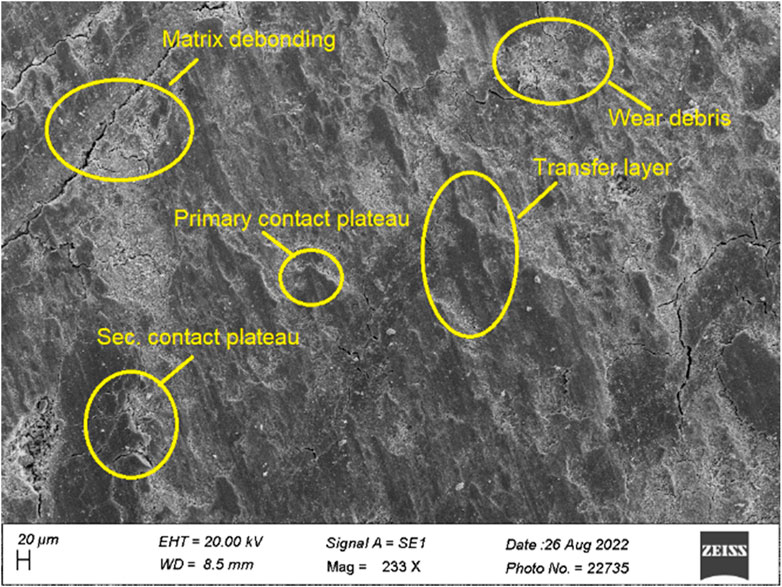
FIGURE 12. Worn surface micrograph of HF25P18.
Figure 13 shows the worn surface micrograph of HF25P22, wherein prominent but inconsistent primary contact plateaus were observed. The secondary contact plateaus were also prominent. The SWR of HF25P22 was lower than that of all its earlier counterparts studied here, as shown in Figure 5; this might be due to the improvement in the phenol-formaldehyde resin content. However, the SWR rose from 90 N to 110 N normal load, which might be due to the excess of its phenol-formaldehyde content. This is confirmed by the micrograph shown in Figure 13, in which considerable zones of wear debris and loose wear particles can be seen at 110 N load. Prominent but discontinuous transfer layers also led to a rise in the COF beyond 90 N, as shown in Figure 6.
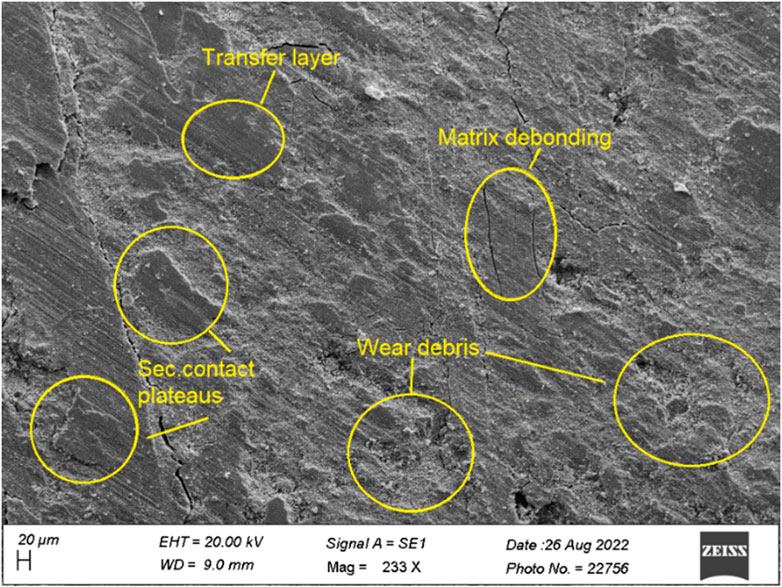
FIGURE 13. Worn surface micrograph of HF25P22.
Brake friction material performance can be classified into three categories: cold performance, which refers to its effectiveness at room temperature before braking; fade performance, which assesses its performance at elevated temperatures during braking; and recovery performance, which evaluates how it performs at lower temperatures after braking, influenced by the cooling effect. Minimum material loss (specific wear rate), moderate coefficient of friction, and higher recovery rate are significant and vital factors for an ideal brake material (Akincioğlu et al., 2021). The cold performance of the prepared compositions has already been discussed in the earlier sections of this paper. This section discusses the fade and recovery analysis of two better-performing hemp/PF friction bio composites investigated at room temperature, HF25P20, and HF25P22, out of those investigated and discussed in the earlier sections. The fade and recovery analysis was done on a chase dynamometer per SAE J661 standards. The purpose of this SAE recommended practice is to establish a uniform laboratory procedure for securing and reporting the friction and wear characteristics of brake linings. The performance data obtained can be used for in-plant quality control by brake lining manufacturers and for the quality assessment of incoming shipments by the purchasers of brake linings The test samples of 25.4 mm × 25.4 mm × 6 mm thickness, suggested by SAE J661, are held in the sample holder, which rubs against the steel drum of the chase dynamometer, as shown in Figure 14. Furthermore, Figures 15A–G, 16A–G reveal the fade and recovery performances of HF25P20 and HF25P22, respectively.
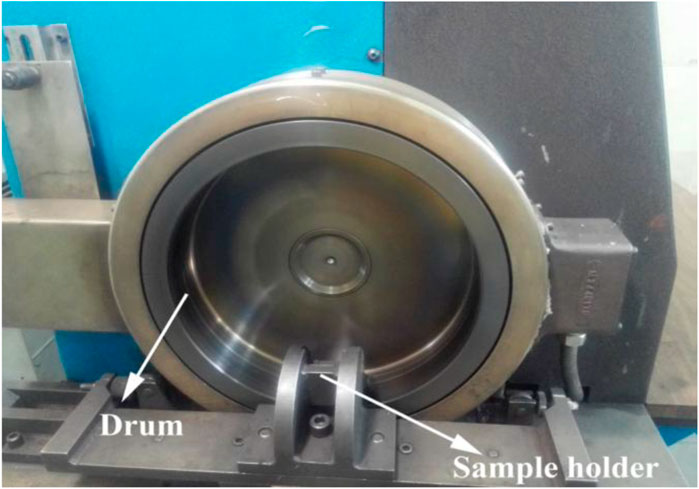
FIGURE 14. Chase dynamometer Drum and sample holder (Akramifard and Ghasemi, 2016).
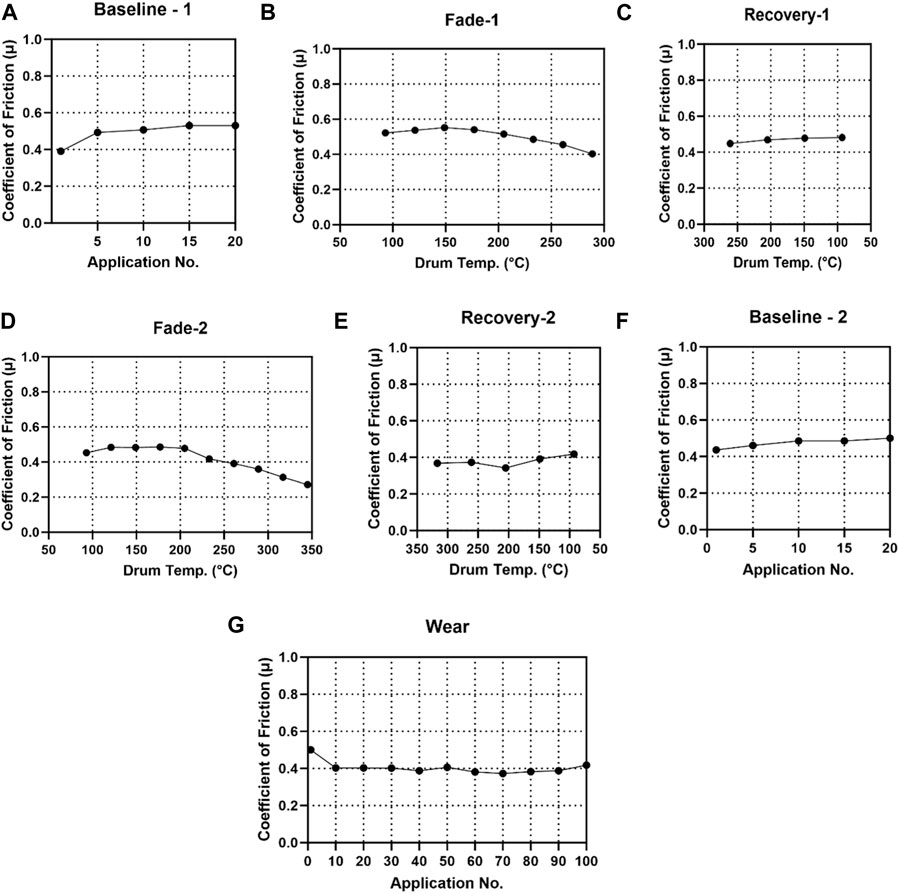
FIGURE 15. (A–G) Fade recovery performance of HF25P20 friction composite.
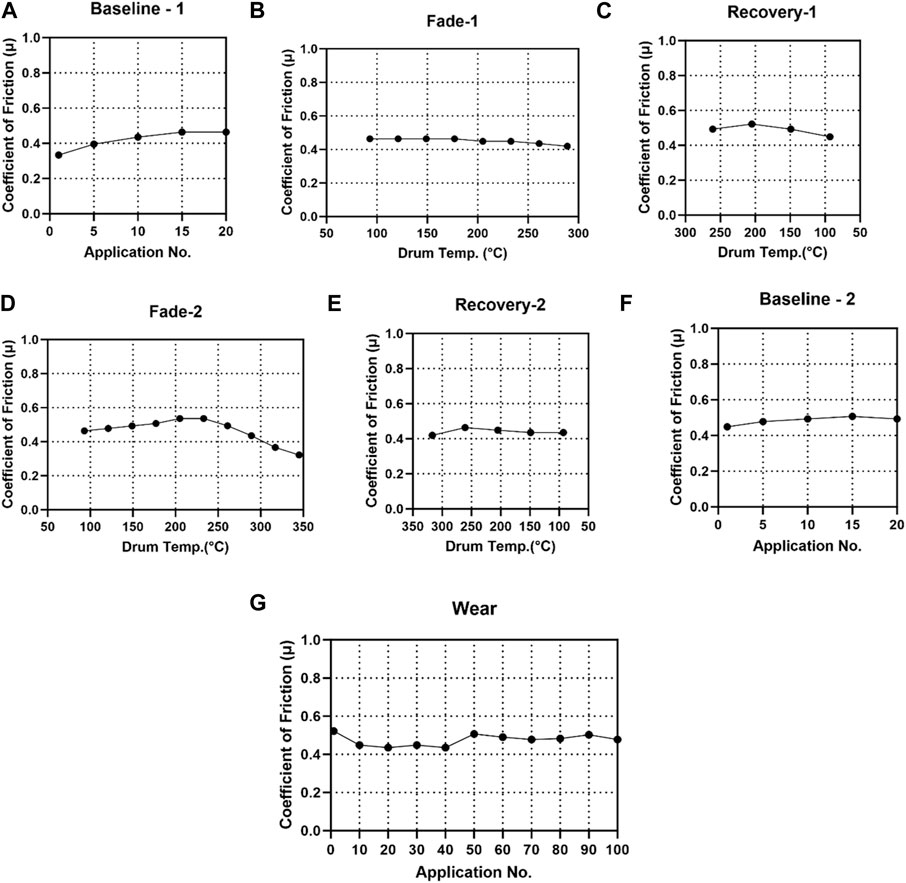
FIGURE 16. (A–G) Fade recovery performance of HF25P22 friction composite.
Figures 15A–G, 16A–G illustrate a wear test of seven steps suggested by the SAE J661 standard for analyzing the fade and recovery performance of HF25P20 and HF25P22, respectively. Initially, the friction coefficient of the brake pad was assessed in a baseline test involving 20 pedaling cycles. During the first fade stage, the brake pad’s friction coefficient was automatically measured, allowing for the evaluation of its sensitivity to temperature variations. Both the brake friction materials, viz. HF25P20 and HF25P22 showed a decline in the friction coefficient during this stage, which can be attributed to the disintegration of the binder (Elzayady and Elsoeudy, 2021). Notably, the first baseline and first fade stages demonstrated friction coefficients within the standard range of 0.35–0.55 for both the composites above. The first recovery stage is crucial as it involves stabilizing the temperature and assessing the friction coefficient as it cools down. This stage is essential for ensuring the brake pad can regain its previous frictional performance. During this stage, HF25P20 successfully recovered its previous friction coefficient, which remained within the standard range, as shown in Figure 15C. In contrast, it was the first recovery performance of HF25P22, which showed a decline in the recovery curve, as evident in Figure 16C. Following the initial three stages, the wear behavior was assessed over 100 pedaling cycles at a relatively constant temperature. As depicted in Figure 15G and 16G, the friction coefficient during the wear stage remained within the standard definition range, similar to the other stages. The first three stages were repeated to confirm both brake pads’ friction and wear properties: a second baseline, a second fade, and a second recovery. Subsequently, the sample was weighed again, resulting in a loss of mass of 0.57 gm. out of an initial 4.710 gm. for HF25P20 and 0.66 gm. out of an initial 4.810 gm for HF25P22. Thus, the wear rate of HF25P22 was greater than HF25P20 by 1.62%. According to SAE J661 standards, a brake pad’s mass loss after undergoing seven wear stages should be below 1.230 g, which both HF25P20 and HF25P22 have obeyed. HF25P20 received a classification of “GG” because the recorded normal and hot friction coefficient values were 0.474 and 0.451, respectively, and HF25P22 received a classification of “GG,” as the recorded normal and hot friction coefficient values were 0.493 and 0.452, as automatically recorded by the friction machine. The brake friction pads for commercial vehicles with good friction at high and low temperatures usually belong to the “FF” classification and above (Akramifard and Ghasemi, 2016).
Five different formulations were created, each containing varying percentages of phenol formaldehyde resin, ranging from 12% wt. to 22% wt. in 2% wt. Increments. The friction, wear, and fade-recovery performance of the best of the presently formulated friction composite, namely, HF25P22, in comparison to the author’s earlier best-reported HF25P20 (HF6P20) friction composite, reveals the following:
• The SWR at room temperature of HF25P20 is less than that of HF25P22 by nearly 6%. A lower SWR is usually desired for any good friction material.
• The actual (optimized) COF of HF25P20 and HF25P22 at room temperature are 0.4496 and 0.4650, respectively, which are in line with those during the fade and recovery stages of the same, respectively and also within the recommended limits of 0.3–0.5 for commercial vehicles as per SAE J661 standards.
• The fade recovery of HF25P20 is better than that of HF25P22.
• HF25P20 and HF25P22 have been rated with the “GG” friction material by SAE J661 standards, which are suitable for commercial automotive applications.
• Thus, the brake friction composite, namely, HF25P20, which was investigated and reported by the authors earlier as HF6P20, still proved to be a better-performing brake friction material than all its counterparts, which are studied and reported in the present exploration.
This study thus shows confirmation to earlier reported percentage of phenol formaldehyde resin content (Blau, 2001) (20%–21% wt.) which is also true for hemp (natural) fibre reinforced brake friction materials.
However, future explorations on the use of natural resins like starch, proteins, natural gums, etc. as binders in friction materials needs attention, in order to provide still better greener alternatives to existing commercial brake friction materials.
The original contributions presented in the study are included in the article/Supplementary material, further inquiries can be directed to the corresponding authors.
MN: Conceptualization, Data curation, Methodology, Project administration, Resources, Writing–original draft, Writing–review and editing. AB: Formal Analysis, Investigation, Methodology, Project administration, Resources, Supervision, Writing–review and editing. MG: Data curation, Formal Analysis, Investigation, Project administration, Resources, Writing–review and editing. SS: Investigation, Project administration, Supervision, Visualization, Writing–review and editing. RC: Investigation, Methodology, Project administration, Resources, Writing–review and editing. EA: Data curation, Funding acquisition, Investigation, Project administration, Resources, Writing–review and editing.
The author(s) declare financial support was received for the research, authorship, and/or publication of this article. The authors also thank King Saud University for funding this work through Researchers Supporting Project number (RSP2024R164), King Saud University, Riyadh, Saudi Arabia.
The authors express their thanks to MKSSS’s Cummins College of Engineering for Women, Pune, for providing their composite material processing facility of Composite Material Laboratory Sponsored by AICTE MODROB Scheme (9-166/RFID/MODROB/Policy-1/2017-18) for this work. The authors thank King Saud University for funding this work through the Researchers Supporting Project number (RSP2024R164), King Saud University, Riyadh, Saudi Arabia.
The authors declare that the research was conducted in the absence of any commercial or financial relationships that could be construed as a potential conflict of interest.
All claims expressed in this article are solely those of the authors and do not necessarily represent those of their affiliated organizations, or those of the publisher, the editors and the reviewers. Any product that may be evaluated in this article, or claim that may be made by its manufacturer, is not guaranteed or endorsed by the publisher.
Akincioğlu, G., Akincioğlu, S., Öktem, H., and Uygur, İ. (2021). Brake pad performance characteristic assessment methods. Int. J. Automot. Sci. Technol. 5 (1), 67–78. doi:10.30939/ijastech.848266
Akramifard, H., and Ghasemi, Z. (2016). Friction and wear properties of a new semi-metallic brake pad according to SAE J 661: a case study in parslent complex (Iran). Int. J. New Technol. Res. 2 (3), 263573.
Aranganathan, N., and Bijwe, J. (2016). Development of copper-free eco-friendly brake-friction material using novel ingredients. Wear 352–353, 79–91. doi:10.1016/j.wear.2016.01.023
Blau, P. J. (2001). Compositions, functions, and testing of friction brake materials and their additives. Energy 27, 38.
Chand, N., and Fahim, M. (2008). Tribology of natural fiber polymer composites. Sawston, United Kingdom: Woodhead publishing limited. doi:10.1533/9781845695057
Elzayady, N., and Elsoeudy, R. (2021). Microstructure and wear mechanisms investigation on the brake pad. J. Mater. Res. Technol. 11, 2314–2335. doi:10.1016/j.jmrt.2021.02.045
Ibukun Olabisi, A. (2016). Development and assessment of composite brake pad using pulverized cocoa beans shells filler. Int. J. Mater. Sci. Appl. 5 (2), 66. doi:10.11648/j.ijmsa.20160502.16
Joshi, A. G., Bharath, K. N., and Basavarajappa, S. (2023). Recent progress in the research on natural composite brake pads: a comprehensive review. Tribol. - Mater. Surfaces Interfaces 17, 237–259. doi:10.1080/17515831.2023.2237810
Karthikeyan, S., Rajini, N., Jawaid, M., Winowlin Jappes, J., Thariq, M., Siengchin, S., et al. (2017). A review on tribological properties of natural fiber based sustainable hybrid composite. Proc. Institution Mech. Eng. Part J J. Eng. Tribol. 231 (12), 1616–1634. doi:10.1177/1350650117705261
Mutlu, I. (2009). Investigation of tribological properties of brake pads by using rice straw and rice husk dust. J. Appl. Sci. 9 (2), 377–381. doi:10.3923/jas.2009.377.381
Naidu, M., Bhosale, A., Munde, Y., Salunkhe, S., and Hussein, H. M. A. (2023). Wear and friction analysis of brake pad material using natural hemp fibers. Polym. (Basel) 15 (1), 188. doi:10.3390/polym15010188
Rajak, D. K., Pagar, D. D., Kumar, R., and Pruncu, C. I. (2019). Recent progress of reinforcement materials: a comprehensive overview of composite materials. J. Mater. Res. Technol. 8 (6), 6354–6374. doi:10.1016/j.jmrt.2019.09.068
Rashid, B., Leman, Z., Jawaid, M., Ghazali, M. J., Ishak, M. R., and Abdelgnei, M. A. (2017a). Dry sliding wear behavior of untreated and treated sugar palm fiber filled phenolic composites using factorial technique. Wear 380 (381), 26–35. doi:10.1016/j.wear.2017.03.011
Rashid, B., Leman, Z., Jawaid, M., Ishak, M. R., and Al-Oqla, F. M. (2017b). Eco-Friendly composites for brake pads from agro waste: a review. Encycl. Mater. Compos., 209–228. doi:10.1016/b978-0-12-803581-8.10159-6
Shanmughasundaram, P. (2017). Effect of temperature, load and sliding velocity on the wear behavior of AA7075-SIC composites. Mech. Mech. Eng. 21 (1), 85–93.
Keywords: hemp fibers, phenol formaldehyde, fade-recovery, anova, Taguchi, Scanning electron microscopy
Citation: Naidu M, Bhosale A, Gaikwad M, Salunkhe S, Čep R and Abouel Nasr E (2024) Tribological investigations of hemp reinforced NAO brake friction polymer composites with varying percentage of resin loading. Front. Mater. 11:1348265. doi: 10.3389/fmats.2024.1348265
Received: 02 December 2023; Accepted: 11 January 2024;
Published: 06 February 2024.
Edited by:
Natrayan L, Saveetha University, IndiaReviewed by:
Jitendra Kumar Katiyar, SRM Institute of Science and Technology, IndiaCopyright © 2024 Naidu, Bhosale, Gaikwad, Salunkhe, Čep and Abouel Nasr. This is an open-access article distributed under the terms of the Creative Commons Attribution License (CC BY). The use, distribution or reproduction in other forums is permitted, provided the original author(s) and the copyright owner(s) are credited and that the original publication in this journal is cited, in accordance with accepted academic practice. No use, distribution or reproduction is permitted which does not comply with these terms.
*Correspondence: Mithul Naidu, bWpuMjk3OUBnbWFpbC5jb20=
Disclaimer: All claims expressed in this article are solely those of the authors and do not necessarily represent those of their affiliated organizations, or those of the publisher, the editors and the reviewers. Any product that may be evaluated in this article or claim that may be made by its manufacturer is not guaranteed or endorsed by the publisher.
Research integrity at Frontiers
Learn more about the work of our research integrity team to safeguard the quality of each article we publish.