 Xiang Lyu
 Wenjun Li2
- 1China Construction Second Engineering Bureau Ltd., Beijing, China
- 2The Department of Bridge Engineering, Tongji University, Shanghai, China
- 3The Civil Engineering Group of China Construction Second Engineering Bureau LTD., Beijing, China
New types of fibers such as basalt fibers are gradually being used to reinforce cement-based concrete materials. To provide a basis for the further popularization of basalt fibers and basalt fiber reinforced reactive powder concrete (BFRPC) materials, the bending mechanical properties and fracture properties of BFRPC beams were investigated by innovatively applying four-point bending test and multiple acoustic parameter analysis methods. On the one hand, the load vs. displacement curve and crack pattern of reinforcement BFRPC beam were obtained from the four-point bending test. On the other hand, Acoustic emission (AE) technology was used to monitor the cracking process of reinforcement BFRPC beam under four-point bending load, and the AE signal was analyzed to illustrate the cracking characteristics of reinforcement BFRPC beam. The results revealed that AE hits, amplitude, counts, duration, and energy have a similar changing trend with bending load. Cumulative hits and cumulative energy are positively linearly related to the displacement and quadratically related to the sum of crack widths, and the correlation coefficients are all above 0.95. Besides, the cracking process of reinforcement BFRPC beam can be divided into four stages by the variation of AE basic parameters with bending load. The main rebars yielding is an important turning point of the crack characteristic of reinforcement BFRPC beam. AE signal data varies greatly in different locations, and it has an obvious advantage to detect the formation of invisible cracks. The results of predicting concrete damage and cracking by AE signal data are consistent with the experimental phenomenon. The low-stress brittle fracture caused by tensile fracture was reduced, and the tensile resistance and flexural bearing capacity of the reinforcement BFRPC beam were increased. The results obtained in this paper support the damage assessment and structural health monitoring for cement base concrete materials under bending load.
1 Introduction
Basalt fiber reactive powder concrete (BFRPC) is a new type of cement-based concrete material with excellent mechanical properties and durability (Li et al., 2020). This is partly because reactive powder concrete (RPC) is prepared by the theory of densified particle packing (Chen et al., 2019; Zdeb, 2019; Sultan and Alyaseri, 2020). RPC replaces the coarse aggregate in ordinary concrete with millimeter-level aggregate (quartz sand) and filled the gap between millimeter-level aggregate with micron particles (cement) and submicron particles (silica fume) (Merdas and Shallal, 2023; Zhang et al., 2023). In this way, the internal defects of concrete are controlled, and both the density and homogeneity are improved. Another reason is that basalt fiber has superior mechanical properties and has good resistance to all kinds of acid and alkaline conditions (Lou et al., 2021; Si et al., 2021). Basalt fiber improves the mechanical properties and durability of RPC (Liu et al., 2020a; Liu et al., 2020b). Based on these obvious advantages, BFRPC has been considered suitable for concrete beam structural materials. On the basis of previous studies on the properties of BFRPC materials, it is very important to study the flexural cracking performance of BFRPC beam structures for their popularization and application. Concrete cracking greatly deteriorates the mechanical properties and durability of reinforcement BFRPC beams, so it is of great significance to evaluate the cracking characteristics to promote the application of BFRPC materials in practical structural engineering. The cracking characteristics of concrete beams are mainly evaluated by crack-related indexes, such as cracking moment, crack propagation, crack spacing, crack width, and so on (Rashid et al., 2020; Li et al., 2021a). However, it is difficult to monitor and evaluate the whole cracking and damage process of concrete beams only by traditional measurements and naked-eye observation, especially concrete beam internal cracking and damage assessment at a low-stress level.
Acoustic emission (AE) is a non-destructive detection tool with the advantages of high sensitivity (Boniface et al., 2020; Zhang et al., 2020; Karimian and Modarres, 2021). Depending on its high efficiency, convenience and accuracy, it has been widely used in cracking and damage assessment of building materials and engineering structures (Dubuc et al., 2020; Fan et al., 2020; Li. et al., 2021b; Mohammadi et al., 2021; Tan et al., 2021). Han et al. (2019) used AE technology to clarify the concrete damage mechanism and proved that the analysis of AE signals was effective in the identification of concrete damage. Xargay et al. (2018) analyzed the concrete damage process under heat-exposure conditions based on AE technology and confirmed the potential of AE technology in the diagnosis of concrete damage levels. Nguyen-Tat et al. (2018) verified the strong correlation between the damage evolution of concrete and the AE activity. Farhidzadeh et al. (2013) monitored the fracture process of concrete construction and illustrated that AE was very effective in determining structural safety. Xargay et al. (2021) used four AE indexes (load ratio, calm ratio, cumulative signal strength ratio, and relaxation ratio) to evaluate the damage of steel fiber reinforced concrete beams; and the test results showed that AE damage indexes have a quite good correlation with cracking initiation and propagation, and AE damage indexes can not only monitor the loading response of reinforced concrete beam but also detect local damage. Li et al. (2018) described the cracking modes of steel fiber reinforced concrete through AE parameters such as average frequency (AF), rise angle (RA) value, and found that the failure of ordinary concrete was mainly caused by tensile cracks. Zhang et al. (2019) used AE technology to perform a laboratory study focus on the bending characteristics of the ordinary RC beam affected by steel corrosion, and described the ordinary concrete cracking process, and determined the cracking modes by the b-value and AF-RA association value analysis method, respectively. Therefore, it is advanced and effective to describe the cracking characteristics of reinforcement BFRPC beams by AE parameters such as b-value and AF-RA association value, etc.
In this paper, three reinforcement BFRPC beams with different reinforcement ratios were prepared, and the beams were subjected to a four-point bending test by graded loading. The load vs. displacement curve and crack pattern of reinforcement BFRPC beam were recorded. At the same time, AE technology was used to monitor the AE signal of reinforcement BFRPC beams during the loading process. Besides, the parameters of the AE signal were analyzed to elucidate the damage process and cracking characteristics. The purpose of this paper is to elaborate the cracking characteristics of the new composite material (reinforcement BFRPC beam), which can provide a theoretical basis for the application of reinforcement BFRPC and provide a reference for the damage assessment of cementitious concrete materials under bending loads.
2 Experimental details
2.1 Materials and mixture
Materials required for reinforcement BFRPC beams include quartz sand, quartz powder, cement, silica ash, water reducer, basalt fiber, water, and rebars. The quartz sand has a hardness of 7 and is mainly composed of SiO2. The quartz sand specifications used in this paper were 20–40, 40–80, 80–120 mesh, and they were filtered by a square hole sieve of 0.6, 0.3 and 0.15 mm respectively. The mixture proportions for the reinforcement BFRPC beam are listed in Table 1. According to the laboratory test, the compressive strength and flexural strength of BFRPC prepared by the mix proportions as shown in Table 1 are 110 and 15 MPa respectively. The basic characteristics of basalt fiber are shown in Table 2.

TABLE 1. Mix proportions of reinforcement BFRPC beam (kg/m3).

TABLE 2. Basic properties of basalt fibers.
2.2 Specimen preparation
In this paper, three reinforcement BFRPC beams with different reinforcement ratios were prepared, and the designed size was 1500 mm ✕ 150 mm ✕ 300 mm. Figure 1 shows the dimensions of three test beams and the relative positions of the rebars. The types and diameters of erective steel bars, stirrups, and main rebars of each test beam are shown in Table 3. In each test beam, two HPB300 steel bars with a diameter of 6 mm were used as erecting steel bars; ten HPB300 steel bars with a diameter of 8 mm were used as stirrups; two HRB335 rebars with a diameter of 12, 14, and 16 mm respectively were used as the main rebars.
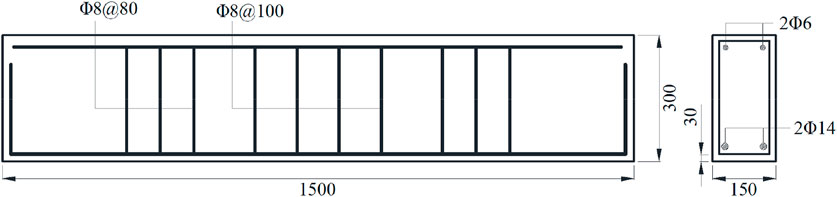
FIGURE 1. Dimension of the specimen (mm).
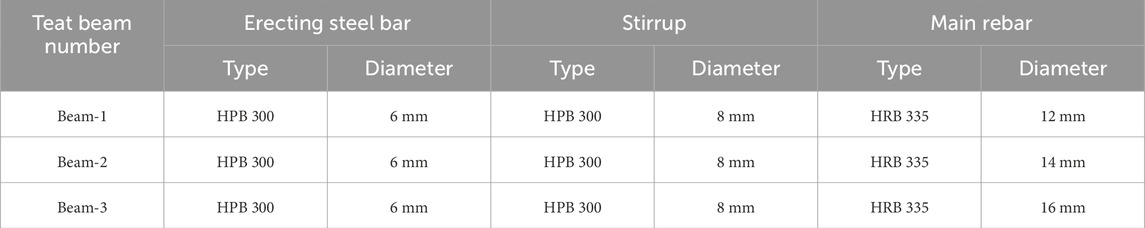
TABLE 3. Types and diameters of steel bars in test beams.
2.3 Experimental procedure
The experimental flow chart is shown in Figure 2. The prepared test beams firstly underwent curing. The reinforcement BFRPC beams were cured in 90°C steam for 48 h. After curing, all the test beams were performed the four-point bending test; the load vs. displacement curves, cracking patterns, and crack widths of the test beams were measured and recorded. During the bending load process, concurrently, the AE test was conducted for obtaining the AE signals. The parameters including hits, energy, b-value from AE signals were used for analyzing the damage process and the cracking characteristics from the mesoscale.
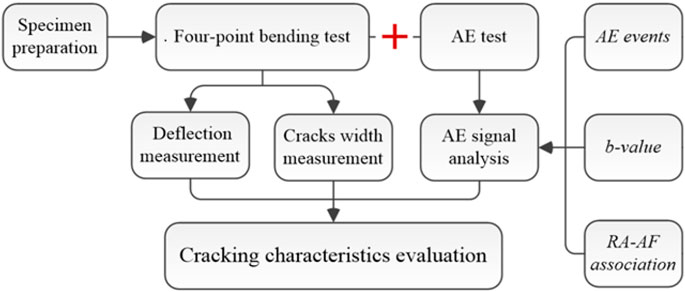
FIGURE 2. Experimental flow chart.
2.4 Experimental setups
This paper carries out concrete beam stress tests based on Chinese standards (Ministry of Housing and Urban-Rural Development of the People’s Republic of China, 2012). A WAW-1000 kN type electro-hydraulic servo universal testing machine was utilized to perform the four-point bending test for the beams. The dial gauges were arranged at the bottom of the 1/2 and 1/4 span of the beams for recording the displacement during the loading process. Simultaneously, the crack width could be tested by the crack testing instrument and the crack pattern was plotted. The measurement accuracy of crack width is 0.01 mm. The AE test was performed simultaneously with the bending test for obtaining AE signals. Four SR150M type AE sensors (produced by Soundwel Technology Co., Ltd., Beijing, China) were attached to the side of test beams by epoxy resin adhesive. Loading device of four-point bending tests and the arrangement of AE sensors are schematically shown in Figure 3. The test loading adopted a multi-step loading process (20 kN for each step), and the loading rate was controlled to be 0.037 kN/s.
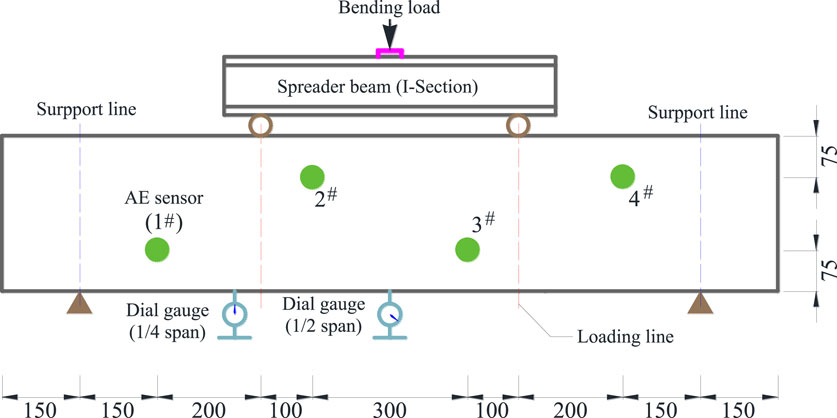
FIGURE 3. Sketch of the experimental setup for the four-point bending test (unit: mm).
The measurement frequency range of the AE sensor was 60–400 kHz. AE sampling frequency was 5 MSPS. The AE signal amplitude threshold was set to 40 dB to filter the environmental noise. To ensure the accuracy of the AE signal, the peak definition time was set at 50 μs, and the hit definition and lock time were set at 150 and 300 μs respectively. The experimental setups are shown in Figure 4.
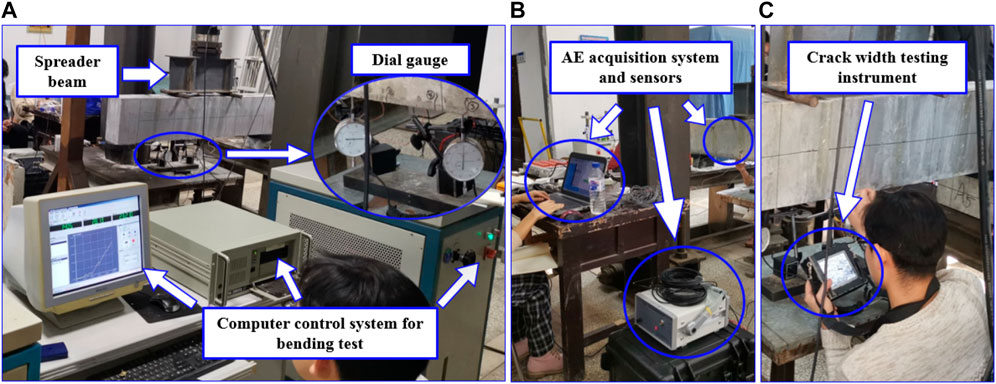
FIGURE 4. Experimental setups. (A) Four-point bending test; (B) AE test; (C) Crack width test.
3 Analysis methods
3.1 AE basic parameters
The elastic wave generated by the crack initiation inside the reinforcement BFRPC beam is transmitted to the surface of the AE sensor to be converted into an electrical signal, which is processed and calculated into a signal parameter by the analytical system and characterised as a digitised AE waveform, so that structural changes inside the concrete can be explored through the changes in acoustic emission signal parameters. The basic parameters (shown in Figure 5) of the AE signal include hit, count, amplitude, duration, rise time, energy, and so on.
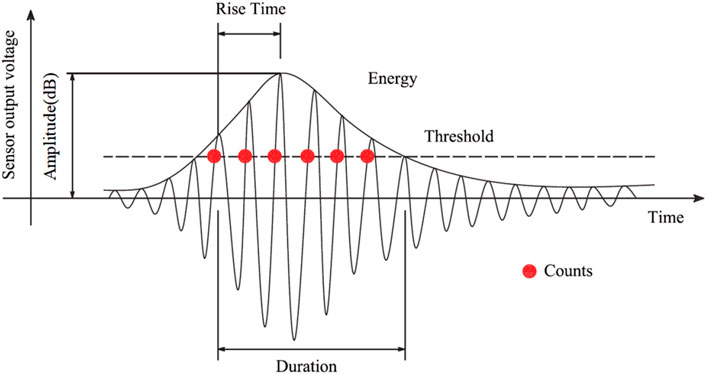
FIGURE 5. AE characteristic parameters.
The hit is a signal that exceeds the threshold and causes a system channel to accumulate data. In Figure 5, one waveform corresponds to one “hit”. Signal amplitude is the sensor output peak voltage, which is the indicator of signal size. Signal count, also known as signal ringing count, is the times that the AE amplitude exceeds the threshold in the duration. The rise time is the time interval between the signal trigger time and the peak amplitude time. And the duration is the time interval between the signal trigger time and the signal disappearance time. Signal energy is defined as the measured area below the AE signal envelope.
3.2 b-value analysis
The b-value analysis method, first applied for analyzing seismic waves, is famous for its advantages in quantifying the distribution of earthquake magnitude. In the past decades, the b-value analysis method was successfully imported into the AE signals analysis field due to the waves in AE were similar to the earthquake (Jiao et al., 2019). The b-value can be calculated as follows:
where
3.3 AF value and RA value
Both RA and AF values are the statistical parameters of AE signals. AF-RA association analysis, as a statistical parameter-based method, was widely used to classify the cracking modes in concrete in the past few years. The RA and AF values can be calculated by the following equations:
Ohtsu et al. (2010) demonstrated that AE signals could be divided into the tensile signals and shear signals, which corresponded to the occurrence of tensile cracks and shear cracks in concrete respectively. Figure 6 shows the schematic of the crack modes classification based on the AF-RA association analysis method. When a tensile crack occurs, the amplitude of the signal wave is large, the rising time is short, and the wave velocity is fast, which is reflected in a large AF value and a small RA value. On the contrary, when a shear crack occurs, the wave velocity of the signal wave is low, the rise time and duration are long, which is reflected in a large RA value and a small AF value.
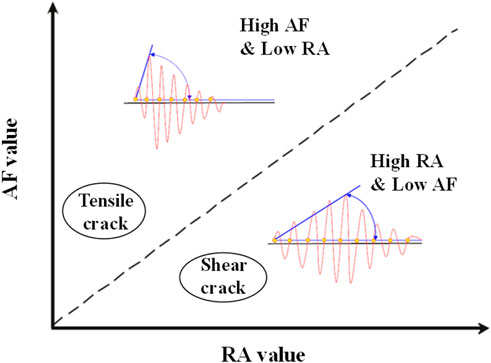
FIGURE 6. Cracking modes classification based on AF-RA association values.
4 Results and discussion
4.1 Load vs. displacement curve
The load vs. displacement curve of three reinforcement BFRPC simply supported beams are shown in Figure 7, and the load vs. displacement curve can be roughly divided into three stages according to the test beam imminent cracking point and the main rebars yielding point. The first stage is before the test beam cracking; the second stage is from the test beam imminent cracking to the main rebars yielding, and the third stage is from the main rebars yielding to the test beam failure.
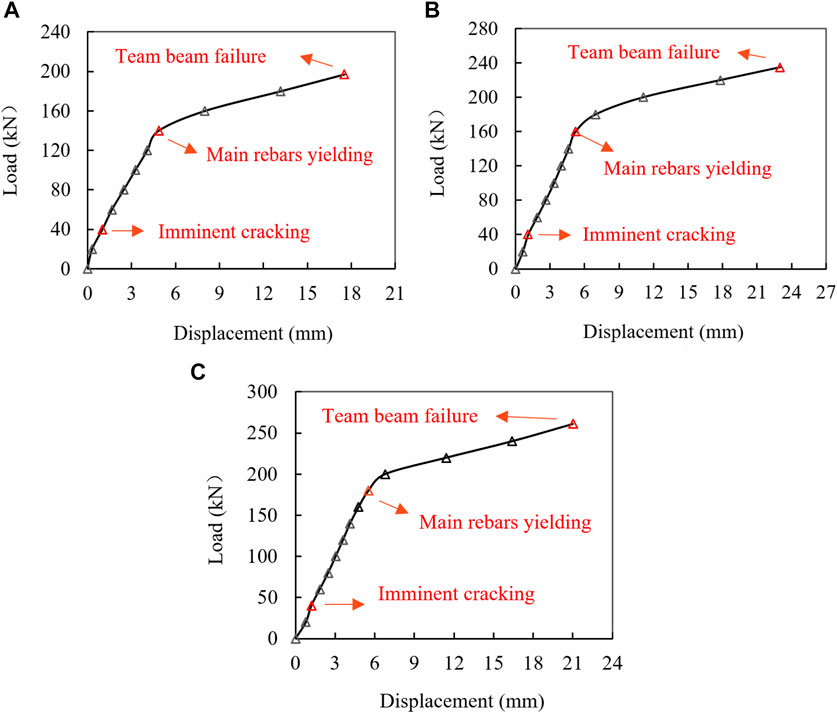
FIGURE 7. Displacement of the test beams. (A) Beam-1; (B) Beam-2; (C) Beam-3.
Besides, the slopes of the load vs. displacement curve in the first and second stage are the same, while the slope of load vs. displacement curve in the third stage is significantly lower than that in the first and second stages, indicating that reinforcement BFRPC beams have a good ductility after the main rebars yielding. When the bending loads of Beam-1, Beam-2, and Beam-3 reached 40 kN, it can be seen from the test phenomenon that subtle cracks gradually appear on the bottom of the test beams. Therefore, the cracking bending load value of Beam-1, Beam-2, and Beam-3 is 40 kN. Moreover, it can be seen from Figure 7 that the main rebars yielding load values of Beam-1, Beam-2, and Beam-3 are 140 kN, 160 kN, and 180 kN, respectively. And the failure load values of Beam-1, Beam-2, and Beam-3 are 197 kN, 235 kN, and 261 kN, respectively. It is shown that within the range of reinforcement ratio of suitable reinforcement beam, the main rebars yielding load and failure load of the reinforcement BFRPC simply supported beam increase gradually with the increasing of reinforcement ratio.
4.2 Crack pattern
To better describe the cracks propagation, at the end of each loading stage, the testers mapped the crack pattern on the side of the test beam and measured the maximum width of each crack. When the test beam was loaded to 180 kN, the deformation of reinforcement BFRPC beams increased significantly. In order to avoid the damage of the test beam to the test personnel, the crack width of the test beam with the load exceeding 180 kN was not measured. When the bending load was less than 40 kN, there were almost no visible cracks can be checked on the surface of the test beam, while when the load was more than 40 kN, many subtle cracks began to appear at the bottom of the pure bending section of the test beams. Representative crack patterns (Figure 8) with the bending load values of 60, 100, 140, and 180 kN are presented to understand the crack propagation of each test beam in detail.

FIGURE 8. The crack pattern of the test beam. (A) Beam-1; (B) Beam-2; (C) Beam-3.
As shown in Figure 8, Beam-1, Beam-2, and Beam-3 have similar crack patterns under the bending load. When the load reached 60 kN, fine visible cracks were first generated in the pure bending section of the test beam. As the bending load step reached 100 kN, the cracks in the pure bending section of the test beam gradually extended to the top of the beam, while the new cracks began to appear in the shear bending section. As the bending load step reached 140 kN, the cracks in the pure bending section of the test beam extended vertically to the middle part of the beam side, while the cracks in the shear bending section began to extend to the middle part of the beam side toward the loading point. At the load step of 180 kN, the cracks of the test beam continued to form through cracks. As the bending load exceeded 180 kN, the crack width of the bottom part of the beam increased significantly, and an obvious crackling sound could be heard.
Simultaneously, the crack widths at each loading step were measured by the crack width tester. As shown in Figure 9, the sum of crack widths at each loading step of all test beams increases with bending load. After main rebars yielding, the sum of crack widths of all the reinforcement BFRPC beams increased significantly, and the failure process of test beams accelerated.
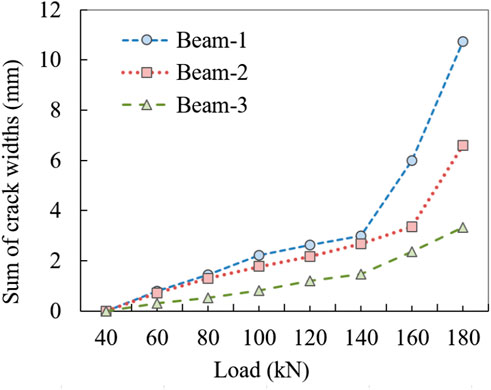
FIGURE 9. The variation of the sum of crack width with bending load.
4.3 AE basic parameters analysis
4.3.1 AE basic parameters
In this section, the AE basic parameters were utilized to describe the craking characteristics of the reinforcement BFRPC beam. Figure 10 taking Beam-3 as an example, AE signals were used to analyze the variation of AE basic parameters with bending load. The units of AE basic parameters are different. To make a comparative analysis in the unified coordinate system, each AE basic parameter should be homogenized.
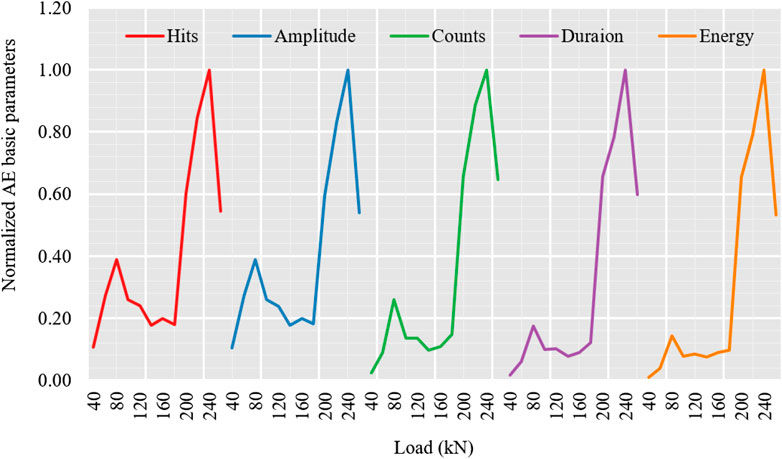
FIGURE 10. The normalized AE basic parameters of the Beam-3.
It can be seen from Figure 10 that the hits and amplitude have a similar variation with bending load, while the counts, duration, and energy have a consistent variation with bending load. Thus, for a clearer and more detailed analysis, the hits and energy parameters were selected to analyze the damage process of the reinforcement BFRPC beam with bending load in Figures 11, 12.
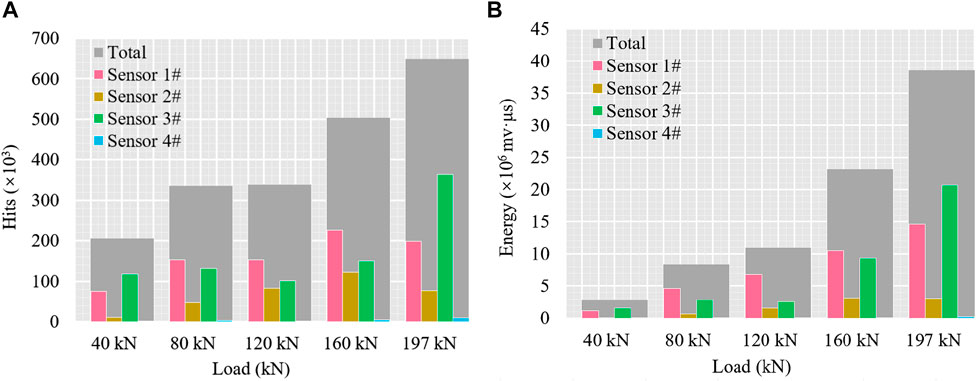
FIGURE 11. Hits and energy collected from different AE sensors of Beam-1 during different load stages. (A) Hits; (B) Energy.
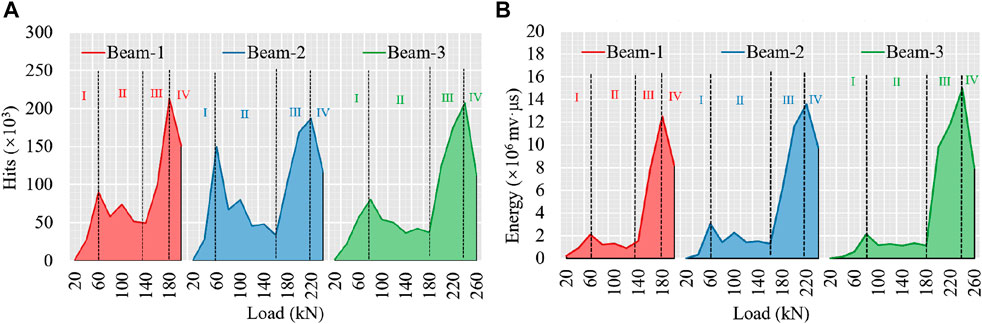
FIGURE 12. Hits and energy collected by different test beams at different load stages. (A) Hits; (B) Energy.
As can be seen from Figure 11, the total hits and total energy gradually increase with bending load, which indicates that the damage degree of the test beam gradually increased with the bending load. It is especially noteworthy that the AE basic parameters (hits and energy) have an excellent monitoring effect on the initial damage of the test beam. When the bending load reached 40 kN, no visible cracks appeared on the surface of the test beam, while the hits value is larger and the energy value is small, this phenomenon shows that many microcracks formed in the test beam. During the bending load of 80–120 kN, the hits value has a small increase, but the energy value has a significant increase, indicating that the trend of new crack initiation was weakened, the trends of original microcrack propagation and macrocrack formation were increased at this stage, and the test beam entered the stage of microcrack propagation and macrocrack formation. After the bending load reached 120 kN, the hits value and energy value both increase significantly, indicating that there were both new crack initiation and macrocrack formation inside the test beam at this stage, and the test beam entered the critical failure stage. Moreover, it can be seen from the AE sensors at different positions in Figure 11 that the AE hits and energy values collected by sensor 1# and sensor 3# which near the bottom of the test beam are more than that collected by sensor 2# and sensor 4# which near the top of the test beam. Compared with sensor 1# (located in the shear bending section) and sensor 3# (located in the pure bending section), the hits and energy of sensor 1# are greater than that of sensor 3# when the load reached 40 kN and 197 kN. This phenomenon infers that at the beginning and the end of bending load action, the pure bending section of the reinforcement BFRPC beam was more prone to damage, while the shear bending section of the reinforcement BFRPC beam was more prone to damage at the middle of bending load process.
From Figure 12, the variation of the hits and energy for reinforcement BFRPC beams with bending load can be roughly divided into four stages. In the first stage, before visible cracks appeared in the bottom of the test beam (the bending load arrived at almost 60 kN), the hits and energy increased with bending load, and the damage of the reinforcement BFRPC beam was mainly caused by microcracks initiation. The second stage was from the appearance of visible cracks to the main rebars yielding (the bending load from 60 kN to 160 kN). In this stage, the hits and energy show a downward trend, and the damage of the reinforcement BFRPC beam was mainly caused by macrocrack formation. In the third stage, from the main rebars yielding to the formation of critical failure cracks, the hits and energy increased sharply, and a large number of macrocracks formed and gradually expanded into critical failure cracks. The fourth stage was the failure stage, the hits and energy were greatly reduced, and the critical failure crack propagation led to the beam failure.
4.3.2 Cumulative AE characteristic parameters
Taking Beam-3 sensor 3# as an example, cumulative AE parameters were homogenized, and the variation of cumulative AE parameters with bending load was compared and analyzed for evaluating the cracking process of the test beams. As can be seen from Figure 13, cumulative AE parameters have similar variation patterns; and thus in this section, the cumulative hits and cumulative energy are selected to focus on the detailed variation of cumulative AE parameters, as shown in Figure 14.
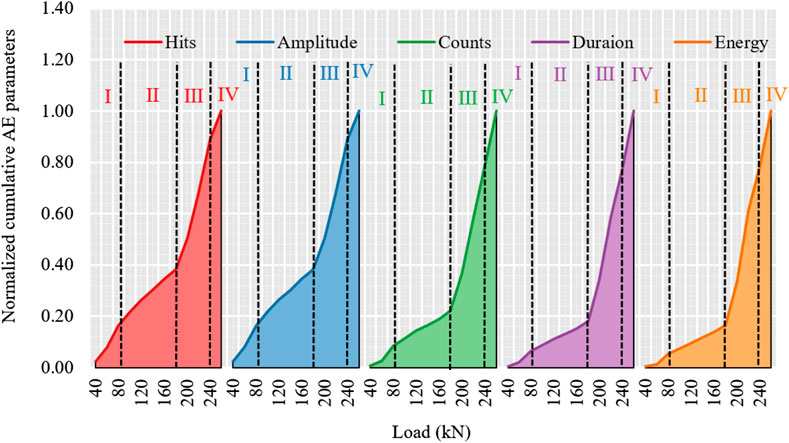
FIGURE 13. The normalized AE basic parameters of the Beam-3.
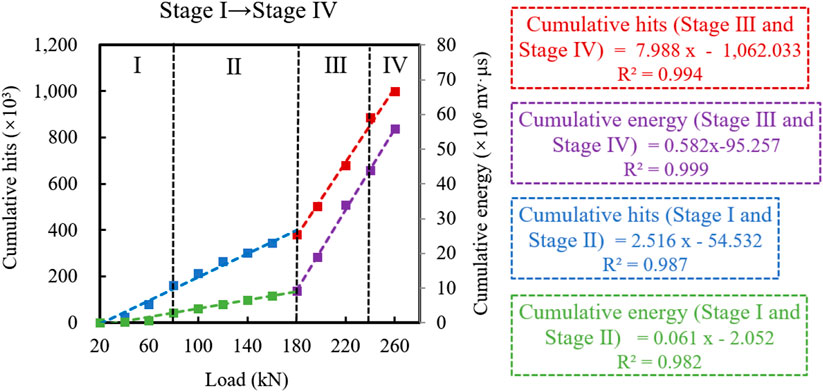
FIGURE 14. The variations of cumulative hits and cumulative energy with bending load.
In Figure 14, as the same discussed above, the cumulative hits and cumulative energy can be also divided into four stages. It can be seen that the cumulative hits and cumulative energy are positively linearly correlated with bending load in the four stages, and the correlation coefficients are all above 0.95. Additionally, the slope of the fitting line of stage Ⅰ is the same as stage ⅠⅠ, and the slope of the fitting line of stage ⅠⅠⅠ is the same as stage ⅠV. This phenomenon illustrates that the damage rate of the reinforcement BFRPC beam is relatively stable before and after the main rebars yielding point, and the damage rate after the main rebar yielding is significantly higher than that before the main rebar yielding.
To analyze the relationship between cumulative AE parameters and mechanical property parameters of reinforcement BFRPC beam, the relationship between cumulative AE parameters and displacement as well as the relationship between cumulative AE parameters and the sum of crack widths were fitted by stages in Figure 15. It can be seen from Figure 15 that the cumulative AE parameters are positively linearly correlated with the displacement and quadratically correlated with the sum of crack widths, and the correlation coefficients are all above 0.95. Deformation behaviour of reinforcement BFRPC beams and crack propagation can be assessed by monitoring the AE parameters and analysing their cumulative parameters.
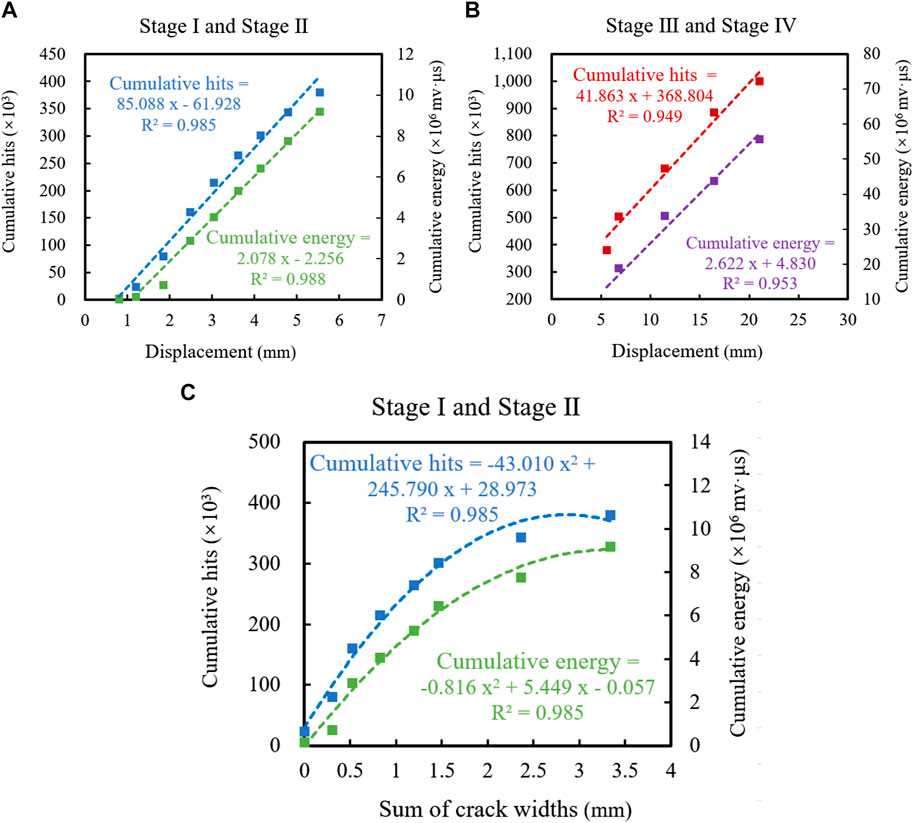
FIGURE 15. Relationship between cumulative AE parameters and mechanical property parameters. (A) Displacement in stage Ⅰ and stage Ⅱ; (B) Displacement in stage Ⅲ and stage Ⅳ; (C) Sum of crack widths in stage Ⅰ and stage Ⅱ.
4.4 b-value analysis
The b-values presents advantages for monitoring the cracking behaviors of the concrete composites suffered from loads. In general, the b-value increases during the formation of micro-cracks (smaller-scale and weaker damage) and decreases as the micro-cracks coalescent into macrocracks (larger-scale and stronger damage). Thus, the b-value analysis method can effectively evaluate the internal damage degree throughout the entire loading process from a mesoscale perspective. The number (n) of AE amplitude has a great influence on the calculation of the b-value according to Eq. 1. Shiotani et al. (Ohtsu et al., 2010) suggested that the n should be 50 to 100. Hence, for obtaining the accurate results of b-value analysis, the n in this paper was chosen as 50, 70, and 100, respectively. Figure 16 shows the mean value and standard deviation of b-values of all sensors of Beam-3 calculated by the recorded AE amplitude at each bending load step, and the presence of cracks around the sensor is also marked in Figure 16. The number of AE signals collected by sensor 4 in Figure 16E during the loading period from 0 kN to 120 kN is too small to be used for data analysis.
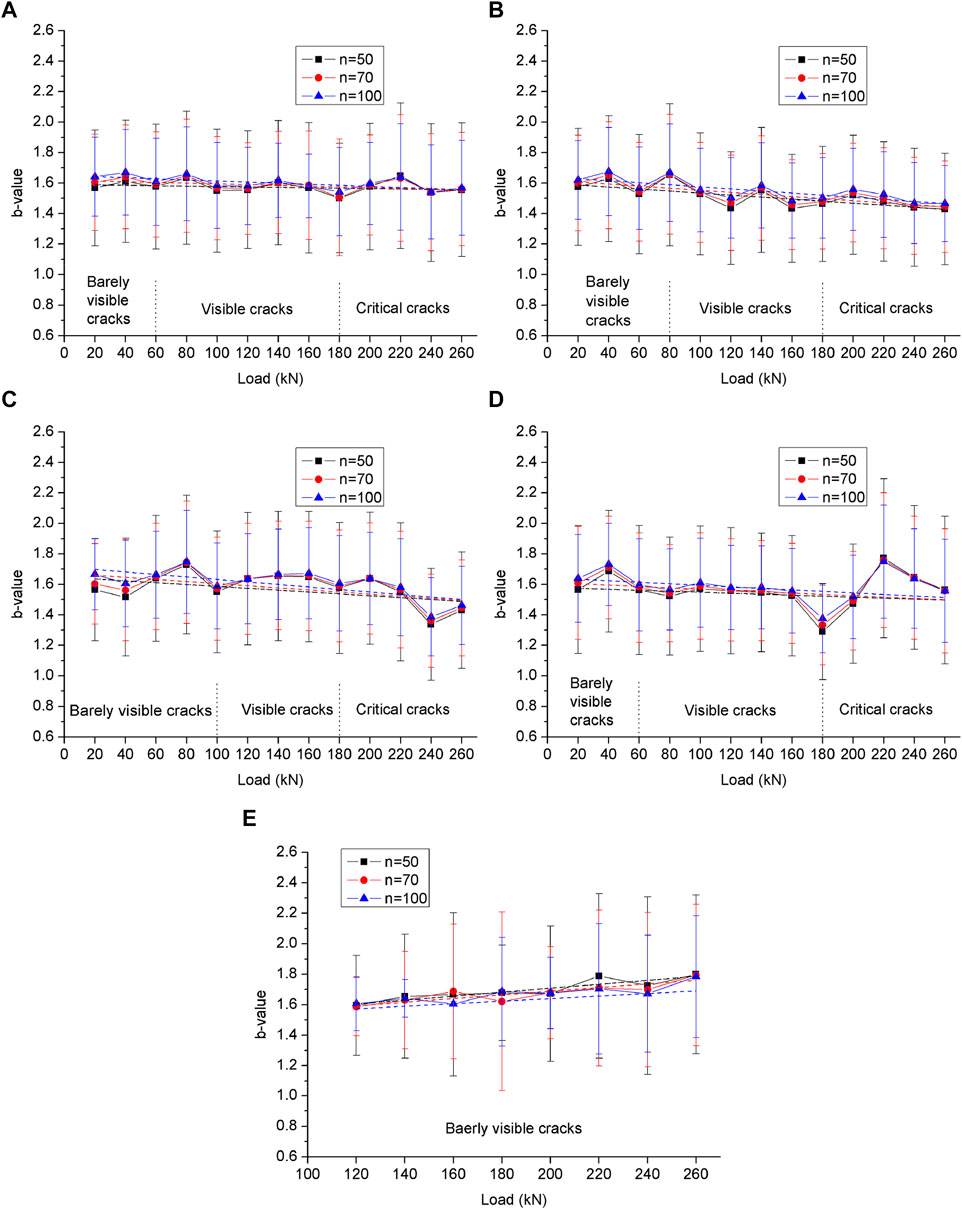
FIGURE 16. Classical b-value obtained from sensors in the Beam-3. (A) All sensors; (B) Sensor 1#; (C) Sensor 2#; (D) Sensor 3#; (E) Sensor 4#.
As observed in Figure 16, the b-value calculated from different group sizes varies less. It can be seen from the b-value of all sensors shown in Figure 16A that the b-value presents a fluctuating trend, which illustrates that microcrack activity and macrocrack activity appear alternately. By comparing Figures 16B–E, it can be seen that the cracking characteristics of the reinforcement BFRPC beam are different at different positions. The b-value of sensor 1#, 2#, and 3# all show a downward trend with bending load, while the b-value of sensor 4# increases with the bending load between 120 kN and 260 kN. This phenomenon suggests that the microcrack activity of sensors 1#, 2#, and 3# increases during the whole damage process, while the macrocrack activity of sensor 4# increases between 120 kN and 260 kN. Combined with the crack patterns of Beam-3, it can be seen that sensor 4# located at the upper part of the shear bending section has barely visible cracks, while visible macroscopic cracks appear in other sensor locations. This phenomenon proves the accuracy of the b-value in cracking characterization. As shown in Figure 16B, the b-value of sensor 1# decreases significantly at the load stage of 80–120 kN, showing that an obvious macrocrack is formed at the bottom of the bending shear section of Beam-3. At the load stage after 160 kN, the b-value of sensor 1# is small and gradually tends to be stable, indicating that the macrocrack activity is more prominent and critical failure cracks begin to form at the bottom of the bending shear section of Beam-3. From Figure 16C, the b-value of sensor 2# increases at the load stage before 80 kN, illustrating that microcracks appear on the upper side of the pure bending section. At the load step of 80–200 kN of sensor 2#, the b-value is small and relatively stable, representing that macrocrack activity is large, and the macrocrack gradually forms during this period. At the load stage after 200 kN of sensor 2#, the b-value decreases significantly, stating that critical failure cracks are forming on the upper side of the pure bending section at this stage. As can be seen from Figure 16D, the b-value increases when the bending load is less than 40 kN, indicating that a large number of microcracks are generated at the bottom of the pure bending section. The b-value decreases first and is then gradually maintain at a smaller value between 40 kN and 160 kN, and there is a significant decrease when the load is 180 kN. This indicates that the macrocrack activity at the bottom of the pure bending section is high, and the crack continues to expand steadily, and the critical failure macrocrack is formed when the bending load is 180 kN. The b-value firstly increases and then decreases after 180 kN. This shows that the bottom of the pure bending section once again experiences microcrack initiation and macrocrack formation after main rebars yielding, and more and more fine visible cracks appearing between the earlier visible cracks.
4.5 AF-RA analysis
AF value and RA value can be calculated by Eq. 2 and Eq. 3, and the reasonable AF/RA value can distinguish the fracture modes. Ohtsu et al. (Shiotani et al., 2001) suggested that different materials have different AF/RA ratio threshold to distinguish fracture modes, with greater than the critical value being tensile cracking and less than the critical value being shear cracking. BFRPC is a new material and the ratio threshold of AF/RA is unknown. To overcome this limitation, the ratio threshold of 1, 25, 50, and 100 were selected to distinguish fracture modes as tensile fracture and shear fracture, respectively in Figure 17.
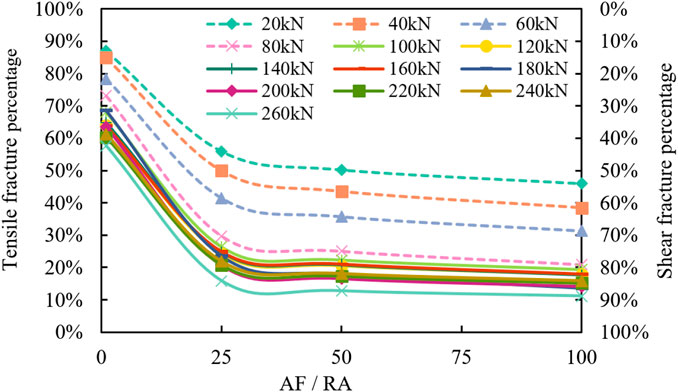
FIGURE 17. Variation of tensile fracture percentage vs. the ratio of AF/RA.
As shown in Figure 17, tensile fracture percentage under different loads is similar with the change of AF/RA ratio threshold, and tensile fracture percentage decreases and gradually stabilize with the increase of AF/RA ratio threshold. Although the tensile fracture percentage calculated by different AF/RA ratio threshold is inconsistent, the variation curves of tensile fracture percentage are similar. This indicates that the percentage of tensile and shear cracks in reinforcement BFRPC beams tends to stabilize when the ratio threshold is greater than 25. Therefore, ratio threshold 25 is selected in Figure 18 to analyze the variation trend of tensile fracture percentage at different positions of reinforcement BFRPC beam.
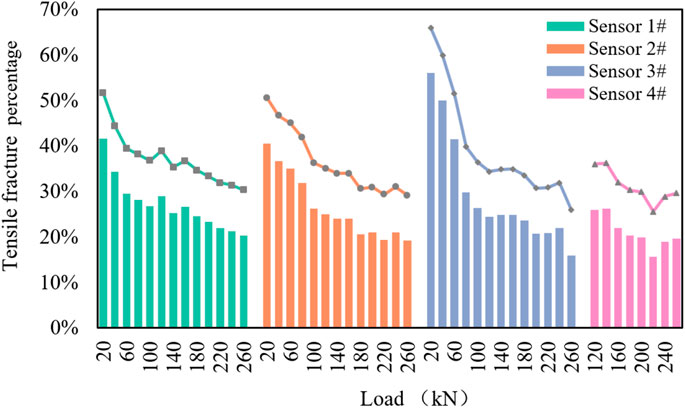
FIGURE 18. Variation of tensile fracture percentage at different positions of beam-3.
It can be seen from Figure 18 that the tensile fracture percentage of reinforcement BFRPC beam decreases gradually with the increase of bending load. Through calculation, it can be concluded that the tensile fracture percentage of sensor 3# at the bottom of the pure bending section decreases by the most, which is 40%, and that of other positions is reduced by about 25%. During the cracking process of reinforcement BFRPC beam subjected to bending load, the tensile fracture percentage decreased due to the action of basalt fiber and the main rebars, the chemical properties of basalt fiber and cement are similar, which makes it have great bonding strength with concrete matrix, and gives full play to the bridging effect of fiber to reduce the initiation and expansion of cracks. The low-stress brittle fracture caused by tensile fracture was reduced, and the tensile resistance and flexural bearing capacity of the reinforcement BFRPC beam were increased.
5 Conclusion
Utilizing the AE technology, this paper performed a laboratory investigation to clarify the cracking characteristics of reinforcement BFRPC beams. From the experimental and analytical results, the following conclusions can be drawn:
(1) AE hits, amplitude, counts, duration, and energy have similar changes with bending load. Cumulative AE parameters (cumulative hits and cumulative energy) are positively linearly related to the displacement and quadratically related to the sum of crack widths, and the correlation coefficients are all above 0.95. The cracking process of reinforcement BFRPC beam can be divided into four processes by the variation of AE basic parameters with bending load: microcrack initiation, macrocrack formation, critical failure crack formation, and critical failure crack propagation.
(2) The main rebars yielding is an important turning point of the crack characteristic of reinforcement BFRPC beam. The increase rates of cumulative AE parameters are relatively stable before main rebars yielding and after main rebars yielding, and the increase rate of the latter is significantly higher than that of the former.
(3) AE signal data varies greatly in different locations, and it has an obvious advantage that it can detect the formation of invisible cracks. The results of predicting concrete damage and cracking by AE signal data are consistent with the experimental phenomenon. The b-value calculated by AE amplitude can effectively identify the microcrack and macrocrack activity, and analyze the development of cracks in the beam in detail.
(4) The reinforcement BFRPC beam has good ductility after the main rebars yielding. The low-stress brittle fracture caused by tensile fracture was reduced, and the tensile resistance and flexural bearing capacity of the reinforcement BFRPC beam were increased.
In this study, we innovatively reinforced reactive powder concrete with basalt fiber and analyzed the fracture properties of BFRPC beam by mechanical and acoustic parameters. It can provide a reference for structural performance and damage assessment studies of basalt fiber reinforced cementitious concrete. In the future, it is recommended to use basalt fiber and BFRPC in concrete structural applications and to apply more acoustic techniques in concrete structural health monitoring.
Data availability statement
The datasets presented in this study can be found in online repositories. The names of the repository/repositories and accession number(s) can be found in the article/Supplementary Material.
Author contributions
XL: Conceptualization, Formal Analysis, Methodology, Writing–original draft. WL: Investigation, Software, Writing–review and editing. HH: Formal Analysis, Supervision, Writing–review and editing. XD: Funding acquisition, Resources, Supervision, Writing–review and editing. XH: Writing–review and editing.
Funding
The author(s) declare financial support was received for the research, authorship, and/or publication of this article. This research was funded by the Science and Technology R&D Program of China state Construction Engrg.Corp.Ltd. (CSCEC-2021-S-1), the R&D Program of China Construction Second Engineering Bureau Ltd. (2021ZX050001), and the Funding from China Construction Technology Innovation Platform (CSCEC-PT-017).
Conflict of interest
Authors XL and HH were employed by China Construction Second Engineering Bureau Ltd. Authors XD and XH were employed by The Civil Engineering Group of China Construction Second Engineering Bureau LTD.
The remaining author declares that the research was conducted in the absence of any commercial or financial relationships that could be construed as a potential conflict of interest.
Publisher’s note
All claims expressed in this article are solely those of the authors and do not necessarily represent those of their affiliated organizations, or those of the publisher, the editors and the reviewers. Any product that may be evaluated in this article, or claim that may be made by its manufacturer, is not guaranteed or endorsed by the publisher.
References
Boniface, A., Saliba, J., Sbartai, Z. M., Ranaivomanana, N., and Balayssac, J. P. (2020). Evaluation of the acoustic emission 3D localisation accuracy for the mechanical damage monitoring in concrete. Eng. Fract. Mech. 223, 106742. doi:10.1016/j.engfracmech.2019.106742
Chen, X., Wan, D., Jin, L., Qian, K., and Fu, F. (2019). Experimental studies and microstructure analysis for ultra-high performance reactive powder concrete. Constr. Build. Mater. 229, 116924. doi:10.1016/j.conbuildmat.2019.116924
Dubuc, B., Sitaropoulos, K., Ebrahimkhanlou, A., et al. (2020). Acoustic emission diagnostics of corrosion monitoring in prestressed concrete using hidden Markov and semi-Markov models. Struct. Health. Monit. 20 (6). doi:10.1177/1475921720976937
Fan, X. Q., Li, S. T., Chen, X. D., Saisai, L., and Yuzhu, G. (2020). Fracture behaviour analysis of the full-graded concrete based on digital image correlation and acoustic emission technique. Fatigue. Fract. Eng. M. 4 (6), 1274–1289. doi:10.1111/ffe.13222
Farhidzadeh, A., Salamone, S., Luna, B., and Whittaker, A. (2013). Acoustic emission monitoring of a reinforced concrete shear wall by b-value-based outlier analysis. Struct. Health. Monit. 12 (1), 3–13. doi:10.1177/1475921712461162
Han, Q., Yang, G., Xu, J., Fu, Z., Lacidogna, G., and Carpinteri, A. (2019). Acoustic emission data analyses based on crumb rubber concrete beam bending tests. Eng. Fract. Mech. 210, 189–202. doi:10.1016/j.engfracmech.2018.05.016
Jiao, Y., Zhang, Y., Shan, W., Han, Q., Zhao, Y., and Liu, S. (2019). Damage fracture characterization of reinforced concrete beam subjected to four-point bending with parametric analysis of static, dynamic, and acoustic properties. Struct. Health. Monit. 19 (4), 1202–1218. doi:10.1177/1475921719881756
Karimian, S. F., and Modarres, M. (2021). Acoustic emission signal clustering in CFRP laminates using a new feature set based on waveform analysis and information entropy analysis. Compos. Struct. 268, 113987. doi:10.1016/j.compstruct.2021.113987
Li, B., Xu, L., Shi, Y., Chi, Y., Liu, Q., and Li, C. (2018). Effects of fiber type, volume fraction and aspect ratio on the flexural and acoustic emission behaviors of steel fiber reinforced concrete. Constr. Build. Mater. 181, 474–486. doi:10.1016/j.conbuildmat.2018.06.065
Li, S. L., Zhang, L. G., Guo, P., Zhang, P., Wang, C., Sun, W., et al. (2021b). Characteristic analysis of acoustic emission monitoring parameters for crack propagation in UHPC-NC composite beam under bending test. Constr. Build. Mater. 278, 122401. doi:10.1016/j.conbuildmat.2021.122401
Li, W., Liu, H., Zhu, B., Lyu, X., Gao, X., and Liang, C. (2020). Mechanical properties and freeze-thaw durability of basalt fiber reactive powder concrete. Appl. Sci-Basel. 10 (16), 5682. doi:10.3390/app10165682
Li, Z., Zhu, H., Du, C., Gao, D., Yuan, J., and Wen, C. (2021a). Experimental study on cracking behavior of steel fiber-reinforced concrete beams with BFRP bars under repeated loading. Compos. Struct. 267, 113878. doi:10.1016/j.compstruct.2021.113878
Liu, H., Lyu, X., Zhang, Y., Luo, G., and Li, W. (2020a). Bending resistance and failure type evaluation of basalt fiber RPC beam affected by notch and interfacial damage using acoustic emission. Appl. Sci-Basel. 10 (3), 1138. doi:10.3390/app10031138
Liu, H., Lyu, X., Zhang, Y., Luo, G., and Li, W. (2020b). Steel corrosion evaluation of basalt fiber RPC affected by crack and steel-concrete interface damage using electrochemical methods. Sensors-Basel. 20 (18), 5027. doi:10.3390/s20185027
Lou, K., Xiao, P., Kang, A., Wu, Z., and Lu, P. (2021). Performance evaluation and adaptability optimization of hot mix asphalt reinforced by mixed lengths basalt fibers. Constr. Build. Mater. 292, 123373. doi:10.1016/j.conbuildmat.2021.123373
Merdas, H. S., and Shallal, M. A. (2023). Shear strength of recycled aggregate concrete beams without shear reinforcement. IOP Conf. Ser. Earth Environ. Sci. (1), 1232. doi:10.1088/1755-1315/1232/1/012029
Ministry of Housing and Urban-Rural Development of the People's Republic of China (2012). Standard for test method of concrete structures (GB/T 50152-2012). Beijing, China: China Communications Press.
Mohammadi, R., Najafabadi, M. A., Saghafi, H., Saeedifar, M., and Zarouchas, D. (2021). A quantitative assessment of the damage mechanisms of CFRP laminates interleaved by PA66 electrospun nanofibers using acoustic emission. Compos. Struct. 258, 113395. doi:10.1016/j.compstruct.2020.113395
Nguyen-Tat, T., Ranaivomanana, N., and Balayssac, J.-P. (2018). Characterization of damage in concrete beams under bending with Acoustic Emission Technique (AET). Constr. Build. Mater. 187, 487–500. doi:10.1016/j.conbuildmat.2018.07.217
Ohtsu, M., Shiotani, T., Shigeishi, M., Kamada, T., Yuyama, S., et al. (2010). Recommendation of RILEM TC 212-ACD: acoustic emission and related NDE techniques for crack detection and damage evaluation in concrete Test method for classification of active cracks in concrete structures by acoustic emission. Mater. Struct. 43 (9), 1187–1189. doi:10.1617/s11527-010-9640-6
Rashid, K., Li, X. D., Xie, Y., Deng, J., and Zhang, F. (2020). Cracking behavior of geopolymer concrete beams reinforced with steel and fiber reinforced polymer bars under flexural load. Compos. Part. B-Eng. 186, 107777. doi:10.1016/j.compositesb.2020.107777
Shiotani, T., Ohtsu, M., and Ikeda, K. (2001). Detection and evaluation of AE waves due to rock deformation. Constr. Build. Mater. 15 (5-6), 235–246. doi:10.1016/s0950-0618(00)00073-8
Si, J., Wang, Z., Li, J., Zuo, C., Zhang, P., Wei, C., et al. (2021). Effects of CaO added to raw basalt on producing continuous basalt fibers and their mechanical properties. J. Non-Cryst. Solids. 568, 120941. doi:10.1016/j.jnoncrysol.2021.120941
Sultan, H., and Alyaseri, I. (2020). Effects of elevated temperatures on mechanical properties of reactive powder concrete elements. Constr. Build. Mater. 261, 120555. doi:10.1016/j.conbuildmat.2020.120555
Tan, G. J., Zhu, Z. Q., Wang, W. S., Wu, C., Ou, J., Cui, G., et al. (2021). Flexural ductility and crack-controlling capacity of polypropylene fiber reinforced ECC thin sheet with waste superfine river sand based on acoustic emission analysis. Constr. Build. Mater. 277, 122321. doi:10.1016/j.conbuildmat.2021.122321
Xargay, H., Folino, P., Nuñez, N., Gómez, M., Caggiano, A., and Martinelli, E. (2018). Acoustic emission behavior of thermally damaged self-compacting high strength fiber reinforced concrete. Constr. Build. Mater. 187, 519–530. doi:10.1016/j.conbuildmat.2018.07.156
Xargay, H., Ripani, M., Folino, P., Núñez, N., and Caggiano, A. (2021). Acoustic emission and damage evolution in steel fiber-reinforced concrete beams under cyclic loading. Constr. Build. Mater. 274, 121831. doi:10.1016/j.conbuildmat.2020.121831
Zdeb, T. (2019). Effect of vacuum mixing and curing conditions on mechanical properties and porosity of reactive powder concretes. Constr. Build. Mater. 209, 326–339. doi:10.1016/j.conbuildmat.2019.03.116
Zhang, F. Q., Pahlavan, L., and Yang, Y. G. (2020). Evaluation of acoustic emission source localization accuracy in concrete structures. Struct. Health. Monit. 19 (6), 2063–2074. doi:10.1177/1475921720915625
Zhang, K., Zhou, M., Zhang, B., Luan, C., Liu, Y., et al. (2023). Experimental and numerical study of the flexural performance of spontaneous combustion gangue coarse aggregate concrete laminated slab. Buildings 13 (7), 1718. doi:10.3390/buildings13071718
Keywords: basalt fiber, reactive powder concrete, acoustic emission, cracking characteristics, damage assessment
Citation: Lyu X, Li W, Hu H, Ding X and Hu X (2024) Cracking characteristics evaluation for reinforcement basalt fiber reactive powder concrete beam using acoustic emission. Front. Mater. 11:1346140. doi: 10.3389/fmats.2024.1346140
Received: 29 November 2023; Accepted: 02 January 2024;
Published: 19 January 2024.
Edited by:
Yang Zou, Chongqing Jiaotong University, ChinaReviewed by:
Xiaohua Li, Chongqing University, ChinaAli Raza, University of Engineering and Technology, Taxila, Pakistan
Copyright © 2024 Lyu, Li, Hu, Ding and Hu. This is an open-access article distributed under the terms of the Creative Commons Attribution License (CC BY). The use, distribution or reproduction in other forums is permitted, provided the original author(s) and the copyright owner(s) are credited and that the original publication in this journal is cited, in accordance with accepted academic practice. No use, distribution or reproduction is permitted which does not comply with these terms.
*Correspondence: Xiang Lyu, bHZ4aWFuZzE4QG1haWxzLmpsdS5lZHUuY24=