 Zhipeng Li1
 Ming Sun
- 1Key Laboratory of Earthquake Engineering Simulation and Seismic Resilience of China Earthquake, Tianjin University, Tianjin, China
- 2School of Traffic and Environment, Shenzhen Institute of Information Technology, Shenzhen, Guangdong, China
- 3Department of Mechanical Engineering, Tohoku University, Sendai, Japan
Corrosion fatigue behavior of a new candidate material for geothermal turbine blade, modified 17-4PH, was investigated in detail. The environmental acceleration of crack growth rate was discussed in terms of ∆K. Fracture surface and side surface were observed by SEM. The crack path on side surface was also analyzed by EBSD. Then, the corrosion mechanism was discussed. Striation width on the fracture surface was compared to the crack growth per cycle. Since pitting occurred during the corrosion fatigue test, anodic polarization test was exercised to measure the pitting potential, and the cause for the pitting was also discussed. The hardness was also characterized by micro-hardness test and auger electron mapping.
1 Introduction
Earth’s stable and boundless heat, commonly known as geothermal energy, presents a viable alternative to traditional fossil fuels, emitting significantly less carbon dioxide (CO2). This sustainable energy source is readily accessible with current technology. The process of harnessing geothermal energy can be streamlined, as illustrated in the flow diagram depicted in Figure 1 (Sakai et al., 2009). The geothermal fluid, upon entering the production well at its initial temperature, undergoes a bifurcation process. It splits into two components: high-pressure steam directed towards the turbine’s high-pressure stage and partially vaporized brine directed to the flasher. Within the flasher, the brine experiences a secondary separation, resulting in low-pressure steam and residual waste brine. The low-pressure steam is then directed to the steam turbine to generate extra electrical power, while the brine is reintroduced into the reinjection well (Valdimarsson, 2011). However, corrosive elements like chloride and sulfates present in the steam used in the steam turbine are significantly elevated, ranging from 100 to 1000 times higher than those found in fossil fuel power plants that utilize purified feedwater. Additionally, in the case of geothermal power plants designed for a service life of over 30 years, there is a considerable likelihood of operational issues, even with diligent maintenance. Statistical data indicates that a predominant cause of plant failures in such scenarios is attributed to corrosion fatigue (EPRI, 1985). Therefore, it is essential to assess the corrosion fatigue characteristics of turbine blade materials to ensure the sustained and reliable long-term operation.
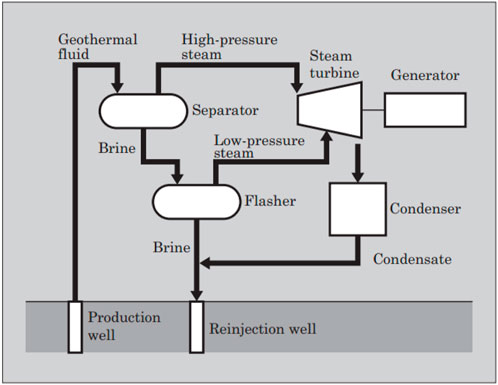
FIGURE 1. Simplified diagram of geothermal power plant.
This paper discusses the corrosion fatigue behavior of a recently enhanced 17-4PH alloy, identified as a prospective material for the upcoming generation of geothermal turbine blades. A comparative analysis of the chemical composition, heat treatment, and mechanical strength of the modified 17-4PH alloy and the conventional 17-4PH alloy is presented in Tables 1, 2, respectively (Sakai et al., 2003; JPO, 2008). The modified 17-4PH alloy incorporates lower concentrations of Si and Cr to inhibit the development of delta-ferrite, a factor thought to compromise both stress corrosion cracking (SCC) resistance and mechanical properties. The chosen nickel content was determined based on achieving an optimal balance between strength and SCC resistance. Furthermore, it is posited that the microstructure of the modified 17-4PH alloy is enhanced through a specifically devised two-step tempering process carried out at relatively elevated temperatures, aimed at improving both corrosion fatigue and SCC resistance (JPO, 2008).
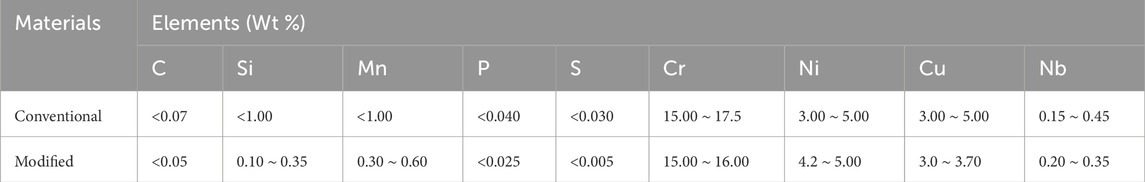
TABLE 1. Comparison of chemical composition between conventional and modified 17-4PH
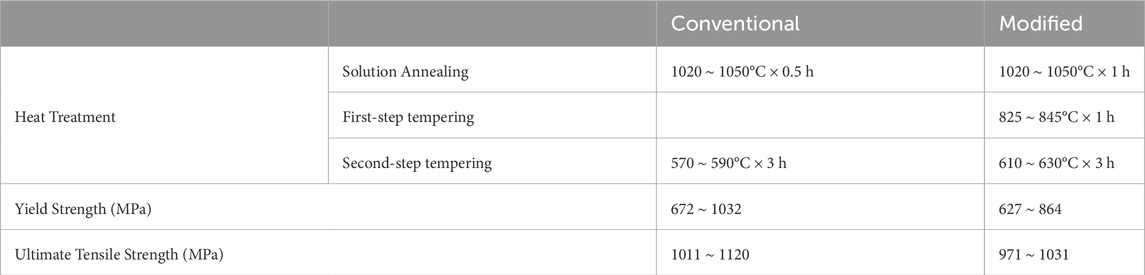
TABLE 2. Comparison of heat treatment and mechanical strength.
Studies have indicated a significant association of hydrogen embrittlement (HE) in the corrosion fatigue of 17-4PH, with active path corrosion (APC) being another potential mechanism (Salinas-Bravo and Gonzalezrodriguez, 1995). Sakai et al. conducted research on the corrosion fatigue resistance of modified 17-4PH in a simulated geothermal solution containing saturated H2S (Sakai et al., 2003). In environments saturated with H2S, the primary mechanism for Environmentally Assisted Cracking (EAC) during operation is thought to be hydrogen embrittlement (HE). This is attributed to the well-established understanding that H2S significantly intensifies the susceptibility to hydrogen embrittlement in stainless steels used in engineering applications (Kane and Cayard, 1998). Nevertheless, in a geothermal setting with minimal or no H2S presence, the predominant mechanism may transition to active path corrosion (APC). This shift occurs due to the elevated chloride levels creating favorable conditions for pitting, resulting in a highly corrosive local environment that ultimately triggers APC. The diversity in operational mechanisms is anticipated to impact the corrosion fatigue behavior. Consequently, it is imperative to assess the corrosion fatigue performance in geothermal environments devoid of H2S.
As the corrosion fatigue performance of a material is intrinsically shaped by its microstructure, including factors such as phase distribution and grain size, comprehensive microstructure characterization was conducted using metallography, electron backscatter diffraction (EBSD), and auger electron spectroscopy (AES) before undertaking the corrosion fatigue tests. This approach aimed to furnish dependable and fundamental insights into the characteristics of the modified 17-4PH alloy. Additionally, the material’s hardness, a fundamental property, was assessed through micro-hardness testing. Notably, the results of the metallography and EBSD analyses have already been previously published (Wu et al., 2017).
2 Experimental procedures
2.1 Material
The initial material obtained was in the form of a cubic block measuring 350 × 105 × 150 mm. It exhibited a 0.2% proof stress of 760 MPa and a tensile strength of 900 MPa. The prescribed heat treatment involved a three-step process: 1040°C for 70 min with air cooling, followed by 835°C for 3 h with air cooling, and finally, 620°C for 4 h with furnace cooling. For subsequent analysis, small cubic strips were precisely cut from the original block using mechanical machining techniques. The performance of 17-PH alloy in corrosion fatigue was crucial. Through extensive preliminary experiments, it had been found that the two-step tempering process could improve the corrosion fatigue and stress corrosion cracking resistance of this material. This was also validated and explained in the later microscopic testing. The specimen used for corrosion fatigue tests undergo special chemical treatment, which will be described in detail later.
2.2 Hardness measurement
Initially, the specimen underwent grinding with waterproof silicon carbide papers, progressing up to 2,400 grits. Subsequently, hardness assessments were conducted using a Shimadzu micro-Vickers hardness tester, applying a 2 Kg load with a 15-s holding time. A set of 20 points, spaced at intervals of 0.5 mm on each surface (as illustrated in Figure 2), were measured, and the resulting average value was employed as the ultimate hardness measurement.
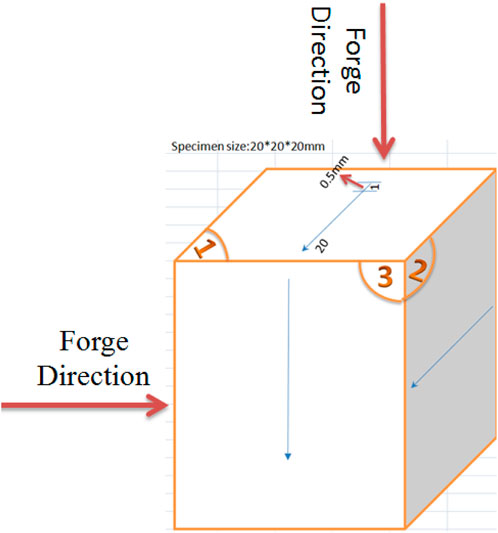
FIGURE 2. Measurement path of hardness analysis on each surface.
2.3 Fatigue and corrosion fatigue tests
The water chemistry for corrosion fatigue tests was 10,000 ppm Cl−, 50 ppm SO42-, 90°C, pH being 5.4
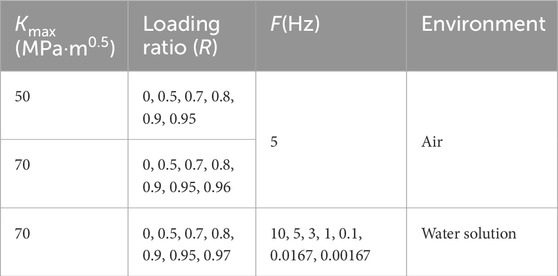
TABLE 3. Loading conditions for fatigue and corrosion fatigue tests.
The contoured double cantilever beam (CDCB), which was based on the design by Mostovoy et al. (1967) was the specimen that was employed. Figure 3 depicted the CDCB specimen’s geometry. The specimen was constructed so that surface 3 in Figure 2 would receive the imposed loading. The overall crack propagation during pre-cracking in air was approximately 2 mm, and the mechanical notch (aCDCB) measured 22 mm. Within a specific crack-length, the specimen was subjected to constant loading (CL) at a constant value of K (CK). The following Eqs 1–3 express the crack driving force G:
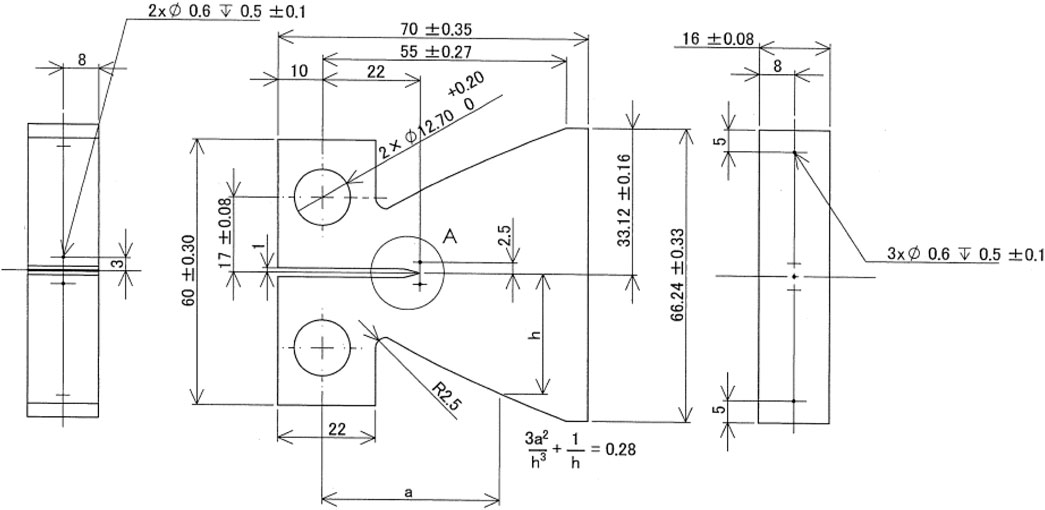
FIGURE 3. Geometry and size of CDCB specimen.
Where: P-applied loading, B-specimen thickness, E-elastic modulus, a-horizontal distance from loading point to crack tip, h-the beam height at distance a. When mCDCB is kept constant for the specimen, and then the stress intensity factor K is given as follows:
Where unit of K is MPa‧m0.5, and that of B is m, that of P is MN, mCDCB is m-1, and both a and h are in m. The value of mCDCB in theory is 0.28, while the experimental result gives a value of 0.437 for this specimen. This difference was caused by the cut-off in h near the back surface of the specimen and causes 40% difference in K. In these experiments, experimentally quantified value of 0.437 was used to calculate K.
A MATELECT ACPD CRACK GROWTH MONITOR CGM-5R was used to track the crack’s progression during the test. Each specimen’s frequency was maintained constant, but after a specific amount of crack extension, the loading ratio was allowed to rise from 0 to 0.96. The specimen was cut into quarters for the purpose of side surface examination after every fatigue test. After that, a post-cracked specimen was used to observe the fracture surface. Next, on the fracture surface, the length of each condition’s crack was measured.
2.4 SEM and electron backscatter diffraction characterization
The fracture surface and side surface after fatigue/corrosion fatigue tests were observed using a Hitachi SU-70 SEM.
EBSD analyzed the crack route following the corrosion fatigue test. First, specimens with the same surface polish as those for metallography were prepared for the EBSD investigation. After that, the specimens were polished for roughly 20 min using a 0.05-µm silica suspension to get rid of any surface deformation from the previous grinding. After a final distilled water wash, an ethanol rinse, and drying, the specimens were prepared. The 20 kV step size and 50 nm step size were used in the EBSD analysis.
2.5 Anoidc polarization tests
Each metal coupon is attached to a plastic-sheathed copper wire and then encapsulated in epoxy resin so that only one surface of the coupon is exposed in order to prepare specimens for the potentiodynamic polarization test. The epoxy is allowed to cure for a full day at room temperature. The exposed surface, which measures about 1 cm2, is initially finished with 4,000 grit before being cleaned with distilled water. To prevent corrosion between the specimen and epoxy resin during corrosion testing, a silica sealant is applied to the interface between the sample and epoxy resin.
To mimic the environment of a geothermal power plant, 10,000 parts per million (by weight) of chloride ions (Cl−) added as NaCl and 50 parts per million of sulfate ions (SO42-) injected as Na2SO4 are utilized. Pure N2 deaerates the solution. Ag/AgCl in saturated KCl was utilized as the reference electrode, and Pt was used as the counter electrode. The potential was converted to NHE following the test. The test has a scanning rate of 10 mV/min and a temperature of 90°C. The specimen is catholically polarized for 30 min at −0.6 V below the OCP, which is normally in the region of −0.84∼-0.9 V vs. NHE, prior to each corrosion test in order to eliminate the oxide layer that has accumulated in the air. The scanning started from 0.05 V vs. OCP. The test was repeated three times to ensure the reproducibility, and then one typical curve was chosen to present herein.
3 Results and discussion
3.1 Hardness
Figure 4 displayed the hardness profile on each surface. It should be mentioned that only 19 surface 2 points were saved because of a measurement error. That missing point should not, however, have a significant impact on the final outcome. Surfaces 1, 2, and 3 had average values of 295.5, 295.3, and 294.3, in that order. Surfaces 1 and 2 had nearly identical values, while Surface 3 had the lowest value. In the meantime, surface 1, 2, and 3’s measured data had standard deviations of 2.76, 2.74, and 3.50. It is evident that surface 3’s hardness fluctuated more than the others. That distinction of surface 3 from surface 1 and 2 was attributed to the hot forging on surface 1 and 2, as shown in Figure 2.
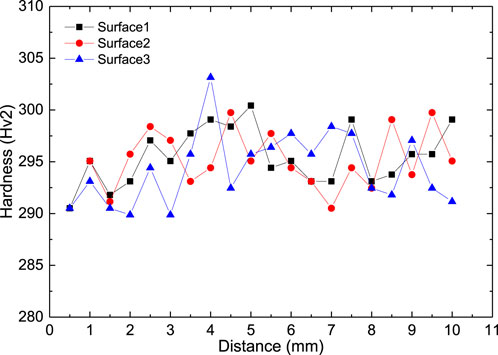
FIGURE 4. Vickers Hardness profile across each surface.
Usually, the HV of 17-4PH was higher than 350, much higher than the value of present material (Hsiao et al., 2002). The root of this sharp reduction of hardness was the coarsening of Cu-rich precipitates (JPO, 2008). The Auger Electron’s Cu mapping on surface 1 provided evidence in favor of that claim. Cu-clusters could be seen clearly in the Cu mapping in Figure 5. The arrow’s Cu-cluster measured in the order of μm, which was significantly larger than the typical Cu-rich precipitate size of 20 nm. (Wang et al., 2006). This decrease in hardness had been explained, but the working performance related to hardness was still within an acceptable and reasonable range. The working conditions of the material require higher resistance to fatigue and corrosion damage. Therefore, the comprehensive performance of modified 17-4PH was more suitable for use conditions.
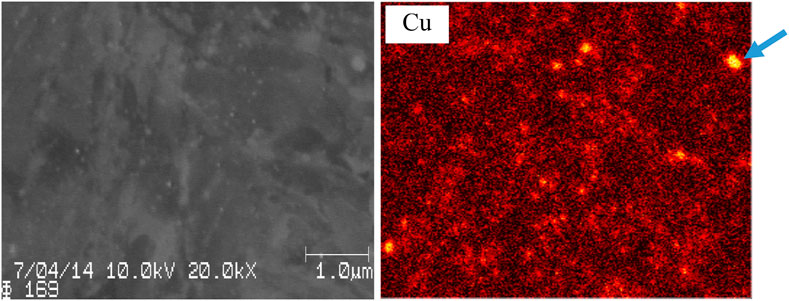
FIGURE 5. Cu mapping on surface 1 by Auger Electron.
3.2 Correlation between ΔK and environmental influence
In order to create a set of baseline data for Paris’ law, which links the subcritical crack growth rate per cycle to the stress intensity factor range (ΔK), the fatigue test in the air was completed. The following Eq. 4 represented the relationship between ΔK and the crack growth rate:
Where a was the crack length, N the number of load cycles, C and m were empirical constant usually referred to as Paris’ law parameters. The parameters obtained from the fitting formula were 2.04 × 10⁻⁸ for C, 2.546 for m (Wu et al., 2017).
Figure 6 showed the cycle-base corrosion fatigue crack growth rate as a function of ΔK at various frequencies. Although the data for 0.1 cpm, 1 cpm, and 10 Hz were previously published, they are still used for comparison and discussion in this context. (Wu et al., 2017). When the measured results and the Paris law plot diverged, the linear line served as a reference point to assess the environmental assistance in accelerating crack growth.
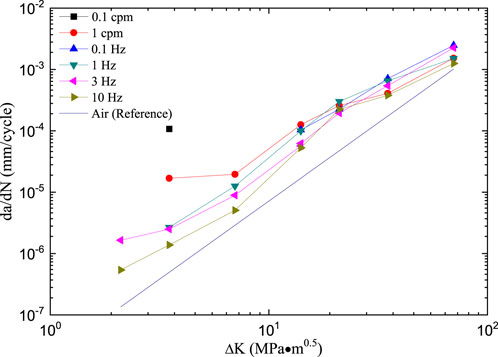
FIGURE 6. Corrosion fatigue crack growth rate under different loading frequencies.
With respect to frequency, the environmental acceleration decreases with increasing frequency at any given ΔK below 14 MPa·m0.5. This is because the duration of each cycle is shortened to allow the time-dependent corrosion process to proceed. On the other hand, when ΔK exceeded 14 MPa·m0.5, the variation in the crack growth rate (CGR) per cycle with frequency was inconsistent, particularly for 1 cpm, where the acceleration was approximately equal to or lower than that of other frequencies. In terms of ΔK’s impact on acceleration, 14 MPa·m0.5 appears to mark a turning point. The acceleration generally increased from 70 to 14 MPa·m0.5 with decreasing ΔK, then decreased to 7 MPa·m0.5 with further decreasing ΔK, and finally strengthened again at ΔK below 7 MPa·m0.5, as indicated by 1 cpm. The complex interaction between the mechanical and corrosion processes was strongly suggested by the changing effect of ΔK on both environmental acceleration at each given frequency and the influence of frequency on environmental acceleration. In modified 17-4PH, there is a certain correlation between the influence of environment on crack growth and ΔK. When ΔK decreases, the environmental influence on crack growth increases gradually, which means that environmental factors play an important role in the process of crack growth. In this case, the relative contributions of mechanical and environmental factors to CGR are denoted by the letters CM and CE, respectively. Table 4 provided an overview of the acceleration variation of the environment with CM and CE.
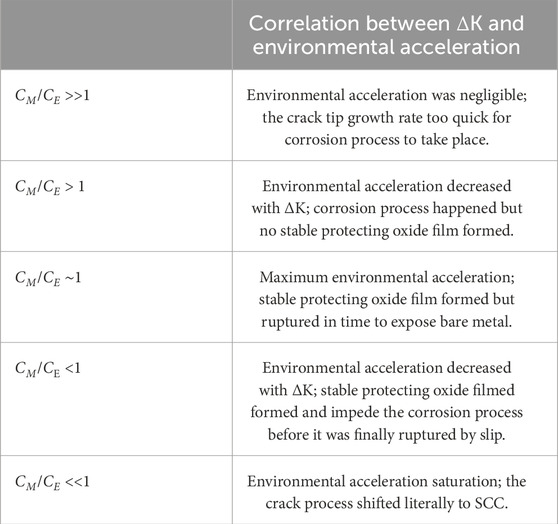
TABLE 4. Environmental acceleration as a function of CM/CE.
3.3 Fractography after fatigue tests in air
Figures 7, 8 show examples of SEM images following fatigue tests in the air. One example of a side surface image was displayed in Figure 7. On the side surfaces, very noticeable secondary cracks were discovered, and the oxide inclusion—which EDX identified as Al2O3—was discovered to be obstructing the crack’s path. Two mechanisms of secondary crack formation have been proposed by Bo et al. (1) Localized high tension stress during the blunting or resharpening process may cause a microcrack to form along the blunted border, particularly in areas with sub-grain or grain boundaries or defects. (2) An inclusion that is sufficiently near the primary fracture path to cause void nucleation and stress concentration (Bo and Chen, 1988). Herein, the secondary formation mechanism in Figures 7A should be mechanism (1), in Figures 7B mechanism (2).
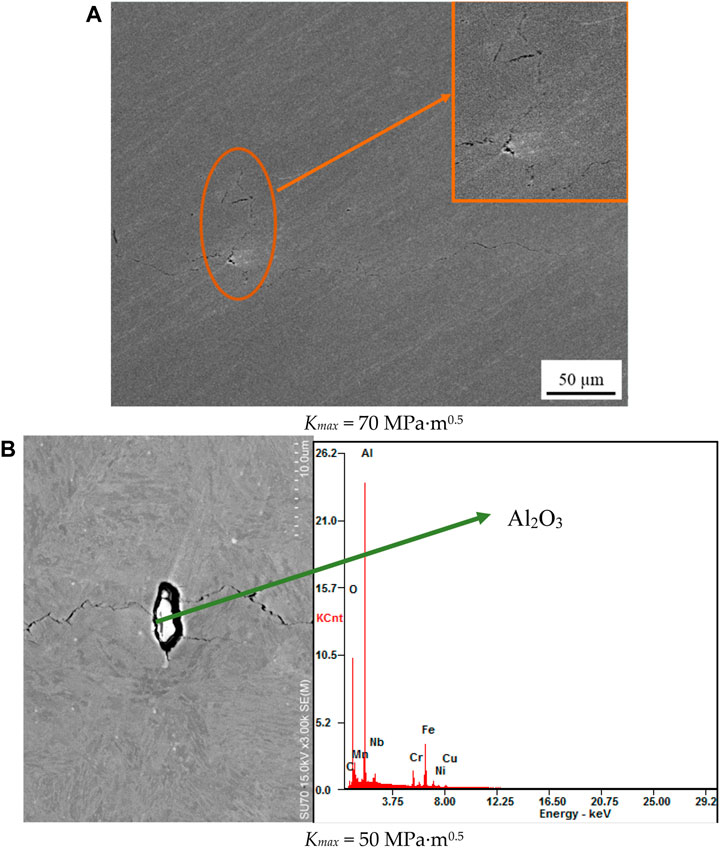
FIGURE 7. Side surfaces after fatigue tests in air, (A) specimen with Kmax = 70 MPa·m0.5; (B) Kmax = 50 MPa·m0.5.
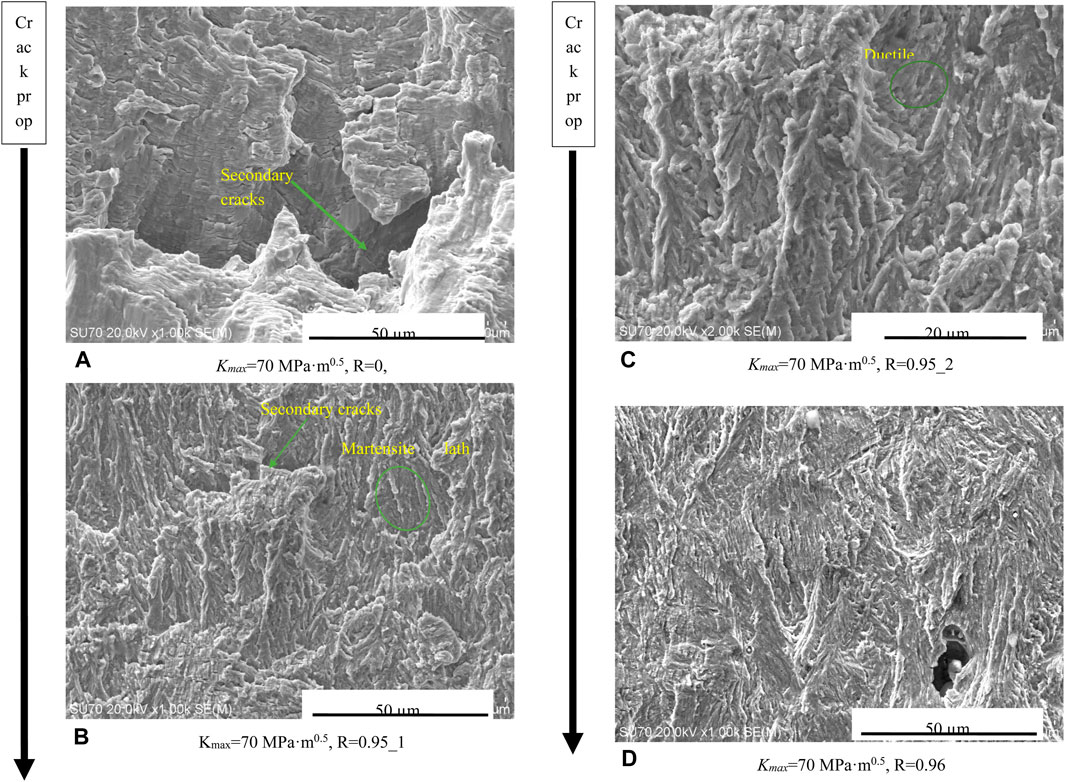
FIGURE 8. Fracture surface after the fatigue tests in air under different loading conditions. (A) Kmax=70 MPa·m0.5, R=0, (B) Kmax=70 MPa·m0.5, R=0.95_1, (C) Kmax=70 MPa·m0.5, R=0.95_2, (D) Kmax=70 MPa.
The fracture surface revealed that the quasi-brittle cleavage was the result of a gradual shift in the crack propagation mode from ductile striation mode to increasing loading ratio. The surface displayed distinct ductile striations at a loading ratio of R = 0. Laird provides the most plausible striation formation mechanism based on crack tip plastic relaxation (Laird, 1967). The model was shown in Figure 9 (Milella, 2013a). The initial condition where the crack is idling is shown in Figure 9A. Plastic slips appear on both sides when a load is applied, as seen in Figure 9B. The tip is completely blunted at maximum load, as Figure 9C illustrates. When the load is reversed, as in Figure 9D, the crack tip closes via reverse plastic flow, which returns the crack to its original state but creates a new elementary free surface that indicates the crack’s growth (Figure 9E). Finally, Figure 9F depicts the updated loading phase, which is comparable to Figure 9B (Milella, 2013a). Few local sites had ductile striation, as shown by the circled area in Figure 8C, while the majority of the fracture surface displayed quasi-brittle cleavage at loading ratio R = 0.95. The martensite lath blocks in the circled area were similar in width to the ones displayed in the IPF mapping (Wu et al., 2017). Further increasing loading ratio to 0.96, the surface became more flat and showed but quasi-brittle cleavage.
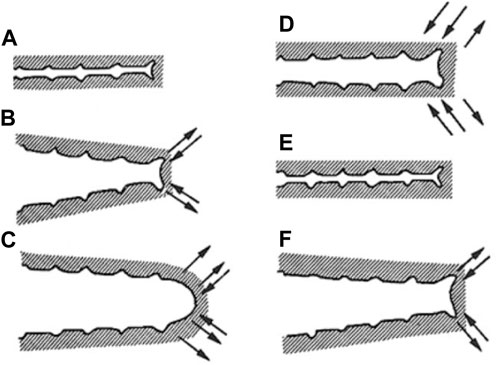
FIGURE 9. Schematic of striations formation based on crack tip plastic relaxation (A) initial condition; (B) crack tip plastic slips on both sides; (C) tip blunted at maximum load; (D) crack tip closure; (E) a new formed elementary free surface; (F) new loading phase similar to (B).
The crack propagation might match the mechanism proposed by Beardmore et al., shown in Figure 10 (Beardmore and Thornton, 1970). The initial state with zero loads is shown in Figure 10A. A small tensile load in Figure 10B resulted in shear zones around the crack’s tip and a slight blunting of the crack; a further increase in tensile load could lead to one of two crack growth modes: As seen in Figure 10C, the crack expands by further blunting and widening of the shear zones; as seen in Figure 10D, the concentrated tensile stresses in front of the crack form a new crack nucleus and cause a quasi-brittle cleavage to propagate between the new and old cracks. The latter procedure explained the current situation.
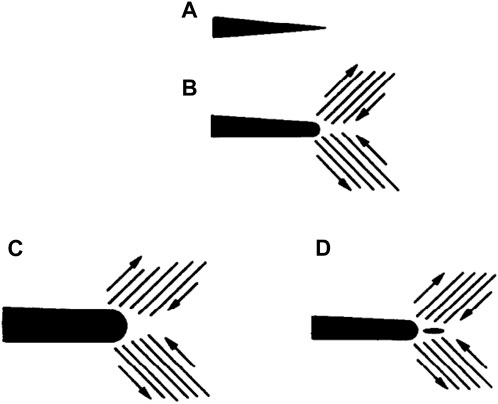
FIGURE 10. Schematic diagram of the two types of fatigue crack growth (A) initial state; (B) shear zones produced by small tensile load; (C) crack growth by additional blunting; (D) new crack nucleus and subsequent quasi-cleavage.
3.4 Fractography after corrosion fatigue tests
Below are some typical SEM photos of the fracture surface following corrosion fatigue tests at different loading ratios and frequencies. The images of 3 Hz, 1 cpm, and 0.1 cpm were displayed in Figures 11–13, respectively. Although some areas were blurred by corrosion products, ductile striation was still visible throughout the surfaces in Figure 11A. Instead of HE, which was identified by brittle striation and cleavage, it was deduced that metal dissolution was the environmental acceleration mechanism (Milella, 2013b). As the loading ratio increased to 0.95, resulting in ΔK falling to 3.5 MPa·m0.5, Figure 11B illustrates the quasi-brittle cleavage on the entire surface. Brittle cleavage was also discovered in the circled region; this was not seen in the air as Figure 8B illustrates. However, as indicated by the circle in Figure 11C, ductile striation was still present in a very small area, and it was less widespread than Figure 8C. As the loading ratio was increased to 0.97, as seen in Figure 11D, the brittle cleavage area grew larger and the ductile striation became more elusive. The air experienced a similar phenomenon as well. The loading ratio stopped being ductile at 0.96, having passed 0.95. It seemed that when ΔK in the range of 3.5 MPa·m0.5–2.8 MPa·m0.5 the propagation shifted from ductile striation mechanism to brittle cleavage.
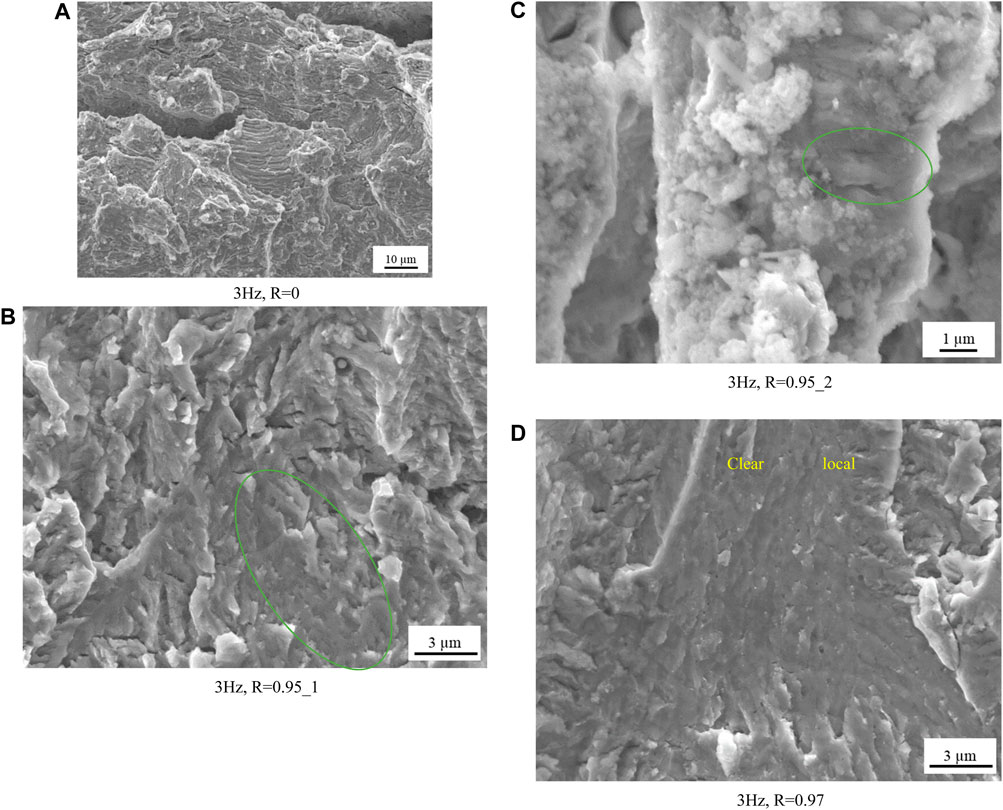
FIGURE 11. Fracture surface of specimen under the frequency of 3 Hz (A) R = 0; (B) R = 0.95_1; (C) R = 0.95_2; (D) R = 0.97.
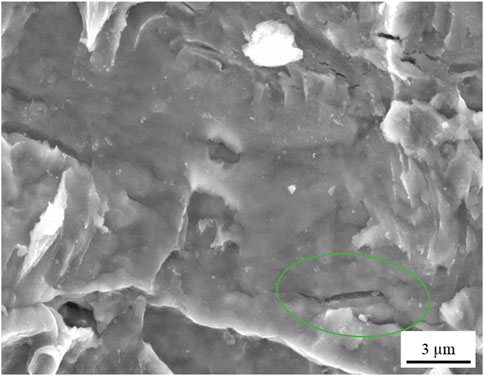
FIGURE 12. Fracture surface of specimen under the frequency of 1 cpm, R = 0.95.
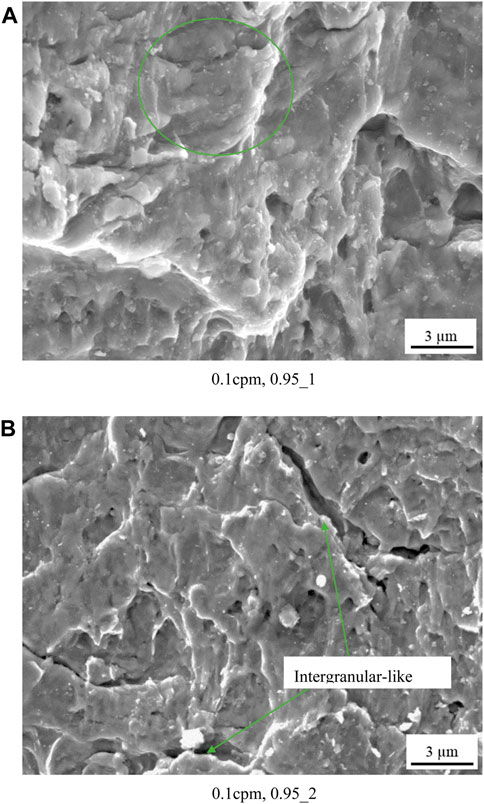
FIGURE 13. Fracture surface of specimen under the frequency of 0.1 cpm, R = 0.95. (A) 0.1 cpm, 0.95_1, (B) 0.1 cpm, 0.95_2.
Upon decreasing to 1 cpm, the ductile striation area shrank. The dotted region in Figure 12 illustrates ductile striation up to loading ratio 0.95; however, no brittle cleavage area was seen, unlike Figure 11D at loading ratio 0.97. There was localized ductile striation on the surface even when the loading frequency dropped to 0.1 cpm, as seen in the circled region in Figure 13A. This further indicated that the crack propagation transitioned from ductile striation to brittle cleavage in the ΔK range of 3.5 MPa·m0.5–2.8 MPa·m0.5.
The cracks marked by arrows in Figure 13B seemed to be intergranular, from which a hypothesis of HE is always made and in most cases it is the right one (Milella, 2013c). That hypothesis of HE would be supported by EBSD analysis of crack tips in the following section.
3.5 EBSD observation of crack path after corrosion fatigue tests
To confirm whether the crack path was transgranular or intergranular, EBSD observed the area near the crack tip. Figures 14, 15 displayed the EBSD IPF images at 0.1 and 1 cpm, respectively. For the most part, the transgranular crack was clearly visible. However, the crack appeared to propagate along the grain boundary in the circled areas where there was a significant difference in the crystal orientation on both sides of the crack. In Figure 13B, the intergranular-like crack was also observed. Moreover, this material was found to be susceptible to HE in NaCl solution by both Fujii and Salinas Bravo et al. (Fujii, 1976; Salinas-Bravo and Gonzalezrodriguez, 1995). It is very reasonable to infer that HE was involved when both ΔK and frequency are low enough.
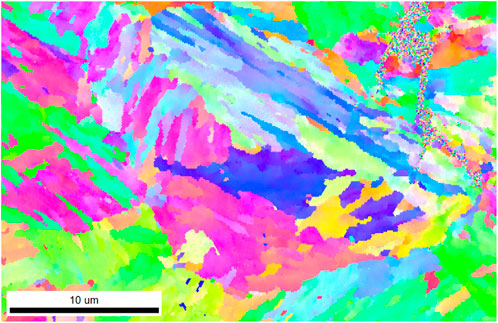
FIGURE 14. IPF map around crack tip after test at frequency of 0.1 cpm.
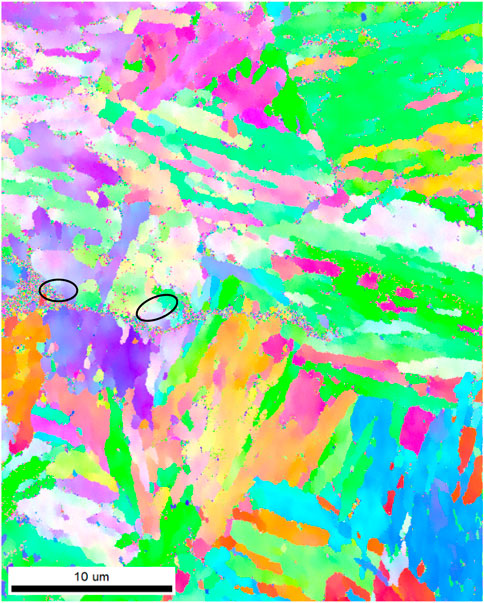
FIGURE 15. IPF map around crack tip after test at frequency of 1 cpm.
3.6 Ratio of striation width to crack growth per cycle
The striations from the corrosion fatigue tests were susceptible to corrosion, corroded, or covered in corrosion products as the crack progressed. In order to compare the corresponding crack growth per cycle, some typical striations were selected. Figure 16 shows the ratio of striation width to crack growth per cycle in air. At ΔK = 70 MPa·m0.5, the ratio was very near to 1. The tiny discrepancy could be the result of a misalignment between the orientation of the main crack and the striation formation (Nishikawa et al., 2011). When ΔK was between 25 and 50 MPa·m0.5, the ratio was marginally greater than 1. On the other hand, below 25 MPa·m0.5, the ratio increased sharply with decreasing ΔK, indicating that the crack was dormant prior to each cycle of striation formation and that the dormant period lengthened with decreasing ΔK. The environment had the lowest ratio of 1 Hz, which could be caused by the 400 µm-long secondary cracks (Figures 17A, B). Additionally, it is evident that the primary crack strayed from the predicted crack plane perpendicular to the principal stress. These two facts should lead to cleavage by increasing shear stress. The ratio in the environment was typically less than 1, meaning that each cycle, the crack extension was larger than the striation.
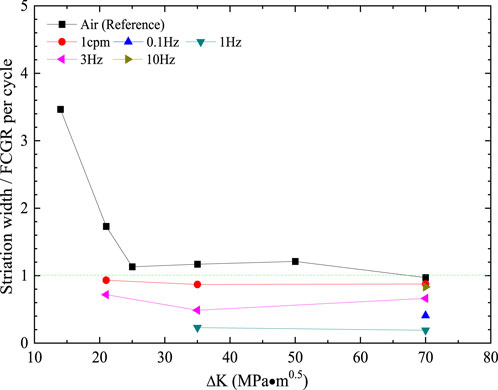
FIGURE 16. Ratio of striation width to macroscopic crack growth per cycle as a function of loading frequency.
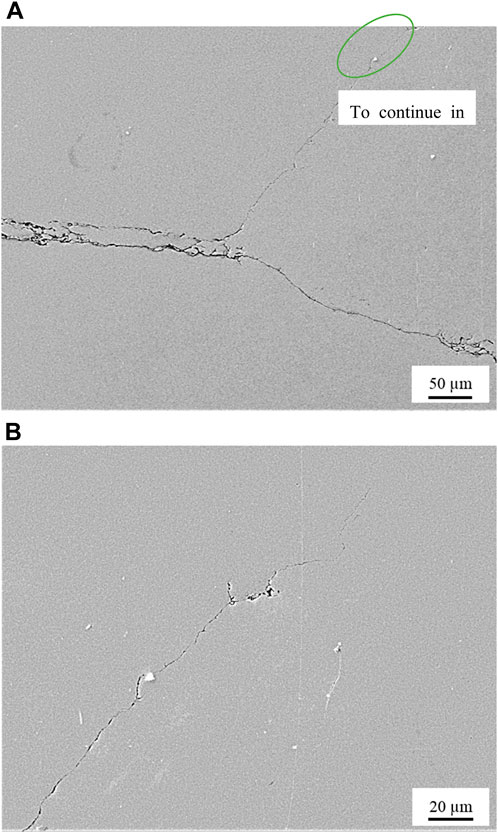
FIGURE 17. (A) Crack path observed on a side surface of the specimen tested at 1 Hz. (B) Detail drawing of the green circle in (A).
3.7 Anodic polarization tests
Following corrosion fatigue tests, the specimens’ surfaces showed pits. Potentiodynamic experiments were therefore carried out to evaluate its pitting potential. The outcome was displayed in Figure 18. The pitting potential was nearly 0.8 V higher than the OCP, at 0.22 V vs. NHE. Nevertheless, the corrosion fatigue test revealed that the pitting persisted. According to Frankel, pitting can occur both above and during active dissolution if specific sample portions are more susceptible and dissolve more quickly than the remainder of the surface (Frankel, 1998). That was not likely, though, for 17-4PH stainless steel with 15%–16% Cr in the absence of outside disturbance. Additionally, the specimen was subjected to an alternate current of 0.20A in order to record the crack growth using the MATELECT ACPD CRACK GROWTH MONITOR CGM-5R. According to a report, stainless steel 304 and 316 may experience corrosion and passivity breakdown when exposed to alternative current (Wendt and Chin, 1984a; Wendt and Chin, 1984b). Therefore, pitting was likely to be induced by the alternative current applied during ACPD measurement. That also suggested that applied current should be reduced to as low value as possible to minimize its effect on test results. The material has demonstrated corrosion sensitivity in tests, which have been studied in highly saline water, especially the effect of cracks on it (Klapper et al., 2012; Faes et al., 2019).

FIGURE 18. Anodic Polarization Curve of modified 17-4PH
4 Conclusion
1. For the three surfaces tested, surfaces 1 and 2 had nearly identical values, while Surface 3 had the lowest value. The much lower hardness of modified 17-4PH was due to the coarsening of Cu-rich precipitates.
2. The degree of environmental acceleration was greatly dependent upon the value of ΔK
3. With decreasing loading frequency and increasing loading ratio, the corrosion fatigue cracking mechanism tended to shift from metal dissolution to hydrogen embrittlement.
4. The ratio of striation width to crack growth per cycle in air was close or above 1, while less than 1 in environment which had the lowest ratio of 1 Hz.
5. Pitting corrosion during corrosion fatigue testing is caused by the alternating current used in the testing.
6. Heat treatment slightly reduced the yield strength and tensile strength but improved the resistance to fatigue and corrosion damage of 17-4PH.
Data availability statement
The original contributions presented in the study are included in the article/supplementary material, further inquiries can be directed to the corresponding author.
Author contributions
ZL: Investigation, Methodology, Project administration, Writing–original draft. MS: Conceptualization, Supervision, Validation, Writing–review and editing. HZ: Data curation, Writing–review and editing. WX: Supervision, Validation, Writing–review and editing. LW: Methodology, Resources, Writing–review and editing.
Funding
The author(s) declare financial support was received for the research, authorship, and/or publication of this article. This work was funded by FUJI-ELECTRIC, the “National Natural Science Foundation of China” (Grant No. 52308271) and “Shenzhen High-level Talents Research Start-up Fund (Grants No. RC2022-004).
Conflict of interest
The authors declare that the research was conducted in the absence of any commercial or financial relationships that could be construed as a potential conflict of interest.
Publisher’s note
All claims expressed in this article are solely those of the authors and do not necessarily represent those of their affiliated organizations, or those of the publisher, the editors and the reviewers. Any product that may be evaluated in this article, or claim that may be made by its manufacturer, is not guaranteed or endorsed by the publisher.
References
Beardmore, P., and Thornton, P. H. (1970). Fatigue fracture in polygrystalline molybdenum. Acta Metall. 18, 109–115. doi:10.1016/0001-6160(70)90074-x
Bo, B. J., and Chen, S. Y. (1988). Secondary cracking during surface crack growth under tensile fatigue loading. Eng. Fract. Mech. 30, 161–167. doi:10.1016/0013-7944(88)90220-2
EPRI (1985). Survey of steam turbine blade failures, EPRI CS-3891. Palo Alto, CA: Electric Power Research Institute.
Faes, W., Lecompte, S., Van Bael, J., Salenbien, R., Bäßler, R., Bellemans, I., et al. (2019). Corrosion behaviour of different steel types in artificial geothermal fluids. Geothermics 82, 182–189. doi:10.1016/j.geothermics.2019.05.018
Frankel, G. S. (1998). Pitting corrosion of metals- A review of the critical factors. J. Electrochem. Soc. 145 (6), 2186–2198. doi:10.1149/1.1838615
Fujii, C. T. (1976). Stress-corrosion cracking properties of 17-4PH steel, stress corrosion-new approaches, ASTM STP 610. Pennsylvania, United States: American Society for Testing and Materials, 213–225.
Hsiao, C. N., Chiou, C. S., and Yang, J. R. (2002). Aging reactions in a 17-4PH stainless steel. Mater. Chem. Phys. 74, 134–142. doi:10.1016/s0254-0584(01)00460-6
Kane, R. D., and Cayard, M. S. (1998). Roles of hydrogen sulfided in the behavior of engineering alloys: a review of literature and experience. CORROSION 98. Paper No. 274.
Klapper, H. S., Baessler, R., Weidauer, K., and Stuerzbecher, D. (2012). Evaluation of suitability of high-alloyed materials for geothermal applications in the north German basin. Corrosion 68, 016001-1–016001-9. doi:10.5006/1.3676631
Laird, C. (1967). The influence of metallurgical structures on the mechanism of fatigue crack propagation. Fatigue Crack. Propag. ASTM STP 415, 131–180.
Mostovoy, S., Crosely, P. B., and Ripling, E. J. (1967). Use of crack-line loaded specimens for measuring plane-strain fracture toughness. J. Mater. 2, 661–681.
Nishikawa, H., Oda, Y., and Noguchi, H. (2011). Investigation of the mechanism for brittle-striation formation in low carbon steel fatigued in hydrogen gas (fractographic observation on fracture processes visualized by controlling load sequence and testing environment): (fractographic observation on fracture processes visualized by controlling load sequence and testing environment). J. Solid Mech. Mater. Eng. 5, 370–385. doi:10.1299/jmmp.5.370
Sakai, Y., Oka, Y., and Kato, H. (2009). The latest geothermal steam turbines. FUJI Electr. Rev. 55 (3), 87–92.
Sakai, Y., Yamashita, M., Shilkawa, K., Niu, L. B., and Takaku, H. (2003). “Corrosion resistance of materials for geothermal steam turbines,” in Proceedings of the International Conference on Power Engineering-03, Saidia, 20 -22 May 2022.
Salinas-Bravo, V. M., and Gonzalezrodriguez, J. G. (1995). Stress corrosion cracking susceptibility of 17-4PH turbine steel in aqueous environments. Br. Corros. J. 30, 77–79. doi:10.1179/000705995798114159
Valdimarsson, P. (2011). Geothermal power plant cycles and main components. Proceedings of short course on geothermal drilling, resource development and power plants. Santa Tecla: EI Salvador, 1–24.
Wang, J., Zou, H., Li, C., Zuo, R. L., Qiu, S. Y., and Shen, B. L. (2006). Relationship of microstructure transformation and hardening behavior of type 17-4PH stainless steel. J. Univ. Sci. Technol. Beijing, Mineral, Metallurgy, Material 13, 235–239. doi:10.1016/s1005-8850(06)60050-9
Wendt, J. L., and Chin, D. T. (1984a). The a.c. corrosion of stainless steel—II. The breakdown of passivity of ss304 in neutral aqueous solutions. Corros. Sci. 25 (10), 889–900. doi:10.1016/0010-938x(85)90019-8
Wendt, J. L., and Chin, D. T. (1984b). The a.c. corrosion of stainless steel—II. The polarization of ss304 and ss316 in acid sulfate solutions. Corros. Sci. 25 (10), 901–915. doi:10.1016/0010-938x(85)90020-4
Keywords: corrosion fatigue, stainless steel, environmental acceleration, hydrogen Embrittlment, ductile striation
Citation: Li Z, Sun M, Zhang H, Xu W and Wu L (2024) Corrosion fatigue performance of modified 17-4PH in simulated geothermal environment. Front. Mater. 11:1342276. doi: 10.3389/fmats.2024.1342276
Received: 21 November 2023; Accepted: 30 January 2024;
Published: 22 February 2024.
Edited by:
Kejin Wang, Iowa State University, United StatesReviewed by:
Chuanqing Fu, Zhejiang University of Technology, ChinaRalph Bäßler, Federal Institute for Materials Research and Testing (BAM), Germany
Copyright © 2024 Li, Sun, Zhang, Xu and Wu. This is an open-access article distributed under the terms of the Creative Commons Attribution License (CC BY). The use, distribution or reproduction in other forums is permitted, provided the original author(s) and the copyright owner(s) are credited and that the original publication in this journal is cited, in accordance with accepted academic practice. No use, distribution or reproduction is permitted which does not comply with these terms.
*Correspondence: Ming Sun, bWluZ3N1bmVuZ2luZWVyQDEyNi5jb20=