 Zhenqing He
 Jun Li
 Juanni Nian2*
 Bowen Guan
94% of researchers rate our articles as excellent or good
Learn more about the work of our research integrity team to safeguard the quality of each article we publish.
Find out more
ORIGINAL RESEARCH article
Front. Mater., 05 February 2024
Sec. Structural Materials
Volume 11 - 2024 | https://doi.org/10.3389/fmats.2024.1340828
This article is part of the Research TopicStatic and Dynamic Performance Analysis of Structures and Materials Under Complex Loads and Environmental ExcitationView all 10 articles
This article intends to study the influence of micro-texture and Vickers hardness on the Polished Stone Value (PSV) of four types of high friction aggregates (90# Bauxite, 75# Bauxite, Basalt, and Granite) during the long-term polishing process. For this purpose, profile roughness, Vickers hardness, and PSV were tested. The relationship between profile roughness, Vickers hardness, and PSV was analyzed with gray correlation analysis and mathematical fitting. The results show that arithmetic mean roughness (Ra) and maximum height (Rz) influenced PSV significantly while root mean square height (Rq), skewness (Rsk), kurtosis (Rku), and load length ratio (Rmr (c)) had a relatively weak effect. Because of the high correlation with PSV, Ra and Rz were chosen as indicators, and the relationship between variables (Ra, Rz) and PSV was established. There is a good linear relationship between the attenuation rate of Ra and Rz per polishing cycle (K1 and K2) and Vickers hardness. Finally, a model of estimation of the polished stone value of high friction aggregate based on micro-texture and Vickers hardness during the long-term polishing process is developed. Measuring the profile roughness and Vickers hardness to obtain Ra, Rz, and H correlation values and substituting them into the modeling equations in this paper can be used for optimal selection and life estimation of high friction aggregates, which belong to the raw materials, and the optimal selection of high friction aggregates will be helpful for the design of wear-resistant coatings, especially for high friction surface treatments.
Wearing course is the top layer of pavement. The surface texture of the wearing course is the key factor affecting the skid resistance of the pavement which is essential to traffic safety (Pranjić et al., 2020; Zhu et al., 2022). Therefore, optimization of surface texture characteristics which have a significant influence on pavement friction is an effective method to increase traffic safety and reduce crashes (Leng et al., 2023). Pavement texture is typically broken up into categories of micro-texture, macro-texture, and mega-texture which are based on wavelength and vertical amplitude characteristics (ISO, 2019). The definitions of the texture categories have been proposed by the Committee on Surface Characteristics of the World Road Association as follows (Henry, 2000). Macro-texture is texture in a pavement with a wavelength ranging from 0.5 to 50 mm. Micro-texture is texture in a pavement with a wavelength ranging from 1 μm to 1 mm. As many previous researches reported, the micro-texture of pavement surface is more important and plays a decisive role in the long-term performance of skid resistance (Gardziejczyk and Wasilewska, 2016; Chen et al., 2020; Jiang et al., 2020; Guo et al., 2021).
Aggregate is the main component of asphalt concrete and an important part of pavement. The micro-texture of aggregate surface has attracted much attention and lots of research has been done. Ge et al. found a certain regularity between aggregate surface texture and wear attenuation (Ge et al., 2018). Ergin et al. analyzed the relationship between aggregate micro-texture and pavement skid resistance (Ergin et al., 2020). Kane reported that there is a close relationship between the mineral composition of aggregates and their anti-slip properties when used in pavements (Kane and Edmondson, 2020). According to previous research results, there is a significant correlation between micro-texture and surface friction (Chen et al., 2022). However, few studies reported the relationship between micro-texture change and surface friction during the long-term polishing process. Hardness is the relative resistance of an aggregate to deformation, and it may have a relationship with surface texture characteristics change during the polishing process (Zong et al., 2021). In summary, up to now the existence of the relationship between aggregate surface texture and skid resistance is more qualitative and lacks quantitative studies as well as accurate model derivation. Secondly, many studies only focus on the parameters related to surface texture, without considering the effect of hardness, so if the PSV of high friction aggregates in the case of long-term polishing is combined with surface friction and Vickers hardness, it will be conducive to the theoretical development of the relevant direction of high friction aggregates.
Polished Stone Value (PSV) is used to evaluate the skid resistance of aggregate. The higher the PSV, the better the skid resistance of aggregate (Descantes and Hamard, 2015). With the passage of time, the surface texture of the aggregate in the wear-resistant layer of the pavement is susceptible to abrasion by round-trip traffic, resulting in a gradual reduction of the skid resistance to an equilibrium value. In addition to the polished stone value (PSV), a number of methods have been used to determine the polishing properties of aggregates, such as the petrography counting approach, mechanical polishing test methods, and image analysis techniques. However, PSV is more widely used, and the polishing resistance of coarse aggregates used for pavements is usually quantified by the Polished Stone Value (PSV) uniform test method in Europe (Slimane et al., 2008; Huang, 2010; Descantes and Hamard, 2015). Profile roughness is often used to describe surface texture (Praticò and Astolfi, 2017). The Vickers test is a suitable method that could quantify the hardness of aggregates and is more convenient to use than other hardness tests (Liu et al., 2020). Therefore, this article explores the influence of profile roughness and Vickers hardness on the Polished Stone Value (PSV) of four high-friction aggregates (90# Bauxite, 75# Bauxite, Basalt, and Granite) during different polishing cycles. It investigates the relationship between profile roughness, Vickers hardness, and PSV, using gray correlation analysis and mathematical fitting methods to understand their impact patterns. Ultimately, it establishes a model to estimate the Polished Stone Value of high-friction aggregates.
Bauxite, granite, and basalt with the size of 9.5/13.2 mm were used to study the surface morphology, hardness, and anti-polishing in this study. Bauxite is was provided by Yangquan Co., Ltd. According to the dosage of Al2O3, there are two kinds of bauxite which are 90# and 75#, respectively. Chemical compositions of four kinds of aggregates are shown in Table 1 and their physical properties are shown in Table 2.
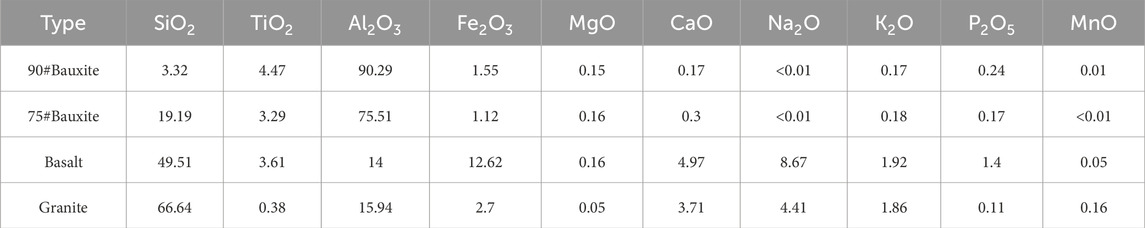
TABLE 1. Chemical composition of aggregates (%).
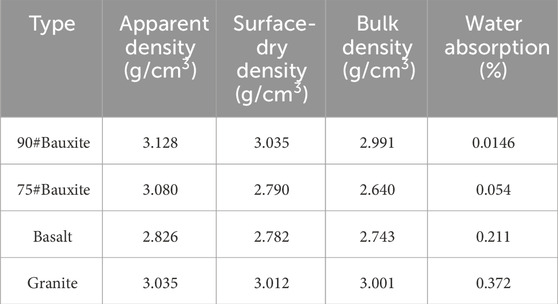
TABLE 2. Physical properties of aggregates.
The PSV test was carried out with an Accelerated Polishing Machine according to the literature (Guan et al., 2018). Four types of PSV specimens are shown in Figure 1. The polishing velocity was 320 ± 5 r/min and the load was 725 ± 10N. Then 40000, 80000, 120000,160000, and 200000 cycles of polishing with emery flour were followed. The specimen polish degree was measured by a British Pendulum device. Each test group was repeated six times to acquire the reliable value of PSV.
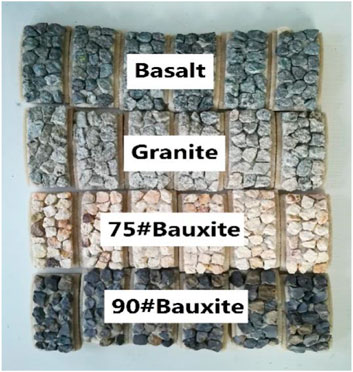
FIGURE 1. Four types of PSV specimens.
In this experiment, the micro-texture profile was observed by a 3D color laser microscope which was produced by Keyence Inc. The scanning range was 500 × 700μm, scanning resolution was 0.01 µm. Five stone surfaces of each specimen were obtained to reduce acquisition error. Besides, each stone has been tested three times in an attempt to improve the accuracy of the data and avoid excessive discretization results. Figure 2 illustrates microscopy and its 3D profile of four aggregates. The 3D surface topography images illustrate that 90# bauxite and granite have excellent surface microstructure; the micro-roughness of basalt shows poorly. Although the 75# bauxite looks more flat under the microscope, it still has a lot of small and dense micro-texture.
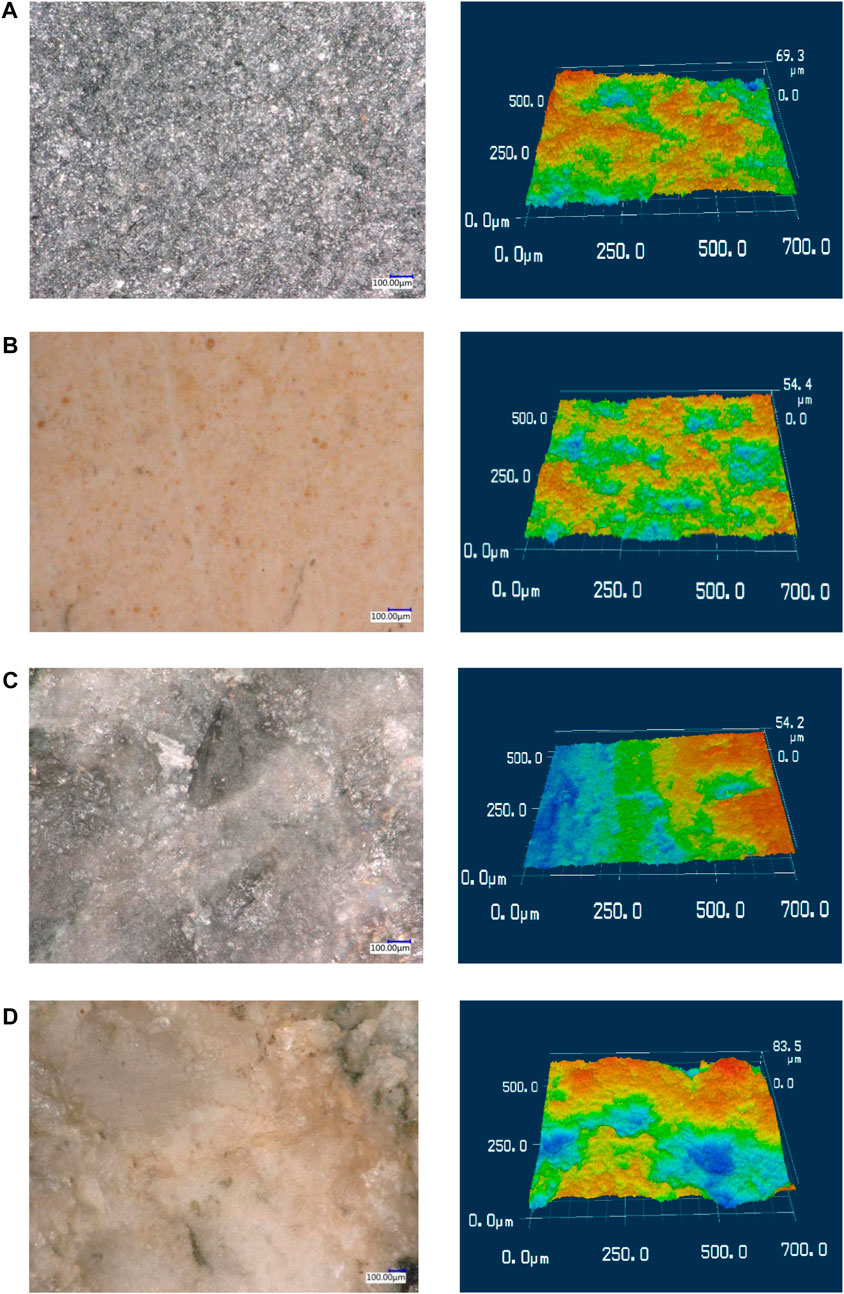
FIGURE 2. Four aggregates under laser microscopy and its 3D profile (A) 90#Bauxite (B) 75#Bauxite (C) Basalt (D) Granite.
In order to measure the degree of change in the microscopic texture of aggregate, there are a total of six typical roughness parameters being chosen as indicators. The profile roughness parameters are obtained by VK-Analyzer software of a 3D color laser microscope. The six profile roughness parameters include arithmetic mean roughness (Ra), maximum height (Rz), root mean square height (Rq), skewness (Rsk), kurtosis (Rku), and load length ratio (Rmr (c)), as shown in Table 3.
1) Arithmetic mean roughness (Ra) indicates the average of the absolute height value along the reference length. Ra calculation determines the absolute value of the height difference between the reference surface and the measured surface, and then calculates the average of the distance between each dot on the roughness curve surface and the reference surface, which is illustrated in Figure 3.
2) Maximum height (Rz) indicates the absolute vertical distance between the highest peak and the deepest valley along the reference length, which is illustrated in Figure 4.
3) Root mean square height (Rq) indicates the root mean square along the reference length, which is illustrated in Figure 5.
4) Skewness (Rsk) uses the cube of the root mean square height to display the dimensionless cube of the reference length Z(x), which represents the degree of symmetry of the surface heights about the mean plane.
5) Kurtosis (Rku) uses the fourth power of the root mean square height to display the dimensionless fourth power of the reference length Z(x), which describes the kurtosis and steepness of texture, it indicates the nature of the height distribution.
6) Load length ratio (Rmr (c)) shows the ratio of the load length Mr (c) of profile curve elements to the evaluation length at cut level c (height in % or μm), which is illustrated in Figure 6.
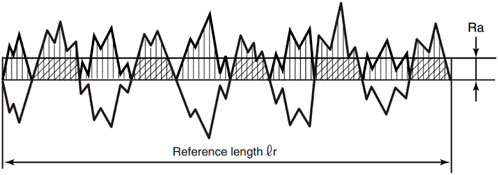
FIGURE 3. Illustration of Ra.
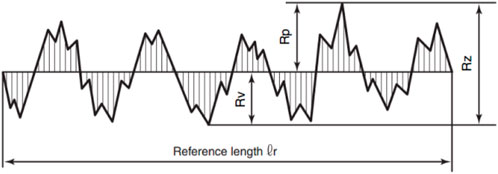
FIGURE 4. Illustration of Rz.
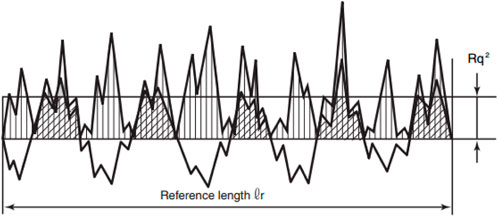
FIGURE 5. Illustration of Rq.
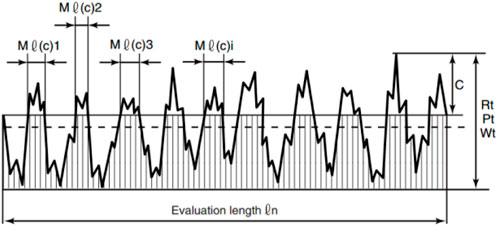
FIGURE 6. Illustration of Rmr(c).
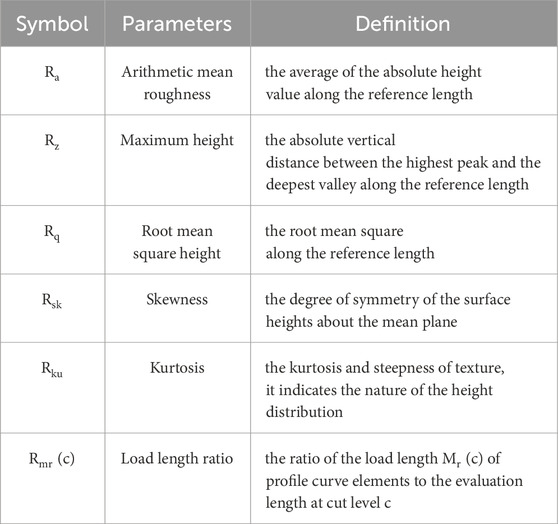
TABLE 3. Roughness parameters.
The Vickers hardness test was carried out according to ASTM E92-2016 (ASTM E92-2016, 2023). Tests with Vickers hardness testers manufactured by Mega (Suzhou) Co., Ltd. The Vickers hardness is obtained by Eq. 7.
Where H is Vickers hardness (Hv), F is the force applied to the diamond (kgf), d is the average length of the diagonal left by the indenter (mm).
Gray correlation analysis is one of the most widely used models of Grey system theory (Dews and Bishop, 2007). Gray correlation analysis has been used in many fields such as engineering, financial, physical, etc (Deng, 1989; Zhu et al., 2021; Cao et al., 2022; Gosavi and Jaybhaye, 2023). Grey correlation analysis is a suitable mathematical method for researching the correlation with each factor (Li et al., 2023). The polishing process of aggregate is complex, and profile roughness parameters are multiple and interdependent (Wang et al., 2017). The Gray correlation coefficient was adopted to describe the correlation degree between the profile roughness parameters and PSV. A higher gray correlation coefficient shows good corresponding to a correlation degree. The calculation of the Gray correlation coefficient is generally divided into the following four steps:
(1) With the intention of evaluating the significance of each factor, PSV was extracted to determine the reference sequence, X0(k). In addition, the other parameters (Ra, Rq, Rz, Rsk, Rku, Rmr(c)) which were selected on the basis of original data, were specified as comparison sequence, Xi(k); where k = 1,2,3 … … , m.
(2) To eliminate the effect of differences in data between the reference sequence and comparison sequences, the dimensionless treatment of initial values was normalized by Eq. 8.
(3) In order to obtain the maximum absolute difference and the minimum absolute difference, Eqs 9, 10 could be used to calculate for each sequence. Afterwards, the gray correlation coefficient ξ was calculated by Eq. 11.
Where, ρ is the distinguishing coefficient (0<ρ < 1); ρ = 0.5.
(4) In accordance with the results above, the average value of the correlation coefficient Ri could be calculated by Eq. 12:
Profile roughness parameters and PSV of four types of aggregates during different polishing cycles are illustrated in Table 3. The gray correlation coefficient is calculated in four steps. At first, the original data of each factor including Ra, Rq, Rz, Rsk, Rku, and PSV was summarized in Table 4. Then, the initial value is normalized after dimensionless processing, and the results are shown in Table 5. The absolute difference between X0 and Xi was obtained and shown in Table 6. Thirdly, the minimum differential and maximum differential are also calculated and shown in Table 7. After these steps, the correlation coefficient
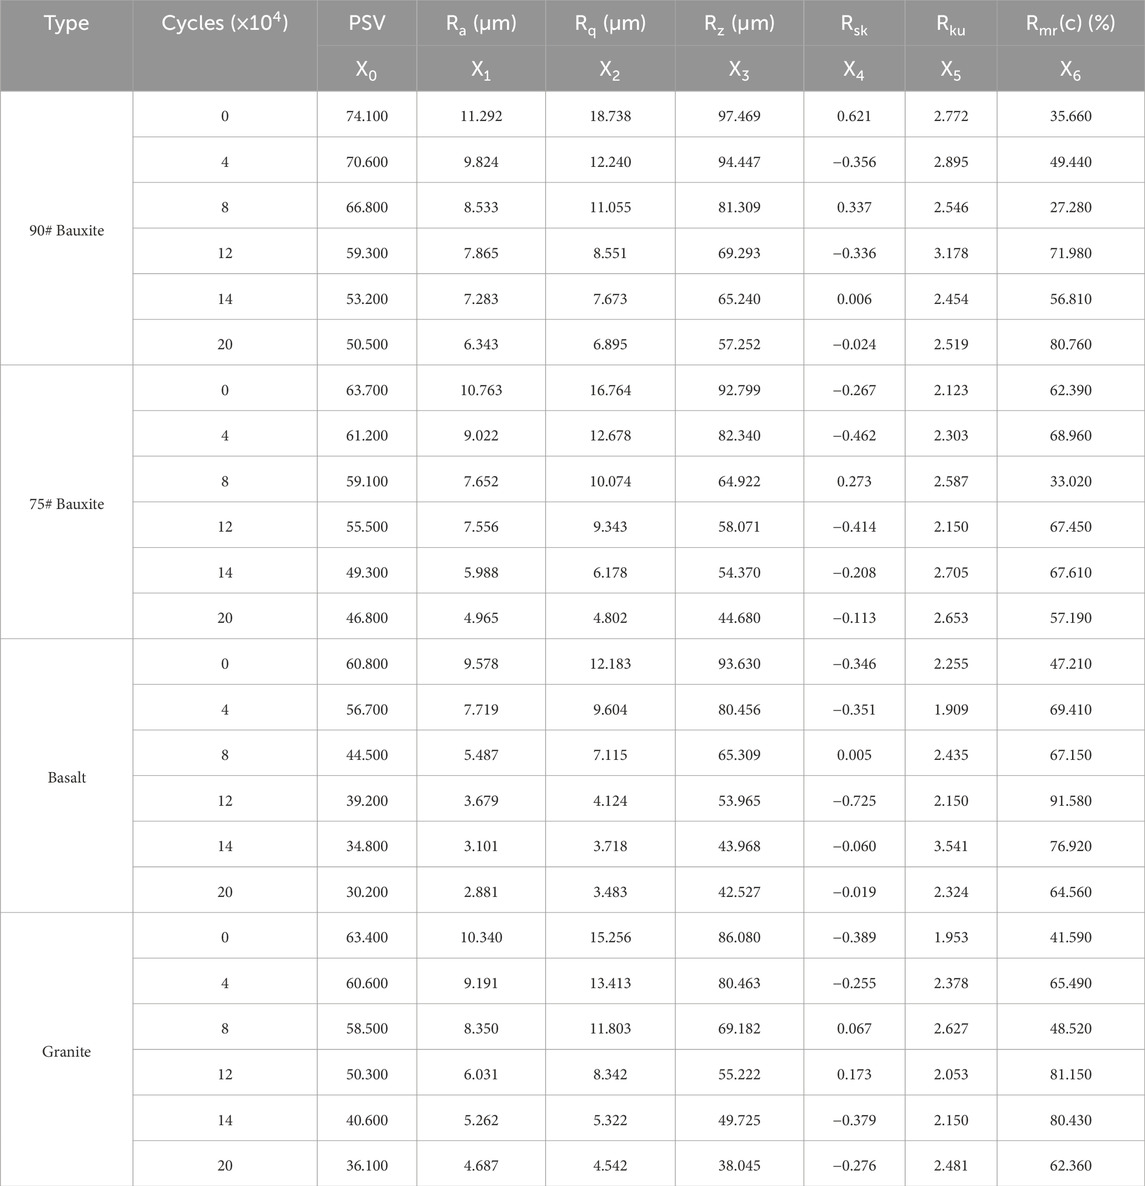
TABLE 4. Original data of each factor.
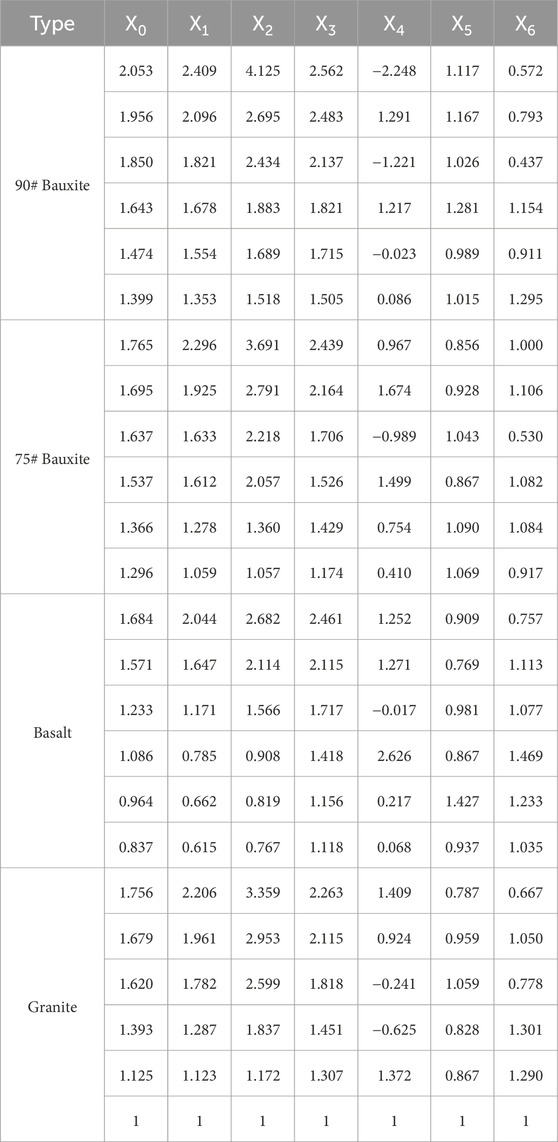
TABLE 5. Data Initialization for each factor.
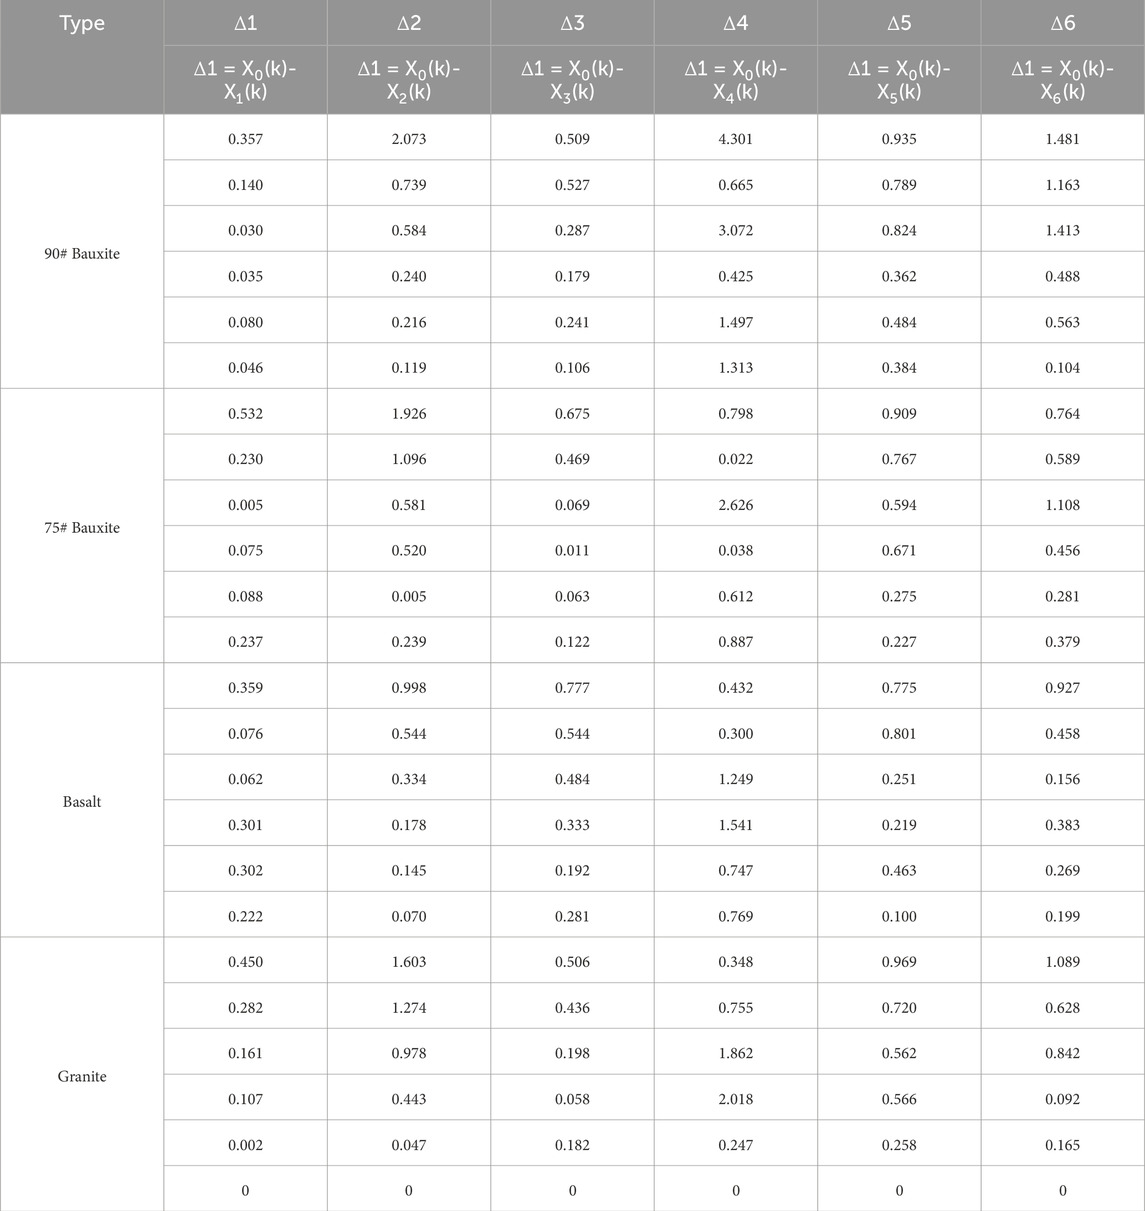
TABLE 6. The absolute differential value of X0 with Xi.

TABLE 7. The minimum and the maximum differential value of X0 with Xi.
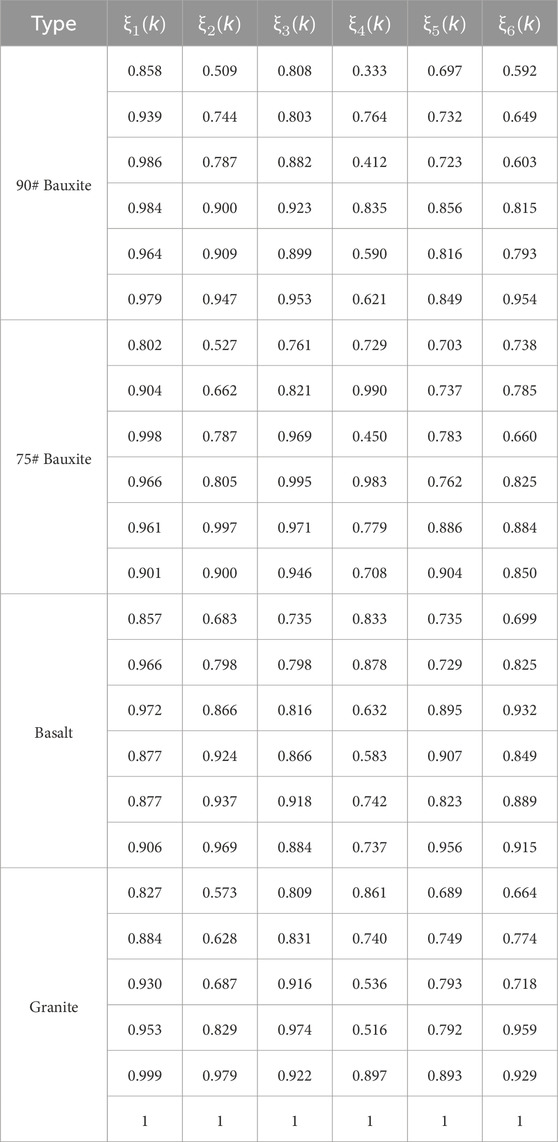
TABLE 8. The correlation coefficient
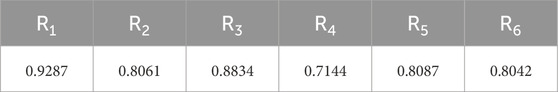
TABLE 9. The grey correlation degree between roughness parameters and PSV.
Table 4 shows that the change rule of four kinds of aggregates is basically the same. As the polishing time increases, the values of PSV, Ra, and Rz decrease, which proves that the changes of these two parameters (Ra, Rz) have a certain correlation with PSV.
According to the results of gray correlation analysis in Table 9, the sequence of six factors is Ra > Rz > Rku > Rmr(c)> Rq > Rs. Ra has the maximum correlation degree with PSV (R1 = 0.929). The correlation degree of Rz is the second largest indicator. The decreasing tendency of the values Ra and Rz could well represent the decay trend of PSV. The value of PSV increased with the increase of Ra and Rz. It indicates that high arithmetic mean roughness and maximum height of the surface is beneficial to the PSV of aggregates. Polishing cycles have a great effect on the PSV of aggregates. With the increase in polishing cycles, the value of Ra, Rz, and Rq decreased. The micro-texture of the surface is destroyed and friction decreases significantly.
The link between roughness parameters and PSV is multiple and difficult to characterize due to such numerous profile roughness parameters. Therefore, fewer parameters need to be selected depending on the correlation degrees between profile roughness parameters and PSV. Moreover, the result of gray correlation entropy indicates that it is difficult to describe the relationship between micro-texture and the polishing resistance of aggregates using only a single parameter. It requires several parameters together to characterize the micro-texture of the surface for describing the relationship between micro-texture and the polishing resistance of aggregates. Because of the high correlation with PSV, Ra, and Rz are chosen as the main indicators.
The relationship between these variables (Ra and Rz) and PSV were analyzed with mathematical fitting by origin 8.0, and the independent variables of the multivariate regression model were established in three variables called Ra and Rz, which is presented as Eq. 13. The correlation coefficient of determination R2 = 0.912. The results of the F-Test are shown in Table 10. Based on the analysis the following model was obtained (F theoretical << F observed) relating PSV with Ra and Rz. Results of the t-Test are summarized in Table 11. All p-values are less than 0.01. F-tests and t-tests are conventional methods of accuracy testing, and their results point to a high degree of accuracy of the model. Therefore, it can be concluded that the relationship between PSV and independent variables is linear for all models.
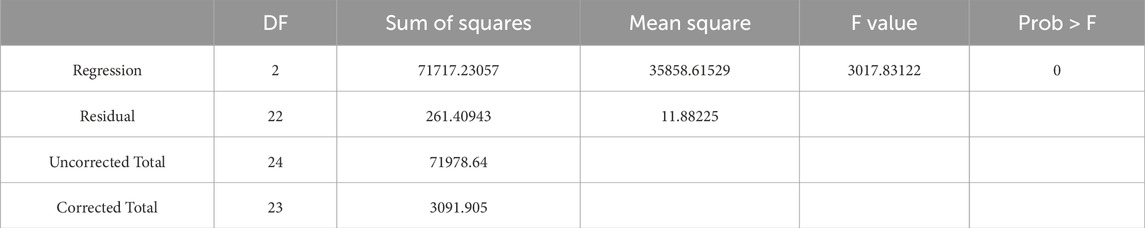
TABLE 10. Model F-test results.
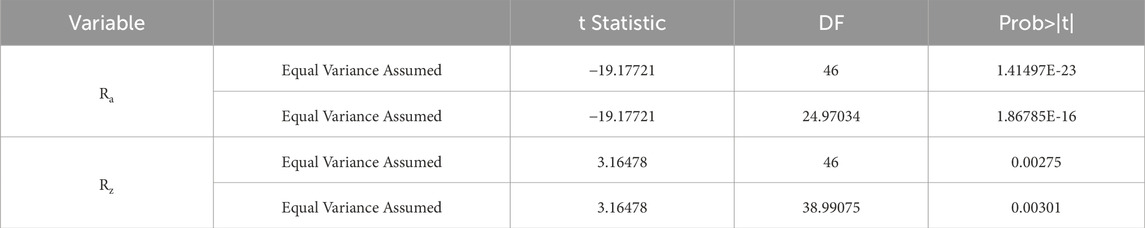
TABLE 11. t-Test Results.
Figure 7 shows the good linear relationship between Ra and polishing cycles. The relationship between Ra and polishing cycles can be described by Eq. 14.
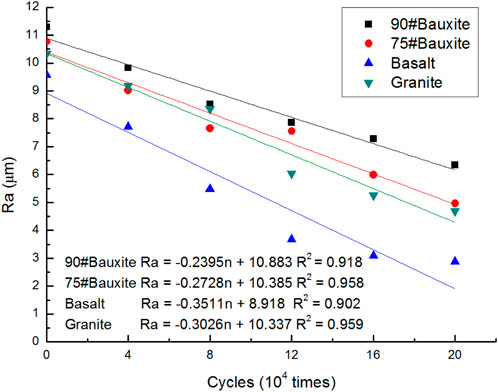
FIGURE 7. Correlation between Ra and polishing cycles.
Where Ra is arithmetic mean roughness (μm), n is polishing cycles (times), Rai is the initial value of Ra (μm), and K1 is the attenuation rate of Ra per polishing cycle (um/times).
There is a certain relationship between K1 and Vickers Hardness. The correlations between K1 and Vickers hardness are shown in Figure 8. From Figure 8, it can be seen that the correlation coefficient of the linear fitted equation is 0.9423, which shows the good correlation between K1 and Vickers hardness. Thus, K1 can be obtained by Eq. 15.
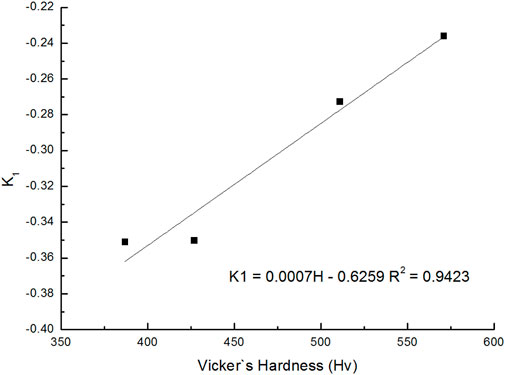
FIGURE 8. Correlation between K1 and vickers hardness.
Where H is Vickers hardness of aggregate (Hv).
With Eqs 14, 15, Ra can be determined through Eq. 16
Figure 9 shows the good linear relationship between Rz and polishing cycles. The relationship between Rz and polishing cycles can be described by Eq. 17.
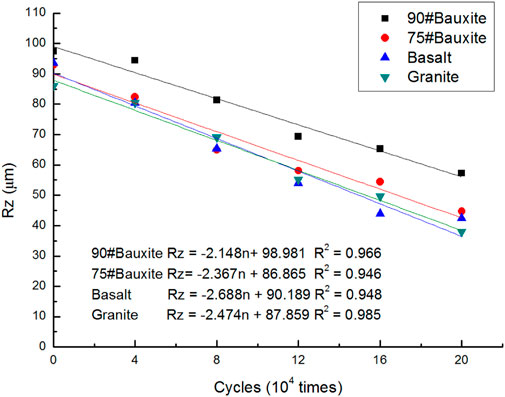
FIGURE 9. Correlation between Rz and polishing cycles.
Where Rz is maximum height (μm), n is polishing cycles (times), Rai is the initial value of Rz (μm), and K2 is the attenuation rate of Rz per polishing cycle (μm/times).
There is a certain relationship between K2 and Vickers Hardness. The correlations between K2 and Vickers Hardness are shown in Figure 10. From Figure 10, it can be seen that the correlation coefficient of the linear fitted equation is 0.917, which shows the good correlation between K2 and Vickers hardness. Thus, K2 can be obtained by Eq. 18.
Where H is Vickers hardness of aggregate (Hv).
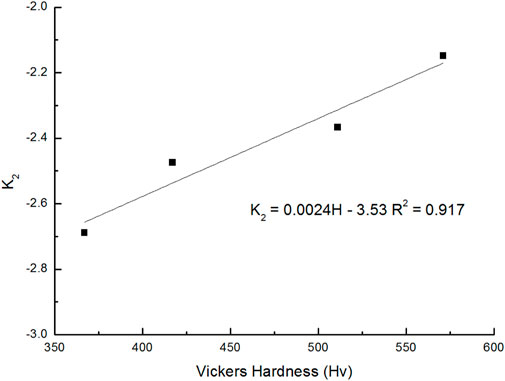
FIGURE 10. Correlation between K2 and vickers hardness.
With Eq. 17 and Eq. 18 Rz can be determined through Eq. 19:
In the above mathematical derivation procedure from Eq. 14–19, it is easy to find that the absolute value of K1 and K2 decreased with the increase of Vickers Hardness. It indicates that the high Vickers hardness of aggregates can stabilize the micro-texture of aggregates and retard the frictional attenuation during the long-term polishing process.
From Eqs 13–19, the link between surface profile roughness, hardness, and PSV can be obtained as follows:
Where Rai, Rzi, and H are the basic parameters, which can be obtained by profile roughness measurement and Vickers hardness test. According to these test results, the basic parameters of Bauxite, Basalt, and Granite are shown in Table 12.
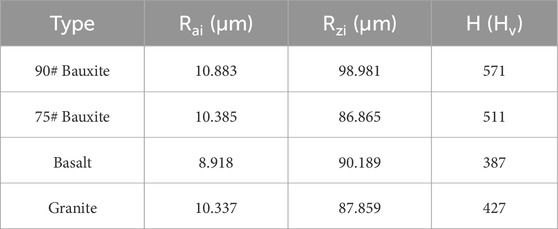
TABLE 12. Basic parameters in calculation model.
The proposal indicators in the regression could well instruct the selection of high friction aggregates so that a practical method that could improve the ability of pavement skid resistance is obviously reported in the further study. Aggregate friction life also can be predicted by this regression, which may contribute to the service life estimation and condition prediction of the wearing course, especially high friction surface treatment.
(1) The influence of profile roughness parameters of four types of aggregates was calculated by gray correlation analysis. According to the analysis results, Ra and Rz influenced PSV significantly while Rq, Rsk, Rku, and Rmr (c) had a relatively weak effect.
(2) The relationship between the variables (Ra, Rz) and PSV was established. The higher the values of Ra and Rz, the more favorable the PSV of the aggregate; there is a good linear relationship between Ra and Rz attenuation rates (K1 and K2) and Vickers hardness. The higher the Vickers hardness, the more stable the microtexture of the aggregate and the less frictional attenuation during polishing.
(3) Based on microtexture and Vickers hardness, a multiple regression model was developed for estimating the PSV of high-friction aggregates during long-term polishing.
The raw data supporting the conclusion of this article will be made available by the authors, without undue reservation.
ZH: Data curation, Investigation, Writing–original draft, Writing–review and editing. JL: Methodology, Project administration, Resources, Writing–original draft. JN: Data curation, Software, Writing–review and editing. BG: Formal Analysis, Supervision, Writing–review and editing.
The author(s) declare financial support was received for the research, authorship, and/or publication of this article. Natural Science Foundation of Qinghai Province (No. 2021-ZJ-765).
The authors gratefully acknowledge the financial support from the Natural Science Foundation of Qinghai Province (No. 2021-ZJ-765).
The authors declare that the research was conducted in the absence of any commercial or financial relationships that could be construed as a potential conflict of interest.
All claims expressed in this article are solely those of the authors and do not necessarily represent those of their affiliated organizations, or those of the publisher, the editors and the reviewers. Any product that may be evaluated in this article, or claim that may be made by its manufacturer, is not guaranteed or endorsed by the publisher.
ASTM E92-2016 (2023). Standard test methods forVickers hardness and KnoopHardness of metallic materials.
Cao, W., Xuan, X. D., Wu, We.D., Chen, L. H., and Zhang, Q. Y. (2022). A new method for determining the optimal adaptive thermal comfort model with grey relational analysis. Build. Environ. 221, 109277. doi:10.1016/j.buildenv.2022.109277
Chen, D., Han, S., Ye, A. J., Ren, X. C., Wang, W., and Wang, T. T. (2020). Prediction of tire-pavement friction based on asphalt mixture surface texture level and its distributions. Road. Mater. Pavement Des. 21 (6), 1545–1564. doi:10.1080/14680629.2018.1560354
Chen, S. Y., Liu, X. Y., Luo, H. Y., Yu, J. M., Chen, F. D., Zhang, Y., et al. (2022). A state-of-the-art review of asphalt pavement surface texture and its measurement techniques. J. Road. Eng. 2 (2), 156–180. doi:10.1016/j.jreng.2022.05.003
Deng, J. L. (1989). Introduction to grey system theory. J. Grey. Syst. 1 (1), 1–24. doi:10.1007/978-3-642-16158-2_1
Descantes, Y., and Hamard, E. (2015). Parameters influencing the polished stone value (PSV) of road surface aggregates. Constr. Build. Mater. 100, 246–254. doi:10.1016/j.conbuildmat.2015.10.002
Dews, S. J., and Bishop, R. J. (2007). Factors affecting the skid-resistance of calcined bauxite. Chem. Technol. Biotechnol. Biotechnol. 22 (10), 1117–1124. doi:10.1002/jctb.5020221009
Ergin, B., Gökalp, İ., and Uz, V. E. (2020). Effect of aggregate microtexture losses on skid resistance: laboratory-based assessment on chip seals. Mater. Civ. Eng. 32 (4), 04020040. doi:10.1061/(asce)mt.1943-5533.0003096
Gardziejczyk, W., and Wasilewska, M. (2016). Evaluation of microtexture changes of coarse aggregate during simulated polishing. Arch. Civ. Eng. 62 (2), 19–34. doi:10.1515/ace-2015-0062
Ge, H. T., Sha, A. M., Han, Z. Q., and Xiong, X. W. (2018). Three-dimensional characterization of morphology and abrasion decay laws for coarse aggregates. Constr. Build. Mater. 188, 58–67. doi:10.1016/j.conbuildmat.2018.08.110
Gosavi, S. V., and Jaybhaye, M. D. (2023). Friction stir welding process optimization of Al 7075/SiC composites using grey relational analysis. Mater. Today Proc. 72 (3), 719–723. doi:10.1016/j.matpr.2022.08.493
Guan, B. W., Wu, J. Y., Xie, C., Fang, J. H., Zheng, H. L., and Chen, H. (2018). Influence of macrotexture and microtexture on the skid resistance of aggregates. Adv. Mater. Sci. Eng. 2018 (5), 1–9. doi:10.1155/2018/1437069
Guo, F. C., Pei, J. Z., Zhang, J. P., Li, R., Zhou, B. C., and Chen, Z. X. (2021). Study on the skid resistance of asphalt pavement: a state-of-the-art review and future prospective. Constr. Build. Mater. 303, 124411. doi:10.1016/j.conbuildmat.2021.124411
Henry, J. J. (2000). National cooperative highway research program. Washington, D.C. Transportation Research Board. Evaluation of Pavement Friction Characteristics. Synthesis of Highway Practice No.291.
Huang, C. Y. (2010). Texture characteristics of unpolished and polished aggregate surfaces. Tribol. Int. 43 (1-2), 188–196. doi:10.1016/j.triboint.2009.05.024
ISO, Characterization of pavement texture by use of surface profiles, part 1: determination of mean profile depth. 2019, 43.
Jiang, W., Yuan, D. D., Shan, J. H., Ye, W. L., Lu, H. H., and Sha, A. M. (2020). Experimental study of the performance of porous ultra-thin asphalt overlay. Int. J. Pavement Eng. 6, 2049–2061. doi:10.1080/10298436.2020.1837826
Kane, M., and Edmondson, V. (2020). Long-term skid resistance of asphalt surfacings and aggregates’ mineralogical composition: generalisation to pavements made of different aggregate types. Wear 454-455, 203339. doi:10.1016/j.wear.2020.203339
Leng, Z., Fan, Z. P., Liu, P. F., Kollmann, J., Oeser, M., Wang, D. W., et al. (2023). Texturing and evaluation of concrete pavement surface: a state-of-the-art review. J. Road. Eng. 3 (3), 252–265. doi:10.1016/j.jreng.2023.08.001
Li, B., Liu, P. Y., Zhao, Y., Li, X. M., and Cao, G. (2023). Effect of graphene oxide in different phases on the high temperature rheological properties of asphalt based on grey relational and principal component analysis. Constr. Build. Mater. 362, 129714. doi:10.1016/j.conbuildmat.2022.129714
Liu, J. Y., Guan, B. W., Chen, H. X., Liu, K. P., Xiong, R., and Xie, C. (2020). Dynamic model of polished stone value attenuation in coarse aggregate. Materials 13 (8), 1875. doi:10.3390/ma13081875
Pranjić, I., Deluka-Tibljaš, A., Cuculić, M., and Šurdonja, S. (2020). Influence of pavement surface macrotexture on pavement skid resistance. Transp. Res. Procedia. 45, 747–754. doi:10.1016/j.trpro.2020.02.102
Praticò, F. G., and Astolfi, A. (2017). A new and simplified approach to assess the pavement surface micro- and macrotexture. Constr. Build. Mater. 148, 476–483. doi:10.1016/j.conbuildmat.2017.05.050
Slimane, A. B., Khoudeir, M., Brochard, J., and Do, M. T. (2008). Characterization of road microtexture by means of image analysis. Wear 264 (5-6), 464–468. doi:10.1016/j.wear.2006.08.045
Wang, Y. R., Gao, Y. M., Sun, L., Li, Y. F., Zheng, B. C., and Zhai, W. Y. (2017). Effect of physical properties of Cu-Ni-graphite composites on tribological characteristics by grey correlation analysis. Results Phys. 7, 263–271. doi:10.1016/j.rinp.2016.12.041
Zhu, L. H., Zhao, C., and Dai, J. (2021). Prediction of compressive strength of recycled aggregate concrete based on gray correlation analysis. Constr. Build. Mater. 273, 121750. doi:10.1016/j.conbuildmat.2020.121750
Zhu, S. Y., Ji, X. P., Zhang, Z. M., Shao, D. Y., Li, H. L., and Yun, C. (2022). Evolution characteristics of the surface texture of the wearing course on asphalt pavement based on accelerated pavement polishing. Constr. Build. Mater. 333, 127266. doi:10.1016/j.conbuildmat.2022.127266
Keywords: wearing course, aggregates, micro-texture, vickers hardness, polished stone
Citation: He Z, Li J, Nian J and Guan B (2024) Experimental analysis and modeling of micro-texture and vickers hardness impact on polished stone value in high-friction aggregates. Front. Mater. 11:1340828. doi: 10.3389/fmats.2024.1340828
Received: 19 November 2023; Accepted: 11 January 2024;
Published: 05 February 2024.
Edited by:
Abdelmoumen Anis Bousahla, University of Sidi-Bel-Abbès, AlgeriaReviewed by:
Tao Ma, Southeast University, ChinaCopyright © 2024 He, Li, Nian and Guan. This is an open-access article distributed under the terms of the Creative Commons Attribution License (CC BY). The use, distribution or reproduction in other forums is permitted, provided the original author(s) and the copyright owner(s) are credited and that the original publication in this journal is cited, in accordance with accepted academic practice. No use, distribution or reproduction is permitted which does not comply with these terms.
*Correspondence: Jun Li, SnVuX2xpMTk5MkAxNjMuY29t; Juanni Nian, MjQ5MzY0MDY3QHFxLmNvbQ==
Disclaimer: All claims expressed in this article are solely those of the authors and do not necessarily represent those of their affiliated organizations, or those of the publisher, the editors and the reviewers. Any product that may be evaluated in this article or claim that may be made by its manufacturer is not guaranteed or endorsed by the publisher.
Research integrity at Frontiers
Learn more about the work of our research integrity team to safeguard the quality of each article we publish.