 Donghai Huang
 Huajie Shen
 Jilin Zhang3
95% of researchers rate our articles as excellent or good
Learn more about the work of our research integrity team to safeguard the quality of each article we publish.
Find out more
ORIGINAL RESEARCH article
Front. Mater. , 18 June 2024
Sec. Mechanics of Materials
Volume 11 - 2024 | https://doi.org/10.3389/fmats.2024.1278707
In order to study the bending properties of tropical tree species rich in organic extracts, the effects of temperature and time on the bending performance of hydrothermal treatment were investigated. The effects of power and time on bending performance under microwave heating conditions were investigated. It is found that the chemical composition does not undergo obvious degradation at 80°C–100°C, and the bending performance gradually becomes better with the increase in heating time; when the hydrothermal time exceeds 4 h, the bending performance varies with heating time. The growth is better than the difference, reaching the maximum at 4 h. When the water temperature is 140°C, the bending performance is negatively correlated with the heating time. When the hydrothermal treatment time is the same, the bending property becomes better as the temperature increases. The most reasonable process for microwave softening heating is with a power of 480 W and a heating time of 4 min. A softening treatment method combining water heat and microwave can achieve a better softening effect. When the final moisture content is controlled to 8%, the bending setting effect is the best. The optimum drying time is 6 h, and the optimum drying temperature is 50°C.
In the wood industry, there are three common ways to obtain wooden curved parts: glue veneer to bend, saw solid wood, and solid wood bending. In the mid-19th century, Micheal Thonet used the cooking softening pretreatment, heat drying, and fixing processes to make solid wood curved members, making the world’s first curved wood chair (Peck, 1957; Stevens and Turner, 1970; Barros et al., 2011). At the beginning of the 20th century, Japan introduced, explored, and enriched solid wood bending technology (Norimoto, 1979; Norimoto et al., 1980; Norimoto, 1983; Norimoto and Gril, 1989; Norimoto et al., 1993; Makinaga et al., 1997; Uhmeier et al., 1998; Kweonhwan Hwang and Lee, 2012). In China, in the early days, the softening of wood was mainly achieved by the method of fire roasting. After that, the industrial production of curved wood began, and many scholars enriched the wood bending technology (Dong et al., 2021; Hiroshi and Makoto, 2021; Suo-ling, 2021; Wu et al., 2022; Mikšik et al., 2023; Schober et al., 2023; Nop et al., 2024; Qin et al., 2024; Zh and Sakhvadze, 2024). The main process of solid wood bending is softening, bending, and shaping. It is usually made of wood with no defects on the surface, straight texture, and uniform material (Peck, 1957; Kweonhwan Hwang and Lee, 2012).
Softening methods are mainly divided into physical and chemical methods. The former mainly includes boiling (Matsuo-Ueda et al., 2023; Zhang et al., 2023), steaming (Cao et al., 2023; Yao et al., 2023), microwave (Norimoto, 1979; Norimoto et al., 1980; Norimoto and Gril, 1989; Ganguly et al., 2021; Mascarenhas FJR. et al., 2023; Mascarenhas F. et al., 2023; Mascarenhas et al., 2024), and high-frequency heating methods (Norimoto and Gril, 1989). The latter mainly utilizes alkaline reagents such as liquid ammonia, sodium hydroxide, and strong potassium oxide degrade or wet wood (Broda and Hill, 2021; Yona et al., 2021; Graf et al., 2024). The boiling and steaming methods mainly make water molecules enter the non-crystalline area of the wood and combine with the free hydroxyl groups, increasing the gap between the molecules and providing sufficient space for the thermal motion of the molecules (Zhang et al., 2023). The glass transition temperature of wet wood will decrease (Cao et al., 2023), which means that in hydrothermal softening, the higher the medium temperature and the longer the holding time, the better the softening effect of the wood. However, when the threshold value is exceeded, the chemical composition of the wood will be degraded, resulting in the deterioration of mechanical properties of wood. Therefore, the hydrothermal softening method requires the control of treating temperature and time. The microwave heating softening method enables the wood to generate heat from the inside in a short time; the steam pressure inside the wood increases, and the moisture moves from the inside to the outside in the form of steam (Norimoto, 1979). Compared with hydrothermal softening treatment, the microwave softening method has low energy consumption and high economic efficiency. Although the permeability, chemical composition, and microstructure of the wood after microwave irradiation treatment are affected to some extent, the permeability and the density of wood are increased, and there has been a decline. Liu et al. (2009) considered that the elastic recovery of curved wood was positively correlated with the final moisture content (MC) (Sharma et al., 1988). When bending rubber wood, the 100 °C hydrothermal treatment for 2 h was the most suitable, and the optimal placement time was 2 h. The best final MC was 9.8%. Jiang and Lv (2014) believed that increasing the temperature or increasing the MC of wood could shorten the time required to soften hemicellulose and lignin (Wardrop, 1946). Microwave heating occurs inside the sample, the rate of complete softening is very fast, the temperature is easy to control, and the effect is more obvious for samples with longer pretreatment time and longer cooking time (Norimoto and Gril, 1989). The wood surface temperature increases with the heating time under different microwave heating powers, and the wood MC decreases with the prolongation of the heating time (Zh and Sakhvadze, 2024). Li (1998) believed that the optimum softening effect could be achieved with ash at 60% MC, a microwave heating power of 400 W, and a microwave heating time of 2.5 min. (Wardrop, 1951). Immersing wood in 20%–50% ammonia water at a temperature of 18°C–20°C for a period of time can increase the plasticity (Broda and Hill, 2021). Sharma (1988) considered that it is not appropriate to use water-heat-softened and curved tree species, which can be successfully bent by softening treatment using gas ammonia (Krech, 1960). The chemical softening method has higher requirements on equipment, a higher compounding cost, and a greater environmental impact.
The wood is softened, and then, a load was applied to bend. When bent, the convex surface of the test piece was pulled, and the concave surface was pressed. The use of a thin steel plate in the convex surface helps neutralize the convex and concave forces and improve the bending properties of the wood. Dadswell considered the microstructure of wood affected by mechanical strain. When the wood is subjected to minor compression damage or impact with lower impact strength, the sliding surface of the wood cell wall will cause the cell wall to lose its connection (Takahashi, 1968; Bekhta and Niemz, 2003). Krech (1960) believes that the maximum stress of wood is proportional to the logarithm of the bending rate (Hillis and Rozsa, 1985). The degree of deflection is independent of the bending speed and increases slightly with the increase in the load duration.
The shaping of wood is the process of releasing the residual stress inside the wood during bending (Zh and Sakhvadze, 2024), which is mainly divided into conventional drying (Hill et al., 2021; Yona et al., 2021; Nop et al., 2024), high temperature treatment (Balfas, 2019) and chemical setting (Johana et al., 2019), and conventional drying and setting. The method mainly includes direct drying, hydrothermal drying, microwave drying, and high-frequency drying. High-temperature treatment shaping use high-pressure superheated steam to treat wood. Although high-temperature treatment can eliminate the bending stress inside in a short time, it is easy to reduce the mechanical properties of the wood. The chemical setting mainly refers to the stereotypic resin styling and phenolic resin shaping: the cost is large, the time is long, and the finished product is dark in color. Inoue studied organic liquids such as ethylene glycol and glycerin under the pressure of wet heating to fix the compression deformation of wood and optimized the chemical shaping process (Fang et al., 2019). Microwave drying has the best shaping effect, and the time required for heat setting is also the least (Schober et al., 2023).
At present, wood bending technology is rich, mature, and perfect. The tree species that researchers pay attention to are mainly ash, eucalyptus, walnut, oak, rubber wood, etc., with less specialized research on tropical tree species such as teak (Johana et al., 2019). In recent years, China’s plantation teak has entered the cutting and utilization period (Fang et al., 2019; Liang et al., 2011), and the bending process of the artificial forest teak has been studied, which is beneficial to the rich teak product manufacturing technology.
The plantation teak samples were collected from Lazagu Mountain, Yingjiang County, Dehong Dai and Jingpo Autonomous Prefecture, Yunnan Province, China. It is in a 20-year-old forest stand, where the annual average temperature is 22°C, the altitude is 892 m, the teak tree’s average diameter at breast height is 26 cm, and the average height is 19 m. The mean values of basic density, air-dry volumetric shrinkage, full-dry volumetric shrinkage, breaking load, modulus of elasticity, flexural strength, and maximum deformation of the specimens were 0.65 g/cm3, 5.63%, 8.39%, 2.02 MPa, 9175 MPa, 90.85 MPa, and 6.22 mm, respectively. In this experiment, the teak trees’ diameter was about 30 cm, and its height was approximately 20 m. It was harvested on 13 January 2017. After the sample is dried by local air for 1 month, it is steam dried to a moisture content of 10%. Based on the GB/T1927.9-2021 method of testing in bending strength of wood, heartwood was selected with uniform material and straight texture. To minimize the effect of wood variability, all boards were mature lumber, and sawn specimens were heartwood without blemishes and with a radial angle of no more than 10° in the cross section. The experimental sample specifications were set to 20 mm × 20 mm × 300 mm, which were used to prepare four different experiments, such as the mechanical property test, hydrothermal treatment, microwave softening treatment, and drying and shaping. Wood with the same straight texture and no defects was sawn into samples of 10 mm × 20 mm × 300 mm specifications for preparation for hydrothermal and microwave combined softening effect verification experiments.
The same straight, defect-free wood was taken and sawed into a 10 mm × 20 mm × 300 mm test piece for the water–heat–microwave-combined softening effect verification experiment. A number of test pieces of 20 mm × 20 mm × 30 mm were prepared, and 20 pieces were used to test the basic density; separate 30 pieces were taken for testing the air-drying MC. In addition, the number of specimens for all mechanical property tests was 20. For the accuracy of the test, all the samples used this time were obtained by preferential selection, including the size and basic density errors less than 0.1%.
Additionally, a polyethylene film was utilized to wrap the test piece to prevent the loss of heat when the moisture of the wood evaporates quickly.
A DHG-type electric blast drying oven (model: 101-00B, manufactured by Yuyao Yatai Instrument Co., Ltd.) was used to determine the MC of the sample. The main specifications are as follows: the input power is 800 W, the timing range is 1–9,999 min, the temperature control range is RT+10°C–250°C, and the constant temperature fluctuation is ±1°C. An electronic universal testing machine (UTM5105, manufactured by Shenzhen Sansi Vertical and Horizontal Technology Co., Ltd.) was adopted to measure the mechanical properties of the treated specimens. Electronic balance (model: DTT-A+200, accuracy: 0.001, manufactured by Wenzhou Huazhi Scientific Instrument Co., Ltd.) was introduced as a measuring equipment to weigh the wet and dry weights of the MC test piece and determine the water content. In addition, an electronic digital caliper (accuracy ±0.01) was chosen as another measuring equipment to measure the cross-sectional dimensions of the test piece. Pre-treatment and discharge of mechanical test specimens were done by using a circulating water vacuum pump [model: SHZ-D (III) type water circulation vacuum pump, maximum vacuum of 0.098 MPa, manufactured by Gongyi City Yuhua Instrument Co., Ltd.]. Under the help of this pretreatment equipment, the MC could be quickly increased as the air inside the test piece might be discharged. Furthermore, an oil-free air compressor (model: OTS-800, the manufacturer is Taizhou Otto Trade Co., Ltd.) was applied to combine with the use of vacuum pumps to quickly increase the MC of the test piece. A high-pressure steam cooker was used for hydrothermal treatment (0.1 MPa). A homemade pressure steam cooker (power: 6 kW) was used for higher temperature hydrothermal treatment of samples. The microwave softening treatment equipment and the drying and setting equipment adopt the microwave vacuum experimental furnace (model: MZ08S-1). The bending tool is a self-made multi-set bending mold, which is divided into an outer mold (concave surface) and an inner mold (convex surface), and all the surface of the mold is sanded by 800 mesh. The radius of curvature of each set of molds is 6, 8, 10, 14, 16, 20, and 25 cm, respectively, the width is 5 cm, and the height varies according to the radius of curvature, as shown in Figure 1.
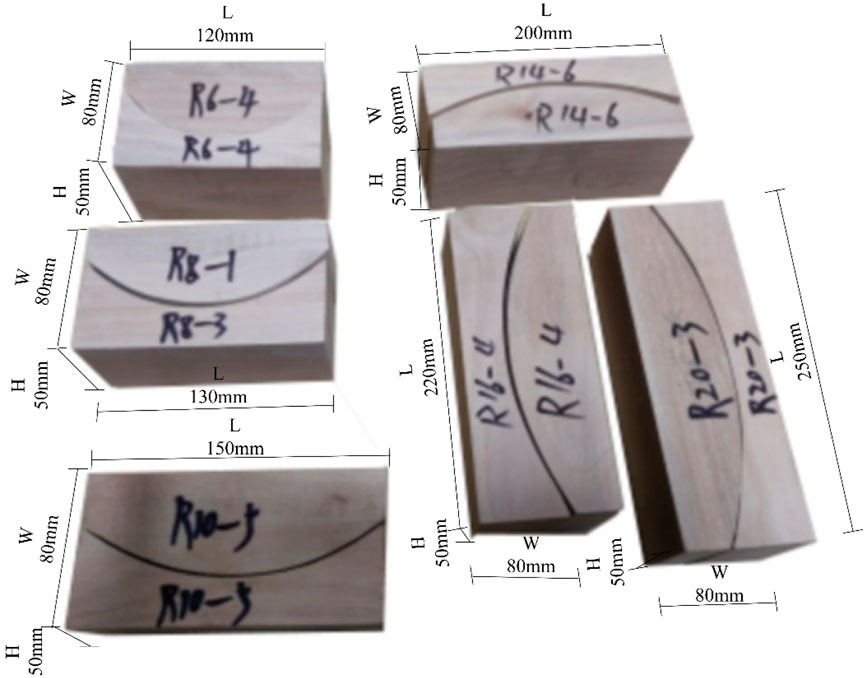
Figure 1. Bending molds.
In order to explore the softening process parameters of the artificial teak, it is necessary to carry out different combination tests on the experimental parameters, evaluate the softening effect through the experimental results, and then obtain better technical parameters through comparative analysis. The softening effect can be evaluated by the modulus of elasticity (MOE) and the modulus of rupture (MOR). The softening effect of the curved parts is directly reflected by the minimum radius of curvature. The MOE and the MOR can be directly measured by experiments. The minimum radius of curvature is not easy to measure quickly but can be obtained by bending deflection. The transformation of the bending deflection and the minimum radius of curvature is shown in Figure 2.
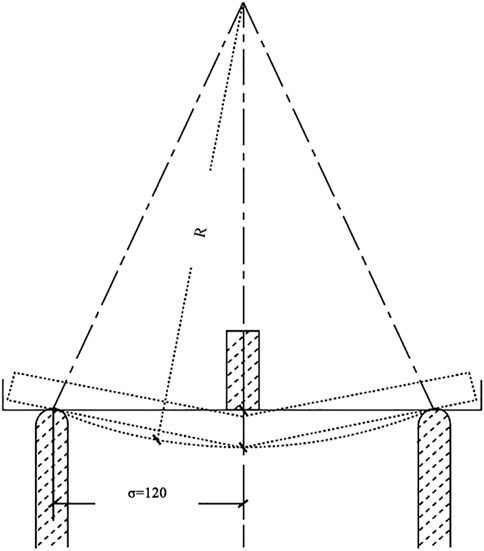
Figure 2. Test schematic diagram of MOR.
The minimum radius of curvature R has a geometric relationship with the span l and the bending deflection L, which is calculated according to Eq. 1:
where L is the maximum deflection for bending and l is the distance between two seats.
The minimum radius of curvature is the most effective parameter for evaluating the bending effect. The bending deflection is geometrically related to the minimum radius of curvature. Therefore, the bending deflection can also be used as an index to evaluate the softening effect. This method of converting the radius of curvature by bending deflection is simple and easy to operate and is suitable for calculating the radius of curvature of a three-point bending test piece.
According to the GB/T1938-2009 test method for the tensile strength of wood grain and the GB/T1936.2-2009 experimental method for the determination of flexural modulus of wood, the MOR and MOE of the tested specimens with different softening conditions are measured, together with the maximum bending deflection. Figures 2, 3 show the test diagram of the MOR and MOE, respectively.
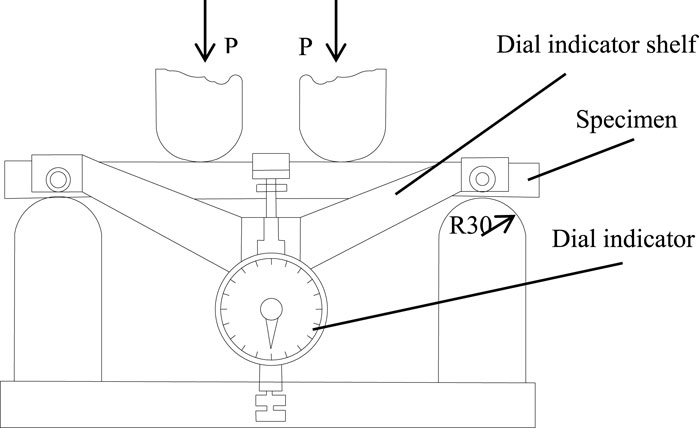
Figure 3. Test schematic diagram of MOE.
The variations in MOR and MOE were analyzed by measuring displacement and stress. The elastic modulus E and the flexural strength σ can be calculated from the static equation, and the MOE value when the wood’s MC is W% is calculated according to Eq. 2:
where EW is the MOR when the sample’s MC is W%, P is the upper and lower limit load value difference, l is the span value between seats, b is the width of the specimen, h is the length of the specimen, and ƒ is the sample deformation value between the low and high loads (in other words is differences of dial reading at low and high loads).
The bending strength when the wood’s MC is W% is calculated according to Eq. 3:
where σw is the bending strength of the sample when MC is W, Pmax is the limit load, l is the span value between two seats, b is the width of the specimen, and h is the height of the specimen.
The bending deflection in the experiment can directly reflect the degree of the softening effect. When the bending deflection is large, the softening effect is good. However, the softening effect is not good. Since the bending deflection of the wood has a geometric relationship with the minimum radius of curvature of the bending, the bending deflection after the softening treatment can be used as the measurement result of the test according to the method described in Section 2.2.1.
Wood density, water content, MOE, and MOR are all important factors in wood that affect the bending properties.
According to the national standard GB/T1933-2009 wood density determination method, the density of the sample is measured, and the air-dried density at the MC of W% is calculated according to Eq. 9:
where ρw is the air-dried density when the sample’s MC is W%, MW is the weight of the sample at an MC of W%, and VW is the volume of the sample at an MC of W%.
According to the national standard GB/T1931-2009 measurement method of wood MC, the MC of the sample and the MC of the test piece obtained after each group treatment are determined according to Eq. 10. For each set of test specimens, two specimens of approximately 20 mm × 20 mm × 30 mm in size were cut near the bending failure to test MC, with a total of 40 per group.
where W is the MC, m1 is the weight of the sample in the wet state, and m2 is the weight of the sample in the dry state.
According to the GB/T1936.2-2009 method, the MOE value of teak in plantation is determined according to Eq. 2.
According to the GB/T1936.1-2009 method, the MOR value of teak in plantation is determined according to Eq. 3.
According to the national standard GB/T 2677.6-1994 determination of the content of organic solvent extracts of papermaking raw materials, the samples before and after the treatment are extracted using the benzene–alcohol organic solvent, and the content of the organic solvent extract is determined. The calculation equation is shown in Eq. 6:
where X is an organic solvent extract content in wood, m1 is the weighing bottle and total mass of the extract after drying, m2 is the quality after drying wood, m0 is the quality of the weighing bottle after drying, and W is MC.
According to the standard GB/T 2677.8-1994 (1995) determination of acid-insoluble lignin content of papermaking raw materials, the acid-insoluble lignin content of the samples before and after treatment is determined, and the calculation equation is shown in Eq. 7:
where X is the acid-insoluble lignin content in raw materials, m1 is the acid-insoluble lignin content after drying, and m0 is the quality of the sample after it has dried.
According to the national standard GB/T 2677.10-1995 determination of the cellulose content of papermaking raw materials, the samples before and after treatment were tested for hemicellulose content, and the calculation equation is shown in Eq. 8:
where X is the synthetic cellulose content in raw materials, m1 is the unstained cellulose content after drying, and m0 is the quality of the sample after it has dried.
The cellulose content was determined by the nitric acid–ethanol method (Norimoto and Gril, 1989). The chemically pure nitric acid and 95% ethanol solution were mixed at a volume ratio of 1:4. During mixing, the nitric acid was slowly added to the ethanol solution and uniformly stirred using a glass rod. The principle was that the lignin in the wood raw material would become nitrified lignin and oxidized lignin under the action of nitric acid and dissolve in the ethanol solution. At the same time, the semi-fibers were also hydrolyzed and oxidized by nitric acid and dissolved in the ethanol solution. Finally, nitrocellulose insoluble in the ethanol solution was obtained. The cellulose content is calculated, as shown in Eq. 9:
where X is the cellulose content in wood, m0 is the weight of the glass filter after drying, m1 is the total mass of the glass filter and cellulose, m2 is quality after drying wood, and W is MC.
To measure the advantages and disadvantages of the dry setting effect, the chord length change rate can be used as an indicator of the dimensional stability of the curved part. The chord length change rate is calculated according to Eq. 10:
where l0 is the length of the curved piece chord and l1 is the chord length after the bending of the bending piece is stabilized.
The air-dried test sample was placed in a vacuum tank, and the pressure was maintained at 0.5–1 h under a negative pressure of 0.08 MPa. Enough water was added under negative pressure, and quickly, the pressure was increased to 0.4 MPa using an air compressor for 1–2 h. The test sample is wrapped using a polyethylene cling film to prevent moisture loss. Thereafter, the sample was placed in a steam heating apparatus for heating and softening and then subjected to the mechanical property test. During the test, the dimensional information on the specimen was accurately recorded, and the bending deflection was tested by radial pressurization at a loading rate of 10 mm/min.
The untreated and treated teak wood treated at 140°C for 4 h was made into 60–80 mesh wood powder, and then, the sample was dried in a 103°C drier to dryness and then chemically processed according to the corresponding national standards.

Table 1. Value of the hydrothermal treatment temperature.

Table 2. Value of hydrothermal treatment time.
According to the GB/T 2677.6-1994 method, the samples were subjected to benzene–alcohol organic solvent extraction before and after the treatment, and the content of the organic solvent extract was determined.
The acid-insoluble lignin content of samples before and after the treatment was determined according to the GB/T 2677.8-1994 method.
According to the GB/T 2677.10-1995 method, the samples before and after the treatment were tested for hemicellulose content. With weighing paper, 1,000–1,050 g of each dried sample from each group was weighted accurately and transferred to a clean conical flask, 25 mL of a nitric acid–ethanol mixed solution was added, and it was connected using a condenser. It was placed in a water bath to conduct boiling for 1 h, and 25 mL of a nitric acid–ethanol solution was added to the Erlenmeyer flask at intervals of 1 h. At any time, the conical flask was shaken to prevent splashing. The total treatment time was 4 h. After the treatment, the conical flask was taken out and allowed to cool to room temperature. The nitric acid–ethanol solution and the residue were poured into a sand funnel having a constant weight, and the suction filter bottle was connected and suction filtered using a vacuum pump. The conical flask was rinsed several times using distilled water so that no residue remains in the conical flask, and repeatedly, the residue was rinsed in the sand funnel using distilled water until the filtrate of the sand funnel is not acidic using the pH test paper and then rinsed twice using 10 mL of absolute ethanol each time. The sand funnel was taken out and dried in an oven at 100°C–105°C until it reached at a constant weight, and then it was weighed. The residue collected was cellulose.
The test samples after the mechanical tests of each group were taken using two wooden pieces of length 30 mm on the left and right sides where the damage occurred, weighed separately, dried in an oven at 103°C until dried, and then placed for the test. The desiccant was cooled to room temperature in a drying dish and then weighed, and the final MC of the hydrothermal treatment was measured. The dried samples were placed in a drying dish and cooled to room temperature, and the chemical components were weighed.
The test sample was wrapped using a polyethylene cling film to prevent moisture loss and then placed in a microwave heating device for heating and softening. The dimensions of the test piece were recorded, and the processed test piece was quickly tested for mechanical properties. The radial compression was performed by radial pressurization at a loading speed of 10 mm/min.
The value of microwave power P is shown in Table 3, and the value of microwave time t2 is shown in Table 4.

Table 3. Value of microwave treatment power.

Table 4. Value of microwave treatment time.
The measurement method is the same, as shown in Section 3.1.1.
Vacuum pressure treatment according to the same method is shown in Section 3.1.1. Thereafter, the test sample was wrapped using a polyethylene cling film and then placed in a steam heating apparatus for hydrothermal softening, and microwave softening was performed immediately after the completion of the hydrothermal softening. Then, the dimensional specifications of the test piece were recorded, and the radial compression was performed by a radial pressurization method at a loading speed of 10 mm/min.
Based on the hydrothermal softening process and microwave softening process, the optimal softening process of the two softening methods was combined, and the hydrothermal–microwave combined softening effect was verified by verification experiments. The parameters of the hydrothermal–microwave-combined softening process are as follows: hydrothermal temperature at 120°C, hydrothermal time at 4 h, microwave power at 480 W, and microwave irradiation time at 4 min. The verification experiments were carried out via hydrothermal-microwave softening parameters before and after a step size change for single-variable experiments, and the experimental parameters are shown in Supplementary Table S1.
The measurement method is the same, as shown in Section 3.1.1.
Through the comparative analysis of the experiments mentioned above, the process parameters of the hydrothermal–microwave-combined softening treatment of plantation teak were obtained. In order to better combine the actual production, it is necessary to make a confirmatory experiment on the actual bending performance of the plantation teak verification, that is, the minimum curvature of the plantation teak is measured halfway. The tests after hydrothermal–microwave-combined treatment were, respectively, bent and shaped with different specifications of the mold to determine the minimum radius of curvature.
The test piece of 10 mm × 20 mm × 300 mm was first subjected to hydrothermal treatment at 120°C for 4 h and then rapidly subjected to microwave treatment under the conditions of 480 W and 4 min. Thereafter, the obtained test piece was manually fixed on a mold having a radius of curvature of 100 mm, and the chord length was calculated to be 190 mm according to the curvature. Next, the bending test piece and the mold are placed in a constant temperature and humidity chamber, the adjustment of different MC step sizes is performed, and each set of test pieces is 10. Among them, based on 14%, with a step size of −2%, the MC was adjusted, as shown in Table 5. Finally, the chord length of the test piece after the dry setting treatment was measured, and the cause of the change was analyzed.

Table 5. Value of final MC.
The test piece was prepared according to the treatment method of 4.1; the bent test piece was put into the oven together with the mold, and then the temperature step size was adjusted to 10 sets of each test piece. Among them, the temperature is set at 80°C, with a step size of −10°C. Finally, the chord length of the test piece after the dry setting treatment was measured, and the cause of the change was analyzed.
The test piece was prepared according to the method of 4.1, and then the test piece which has been molded by hydrothermal–microwave treatment was placed in a natural environment under the holding of the mold. Based on 0 and 2 h as the step size of variation, the time adjustment of the deposited time is carried out.
In order to more intuitively reflect the softening effect of hydrothermal softening treatment, the bending deflection is directly used as a measure of the softening effect. The experimental results take the average value of the bending deflection values measured by each group of test pieces, 20 experimental specimens per group. The results of the bending deflection of the hydrothermal treatment are shown in Supplementary Table S2 and Figure 4.
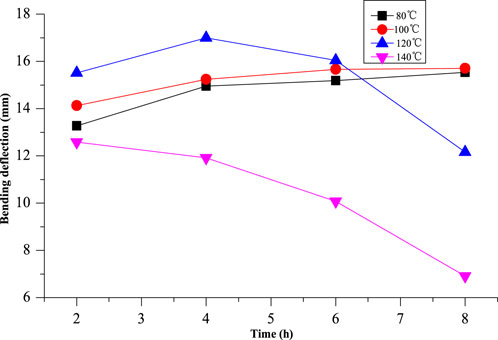
Figure 4. Bending deflection value of hydrothermal softening treatment.
It can be seen from Figure 4 that when the hydrothermal temperature is 80°C and 100°C, the bending deflection increases with the increase in hydrothermal time, but the maximum increase is at 4 h, and the increase is gentle after 4 h. When the temperature is 120°C, the bending is performed. The deflection shows a parabolic change, that is, the change in the first increase and then decrease, reaching the maximum at 4 h and then starting to decrease. When the temperature is 140°C, the change in bending deflection decreases with time. On all time step sizes, the deflection values of the specimens treated at 140°C were minimum on the same time step size; the maximum value was obtained at 120°C on the time step size of 2 h, followed by 100°C and 80°C.
The bending deflection of hydrothermal treatment temperature was fit at 120°C, and the fitting equation of bending deflection y and heating time x was obtained, as shown in Eq. 11.
If the coefficient of the quadratic term in the equation is negative, it means that the function has a maximum value. By fitting the equation simulation, the hydrothermal treatment time is within 4.5–5 h, and the bending deflection reaches the maximum.
Due to the influence of the mineral content of teak on the moisture, it is difficult to control the MC by the constant temperature and humidity chamber. Therefore, the MC is controlled by the vacuum-pressing method, and the initial MC is controlled within the range of 60%–70%. The final MC measurement results of the experimental group are shown in Supplementary Table S3 and Figure 5.

Figure 5. MC of hydrothermal softening treatment.
The final MC of each experiment was affected by the initial water content, and the initial MC of each group also had some differences, but they were all maintained at about 60%. At 80°C, the heating temperature does not allow the free water in the cell cavity to boil, so the MC of the sample at different treatment times at 80°C is always maintained at a high level. When the temperature reaches or exceeds 100°C, the water begins to boil, the vapor pressure in the lumen of the wood cells increases, a part of the water enters the cell wall, and most of the water diffuses outward, so that the MC begins to decrease and tends to be stable, that is, the fiber is reached. The MC tends to be stable after the saturation point.
The main chemical constituents were analyzed by the control, 120°C, and 140°C hydrothermal treatment for 4 h, and the results are shown in Supplementary Table S4 and Figure 6. It can be seen that the relative contents of cellulose, lignin, and organic extracts in the samples after the high temperature treatment have increased to varying degrees, while the content of hemicellulose decreased significantly after hydrothermal treatment at 140°C. This is due to the degradation of hemicellulose in high-temperature environments.
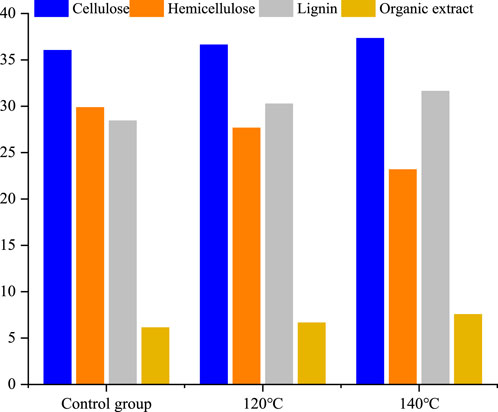
Figure 6. Chemical components of the tea plantation control group and different temperature treatment materials.
As with the hydrothermal softening treatment, the bending deflection was used as a measure to evaluate the softening effect. The experimental results take the average value of the bending deflection values measured by each group of test pieces, with 20 experimental specimens per group. The results of the bending deflection of the microwave softening treatment are shown in Supplementary Table S5 and Figure 7. It can be seen from Supplementary Table S5 and Figure 7 that at 320 W, 480 W, and 640 W, the bending deflection and heating time show nonlinear changes (Norimoto et al., 1980; Norimoto and Gril, 1989), the bending deflection reaches the maximum when heating for 4 min, and the bending deflection of 480 W reaches all temperature levels at 4 min. The maximum value. In the time step size 2 min, the bending deflection increases with the increase in the microwave power. However, when the heating time reaches 4 min, the bending deflection of the experimental group with the higher power step size is smaller than that of the lower power level. The bending deflection of each subsequent heating time is the maximum bending deflection when the power is 480 W.

Figure 7. Bending deflection of microwave softening treatment.
The MC measurement results of each experimental group of microwave treatment are shown in Supplementary Table S6 and Figure 8. It can be read that the final MC measurement of the experimental group at the power level of 800 W also decreased first and then increased, indicating that the power of 800 W can degrade the chemical components of the wood, resulting in a decrease in quality.
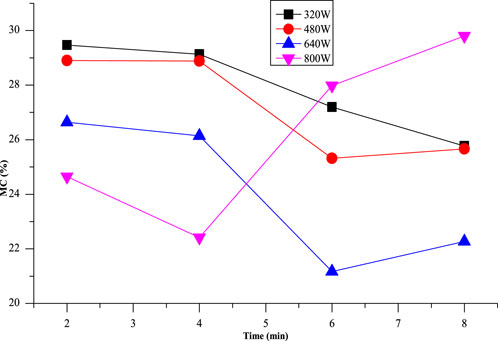
Figure 8. Final MC of microwave softening treatment.
There are non-linear changes in the test results of the same microwave power level, and there is also a nonlinear change at the time level. 3D surface rendering was performed using the response surface analysis software Design-Expert 13.0.1, as shown in Figure 9.
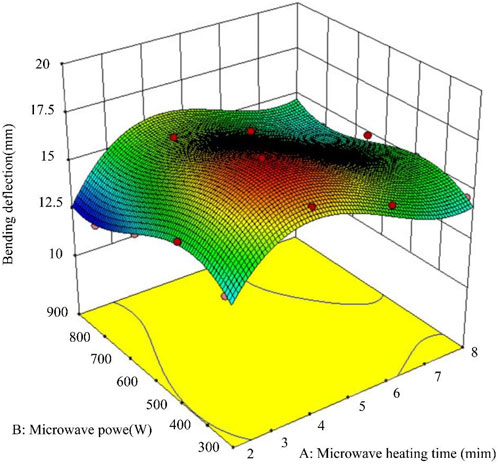
Figure 9. 3D curved surface of microwave power, time, and bending deflection.
By regression analysis of the test results using software, the softening model binary regression equation of bending deflection y and microwave time x1 and microwave power x2 is obtained, as shown in Eq. 12. The analysis of variance is shown in Table 6.
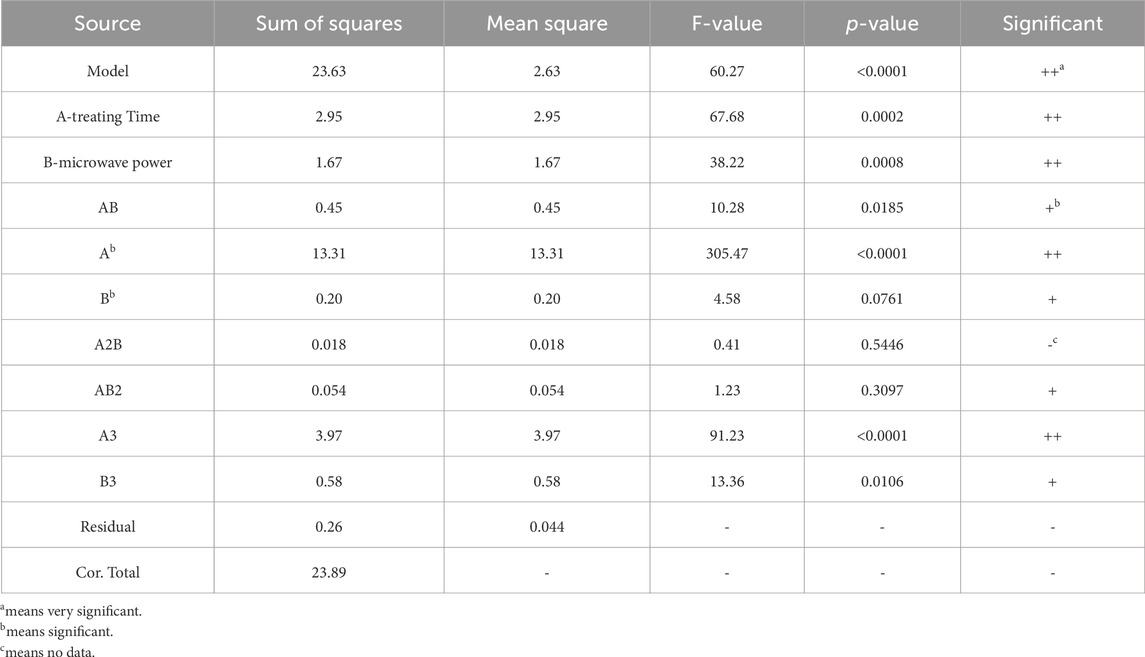
Table 6. Regression model analysis of variance.
From the variance analysis of the model, the coefficient of determination R2 = 0.9891 is very close to 1, indicating that the model is basically consistent with the actual experimental situation; the model p-value is < 0.0001, which is very significant; the p-value of the AB term is 0.0185, which is less than 0.05. It shows that there is a significant interaction between microwave time and microwave power. The p-value of A2 is < 0.0001, and the p-value of B2 is 0.0761, which is greater than 0.05, indicating that the microwave treatment time has a significant effect on the softening effect of wood, while the microwave power has a softening effect on wood. In addition, the significant order affecting the microwave softening effect of wood is A > B; that is, under the conditions of this test, the microwave treatment time has the greatest influence on the microwave softening treatment effect. The model values obtained according to Eq. 12 are shown in Supplementary Table S7. Results showed that the maximum deflection is obtained when the microwave power is 480 W and the microwave time is 4 min.
The bending deflection results of each group of confirmatory experiments determined by mechanical experiments are shown in Supplementary Table S8.
The results of group 0 experiments can show that the bending deflection value of teak wood is the largest when the hydrothermal temperature is 120°C, hydrothermal time is 4 h, microwave power is 480 W, and microwave heating time is 4 min.
The final MC measurement results of each experimental group are shown in Supplementary Table S9.
In the bending experiment, although there is a geometric conversion relationship between the minimum radius of curvature R and the span of the three-point bending and the bending deflection L, as shown in Eqs 13, 14, the bending deflection can only qualitatively reflect the minimum radius of curvature.
It was found through preliminary experiments that the chord length of the bent test piece hardly changed after the mold was removed for 24 h. This is because the drying process reduces the moisture content of the bending component and increases the degree of correlation between the wood’s own main chemical components by reducing the moisture content, e.g., cellulose and hemicellulose. After the loss of water, the intermolecular gap narrows and the increase in their own bonding forces can be used to balance the bending stresses. When the drying time is too long, the bending parts will lose water seriously, resulting in the bonding force being weakened, the bending stress being weakened, and the formation of a new residual stress, causing new changes in chord length. Therefore, the bending specimen is best shaped when the final moisture content is controlled at 8%. Therefore, each set of bent test samples under different MC step size conditions was removed after drying the mold for 24 h, and the chord length was measured. The measurement results of the chord length of each group are shown in Table 7 and Figure 10.
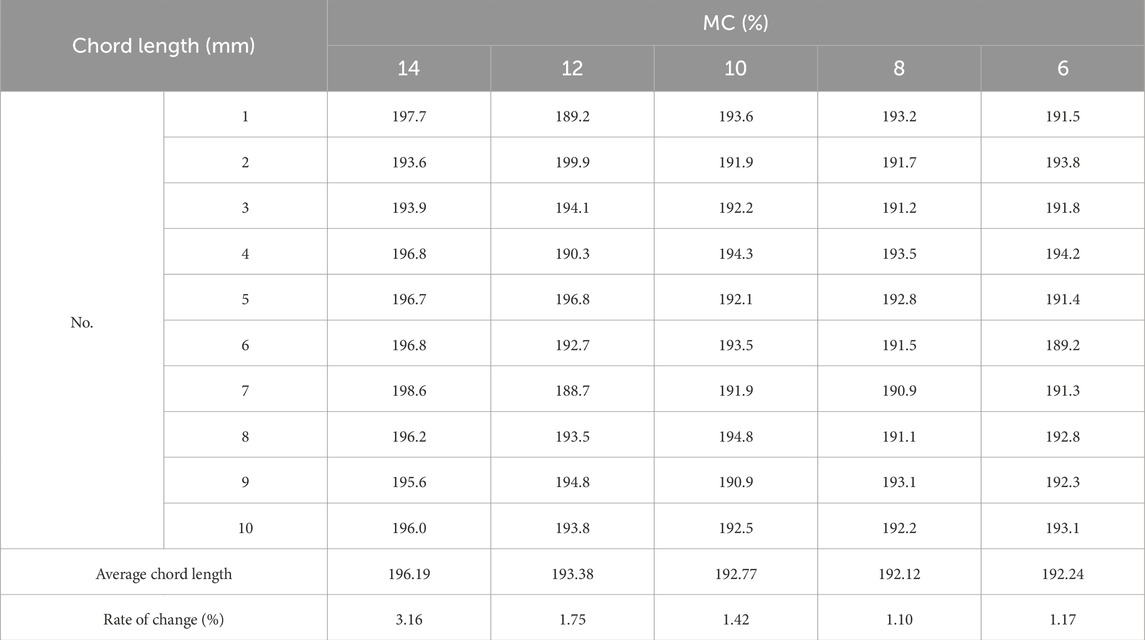
Table 7. Chord lengths of specimens in each group with different MC.
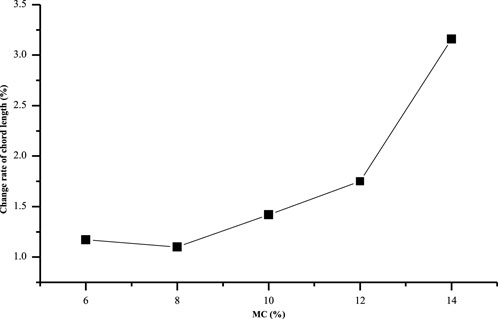
Figure 10. Relationship between final MC and chord length.
It can be seen from Table 7 that the rate of change in the chord length decreases first and then decreases with the decrease in the dry water content and reaches the minimum value when the MC is 8%. The fitting of the chord length change rate y and the MC x is obtained by fitting, as shown in Eq. 15.
where the decision coefficient R2 = 0.9707 indicates that the model has a very high degree of fit to the actual, and the model takes the minimum at x = 7.8.
The measurement results of the chord lengths of each group are shown in Table 8 and Figure 11. As shown in Figure 11, the chord length change rate decreases first and then increases with temperature and reaches a minimum at 50°C. By fitting, the fitting equation of the chord length change rate y and the temperature x is shown in Eq. 16.
where the decision coefficient R2 = 0.9818 indicates that the model has a very high degree of fit to the actual.
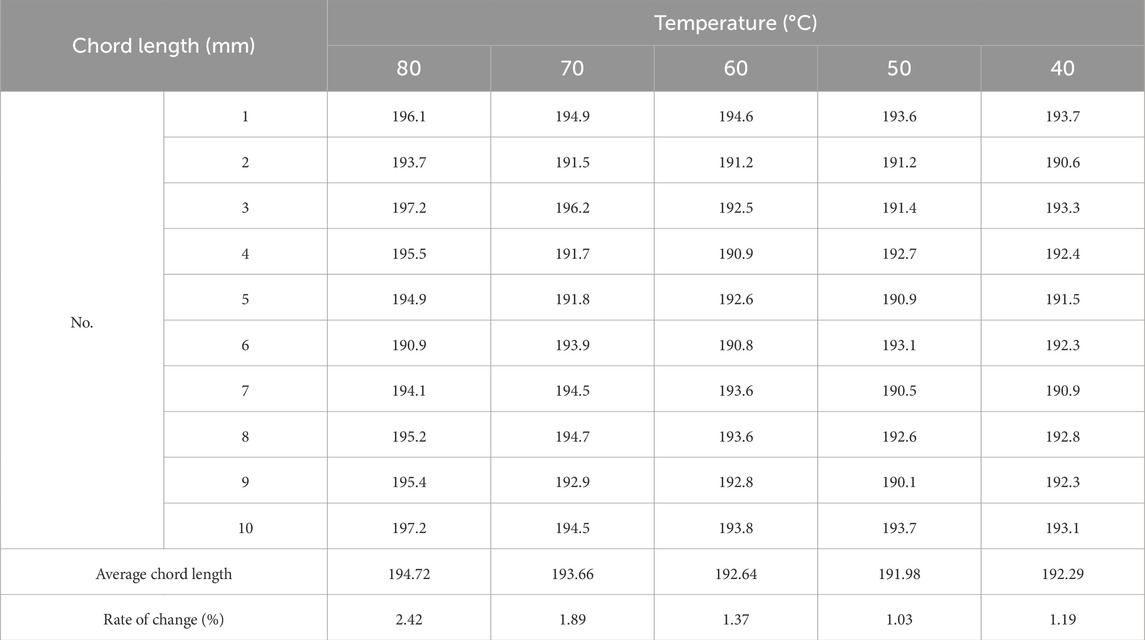
Table 8. Chord lengths of specimens in each group with different temperatures.

Figure 11. Relationship between the temperature and chord length.
It was found that the chord length of the bending specimens hardly changed after the mold was removed for 24 h. Therefore, the chord lengths of each group of bending specimens with different moisture content gradients were measured after removing the molds and drying for 24 h. The results are shown in Table 9 and Figure 12. The chord lengths decreased with time during the first 4 h. When the time was between 4 and 6 h, the rate of change began to level off and then decreased between 6 and 8 h. The chord lengths of the bending specimens were also found to decrease with time. The rate of change in chord length begins to level off between 4 and 6 h and stabilizes between 6 and 8 h.
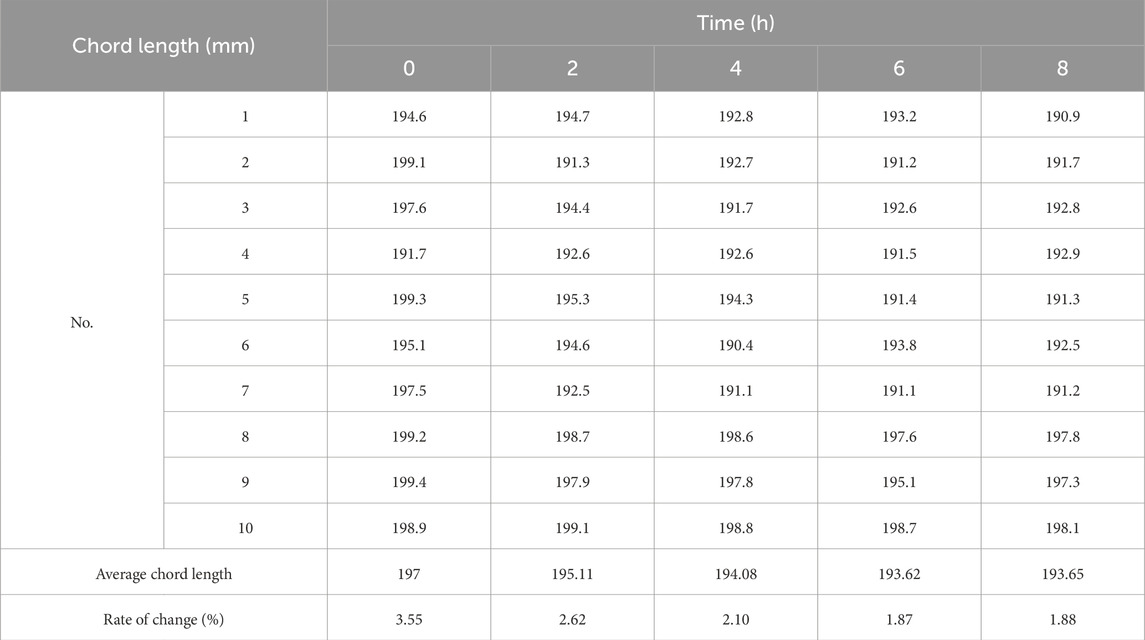
Table 9. Chord lengths of specimens in each group with different deposited time.
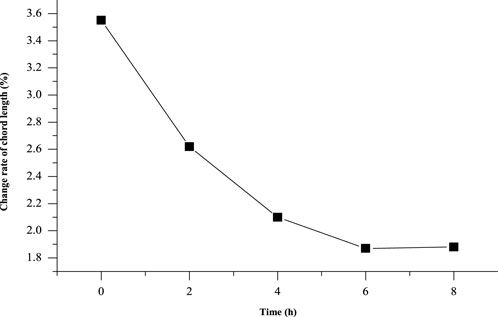
Figure 12. Relationship between deposited time and the chord length.
Several scholars have investigated the changes in the chemical composition of teak after heat treatment, and the results showed that the hemicellulose of teak was significantly degraded from 120°C, and intense thermal degradation reactions began at 140°C and 160°C [45]. Similarly, cellulose and lignin are more thermally stable than hemicellulose in the temperature range of this study. There was no significant degradation of the chemical constituents of teak in the temperature range of 80°C–100°C. Therefore, the bending deflection increases with the increase in heating time for a given range of heating time in the temperature range of 80°C–100°C. When the temperature reaches 120°C, although hemicellulose begins to show obvious degradation, the influence of the hydrothermal temperature on the bending deflection is dominant in 4 h, and the influence of the two on the bending deflection reaches the dynamic equilibrium at 4 h. When the hydrothermal time exceeds 4 h, the effect of the degradation of mechanical properties caused by the degradation of hemicellulose on the bending deflection begins to dominate, so the bending deflection will increase first and then decrease with the increase in heating time at 4 h. The maximum phenomenon is reached; when the hydrothermal temperature is 140°C; the effect of hemicellulose degradation exceeded the temperature effect at the beginning, so the bending deflection is negatively correlated with the heating time. Aside from the temperature of 140°C, at the same time level, the change in bending deflection increases with the increase in temperature. On the other hand, it indicates that the influence of temperature on the bending deflection is dominant in the early stage of hydrothermal softening. When the influence of hemicellulose’s degradation is far beyond the influence of temperature, the phenomenon shows that the bending deflection increases first and then decreases at the same time level. In other words, the bending deflection of hydrothermal treatment at 120°C for 6 h decreases.
Hemicellulose is the chemical component with the lowest thermal stability of the main chemical components of wood, and other major chemical components are stable relative to hemicellulose. Therefore, the decrease in hemicellulose content after high temperature treatment leads to an increase in the relative content of cellulose, lignin, and organic extracts. At the same time, the residue after hemicellulose degradation remains in the wood and is extracted as an organic extract so that the organic extract content is significantly increased.
From the experimental results, the bending deflection of the power level of 800 W decreased with the increase in time. The bending deflection has reached the highest level when heated for 2 min. In addition, the downward trend is obviously increased at 4 min, which indicates that the microwave power of 800 W is too high to be suitable for softening. At the power levels of 320 W, 480 W, and 640 W, the bending deflection and the time of microwave irradiation both change nonlinearly, that is, the bending deflection increases first and then decreases with time. Likewise, at each time level, the bending deflection and the microwave power also change non-linearly [26–28]. At the power level, the bending deflection reached the maximum at 4 min in each set of experiments, indicating that the microwave treatment at 4 min was the demarcation point of the bending deflection change. For shorter microwave irradiation time, the temperature inside the test piece is difficult to reach the glass transition temperature, and the softening effect is not achieved. The long-term microwave treatment will enhance the evaporation movement of water, and the internal moisture will spread out in the form of steam, resulting in serious internal moisture loss and increased internal stress.
By comparing the bending deflection values of each group of verification experiments with a single hydrothermal method or microwave method, it is verified that the bending deflection ratio of each group has increased greatly, which is due to the increase in softening parameters and the interaction between multiple factors. The softening effect is significantly improved.
The results showed that the interaction of multiple factors improved the softening effect. Therefore, the softening effect of the combined hydrothermal–microwave softening treatment was more desirable than the single hydrothermal treatment or microwave treatment. In addition, the best softening effect was obtained under the softening process of 120°C hydrothermal temperature, 4 h hydrothermal time, 480 W microwave power, and 4 min microwave heating time, which is the best softening process for the combined hydrothermal–microwave softening treatment of teak.
The thickness of the bending specimen is reduced to half the thickness of the standard specimen for mechanical properties. As a result, the radius of curvature of the thinner specimen is smaller under the same softening conditions. The minimum radius of curvature without the addition of the steel tape for cushioning was only 12 cm, and the probability of no breakage was about 60%. With the addition of steel tape and controlled molding speed, the minimum radius of curvature was 10 cm, and the probability of no breakage was approximately 80%.
In bending, the tensile stress on the convex surface is the most important cause of bending failure. Therefore, by adding a steel strip to both ends of the curved test piece, the steel strip is used to resist a part of the tensile stress, and the probability of damage can be reduced. In addition, controlling the pressurization speed while molding could also improve the success rate of the bending.
Figure 10 shows that the chord length changes sharply when the MC is 14%–12%, and the downward trend from 12% to 8% slows down, reaching a minimum at 8% and starting to increase gently from 8% to 6%. This is because internal stress is generated inside the wood during bending deformation, and the elimination of internal stress can fix the bending deformation. The elimination of internal stress can also be achieved by reducing the water content. Because the water molecules are released from the wood, the space that was originally occupied by the water molecules and the swelling began to shrink, and the cellulose molecules began to re-engage so that the internal binding force of the wood began to increase. From 14% MC to 12%, the MC is high, the amount of heat is released more, and the fixed bending deformation could be higher. Currently, the internal bonding force of the wood is not enough to resist the bending internal rate. From the MC value at 12%, the amount of water molecules moving begins to decrease, and the amount of immobilization begins to decrease. Until the MC reaches at 8%, the bonding force and the bending stress just reach the equilibrium, and the wood chord length does not change. As the MC continues to decrease, the internal binding force of the wood begins to produce a tighter bond between the molecules inside the wood, causing the deformation to increase in reverse, which can be analogized to the shrinkage deformation of the wood.
Therefore, reducing the MC of the curved test piece can effectively reduce the bending springback. When a certain MC is reached, the bending stress is balanced, and the wood will no longer undergo rebound deformation. The MC of the plantation teak no longer rebound deformation is 8%.
It can be seen from Figure 11 that the chord length change rate reaches a minimum at a temperature of 50°C. When the temperature decreases from 80°C to 50°C, the rate of change in the chord length decreases with decreasing temperature, and the rate of change in the chord length reaches a minimum at 50°C.
The chord length change rate decreases with the increase in the deposited time and finally tends to be gentle, indicating that the bending stress inside the curved test piece can reach a uniform distribution state in a relatively short time, and the chord length change exceeds the equilibrium point test piece. The rate is no longer changing, and it is meaningless to continue to extend the time. As can be seen from Figure 12, the optimum deposited time is 6 h.
The plantation teak specimens were hydrothermally treated by controlling a single variable of hydrothermal temperature and heating time. The bending deflection result was fit at 120°C with the heating time to obtain the fitting equation y = −0.325x2 +3.1x + 11.225 (R2 = 0.9791) and the maximum value at x = 4.8. The optimal hydrothermal treatment parameters for plantation teak are 120°C of hydrothermal temperature and 4.5 h of hydrothermal time. Furthermore, the microwave softening treatment of the plantation teak specimens was carried out by controlling the single-heating variables of microwave heating power and heating time. The softening model of bending deflection y and the microwave time x1 and the microwave power x2 is obtained by fitting the following model: y = −10.45 + 8.378*x1 + 0.079*x2−2.66*(10−4)*x1*x2−1.6*x12-1.37*(10−4)*x22−4.68*(10−)*x12*x2+1.01*(10−6)*x1*x22 + 0.093*x13 + 6.94*(10−8)*x23. The most reasonable process for microwave softening heating is a power of 480 W and heating time of 4 min. By fitting the microwave softening model, the model equation of bending deflection y and microwave power x1 and microwave heating time x2 is obtained: the optimal parameters of microwave softening are simulated by using the following expression: y = −10.45 + 8.378*x1+0.079*x2−2.66*(10−4)*x1*x2−1.6*x12-1.37*(10−4)*x22−4.68*(10−5)*x12*x2+1.01*(10−6)*x1*x22 + 0.093*x13 + 6.94*(10−8)*x23 and R2 = 0.9891. During the molding process, the steel belt can be used reasonably, and the speed at the time of molding can be increased to improve the bending success rate. The chord length change rate y and MCx are obtained by fitting. The fitting equation is y = 0.0521 x 2 - 0.81x + 4.1992 (R2 = 0.9707), the coefficient of determination R2 = 0.9707 indicates that the model has a very high degree of fit, and the model takes the minimum value at x = 7.8. Eventually, when the final MC is controlled to 8%, the bending test piece has the best shaping effect. The optimum demolding time and drying temperature were 6 h and 50°C, respectively.
The raw data supporting the conclusion of this article will be made available by the authors, without undue reservation.
HS: conceptualization, data curation, formal analysis, funding acquisition, writing–original draft, and writing–review and editing. DH: conceptualization, supervision, resources, and writing–review and editing. JZ: methodology, resources, writing–original draft, and writing–review and editing. XZ: formal analysis and writing–review and editing. LD: data curation, visualization, and writing–review and editing.
The authors declare that financial support was received for the research, authorship, and/or publication of this article. This study was financially supported by the Scientific Research Foundation in Fujian University of Technology, grant no. GY-Z220296 and the Enterprise Scientific Research Project of Huzhou Boloni Technology Co., Ltd., grant no. 2021ZD01A.
Author HS was employed by Huzhou Boloni Technology Co., Ltd.
The remaining authors declare that the research was conducted in the absence of any commercial or financial relationships that could be construed as a potential conflict of interest.
All claims expressed in this article are solely those of the authors and do not necessarily represent those of their affiliated organizations, or those of the publisher, the editors, and the reviewers. Any product that may be evaluated in this article, or claim that may be made by its manufacturer, is not guaranteed or endorsed by the publisher.
The Supplementary Material for this article can be found online at: https://www.frontiersin.org/articles/10.3389/fmats.2024.1278707/full#supplementary-material
Balfas, J. (2019). Impregnation of Teak extract and resins in rubberwood and fast-grown teak wood. J. Trop. For. Sci. 31 (2), 189–199. doi:10.26525/jtfs2019.31.2.189199
Barros, M., Duarte, J., and Chaparro, B. (2011). “Thonet Chair Design Grammar-a step towards the mass customization of furniture,” in CAAD futures 2011: designing together, 181–200.
Bekhta, P., and Niemz, P. (2003). Effect of high temperature on the change in color, dimensional stability and mechanical properties of spruce wood. Holzforschung 57 (5), 539–546. doi:10.1515/hf.2003.080
Broda, M., and Hill, C. A. S. (2021). Conservation of waterlogged wood—past, present and future perspectives. Forests 12 (9), 1193. doi:10.3390/f12091193
Cao, H., Huang, S., Yi, S., Gao, X., Zhou, F., and Zhou, Y. (2023). The effects of superheated steam heat-treatment on turpentine content and softening point of resin. Industrial Crops Prod. 192, 116139. doi:10.1016/j.indcrop.2022.116139
Dong, C., Zhang, S., Wang, J., and Chui, Y. H. (2021). Static bending creep properties of furfurylated poplar wood. Constr. Build. Mater. 269, 121308. doi:10.1016/j.conbuildmat.2020.121308
Fang, X. Y., Xu, W., and Huang, Q. T. (2019). Study on physical and mechanical properties of teak in tea plantation. For. Mach. Woodwork. Equip. 47 (05), 40–44+50. doi:10.13279/j.cnki.fmwe.2019.0056
Ganguly, S., Balzano, A., Petrič, M., Kržišnik, D., Tripathi, S., Žigon, J., et al. (2021). Effects of different energy intensities of microwave treatment on heartwood and sapwood microstructures in Norway spruce. Forests 12 (5), 598. doi:10.3390/f12050598
Graf, E., Matz, P., Auer, P., Kurzböck, C., Krenke, T., Painer, J., et al. (2024). Experimental and numerical analysis of the three-point bending behavior of hybrid adhesive-bonded aluminum–wood plates. J. Mater. Eng. Perform., 1–11. doi:10.1007/s11665-024-09343-4
Hill, C., Altgen, M., and Rautkari, L. (2021). Thermal modification of wood—a review: chemical changes and hygroscopicity. J. Mater. Sci. 56, 6581–6614. doi:10.1007/s10853-020-05722-z
Hillis, W., and Rozsa, A. (1985). High temperature and chemical effects on wood stability. Wood Sci. Technol. 19 (1), 93–102. doi:10.1007/bf00353070
Hiroshi, Y., and Makoto, M. (2021). Mode II critical stress intensity factor of solid wood obtained from the asymmetric four-point bend fracture test using groove-free and side-grooved samples. Eng. Fract. Mech. 258, 108043. doi:10.1016/j.engfracmech.2021.108043
Jiang, J. L., and Lv, J. X. (2014). Wet-heat coupling effect of dynamic viscoelasticity of wood. Forestry science 50 (12), 101–108.
Johana, G. A., Roger, M., and Alexander, B. (2019). The use of X-ray densitometry to evaluate the wood density profile of Tectona grandis trees growing in fast-growth plantations. Dendrochronologia 55, 71–79. doi:10.1016/j.dendro.2019.04.004
Krech, H. (1960). Investigations on the relation between bending strength of wood and the rate of bending. Holz als Roh- Werkst. 18, 233–236. doi:10.1007/bf02627208
Kweonhwan Hwang, I. J., and Lee, W. (2012) Bending quality of main Korean wood species. Kyoto university research information repository, 6–10.
Li, J. (1998). Bending process of softening wood by ammonia water treatment combined with microwave heating. Journal of Nanjing Forestry University (Natural Sciences Edition) 4, 55–59.
Liang, K. N., Zhou, Z. Z., Ma, H. M., et al. (2011). Development status, countermeasures and prospects of precious tree species teak plantation in China. J. Fujian For. Sci. Technol. 38 (04), 173–178.
Liu, Z. J., Li, L., and Bao, F. C. (2009). Study on influence factors of dimensional stability of curved wood samples. Journal of Nanjing Forestry University (Natural Sciences Edition) 33 (3), 95–98.
Makinaga, M., Norimoto, M., and Inoue, M. (1997). Permanent fixation of bending deformation of wood by steam treatment. Kyoto Univ. Res. Inf. Repos. 84, 39–41.
Mascarenhas, F., Dias, A., Christoforo, A., and Simões, R. (2023b). “Microwave technology and its applications to wood treatment and modification,” in Proceedings of the 17th World Conference on Timber Engineering (WCTE 2023), Oslo, Norway, 19-22 June 2023, 31–40.
Mascarenhas, F. J. R., Dias, A. M. P. G., and Christoforo, A. L. (2023a). Analysis of the influence of microwave treatment parameters of wood. Forests 14 (2), 194. doi:10.3390/f14020194
Mascarenhas, F. J. R., Dias, A. M. P. G., Christoforo, A. L., and Simões, R. M. (2024). Experimental investigation on the influence of microwave technology on the treatability and mechanical properties of Portuguese southern blue gum wood. Case Stud. Constr. Mater. 20, e02698. doi:10.1016/j.cscm.2023.e02698
Matsuo-Ueda, M., Yoshida, M., and Yamamoto, H. (2023). Analysis of hygrothermal recovery of tension wood induced by boiling at 50–80° C. Holzforschung 77 (4), 270–282. doi:10.1515/hf-2022-0162
Mikšik, M., Pervan, S., Klarić, M., Čavlović, A. O., Španić, N., and Prekrat, S. (2023). Čimbenici koji utječu na proces savijanja cjelovitog drva. Drv. Ind. 74 (1), 105–114. doi:10.5552/drvind.2023.0020
Nop, P., Cristini, V., Zlámal, J., Vand, M. H., Šeda, V., and Tippner, J. (2024). Determination of the static bending properties of green beech and oak wood by the frequency resonance technique. Forests 15 (1), 150. doi:10.3390/f15010150
Norimoto, M. (1983). Wood bending of Sugi and Hinoki from the thinning operation. Wood Res. 18, 93–102.
Norimoto, M., Akitsu, H., and Yamada, T. (1993). Permanent fixation of bending deformation in wood by heat treatment. Kyoto Univ. Res. Inf. Repos. 79, 12.
Norimoto, M., and Gril, J. (1989). Wood bending using microwave heating. J. Microw. Power 24 (4), 203–212. doi:10.1080/08327823.1989.11688095
Norimoto, M., Wada, H., Hasegawa, K., and Iida, I. (1980). Wood bending utilizing microwave heating. J. Soc. rheology 4, 166–171. doi:10.1678/rheology1973.8.4_166
Peck, E. C. (1957) Bending solid wood to form. 1st ed. Madison, America: U.S. Forest Service, 125–127.
Qin, G., Li, M., Fang, S., Deng, T., Huang, C., Mao, F., et al. (2024). Study of a grid-based regional localization method for damage sources during three-point bending tests of wood. Constr. Build. Mater. 419, 135348. doi:10.1016/j.conbuildmat.2024.135348
Schober, K. U., Hörnel-Metzger, B., Müller, M. L., Hofmann, N., Brüchert, F., and Sauter, U. H. (2023). “Green oak building with high-tech methods, Part 2: log bending tests for determination of strength and stiffness,” in Proceedings of the 17th World Conference on Timber Engineering (WCTE 2023), Oslo, Norway, 19-22 June 2023, 119–125.
Sharma, S. N., Pandey, C. N., Kanojia, H. C., et al. (1988). Wood bending by vapour phase ammonia plasticization. Indian For., 752–760.
Stevens, W. C., and Turner, N. (1970) Wood bending handbook. 1st ed. London, England: Woodcraft Supply Corporation, 6–9.
Suo-ling, W. (2021). Research on wood bending technology suitable for small batch and personalized furniture production. China For. Prod. Ind. 58 (7). doi:10.19531/j.issn1001-5299.202107010
Takahashi, N. (1968). Studies on hot pressing and drying process in the production of fibreboard III: softening of fibre components in hot pressing of fibre mat. Mokuzai Gakkaishi. 14, 75–79.
Uhmeier, A., Morooka, T., and Norimoto, M. (1998). Influence of thermal softening and degradation on the radial compression behavior of wet spruce. Holzforschung-International J. Biol. Chem. Phys. Technol. Wood 52 (1), 77–81. doi:10.1515/hfsg.1998.52.1.77
Wardrop, A. B. (1946). Cell wall deformations in wood fibres. Nature 158, 174–175. doi:10.1038/158174a0
Wardrop, A. B. (1951). Cell wall organization and the properties of the xylem 1. Cell wall organization and the variation of breaking load in tension of the xylem in conifer stems. Aust. J. Biol. Sci. 4, 391–414. doi:10.1071/bi9510391
Wu, Y., Zhu, J., Qi, Q., and Cui, L. (2022). Research progress of solid wood bending softening technology review. Wood Res. 67 (6), 1056–1073. doi:10.37763/wr.1336-4561/67.6.10561073
Yao, L., Sun, D., Wang, Z., and Yu, M. (2023). Triethanolamine impregnation/steam synergistic softening of teakwood to improve bending properties and its mechanism. Wood Material Sci. Eng. 18 (2), 618–629. doi:10.1080/17480272.2022.2057815
Yona, A. M. C., Žigon, J., Matjaž, P., and Petrič, M. (2021). Potentials of silicate-based formulations for wood protection and improvement of mechanical properties: a review. Wood Sci. Technol. 55 (4), 887–918. doi:10.1007/s00226-021-01290-w
Zh, G. S., and Sakhvadze, G. G. (2024). Analyzing the mechanisms of plate bending using a laser shock forming technology. J. Mach. Manuf. Reliab. 52 (Suppl. 1), S6–S16. doi:10.1134/s105261882309011x
Keywords: teak in plantation, hydrothermal treatment, microwave treatment, hydrothermal–microwave treatment, biomass
Citation: Huang D, Shen H, Zhang J, Zhuo X and Dong L (2024) Effects of hydrothermal–microwave treatment on bending properties of teak in plantation. Front. Mater. 11:1278707. doi: 10.3389/fmats.2024.1278707
Received: 16 August 2023; Accepted: 22 April 2024;
Published: 18 June 2024.
Edited by:
Farooq Sher, Nottingham Trent University, United KingdomReviewed by:
Emilia-Adela Salca, Transilvania University of Brașov, RomaniaCopyright © 2024 Huang, Shen, Zhang, Zhuo and Dong. This is an open-access article distributed under the terms of the Creative Commons Attribution License (CC BY). The use, distribution or reproduction in other forums is permitted, provided the original author(s) and the copyright owner(s) are credited and that the original publication in this journal is cited, in accordance with accepted academic practice. No use, distribution or reproduction is permitted which does not comply with these terms.
*Correspondence: Huajie Shen, c2hlbmh1YWppZUBmanV0LmVkdS5jbg==
Disclaimer: All claims expressed in this article are solely those of the authors and do not necessarily represent those of their affiliated organizations, or those of the publisher, the editors and the reviewers. Any product that may be evaluated in this article or claim that may be made by its manufacturer is not guaranteed or endorsed by the publisher.
Research integrity at Frontiers
Learn more about the work of our research integrity team to safeguard the quality of each article we publish.