
95% of researchers rate our articles as excellent or good
Learn more about the work of our research integrity team to safeguard the quality of each article we publish.
Find out more
ORIGINAL RESEARCH article
Front. Mater. , 28 November 2023
Sec. Biomaterials and Bio-Inspired Materials
Volume 10 - 2023 | https://doi.org/10.3389/fmats.2023.1298873
 Umar Nishan1*
 Noaman Khan1
 Nawshad Muhammad2
 Saifullah Afridi1
 Amir Badshah1
 Mohibullah Shah3Muhammad Asad1Raheed Ullah1Haris Niamat1
 Riaz Ullah4
 Essam A. Ali5
 Suvash Chandra Ojha6*
Uric acid is directly linked to gout, arthritis, neurological, cardiovascular, and kidney-related disorders. It is a byproduct obtained from the breakdown of purines and a significant indicator of hyperuricemia observed in both urine and blood. In the absence of any enzyme, it's quite difficult to develop a novel, cost-effective, and clinical method for uric acid detection. Herein, we report a very simple, low-cost, and non-enzymatic method for the selective identification and quantification of uric acid using green synthesized silver nanoparticles (Ag NPs). The desired Ag NPs were synthesized by the hydrothermal method using Erythrina suberosa sawdust as a deagglomeration agent and Psidium guajava extract as a reductant. The synthesis of the sensing platform, i.e., sawdust-deposited Ag NPs, was confirmed through different techniques such as UV-Vis spectrophotometer, FTIR, XRD, EDX, and scanning electron microscopy (SEM). Sawdust can offer a good, environmentally friendly, and cost-effective strategy to overcome the problem of agglomeration in nanoparticles. The enzyme mimic, with the help of H2O2, oxidizes the colorless 3,3′,5,5′-tetramethylbenzidine (TMB) to oxidized TMB with a blue-green color. The addition of uric acid reduces the oxidized TMB to a colorless product, resulting in a colorimetric change. For quality improvement, different reaction parameters, including pH, time, TMB, and NPs concentration, were optimized. Our proposed sensor responds in linear ranges of 0.04–0.360 μM, with a limit of quantification of 0.01 μM and a limit of detection of 0.004 μM. The suggested enzyme mimic detected uric acid in blood samples, with particular specificity in the presence of competitive analytes.
Uric acid (UA) is a significant indicator of human health associated with a number of diseases, including renal failure, heart disorders, kidney stones, arthritis, and gout (Tripathi et al., 2020). Uric acid formation arises as a consequence of the breakdown of the two indigenous purines and a foreign nucleotide pool (Chaudhary et al., 2013). Besides this, several other reasons, including both acute and chronic ones, might lead to elevated serum uric acid levels. For instance, high alcohol consumption and a diet that contains purines or proteins cause high levels of uric acid. Alternately, circumstances resulting in a decline in the rate of glomerular filtration, an increase in total tube absorption, or a decrease in uric acid excretion can lead to persistent hyperuricemia (Choi et al., 2005). Owing to its role as a biomarker of numerous diseases, it is important to monitor its concentration in an eco-friendly and cost-effective manner.
Uric acid determination has previously been reported through advanced techniques including enzyme-based (Jiang et al., 2007), chemiluminescence (Zhang et al., 2011), liquid chromatography (Zuo et al., 2011), electrochemiluminescence, etc (Tao et al., 2012). However, due to their high cost and complicated procedures, these approaches are only useful in laboratories with abundant resources and state-of-the-art facilities. The problems associated with enzymes like low shelf life, high cost, difficult handling, and sensitivity to temperature make it necessary to search for viable alternatives like nanozymes (Wu et al., 2020a; Wu et al., 2021). Today, scientists are showing a keen interest in developing non-enzymatic sensing platforms for various biomarkers (Wu et al., 2017; Wu et al., 2020b). Compared to the methods listed above, the colorimetric biosensor method for UA detection is a very quick, easy, inexpensive, highly selective, and sensitive approach and should be highly recommended. Additionally, colorimetric sensors provide the added advantage of visual monitoring of the progress of a reaction through the unaided eye (Nishan et al., 2021a). Researchers are demonstrating a keen interest in nanomaterial-based sensing platforms (Asad et al., 2022; Nishan et al., 2023).
There have been several types of nanoparticles employed in biosensors, including metals, oxides, semiconductors, and composite nanoparticles. Despite the fact that these nanoparticles have distinct functions in various sensing systems, a lot of the physical characteristics of nanostructures are significantly distinct from those of bulk materials and are capable of distinctive applications (Garg and Kumar, 2011). Different elements, such as gold nanoparticles and reduced graphene oxide (Mazzara et al., 2021), and iron oxide nanoparticles (Cai et al., 2019), were recently employed to detect uric acid with peculiar specificity. To do this, new nanoparticles have to be adapted; nevertheless, they have recently been tested for agglomeration, uptake, and interaction with a range of living cells using a high-resolution system (Groll et al., 1996). Presently, Ag NPs have a significant role in the fabrication of nanobiosensors due to their excellent conductivity, tunable properties, low cost, easy synthesis, and accessibility (Nishan et al., 2021b). On the other side, sawdust is a cheap and widely available resource that can be used as a possible deagglomeration agent for nanoparticles and offers key benefits (Sevilla et al., 2007). The synthesis of silver nanoparticles can be mediated by the use of certain plant extracts. These extracts, owing to the presence of good reducing agents, provide a safe, easy, and free of toxic chemicals route for synthesis. The Psidium guajava plant has been reported for its medicinal value and is cultivated in different parts of the world. Its leaf extract has been reported to have ascorbic acid, enzymes, proteins, polysaccharides, polyphenols, flavonoids, etc. These agents, owing to their strong reducing potential, can help in the synthesis of silver nanoparticles by interaction with silver ions (Wang et al., 2016).
Sawdust is produced in large quantities as a byproduct of the wood processing industry. It is treated as waste or burned, adding to the increase in carbon emissions. However, we designed this work to capitalize on its abundant and low-cost availability, its porous structure, and its large specific surface area (Pariyar et al., 2020). Moreover, the presence of rich organic matter in the form of cellulose, hemicellulose, lignin, etc. provides it with a large number of functional groups, including hydroxyl and carboxyl groups (Kalavathy et al., 2005). Previously, erythrina subersoa leaf extract was used in the synthesis of Ag NPs by Mohanta et al. (2017). The synthesized nanoparticles were used for their cytotoxic, antimicrobial, and antioxidant potential. In the present work, we used erythrina subersoa sawdust as a deagglomeration strategy, whereas Psidium guajava plant extract is being used as a reductant. Moreover, we used our fabricated platform for colorimetric detection instead of bioassays.
In this study, we synthesized Erythrina suberosa-deposited silver nanoparticles (Ag NPs) from Psidium guajava leaf extract. A hydrothermal procedure was used for the colorimetric sensing of uric acid for the first time. During the synthesis process, Erythrina suberosa sawdust was used to enhance the sensing capabilities of Ag NPs. A novel, quick, highly sensitive, and specific uric acid detection method was used to oxidize 3,3′,5,5′-tetramethylbenzidine (TMB) in the presence of hydrogen peroxide. In order to obtain the best efficiency of the proposed biosensor, a variety of reaction parameters, comprising (a) the amount of nanoparticles; (b) pH; (c) TMB level; and (d) incubation time, have been optimized. The suggested biosensor was assessed for peculiar selectivity and sensitivity under the influence of the above-mentioned optimal factors.
All the required chemicals, including sodium hydroxide (NaOH) (≥97.0%), 3,3′,5,5′-tetramethylbenzidine (TMB), hydrochloric acid (HCl) (90%), and uric acid (UA) (C5H4N4O3, 98%), were obtained from Sigma Aldrich United States. The PBS solutions with different pH levels were purchased from BioWorld. All these chemicals were used directly out of the bottle in their purest form. Deionized water from an ElgaPurelab was used to prepare solutions. Throughout the experimental procedure, high-quality glassware and ultra-pure deionized water were used.
For the FTIR spectrum data analysis of the synthesized Ag NPs, the characteristic peaks of Ag NPs were identified through the FTIR spectrum with 256 scans per sample at 4 cm−1 resolution (Agilent Technologies of Danbury FTIR spectrometer). The selected range to get the samples’ FTIR spectra was 4,000–400 cm−1. A scanning electron microscope equipped with an energy-dispersive X-ray (EDX) system was used for the size, morphology, and elemental analyses of the prepared nanoparticles. SEM technology was used to determine the dimensions and shape of the suggested Ag NPs (SEM-EDX) with a TESCAN VEGA (LMU) (Oxford Instruments). While the crystalline structure and different states of the synthesized Ag NPs were examined by diffraction of an X-ray XRD-6100 system (Bruker Smart Apex CCD) equipped with monochromatic Cu- Kα radiation (λ = 0.15418 nm). The UV-Vis spectra of the Ag NPs and samples used for experimentation were recorded using an ultraviolet-visible spectrophotometer (Shimadzu, UV, 1800; Japan).
To prepare the extract, we first gathered the green leaves of Psidium guajava and then cleaned them with distilled water. Then it was incubated in a dust-free, exposed-to-sunlight environment for 4 days. This was followed by heat drying before being blended into a fine powder. The liquid extract was produced by mixing 20 mg of leaf powder with about 300 mL of water. The beaker was spun for 3 h at 1,100 rpm and 60°C with continuous stirring using a magnetic stirrer. It followed that filtration was done using filter paper, and then the extract was stored in bottles. About 50 mL of extract solution, dropwise, was mixed with an equal amount of AgNO3 solution (50 mL) and put on a heated plate at 50°C and 1,100 rpm for 1 h. Along with 1 g of Erythrina suberosa sawdust, add it while stirring. Solid Ag NPs were obtained by centrifugation of the synthesized solution of Ag NPs for 15 min at 4,500 rpm.
The detection analysis of Uric Acid in the presence of the proposed Ag NPs biosensor was done by oxidizing 3,3′,5,5′-tetramethylbenzidine (TMB) dye with hydrogen peroxide. Briefly, an Eppendorf tube containing 2 mg of NPs, 0.5 mL of PBS (pH 4), 0.2 mL of TMB (40 mM), and 0.2 mL of H2O2 were used for colorimetric sensing. About 0.360 μM uric acid was added and incubated for 3–5 min at optimized conditions to detect and visualize the colorimetric changes. The spectra of absorption for the final solution were obtained through a UV-Vis spectrophotometer.
In order to validate the system of the proposed Ag NP-based uric acid biosensor, the following key characterization techniques were used.
UV-visible spectroscopy is one of the most commonly employed methods used to describe the structural features of nanoparticles. A UV-Vis spectroscopy of Ag NPs was recorded, as shown in Figure 1. The band at 393 nm corresponds to the literature-reported peak and supports the synthesis of Ag NPs (Rashid et al., 2013). In metal nanoparticles such as silver, the conduction band and valence band lie very close to each other, allowing electrons to move freely. These free electrons give rise to a SPR absorption band (Noginov et al., 2006), which occurs due to the collective oscillation of electrons in silver nanoparticles in resonance with the light wave. This absorption strongly depends on the particle size, dielectric medium, and chemical surroundings. Small spherical nanoparticles (<20 nm) exhibit a single surface plasmon band (He et al., 2002).
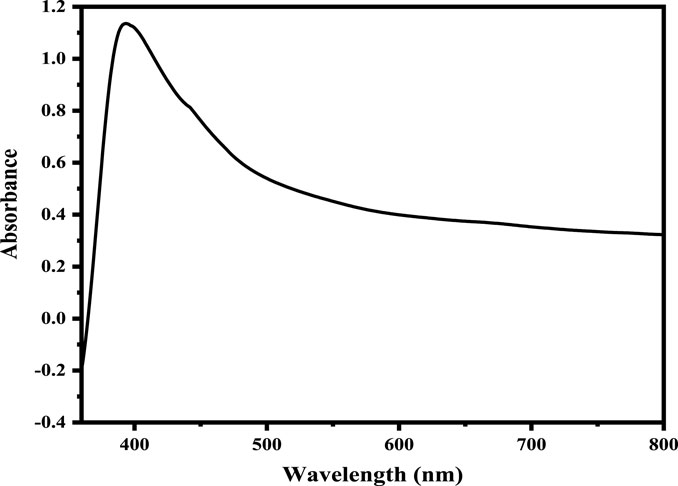
FIGURE 1. UV-Vis spectrum of the as-synthesized Ag NPs with the surface Plasmon resonance around 393 nm.
The FTIR spectrum was recorded as shown in Figure 2. In the spectrum, various bands are seen at various locations. The spectrum demonstrated wide bands of absorption at 3,392.17 cm−1, which corresponds to the amine groups present in our mimic enzyme. The band around 1,630.52 cm−1 indicates the presence of a double bond (C=C) in the aromatic rings. The band absorption at 1,063.55 cm−1 corresponds to the C-O linkages present in the carboxylic and hydroxyl groups. The band around 480 cm−1 indicates the presence of an interaction of silver with oxygen present in our synthesized mimic enzyme (Asad et al., 2022).
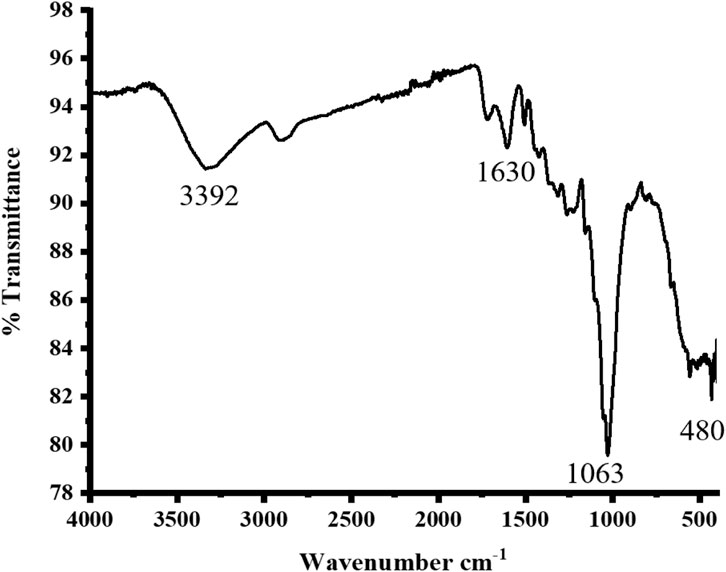
FIGURE 2. FTIR spectrum of the synthesized sawdust-deposited Ag NPs with characteristic bands present in the platform.
The XRD pattern of Ag NPs is shown in Figure 3. It illustrates two diffraction peaks with miller indices of 111 and 200, as shown in the XRD pattern of synthetic Ag NPs, which are centered at 2 = 38 and 44, respectively. The diffraction peaks in the XRD pattern of the synthesized Ag NPs (JCPDS No. 14-0644) confirm the creation of Ag with an orthorhombic phase. The mean size of particles was calculated using the Scherrer formula based on the orthorhombic phase of the Ag NPs using the most powerful peak. The average crystal-size of orthorhombic-phase Ag NPs was found to be about 8 nm (Nishan et al., 2020).
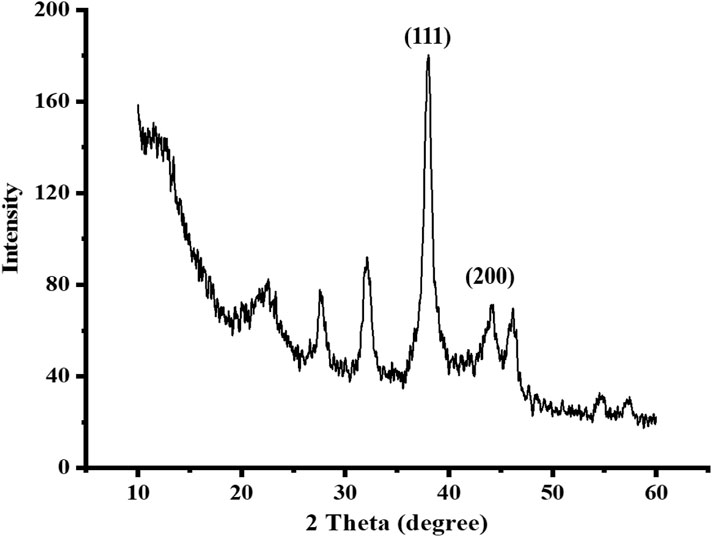
FIGURE 3. XRD analysis of the synthesized sawdust-deposited Ag NPs shows the fabrication of Ag with an orthorhombic phase.
Through EDX assessment, the chemical composition of the sawdust-deposited Ag NPs was examined, as shown in Table 1; Figure 4. This proved that, along with other elements, Ag was also found in the prepared platform. The weight contents of Ag, O, C, K, and Cl were determined by EDX analysis to be 9.12, 44.25, 45.30, 0.41, and 0.92, respectively. Carbon and oxygen are visible due to their former exposition in the atmosphere. In an earlier study, Gardea-Torresdey et al. (2003) obtained the formation of individual spherical-shaped silver nanoparticles in the range 2.5–4 keV by using Alfalfa.

TABLE 1. EDX analysis of the synthesized sawdust-deposited Ag NPs.
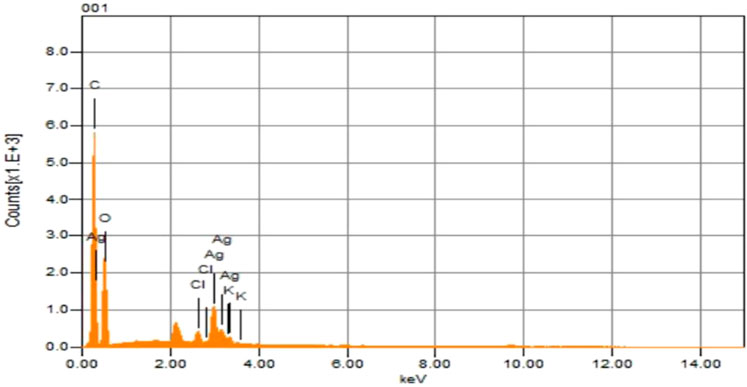
FIGURE 4. EDX analysis of the synthesized sawdust-deposited Ag NPs indicates the presence several of elements, including Ag, in the fabricated platform.
The surface structure of the synthesized sawdust-deposited Ag NPs was studied through scanning electron microscopy (SEM), as shown in Figures 5A–D. As indicated by the images taken at different magnifications, the synthesized Ag NPs are homogenously distributed on the surface of the sawdust. Here, the sawdust helps in the deagglomeration of the Ag NPs, which is helpful in enhancing their activity as a biosensing platform for the detection of uric acid. The lattice-like structure with a high surface area, as can be seen from the images, shows the beneficial effect of sawdust.
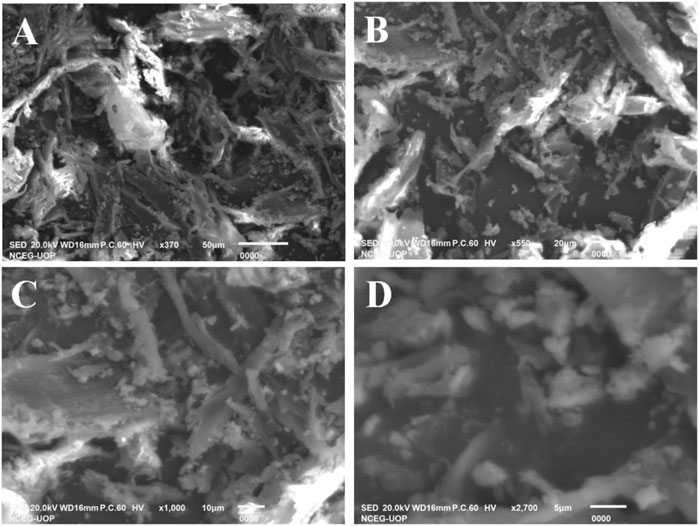
FIGURE 5. SEM analysis of the synthesized sawdust-deposited Ag NPs with different magnification images (A–D). The images indicate the role of sawdust in the homogenous dispersion of Ag NPs.
Uric acid (UA) was detected by quick and precise colorimetric sensing of the proposed Erthrina suberosa-deposited silver nanoparticles, as shown in Figure 6. The adsorption of hydrogen peroxide on the surface of NPs results in the production of OH radicals, which are subsequently connected to the oxidation of TMB to create blue-green compounds. The blue-green result was further reduced to colorless when uric acid was introduced to the process. The production of OH radicals from the adsorption of peroxide from hydrogen on the surface of NPs contributes to the oxidation of TMB and the development of blue-green molecules. The solution transformed from a blue-green substance to a light, clear substance that could be seen with the unaided eye when uric acid was added. A UV-Vis spectrophotometer can also be used to detect the colorimetric change. We also used a negative control with Eryhtrina suberosa sawdust instead of Ag NPs to make sure the colorimetric shift was only caused by NPs, as shown in Figure 6A. No color change was noticed when hydrogen peroxide and uric acid were combined, proving that only the proposed Ag NPs biosensor can detect uric acid, as shown in Figure 6B.
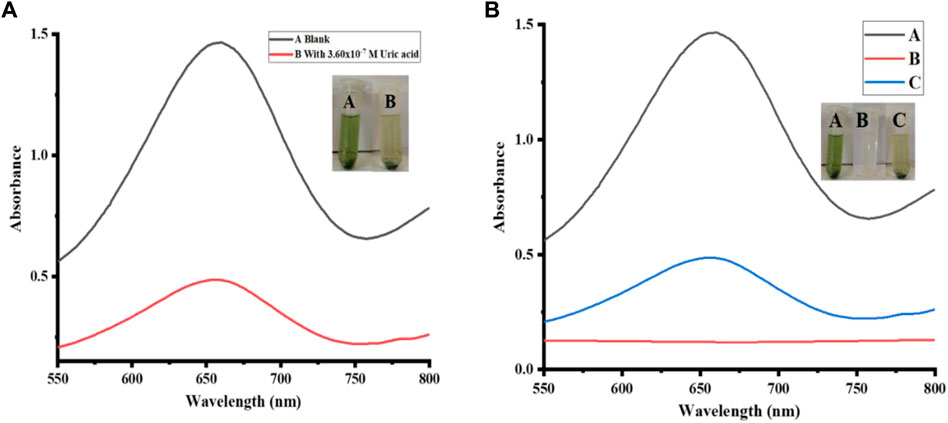
FIGURE 6. Uric Acid Detection: (A) Represent UV-Vis spectroscopic and colorimetric detection of uric acid. (B) shows the negative control reaction; curve A corresponds to the blank solution; curve B corresponds to the sawdust reaction in which sawdust was used instead of Ag NPs; and curve C corresponds to the main reaction with uric acid. Reaction conditions were: (A) NPs amount [2 mg, PBS 500 µL (pH 4), TMB 200 µL (40 mM), H2O2 200 μL, uric acid 200 µL (0.360 μM), (B) sawdust 2 mg, PBS 500 µL (pH 4), TMB 200 µL (40 mM), H2O2 200 μL, uric acid 200 µL (0.360 μM)].
The proposed mimic enzyme, in the presence of H2O2, acts as an oxidizing agent and oxidizes TMB into a blue-green product. The Ag NPs deposited on the sawdust were enriched by the electron transfer from TMB. As a result, our synthesized mimic enzyme transferred electrons to H2O2 and broke them down to OH-free radicals and water. The OH radical thus formed results in the oxidation of TMB, and a blue-green color is formed. As we add uric acid to this system, it converts the oxidized TMB back to its reduced form (colorless). At the same time, the uric acid oxidizes to allantoin, as shown in Scheme 1.
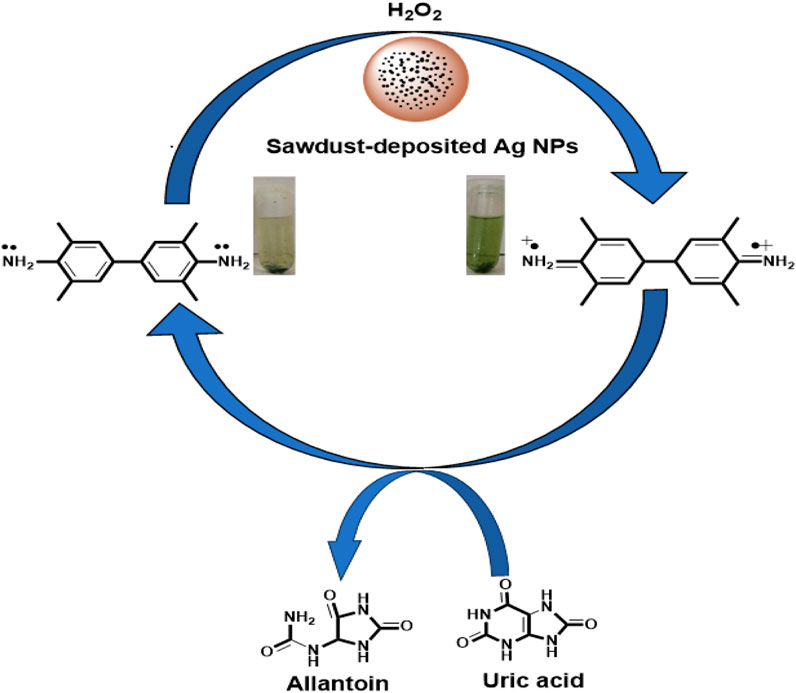
SCHEME 1. Proposed mechanism for the sensing of uric acid through the fabricated platform.
For the best colorimetric sensing reaction, first the nanoparticles concentration was optimized and found to be around 4 mg of NPs, as indicated in Figure 7. Briefly, various NP concentrations were added to the respective test tubes, keeping the other parameters consistent. No further inconsistency was noticed in the colorimetric reaction, even when the amount of NPs was raised or decreased. Therefore, 4 mg was chosen as the optimal dose and employed in further tests, as shown in Figure 7. While in the case-reported literature, Nishan et al. (2022), reported that 40 μL of IL-capped NiNPs was optimum for the colorimetric detection of uric acid.
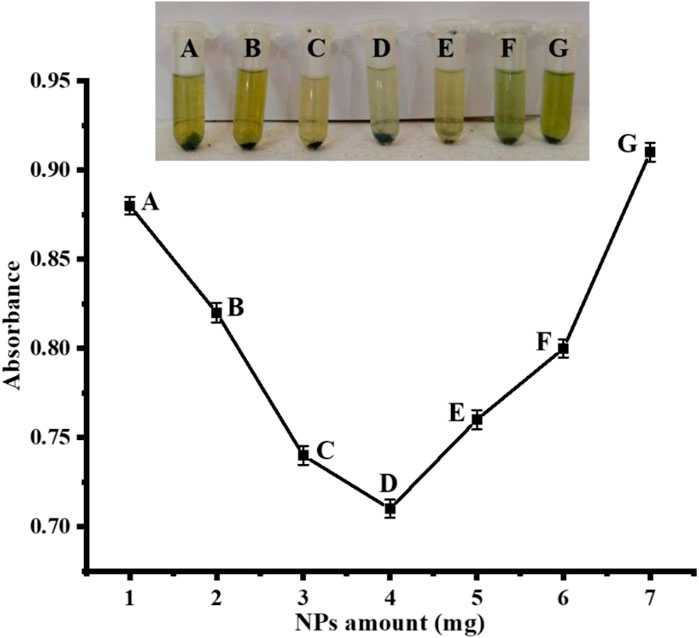
FIGURE 7. Optimization of Ag NPs amount [Cond. PBS 500 µL (pH 4), TMB 200 µL (40 mM), H2O2 200 μL, uric acid 200 µL (0.360 μM)].
After NPs optimization, we also optimized the best TMB concentration, which was used in different concentrations so as to get the best colorimetric response. We prepared TMB solutions of different concentrations, ranging from 25 to 55 mM. The colors turned light translucent when uric acid was introduced, and the sensor responded best when TMB was used at a 40 mM concentration, as shown in Figure 8. At doses lower or higher than 40 mM, the colorimetric reaction was not as fine-tuned. Therefore, the best optimum TMB concentration was determined to be 40 mM and was used in the remaining biosensing reactions. Irrespective of its previously reported 0.8 mM concentration (Pan et al., 2018), in our current finding, the TMB solution shows the optimal result at a 40 mM concentration. The main possible reason for these differences may be the nature, composition, and oxidizing power of the different nanostructures.
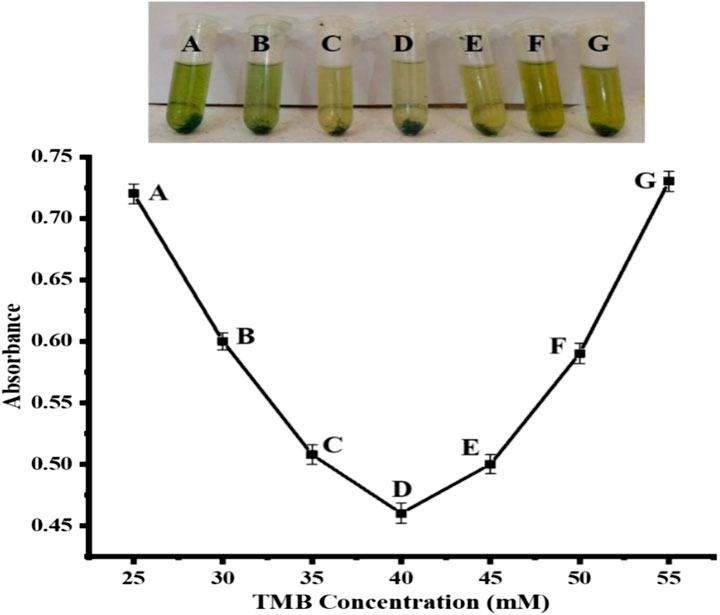
FIGURE 8. TMB optimization [Cond. NPs amount 4 mg, PBS 500 µL (pH 4), H2O2 200 μL, uric acid 200 µL (0.360 μM)].
The pH of the solution being used has an important effect on the biosensor system. It either improves or decreases the biosensor’s efficiency. As shown in Figure 9, the impact of pH on the biosensor was investigated using different pH 3–11 PBS solutions. At pH 4, there were significant effects, while very little colorimetric change occurred at pH 5–6. Higher pH (7–11) or lower than pH 3 demonstrate no colorimetric changes. Thus, it indicates that pH 4 provides the best colorimetric response and that pH 4 was determined to be the optimum pH for the proposed biosensor, as shown in Figure 9. Our group reported 7.5 as the optimum pH for colorimetric detection of uric acid (Nishan et al., 2022). However, the reaction takes place at pH 4 in a typical enzymatic situation (Lu et al., 2015).
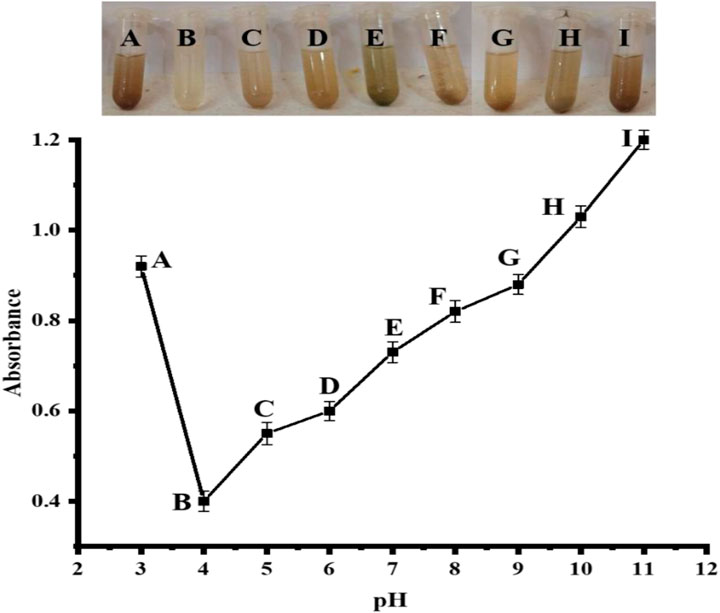
FIGURE 9. pH optimization of synthesized Ag NPs [Cond. NPs amount 4 mg, PBS 500 µL (pH 4), H2O2 200 μL, uric acid 200 µL (0.360 μM)].
Time is one of the most influential factors in numerous biochemical reactions. Therefore, the effect of time on the sensor was investigated at different time periods ranging from 1–6 min. After 4 min of incubation, the process had consumed all of the Ag NPs, and nothing further had changed. Therefore, 4 min was chosen as the perfect time frame for the suggested biosensor as shown in Figure 10. In the reported literature, Chen et al. (2012), reported that 30 min was optimum for the proposed reaction, which was much higher than our proposed reaction.
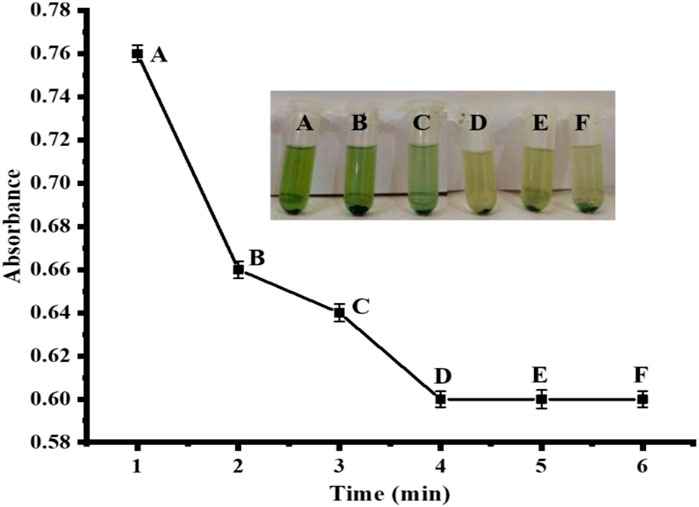
FIGURE 10. Time optimization [Cond. NPs amount 4 mg, PBS 500 µL (pH 4), TMB 200 µL (40 mM), H2O2 200 μL, uric acid 200 µL (0.360 μM)].
After individual parameter optimization, the prepared Ag NPs were used under optimal experimental conditions to measure different levels of uric acid. The quantitative assessment of uric acid has been performed with a very precise yet sensitive colorimetric response. This was based on the relationship between uric acid concentration and its intensity of absorption at 652 nm. The uric acid detection ability of the newly designed sensor has been assessed using a variety of uric acid concentrations. Figure 11 suggests how colorimetric biosensors react with different uric acid levels. The sensor sensitivity and peak intensity were high at lower uric acid concentrations; however, as the uric acid concentration increased, they linearly decreased. Overall uric acid detection in this method has an R2 value of 0.998 and a linear range of 0.04–0.360 μM. The limit of detection (LOD) has been determined to be 0.004 μM, whereas the limit of quantification, or LOQ, was found to be 0.01 μM. When compared to other previously explained detection methods, the proposed colorimetric technique has the advantages of a low limit of detection, cost-effectiveness, and direct eye observation. This shows that our sensor is able to sense UA sensitively. As given in Table 2, comparing our research with the previously reported colorimetric methods for uric acid detection, our current biosensors have a good linear range and limit of detection.
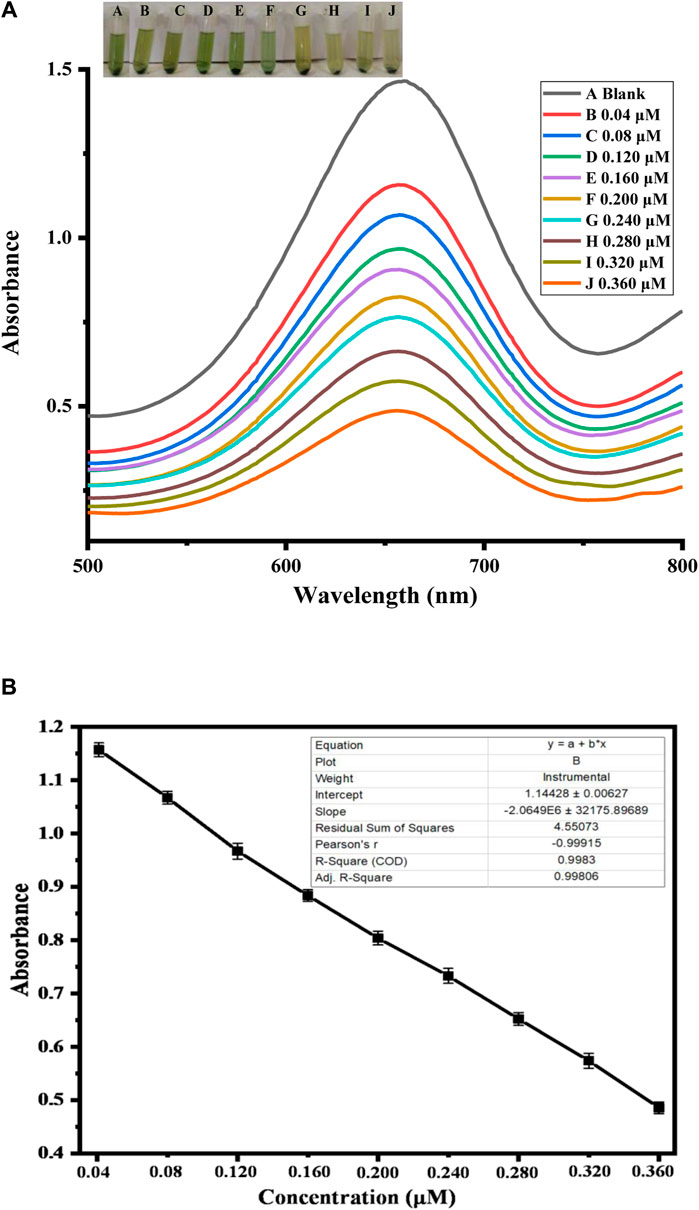
FIGURE 11. (A) In the presence of different uric acid amounts under optimum conditions, colorimetric uric acid detection (B) is calibrated on a graph between different uric acid levels and absorbance.
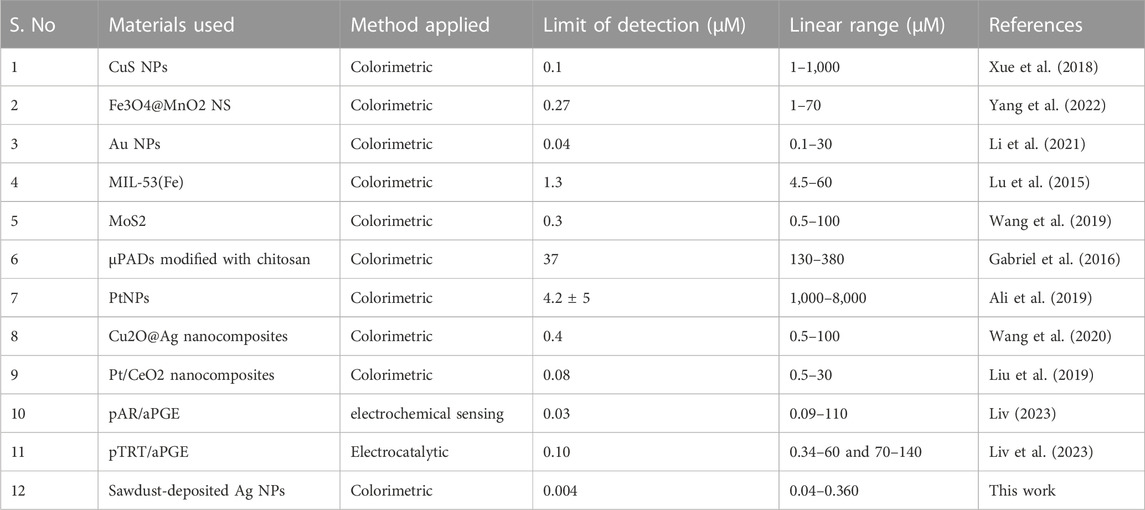
TABLE 2. Comparison of colorimetric biosensor for uric acid with some recently reported studies.
The proposed sensor’s productivity with a variety of biomedical applications for clinical diagnosis is greatly influenced by interference tests. Human serum provides significant obstacles to numerous analytical methods for uric acid detection because it contains a large variety of potentially interfering species. These difficulties are primarily related to the selectivity of the sensor rather than just the detection range and sensitivity of biosensors. The proposed method allowed for the selective detection of uric acid while accounting for competing biomolecules and ions in serum (Nishan et al., 2021c). Multiple coexisting substances were used to test the selectivity and specificity of the proposed AgNPs biosensor, including hydrogen peroxide, glucose, ascorbic acid, nitrile, lead, and uric acid. When compared with uric acid, lead, hydrogen peroxide, glucose, ascorbic acid, nitrile, and ascorbic acid all have relatively high absorption values, as shown in Figure 12. However, adding uric acid greatly decreases its absorption value at 652 nm, even in the presence of these interfering species, which failed to result in an apparent decrease in absorbance. The results show that sawdust-deposited Ag NPs biosensors have a high selectivity and good sensitivity for uric acid detection. According to the findings, the presence of these interfering compounds does not interfere with the ability to detect uric acid. As a result, the proposed biosensor has a lot of promise for testing uric acid detection in real-life specimens.
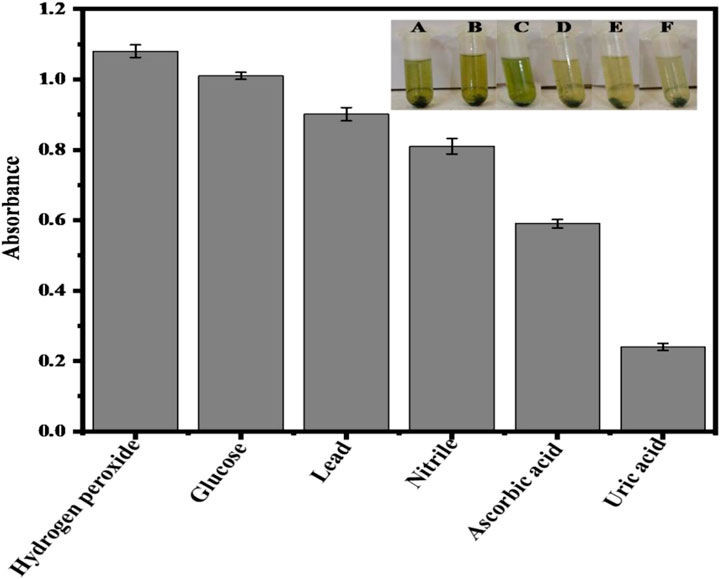
FIGURE 12. The response of the proposed sensor to different possible interfering compounds having the same concentration of 0.360 μM. (A) Hydrogen peroxide (B) Glucose (C) Lead (D) Nitrile (E) Ascorbic acid (F) Uric acid. All the experiments were conducted in triplicate and the data were presented as the standard error of the mean.
The proposed biosensor was used to detect uric acid in the real body’s fluids. We used it to detect and quantify uric acid concentration in physiologic solution at levels of 0.162, 0.201, and 0.243 μM. Figure 13 data indicates that the absorbance peak rises as the physiological solution’s uric acid level increases. It shows that the proposed sensor has the ability to detect uric acid in physiologic fluid. Furthermore, this method removes the need for sample preparation and allows rapid identification of uric acid in physiological solutions. This technique could offer a new angle for developing a cheap, simple, and highly accurate uric acid biosensor that is highly probable too.
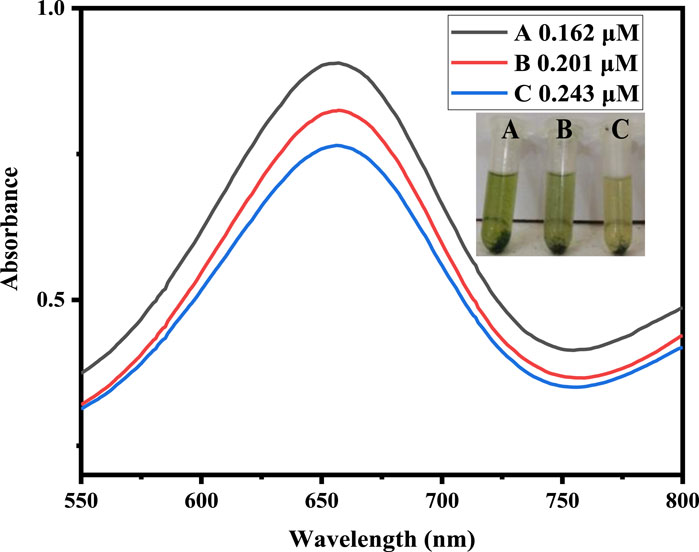
FIGURE 13. The proposed sensor response with different physiological solutions at optimized experimental conditions [Cond. NPs amount 4 mg, PBS 500 µL (pH 4), TMB 200 µL (40 mM), H2O2 200 μL, uric acid physiological solution 200 µL (0.162, 0.201, and 0.243 μM).
In conclusion, Ag NPs were synthesized by using Psidium guajava extract and deposited on Erythrina suberosa sawdust via the hydrothermal method for the colorimetric detection of uric acid. All the characterization confirmed the synthesis of the sawdust-deposited Ag NPs. Leaf extract, owing to the presence of bioactive substances, demonstrated a good reduction potential to quickly synthesize silver nanoparticles when they interact with silver ions. Sawdust containing phenols and lignocelluloses can assist in metal reduction and provide surface area. The synthesized sawdust-deposited Ag NPs showed oxidase-like activity, which helped in the non-enzymatic detection of uric acid in serum samples. The presence of a silver lattice in Ag NPs increases its catalytic activity and results in a considerably greater surface area. In the absence of any enzyme, uric acid in blood samples may be identified through an easy method with excellent sensitivity, specificity, accuracy, excellent linearity across a wide range, and a low limit of detection using these biosensors.
The original contributions presented in the study are included in the article/Supplementary material, further inquiries can be directed to the corresponding authors.
UN: Conceptualization, Funding acquisition, Supervision, Validation, Visualization, Writing–review and editing. NK: Data curation, Formal Analysis, Investigation, Methodology, Writing–original draft. NM: Conceptualization, Methodology, Writing–review and editing. SA: Formal Analysis, Investigation, Methodology, Writing–original draft. MS: Formal Analysis, Investigation, Software, Validation, Writing–review and editing. MA: Data curation, Formal Analysis, Investigation, Methodology, Validation, Writing–original draft. RaU: Data curation, Investigation, Writing–original draft. HN: Data curation, Formal Analysis, Investigation, Writing–original draft. RiU: Data curation, Funding acquisition, Project administration, Resources, Software, Validation, Visualization, Writing–review and editing. EA: Formal Analysis, Funding acquisition, Project administration, Resources, Validation, Writing–review and editing. SO: Conceptualization, Funding acquisition, Resources, Supervision, Validation, Visualization, Writing–review and editing.
The author(s) declare financial support was received for the research, authorship, and/or publication of this article. This research work was supported by the Doctoral Research Fund awarded to SCO. The authors also appreciate researchers supporting Project number (RSP-2023R45) King Saud University, Riyadh, Saudi Arabia.
Authors wish to thanks Researchers Supporting Project Number (RSP-2023R45) at King Saud University Riyadh Saudi Arabia for financial support and the Doctoral Research Fund, China, for financial support.
The authors declare that the research was conducted in the absence of any commercial or financial relationships that could be construed as a potential conflict of interest.
All claims expressed in this article are solely those of the authors and do not necessarily represent those of their affiliated organizations, or those of the publisher, the editors and the reviewers. Any product that may be evaluated in this article, or claim that may be made by its manufacturer, is not guaranteed or endorsed by the publisher.
Ali, M., Khalid, M. A. U., Shah, I., Kim, S. W., Kim, Y. S., Lim, J. H., et al. (2019). Paper-based selective and quantitative detection of uric acid using citrate-capped Pt nanoparticles (PtNPs) as a colorimetric sensing probe through a simple and remote-based device. New J. Chem. 43, 7636–7645. doi:10.1039/c9nj01257e
Asad, M., Muhammad, N., Khan, N., Shah, M., Khan, M., Khan, M., et al. (2022). Colorimetric acetone sensor based on ionic liquid functionalized drug-mediated silver nanostructures. J. Pharm. Biomed. Analysis 221, 115043. doi:10.1016/j.jpba.2022.115043
Cai, Z., Ye, Y., Wan, X., Liu, J., Yang, S., Xia, Y., et al. (2019). Morphology–dependent electrochemical sensing properties of iron oxide–graphene oxide nanohybrids for dopamine and uric acid. Nanomaterials 9, 835. doi:10.3390/nano9060835
Chaudhary, K., Malhotra, K., Sowers, J., and Aroor, A. (2013). Uric acid-key ingredient in the recipe for cardiorenal metabolic syndrome. Cardiorenal Med. 3, 208–220. doi:10.1159/000355405
Chen, X., Chen, J., Wang, F., Xiang, X., Luo, M., Ji, X., et al. (2012). Determination of glucose and uric acid with bienzyme colorimetry on microfluidic paper-based analysis devices. Biosens. Bioelectron. 35, 363–368. doi:10.1016/j.bios.2012.03.018
Choi, H. K., Mount, D. B., and Reginato, A. M. (2005). Pathogenesis of gout. Ann. Intern. Med. 143, 499–516. doi:10.7326/0003-4819-143-7-200510040-00009
Gabriel, E. F., Garcia, P. T., Cardoso, T. M., Lopes, F. M., Martins, F. T., and Coltro, W. K. (2016). Highly sensitive colorimetric detection of glucose and uric acid in biological fluids using chitosan-modified paper microfluidic devices. Analyst 141, 4749–4756. doi:10.1039/c6an00430j
Gardea-Torresdey, J. L., Gomez, E., Peralta-Videa, J. R., Parsons, J. G., Troiani, H., and Jose-Yacaman, M. (2003). Alfalfa sprouts: a natural source for the synthesis of silver nanoparticles. Langmuir 19, 1357–1361. doi:10.1021/la020835i
Garg, A., and Kumar, N. (2011). Formulation, characterization and application on nanoparticle: a review. Der Pharm. Sin. 2.
Groll, A., Shah, P., Mentzel, C., Schneider, M., Just-Nuebling, G., and Huebner, K. (1996). Trends in the postmortem epidemiology of invasive fungal infections at a university hospital. J. Infect. 33, 23–32. doi:10.1016/s0163-4453(96)92700-0
He, R., Qian, X., Yin, J., and Zhu, Z. (2002). Preparation of polychrome silver nanoparticles in different solvents. J. Mater. Chem. 12, 3783–3786. doi:10.1039/b205214h
Jiang, Y., Wang, A., and Kan, J. (2007). Selective uricase biosensor based on polyaniline synthesized in ionic liquid. Sensors Actuators B Chem. 124, 529–534. doi:10.1016/j.snb.2007.01.016
Kalavathy, M. H., Karthikeyan, T., Rajgopal, S., and Miranda, L. R. (2005). Kinetic and isotherm studies of Cu (II) adsorption onto H3PO4-activated rubber wood sawdust. J. colloid interface Sci. 292, 354–362. doi:10.1016/j.jcis.2005.05.087
Li, F., He, T., Wu, S., Peng, Z., Qiu, P., and Tang, X. (2021). Visual and colorimetric detection of uric acid in human serum and urine using chitosan stabilized gold nanoparticles. Microchem. J. 164, 105987. doi:10.1016/j.microc.2021.105987
Liu, X., Wang, X., Qi, C., Han, Q., Xiao, W., Cai, S., et al. (2019). Sensitive colorimetric detection of ascorbic acid using Pt/CeO2 nanocomposites as peroxidase mimics. Appl. Surf. Sci. 479, 532–539. doi:10.1016/j.apsusc.2019.02.135
Liv, L. (2023). A facile Poly (Allura Red) film for Signal-Amplified electrochemical sensing of dopamine and uric acid in human plasma and urine. Microchem. J. 195, 109425. doi:10.1016/j.microc.2023.109425
Liv, L., Portakal, M., Çukur, M. S., Topaçlı, B., and Uzun, B. (2023). Electrocatalytic determination of uric acid with the poly (Tartrazine)-Modified pencil graphite electrode in human serum and artificial urine. ACS omega 8, 34420–34430. doi:10.1021/acsomega.3c02561
Lu, J., Xiong, Y., Liao, C., and Ye, F. (2015). Colorimetric detection of uric acid in human urine and serum based on peroxidase mimetic activity of MIL-53 (Fe). Anal. Methods 7, 9894–9899. doi:10.1039/c5ay02240a
Mazzara, F., Patella, B., Aiello, G., O'Riordan, A., Torino, C., Vilasi, A., et al. (2021). Electrochemical detection of uric acid and ascorbic acid using r-GO/NPs based sensors. Electrochimica Acta 388, 138652. doi:10.1016/j.electacta.2021.138652
Mohanta, Y. K., Panda, S. K., Jayabalan, R., Sharma, N., Bastia, A. K., and Mohanta, T. K. (2017). Antimicrobial, antioxidant and cytotoxic activity of silver nanoparticles synthesized by leaf extract of Erythrina suberosa (Roxb.). Front. Mol. Biosci. 4, 14. doi:10.3389/fmolb.2017.00014
Nishan, U., Gul, R., Muhammad, N., Asad, M., Rahim, A., Shah, M., et al. (2020). Colorimetric based sensing of dopamine using ionic liquid functionalized drug mediated silver nanostructures. Microchem. J. 159, 105382. doi:10.1016/j.microc.2020.105382
Nishan, U., Haq, S. U., Rahim, A., Asad, M., Badshah, A., Ali Shah, A.-u.-H., et al. (2021c). Ionic-liquid-stabilized TiO2 nanostructures: a platform for detection of hydrogen peroxide. ACS omega 6, 32754–32762. doi:10.1021/acsomega.1c04548
Nishan, U., Niaz, A., Muhammad, N., Asad, M., Khan, N., Khan, M., et al. (2021b). Non-enzymatic colorimetric biosensor for hydrogen peroxide using lignin-based silver nanoparticles tuned with ionic liquid as a peroxidase mimic. Arabian J. Chem. 14, 103164. doi:10.1016/j.arabjc.2021.103164
Nishan, U., Rehman, S., Ullah, R., Bari, A., Afridi, S., Shah, M., et al. (2023). Fabrication of a colorimetric sensor using acetic acid-capped drug-mediated copper oxide nanoparticles for nitrite biosensing in processed food. Front. Mater. 10, 1169945. doi:10.3389/fmats.2023.1169945
Nishan, U., Sabba, U., Rahim, A., Asad, M., Shah, M., Iqbal, A., et al. (2021a). Ionic liquid tuned titanium dioxide nanostructures as an efficient colorimetric sensing platform for dopamine detection. Mater. Chem. Phys. 262, 124289. doi:10.1016/j.matchemphys.2021.124289
Nishan, U., Ullah, W., Muhammad, N., Asad, M., Afridi, S., Khan, M., et al. (2022). Development of a nonenzymatic colorimetric sensor for the detection of uric acid based on ionic liquid-mediated nickel nanostructures. ACS omega 7, 26983–26991. doi:10.1021/acsomega.2c04070
Noginov, M., Zhu, G., Bahoura, M., Adegoke, J., Small, C., Ritzo, B., et al. (2006). Enhancement of surface plasmons in an Ag aggregate by optical gain in a dielectric medium. Opt. Lett. 31, 3022–3024. doi:10.1364/ol.31.003022
Pan, Y., Yang, Y., Pang, Y., Shi, Y., Long, Y., and Zheng, H. (2018). Enhancing the peroxidase-like activity of ficin via heme binding and colorimetric detection for uric acid. Talanta 185, 433–438. doi:10.1016/j.talanta.2018.04.005
Pariyar, P., Kumari, K., Jain, M. K., and Jadhao, P. S. (2020). Evaluation of change in biochar properties derived from different feedstock and pyrolysis temperature for environmental and agricultural application. Sci. Total Environ. 713, 136433. doi:10.1016/j.scitotenv.2019.136433
Rashid, M. U., Bhuiyan, M. K. H., and Quayum, M. E. (2013). Synthesis of silver nano particles (Ag-NPs) and their uses for quantitative analysis of vitamin C tablets. Dhaka Univ. J. Pharm. Sci. 12, 29–33. doi:10.3329/dujps.v12i1.16297
Sevilla, M., Sanchís, C., Valdés-Solís, T., Morallón, E., and Fuertes, A. (2007). Synthesis of graphitic carbon nanostructures from sawdust and their application as electrocatalyst supports. J. Phys. Chem. C 111, 9749–9756. doi:10.1021/jp072246x
Tao, Y., Zhang, X., Wang, J., Wang, X., and Yang, N. (2012). Simultaneous determination of cysteine, ascorbic acid and uric acid by capillary electrophoresis with electrochemiluminescence. J. Electroanal. Chem. 674, 65–70. doi:10.1016/j.jelechem.2012.03.009
Tripathi, A., Harris, K. D., and Elias, A. L. (2020). Peroxidase-like behavior of Ni thin films deposited by glancing angle deposition for enzyme-free uric acid sensing. ACS omega 5, 9123–9130. doi:10.1021/acsomega.9b04071
Wang, L., Wei, W., Tian, X., Shi, K., and Wu, Z. (2016). Improving bioactivities of polyphenol extracts from Psidium guajava L. leaves through co-fermentation of Monascus anka GIM 3.592 and Saccharomyces cerevisiae GIM 2.139. Industrial Crops Prod. 94, 206–215. doi:10.1016/j.indcrop.2016.08.043
Wang, X., Lu, J., Tang, X., and Qiu, P. (2020). Colorimetric detection of uric acid with high sensitivity using Cu2O@ Ag nanocomposites. Chem. Afr. 3, 749–758. doi:10.1007/s42250-020-00122-x
Wang, X., Yao, Q., Tang, X., Zhong, H., Qiu, P., and Wang, X. (2019). A highly selective and sensitive colorimetric detection of uric acid in human serum based on MoS2-catalyzed oxidation TMB. Anal. Bioanal. Chem. 411, 943–952. doi:10.1007/s00216-018-1524-6
Wu, L., Yin, W., Tan, X., Wang, P., Ding, F., Zhang, H., et al. (2017). Direct reduction of HAuCl4 for the visual detection of intracellular hydrogen peroxide based on Au-Pt/SiO2 nanospheres. Sensors Actuators B Chem. 248, 367–373. doi:10.1016/j.snb.2017.03.166
Wu, L., Zhang, M., Zhu, L., Li, J., Li, Z., and Xie, W. (2020b). Nanozyme-linked immunosorbent assay for porcine circovirus type 2 antibody using HAuCl4/H2O2 coloring system. Microchem. J. 157, 105079. doi:10.1016/j.microc.2020.105079
Wu, L., Zhou, M., Wang, Y., and Liu, J. (2020a). Nanozyme and aptamer-based immunosorbent assay for aflatoxin B1. J. Hazard. Mater. 399, 123154. doi:10.1016/j.jhazmat.2020.123154
Wu, L., Zhou, S., Wang, G., Yun, Y., Liu, G., and Zhang, W. (2021). Nanozyme applications: a glimpse of insight in food safety. Front. Bioeng. Biotechnol. 9, 727886. doi:10.3389/fbioe.2021.727886
Xue, W., Cheng-Ling, T., Jia-Jun, L., Zhang, H.-Z., and Jian, W. (2018). Ultra-small CuS nanoparticles as peroxidase mimetics for sensitive and colorimetric detection of uric acid in human serum. Chin. J. Anal. Chem. 46, e1825–e1831. doi:10.1016/s1872-2040(17)61083-1
Yang, W., Fei, J., Xu, W., Jiang, H., Sakran, M., Hong, J., et al. (2022). A biosensor based on the biomimetic oxidase Fe3O4@ MnO2 for colorimetric determination of uric acid. Colloids Surfaces B Biointerfaces 212, 112347. doi:10.1016/j.colsurfb.2022.112347
Zhang, T., Sun, X., and Liu, B. (2011). Synthesis of positively charged CdTe quantum dots and detection for uric acid. Spectrochimica Acta Part A Mol. Biomol. Spectrosc. 79, 1566–1572. doi:10.1016/j.saa.2011.05.014
Keywords: colorimetric biosensors, gout, enzyme mimic, Ag NPs, TMB
Citation: Nishan U, Khan N, Muhammad N, Afridi S, Badshah A, Shah M, Asad M, Ullah R, Niamat H, Ullah R, A. Ali E and Ojha SC (2023) Colorimetric sensing of uric acid based on sawdust-deposited silver nanoparticles via an eco-friendly and cost-effective approach. Front. Mater. 10:1298873. doi: 10.3389/fmats.2023.1298873
Received: 22 September 2023; Accepted: 13 November 2023;
Published: 28 November 2023.
Edited by:
Ganesh Dattatraya Saratale, Dongguk University Seoul, Republic of KoreaReviewed by:
Long Wu, Hainan University, ChinaCopyright © 2023 Nishan, Khan, Muhammad, Afridi, Badshah, Shah, Asad, Ullah, Niamat, Ullah, A. Ali and Ojha. This is an open-access article distributed under the terms of the Creative Commons Attribution License (CC BY). The use, distribution or reproduction in other forums is permitted, provided the original author(s) and the copyright owner(s) are credited and that the original publication in this journal is cited, in accordance with accepted academic practice. No use, distribution or reproduction is permitted which does not comply with these terms.
*Correspondence: Umar Nishan, dW1hcm5pc2hhbjg1QGdtYWlsLmNvbQ==; Suvash Chandra Ojha, c3V2YXNoX29qaGFAc3dtdS5lZHUuY24=
Disclaimer: All claims expressed in this article are solely those of the authors and do not necessarily represent those of their affiliated organizations, or those of the publisher, the editors and the reviewers. Any product that may be evaluated in this article or claim that may be made by its manufacturer is not guaranteed or endorsed by the publisher.
Research integrity at Frontiers
Learn more about the work of our research integrity team to safeguard the quality of each article we publish.