 Bowen Han1
 Gege Su1Yong Zeng1,2,3*Jialong Yang1Xiuwen Fan1,2,3
 Yongcheng Zhang1,2,3Hong Zhang1,2,3Jianping Wang1,2,3
- 1College of Mechanical Electrification Engineering, Tarim University, Alar, China
- 2Key Laboratory of Modern Agricultural Engineering, Tarim University, Alar, Xinjiang, China
- 3Key Laboratory of Tarim Oasis Agriculture (Tarim University), Ministry of Education, Alar, Xinjiang, China
Walnut shell breaking is an important aspect of post-harvest processing. However, shell-breaking results differ significantly from ideal uniaxial compression results. In this paper, the effect of multipoint loading on the walnut shell-breaking mechanism by combining FDEM with cohesive elements was investigated. The model for walnuts was created using micro-X-ray CT scans and experimental data. Simulation parameters describing mechanical properties were calibrated through modeling the uniaxial compression experiment. The loading point locations were quantitatively described in terms of top and azimuthal angles. The results show that the crack ex-tension rate increases with the number of loading points and the singularity value, and the maximum value of the four-point loading speed is about 450 m/s. The number of cracks is only related to the number of loading points and is not related to the location of the loading point. In addition, three loading methods are proposed, and the fastest crack propagation rate is achieved when the azimuthal angle of four-point loading is 0, 150, 180, and 330, respectively. These findings may serve as a theoretical foundation for studying shell crushing.
1 Introduction
Walnuts are one of the four major nuts globally, and the internal kernel is rich in nutrients (Sütyemez et al., 2021). From 2010 to 2019, there was a noticeable rise in walnut production, with an increase of approximately 1.17 million tons. The walnut processing industry was under stricter requirements to cope with the increased production of walnuts. During primary processing, walnuts require size grading, shell cracking, and shell-kernel separation. Among these processing procedures, the quality of shell cracking is key in achieving deep product processing. Unfortunately, unexpected phenomena like uncracked shells and broken kernels frequently occur. It disobeys the walnut cracking objective where the shell’s fragmentation degree is maximized and the integrity of the kernel is ensured as much as possible. To do this, numerous scholars have developed innovative methods for walnut cracking. For example, the pretreatment of external shells (Syed et al., 2016; Zhao et al., 2021) and the development of new walnut cracking devices have been used (Lim et al., 2016; Kacal and Koyuncu, 2017; Zhang et al., 2018; Carlos Gianpaul et al., 2020). It is worth acknowledging that the above methods can somewhat improve the probability of shell crushing and kernel integrity. The technical requirements for further improvement of pretreatment methods and walnut shell-breaking devices are based on the visible crushing results of walnut shells. To fundamentally solve the theoretical difficulties of walnut shell breaking, it is necessary to start by elucidating the fracture mechanism of walnuts, as Han et al. (2020) and Zheng and Tannant (2018). have done in the field of rocks. Among the studies on fracture mechanism, the study on crack extension characteristics is its key step.
So far, studies on cracking are still a much-needed challenge. As in previous studies (Liu and Sancaktar, 2018; Zhou et al., 2019; Xianjie et al., 2020; Wu et al., 2022), they investigated the effect of various factors, including the aggregation of fillers, geometry of defects and loading rate, on crack extension at the macroscopic level. They used techniques such as high-speed cameras to analyze this process. However, macroscopic crushing is caused by changes in mechanical properties at the microscopic level, which cannot be obtained experimentally, i.e., theoretical and methodological logical limitations limit the above study, so they did not further investigate the crack extension characteristics at the microscopic level.
Fortunately, combining finite and discrete element methods (FDEM) with a cohesive zone fracture model has been extensively applied in particle fragmentation for a considerable period. For example, Zhang et al. (2020). reconstructed the microstructures of metallic composites using digital imaging techniques and microscale cohesive elements and confirmed the effectiveness of cohesive elements in predicting the process of crack initiation and extension by compressing graphite particles. Kumar Verma et al. (2022) proposed a combined numerical and experimental approach to study crack generation and extension in brittle rocks. Han et al. (2020) explored the shear behavior of rock-like materials containing cracks based on the FEM-CZM approach. The results showed that the shearing process is divided into four stages. The mechanical properties, shear deformation, crack initiation, extension, and merging depend on the shape of the crack pores. Li et al. (2017) proposed a new pore pressure cohesive element for simulating the hydraulically induced crack propagation and agreed well with the experimental results. To summarize, combining FDEM with the cohesive element makes it possible to simulate the crack opening and merging process during crack propagation. This approach can handle more complex scenarios like crack bifurcation and deflection, greatly enhancing numerical simulations’ precision and dependability. Cohesive elements are commonly utilized to model crack extension mechanisms in diverse solid particle materials, including composite materials, metallic materials, and rocks (Gálvez et al., 2002; Ma, 2014; Ma et al., 2018; Rabczuk et al., 2008). However, shell particles, which are different from solid particles, significantly differ in structural composition and mechanical properties. Therefore, studying shell particles, is of great practical and engineering significance, especially for the study of walnut shells. The conclusions obtained not only help reveal the mechanism of crack propagation during walnut shelling but also help elucidate how to increase the shelling efficiency of walnuts by improving structural parameters and optimizing operational parameters.
It is essential to determine the mechanical and deformation characteristics of agricultural products. To accomplish this, uniaxial compression tests are regarded as one of the most critical testing techniques (Tamás et al., 2015; Celik et al., 2017; Kacal and Koyuncu, 2017; Gao et al., 2021; Yu et al., 2023). However, the number of contacts in the actual machining process is different from the ideal uniaxial compression case for both solid and shell materials. For example, Fang et al. (2022) investigated the effect of multi-contact loading on the fracture criterion and crushing mode of individual particles, as well as the relationship between particle crushing strength and loading distribution, and showed that the logarithm of the mean principal stress has a linear correlation with the number of coordination. Todisco Todisco et al. (2017) studied how the number of coordination affects particle fracture and found that factors such as particle morphology and material also significantly impact particle strength. However, how cracks affect material fragmentation in multi-point loading is still unclear. Meanwhile, according to the study of thin shell theory, four-point loading was found to favor the fracture of granular materials, but the intrinsic cause is still not elucidated. Therefore, the use of FDEM combined with cohesive elements and multi-point loading is important to gain insight into the crack formation and fracture of walnut shells.
This study examines the crack extension mechanism of walnut shells using the FDEM combined with cohesive. The process of the walnut model from 3D reconstruction to meshing is described in Section 2.1, while Section 2.2 briefly introduces the constitutive model adopted in this study. The microscopic parameters were calibrated in Section 2.3, and the mesh sensitivity and loading rate sensitivity were analyzed. A method for quantitatively describing the location of loading points is presented in Section 2.4. Section 3.1 analyses how the number and location of loading points affect the crack extension rate, while Section 3.2 verifies the relationship between the number of loading points and the number of cracks, from the perspective of energy dissipation. Finally, Section 4 provides the main conclusions of this work.
2 Materials and methods
2.1 Model building
Taking the Wen-185 walnuts as an example, the breakage mechanisms of cereal grains are initially explored. In practice, cereal grains like walnut and jacaranda, are generally non-axis-symmetrical particles due to W ≠ D, as shown in Figure 1A. To build the walnut model, the dimensions (length L, width W, and thickness D) of 2000 randomly selected walnuts were measured using vernier calipers. The equivalent diameter
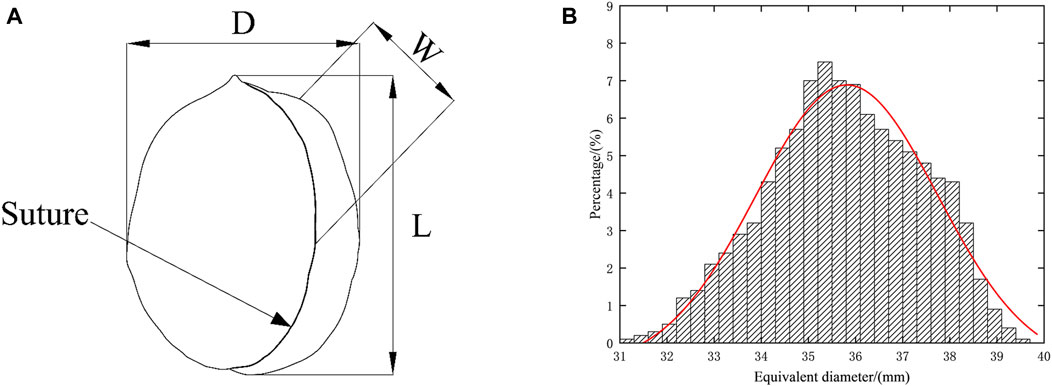
FIGURE 1. (A) Triaxial dimensional measurement points of walnuts in the experiment. (B) Equivalent diameter distribution of walnuts.
It is interesting to note that the walnut particles’ equivalent diameter distribution aligns well with the normal distribution, with an average diameter of 35.81 mm, as depicted in Figure 1B. The thickness of the shell for 2000 walnut sutures,
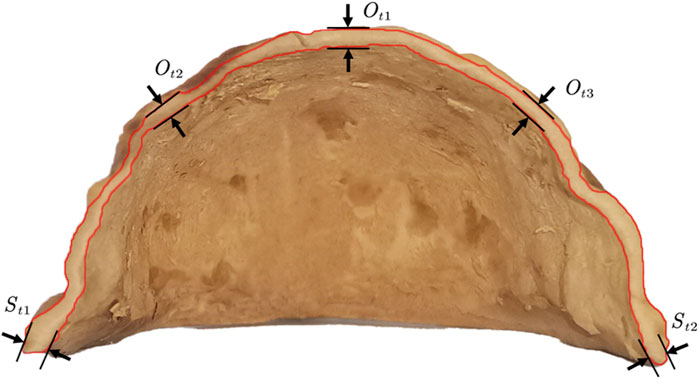
FIGURE 2. Walnut suture and face shell thickness measurement points.
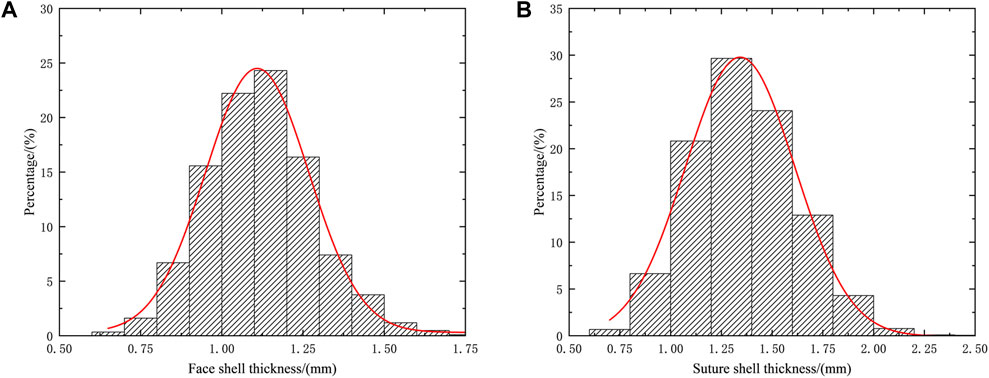
FIGURE 3. (A) Distribution of suture shell thickness of walnuts, (B) Walnut face shell thickness distribution.
Figure 4 depicts the process of constructing the FDEM model for walnuts. Firstly, the median size was chosen based on the walnut size distribution obtained in the previous section. Next, a 3D model was obtained through the reconstruction of walnuts using 3D scanning. Thirdly, Hyper Works commercial software was used to mesh the walnut model and restore its original morphology as much as possible. Finally, cohesive elements were added along the solid element boundary using the Abaqus plug-in.
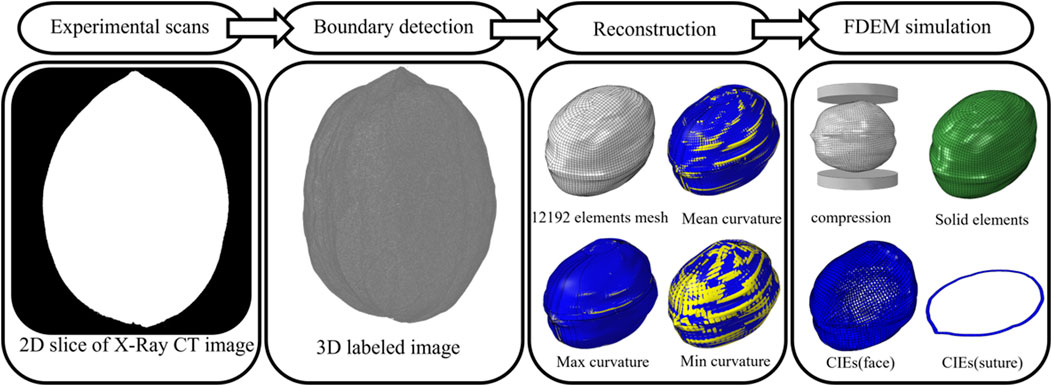
FIGURE 4. Walnut FDEM establishment process.
2.2 Constitutive model used in the simulation sample preparation
The finite-discrete element method (FDEM), created by Munjiza and other (Munjiza et al., 1995), is a numerical simulation technique that allows for dynamic simulations of multiple interacting bodies. The simulation can start with a single intact domain or a collection of intact bodies. As the simulation progresses, these bodies can deform elastically, translate, rotate, interact, and fracture, producing new discrete bodies. The FDEM approach combines finite element method (FEM) techniques to evaluate the deformation and assess the failure criterion for fracturing, along with discrete element method (DEM) concepts to detect new contacts and manage the translation, rotation, and interaction of discrete bodies (Tatone and Grasselli, 2015). This combined technique allows for the simulation of complex mechanical systems like rock, soil, and geomechanics, where continuous and discontinuous deformations and fracture processes occur.
Various types of traction separation methods can be used to simulate the damage behavior of different materials. One example applied a bilinear softening law to model the behavior of quasi-brittle materials like concrete. On the other hand, an exponential softening law can be used to simulate the behavior of ductile materials such as metals. The length of the cohesive zone or fracture process zone can be determined experimentally or numerically. In the case of brittle materials, the fracture process zone’s length is relatively short and can be assumed to be directly proportional to the crack size. The fracture process zone can be extended for ductile materials and may depend on various factors such as material properties and loading conditions. Before damage initiation, the traction-displacement relationship is assumed to be linear and expressed in terms of a constitutive matrix.
When damage begins, the traction-displacement relationship becomes nonlinear and can be explained using a cohesive zone model. This model assumes that the fracture process area is an internal interface that links the two sides of the crack, and a traction-separation law can define the mechanical actions of this zone. The traction-separation law depicts the correlation between the traction and the relative displacement of the fracture surfaces inside the process area.
Fractures are characterized by zero-thickness cohesive interface elements (CIEs) inserted during the model-building stage using Abaqus user-defined subroutine along inter-element boundaries. The traction-displacement relationship adheres to the linear elasticity law before damage occurs. As soon as the cohesive zone begins to bear the load, the element stiffness decreases, and the material’s load-bearing capacity is reduced when the CIEs meet the fracture criterion. Finally, the interface element fails, and new cracks form. According to this theory, when the tensile strength of a material is exceeded at the tip of an opening (Mode I) crack, a zone characterized by non-linear behavior, known as the fracture process zone (FPZ), begins to form (Labuz et al., 1985). When dealing with brittle geomaterials, the FPZ is characterized by interlocking and micro-cracking. Despite damage, it can distribute load across fracture walls. The crack elements may yield and break under different conditions, such as Mode I (opening mode), Mode II (sliding mode), or mixed Mode I-II, depending on the local stress and relative displacement of the crack walls (Tatone and Grasselli, 2015).
The cohesive crack model requires the maximum traction
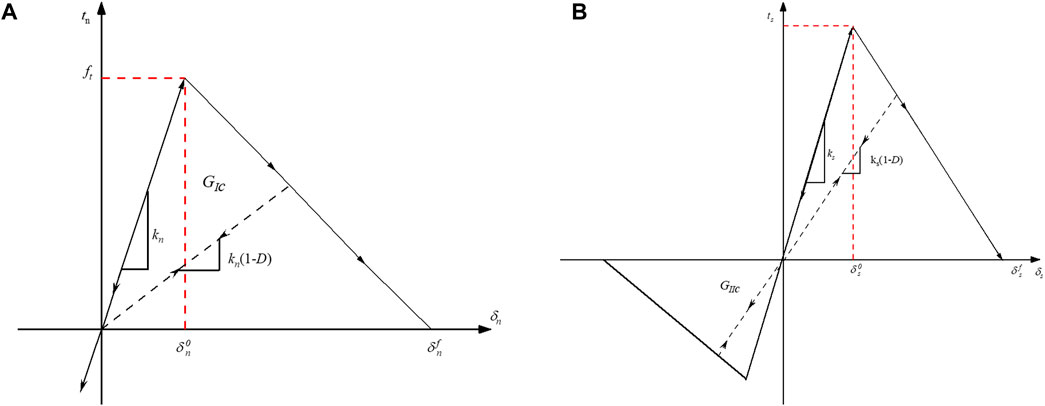
FIGURE 5. Cohesive element traction separation model.
Note that the sign convention in engineering mechanics is adopted with tensile stress as positive (Ma, 2018).
2.3 Parameter calibration
To conduct uniaxial compression experiments on the walnut model, it was simulated using Abaqus. The compression involved rigid plates for loading and fixing, which moved at a speed of 0.02 mm/s during parameter calibration. The cohesive zone models (CZM) utilized micro-strength parameters to control particle crushing strength, which showed a positive correlation. Additionally, an increase in the micro-effective modulus increased the slope of the force-displacement curve.
Walnuts were subjected to a uniaxial compression test using a non-metallic universal material testing machine (WD-D3, Shanghai Jotec Instruments Co., Ltd., Figure 6A, where the inset shows the fracture results of real walnuts). The loading rate was set to 2 mm/min. The walnut samples were sourced from the Aksu region of Xinjiang. The moisture content of the walnut shells was ascertained using an Electric heating blast drying oven (model GZX-9140 MBE, produced by Shanghai Boxun Medical Biological Co., Figure 6B). The average moisture content of the walnut shells in the test group was 7.87%.
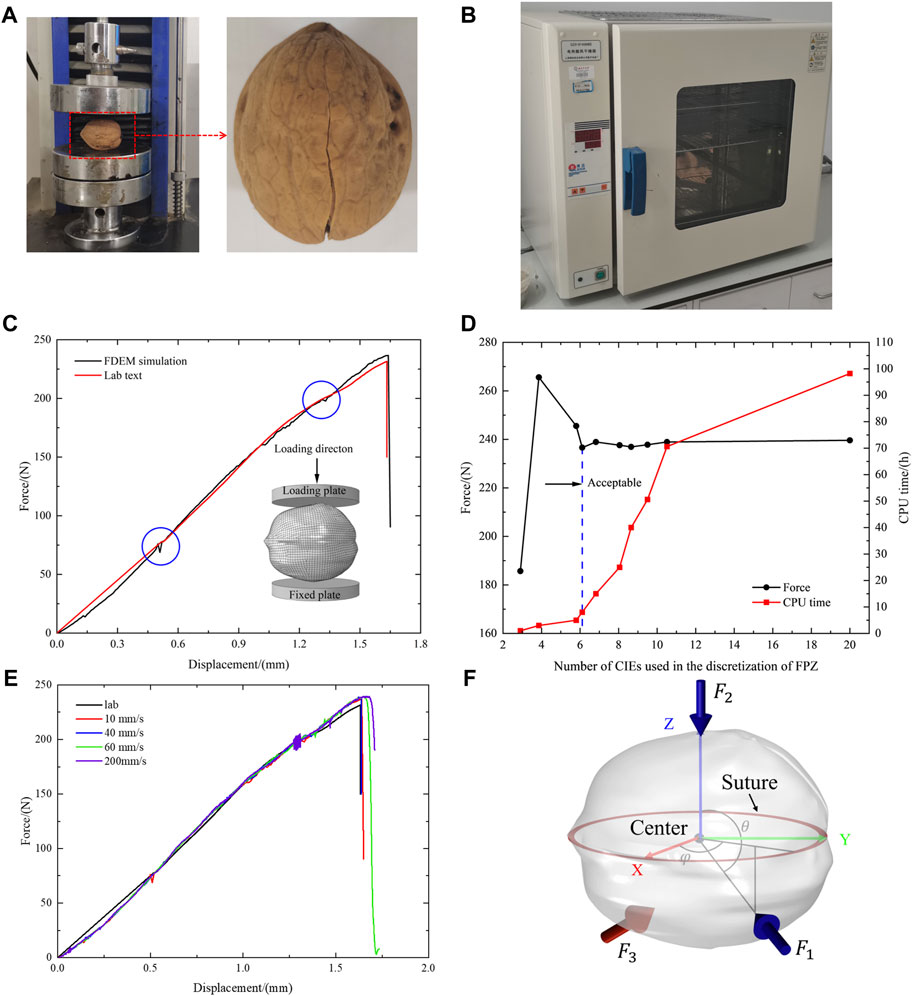
FIGURE 6. (A) Non-metallic universal material testing machine. (B) Electric heating blast drying oven. (C) Comparison with the simulated result and the experimental data. The inset displays the test model. (D) Mesh sensitivity analysis. (E) Load rate sensitivity analysis. (F) Three-point loading schematic.
Based on the previous understanding, the force-displacement curve obtained through simulation matches well with the experimental curve displayed in Figure 6C. It is important to note that the model accurately depicts the actual situation of the walnut shell, resulting in a convex angle and fluctuations in the curves shown in the Figure 6C. Table 1 lists the input parameters used to represent the walnut model. To prevent any relative sliding between the model and the rigid wall, a contact friction coefficient of 0.3 is set. Abaqus explicit module was used for numerical simulations, with mass scaling disabled to prevent changes in material density and related impacts on momentum and energy. The velocities used in the simulations were those calibrated in Section 2.3.2, with each rigidly loaded plate moving simultaneously toward the center of the particle.
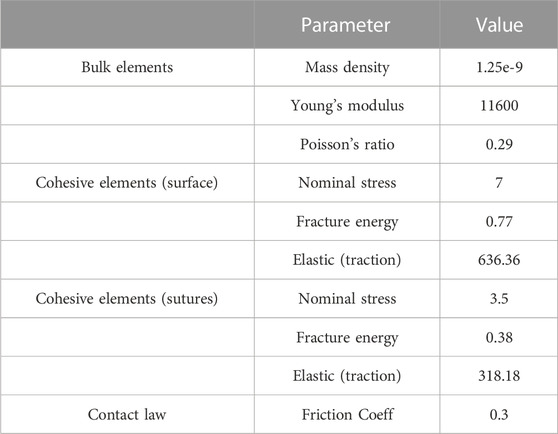
TABLE 1. Input parameters used in uniaxial compression simulations.
2.3.1 Mesh sensitivity
When using the standard cohesive zone model, it is crucial to consider the effect of the mesh size. The elements must be smaller than the FPZ length to achieve reliable results. If fewer elements are used to discretize the FPZ, the stress gradient before fracture and fracture energy may not be accurately depicted. According to Guo [32] and Turon [33], the FPZ length
Where E is the material Young’s modulus,
Table 2; Figure 6D show the results of testing ten different meshes of varying sizes at a velocity of 0.02 mm/s. The simulations were conducted for Single Axis Compression using 20 Intel Xeon 2.4 GHz processors and 128 GB DDR4 3000 MHz RAM. The duration of computational time is also mentioned in Table 2. We infer from Figure 6D that the mesh H-M4 achieves convergence with an average element size of around 0.95 mm and consists of 32142 nodes and 12192 elements in the finite element mesh. Considering the balance between computational cost and simulation accuracy, we have chosen H-M4 for subsequent experiments.
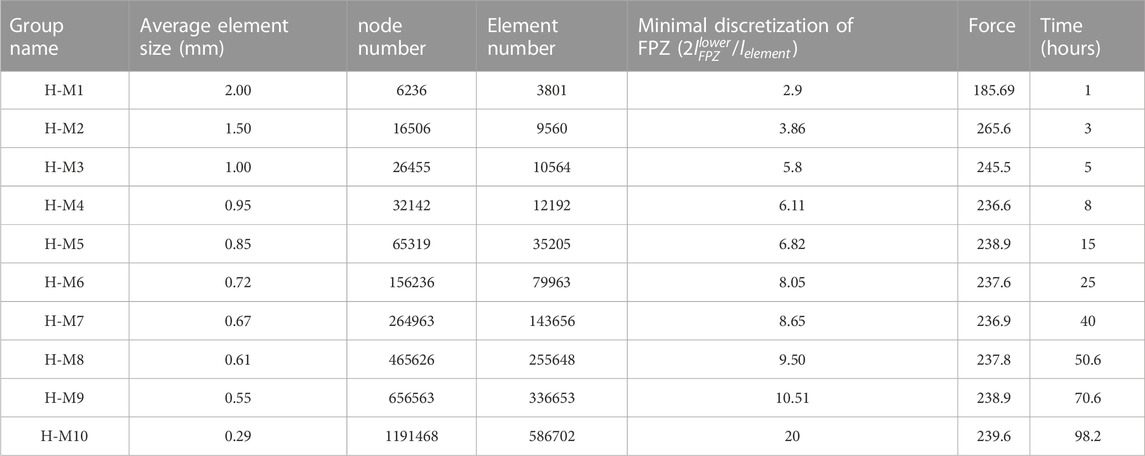
TABLE 2. Uniaxial compression mesh sensitivity analysis for walnut model.
2.3.2 Loading rate sensitivity
The loading velocity of 0.02 mm/s used in the calibration was determined according to the experience of previous studies. However, verifying that this velocity is appropriate for this model is necessary. Therefore, various loading velocities ranging from 10 mm/s to 200 mm/s were tested in this study, as shown in Figure 6E. Clearly, the displacement-force curve shows considerable oscillations when v>40 mm/s, which represents the strong dynamic effects of the loading process. Therefore, the loading velocity of 40 mm/s can be considered quasi-static compression, which is acceptable. This velocity is used in the following multi-contact loading simulations.
2.4 Quantification of load point locations
The singular value decomposition (SVD) of matrices is commonly used in principal component analysis (PCA) (Richards and Jolliffe, 1988). This process aims to convert a correlated random vector into an uncorrelated one through orthogonal transformation. This transformation can be visualized as changing the original coordinate system into a new orthogonal one, reducing the dimensions of a multidimensional variable approach while preserving critical data. This article utilizes singular value decomposition to derive simplified indicators of the loading points of particles, providing a quantitative description of the locations of the loads affecting them.
In Figure 6F, the force is produced by adjusting the load of the rigid plate on the particle at every contact site. The force matrix A for this contact state can be derived from the particle’s equilibrium equation.
In the spherical coordinate system, the angles
Multiple factors, such as the location of the loading point, the contact force, and the number of loading points, can influence the crushing strength of particle. To account for these variables, 115 loading methods were created by adjusting a rigid plate’s top and azimuth angles in a coordinate system with four loading points. These same parameters and methods were utilized for numerical simulations of particle crushing under various loading scenarios.
A crucial point to consider is that if the loading point applies force on the suture plane, it results in a specific type of crack. Therefore, it is essential to exclude the scenario where the loading point applies force on the suture plane while designing the location of the loading point.
3 Results and analysis
In multi-point loading, the parameters closely observed are the crack propagation rate and the number of cracks. The fracture process of the model at multi-point loading is shown in Figure 7. The fragments are colored by the displacements from their initial positions to provide a clearer picture of the fracture patterns. The shell offers a typical elastic response when 0.010 s before, and no visible crack is formed (Figures 7A, B). As shown in Figures 7C, D, according to Carmona (Carmona et al., 2008) et al., the first crack that reaches the model’s top is considered the main crack.
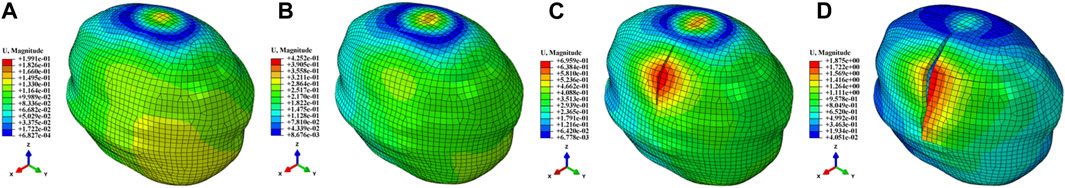
FIGURE 7. Fracture process of the model under multi-point loading.
To calculate the main crack propagation velocity, the number of failed elements in each analysis step on the main crack path is extracted and the expansion velocity within the current analysis step is calculated. When the numerical simulation is finished, the average value of the expansion velocity of all analysis steps is taken as the main crack propagation velocity in the current loading mode. At the same time, when the crack expands along two different directions at the same starting point, it is recorded as single crack; when the crack appears to bifurcate, it is recorded as two cracks; when the crack produces penetration, it is recorded as two cracks.
3.1 Effect of multi-point loading on the crack propagation rate
We compared the crack propagation rate for different loading quantities and loading positions, and the results are shown in Figure 8A. When coordination number (CN) remains constant, increasing I leads to a rise in the crack propagation rate. Similarly, an increase in CN augments the crack extension rate when I is constant. Kermode et al. (2008) studied crack formation and extension and concluded that loading brittle materials to their strength limit can cause material failure. Additionally, stress concentration near the crack tip leads to crack extension. For example, when CN = 4, Figure 9 depicts the slope of the crack element stress growth curve. The green points on the graph represent the maximum value of the corresponding crack stress growth rate at the crack initiation point. The stress growth rate gradually diminishes as the crack expands on both sides. During the microscopic parameter calibration process (described in Section 2.3), the damage failure stress for each cohesive element is maintained at the same value. As a result, the stress growth rate of each element at a given crack location progressively increases with the increase in the I. This suggests that an increase in the stress growth rate causes the cohesive element to reach the damage failure stress threshold first, increasing the crack propagation rate as I rises.
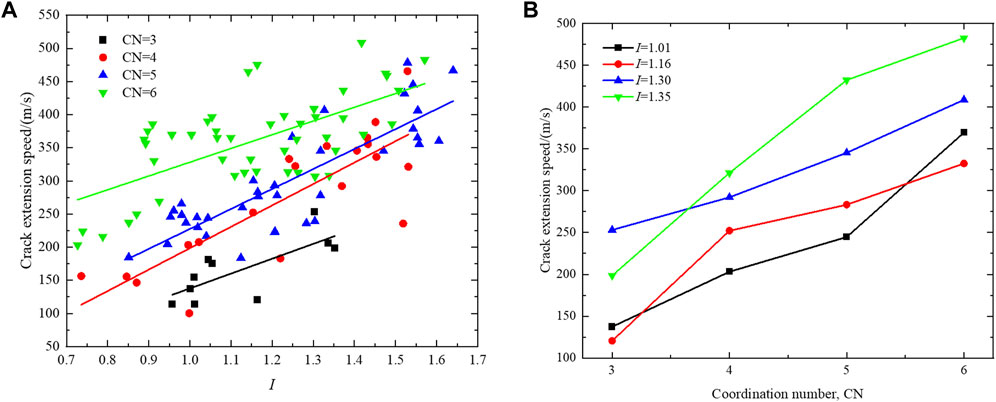
FIGURE 8. (A) Relationship between the crack expansion rate and the amount of I for different numbers of loading points, (B) Relationship between crack expansion rate and the number of loading points.
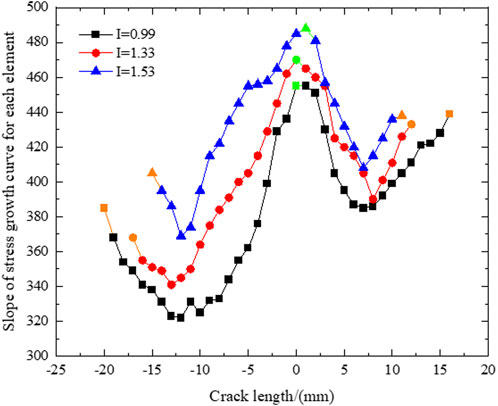
FIGURE 9. Relationship between stress value growth rate and crack length.
In addition, it is essential to note that with a fixed perimeter on the surface of the walnut model, the average distance between loading points will decrease as more points are added. This can be seen in Figure 9, where the yellow dots represent the locations of the loading points. As the distance between points decreases, the stress growth rate of each cohesive element along the crack path increases, making it more likely to meet the failure criterion. Therefore, increasing the number of loading points results in a faster rate of crack propagation.
The variation of crack extension rate with the number and location of loading points can also be analyzed by the transfer of stresses. The loading process of the loading point on the walnut shell surface was simulated using Abaqus. As depicted in Figure 10A, when the loading point makes contact with the shell surface, stress propagates in a circular wave, aligning with the continuous application of force. Additionally, Figure 10B reveals that when the loading persists until 0.0025 s, the stress waves from the two loading points begin to intersect. Subsequently, Figures 10C, D demonstrate that with an increase in loading time, when the stress value on either side of the stress wave interaction region surpasses half of the applied stress value at the loading point, the stress wave intensity within the interaction region reaches its peak. At this juncture, the power exceeds the peak stress from single-point loading, indicating that the interaction between the two stress waves generates a more substantial stress wave. The stress wave velocity can be calculated from the equation
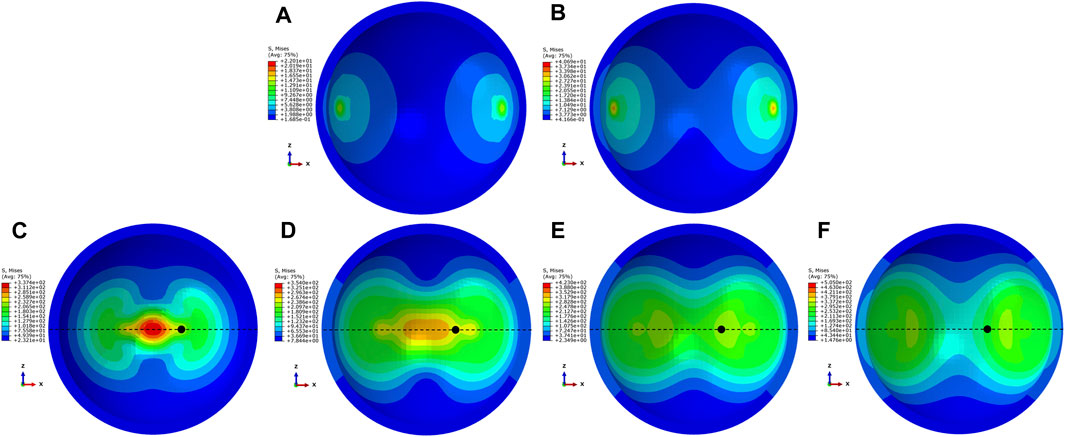
FIGURE 10. Stress transfer process.
3.2 Effect of multi-point loading on the number of cracks
Earlier, we covered the alterations in the crack propagation rate. Now, let’s delve into the changes in crack quantity. After experimenting, we derived the crack quantity and graphed it against the I value and the number of loading points depicted in Figures 11A, B. From Figure 11, we can deduce that the placement of loading points does not influence the crack quantity and is solely connected to the CN.
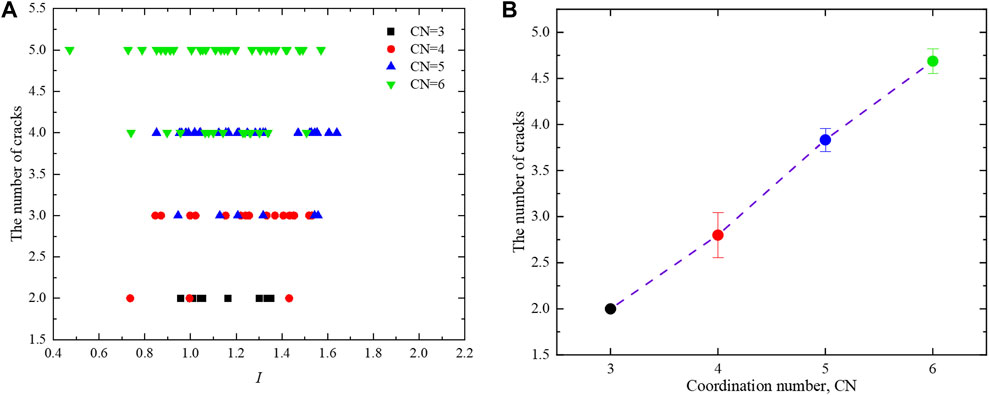
FIGURE 11. (A) Relationship between the number of cracks and I, (B) Relationship between the number of cracks and the number of loading points.
According to Luo et al. (2015) it was found that cracks start to form when the energy satisfies the crack initiation criterion. And when the energy produces a sudden change that is when a new crack is created. To investigate the relationship between the CN and crack quantity, we extracted the energy-time relationships for four sets of experiments, respectively. The Kinetic energy
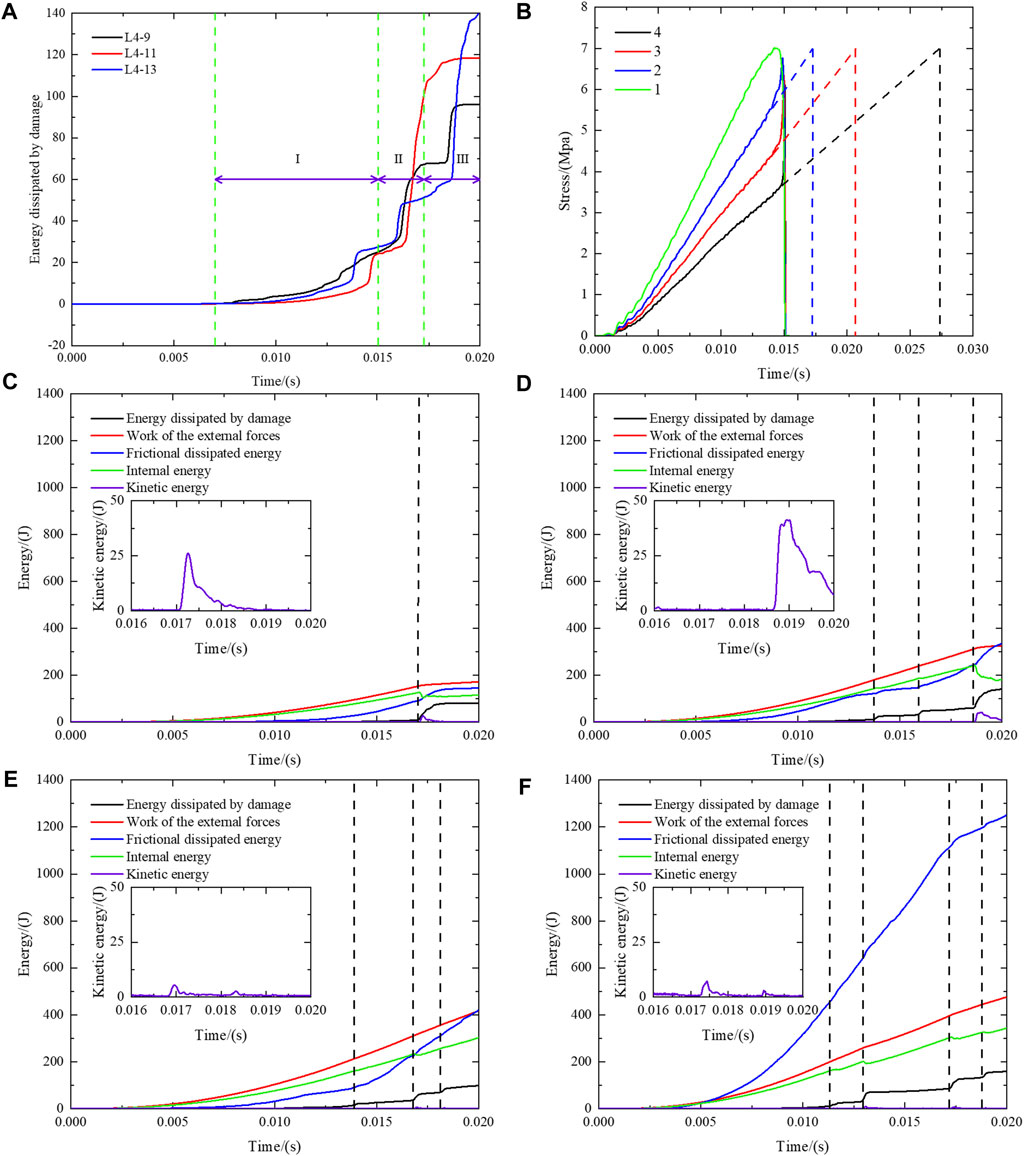
FIGURE 12. (A, B) The growth process of damage dissipation energy. (C–F), Energy variation with time for four typical loading patterns. The inset in each figure shows the change of its kinetic energy with time.
A randomly selected group of experiments in each group of the number of loading points is plotted with the energy schematic as shown in Figure 12 It can be found that the damage dissipation energy, internal energy, and kinetic energy of each group of experiments will appear to fluctuate at the same time for different times, which is caused by one new crack propagation. The number of fluctuations gradually increases as the CN increases, i.e., the number of cracks increases with the CN. Please note that while Figure 12C only shows one change, it does not necessarily mean that there is only one crack in the current experiment. Upon examining the model in Figure 13A, it becomes apparent that three cracks are present and have begun to expand simultaneously.
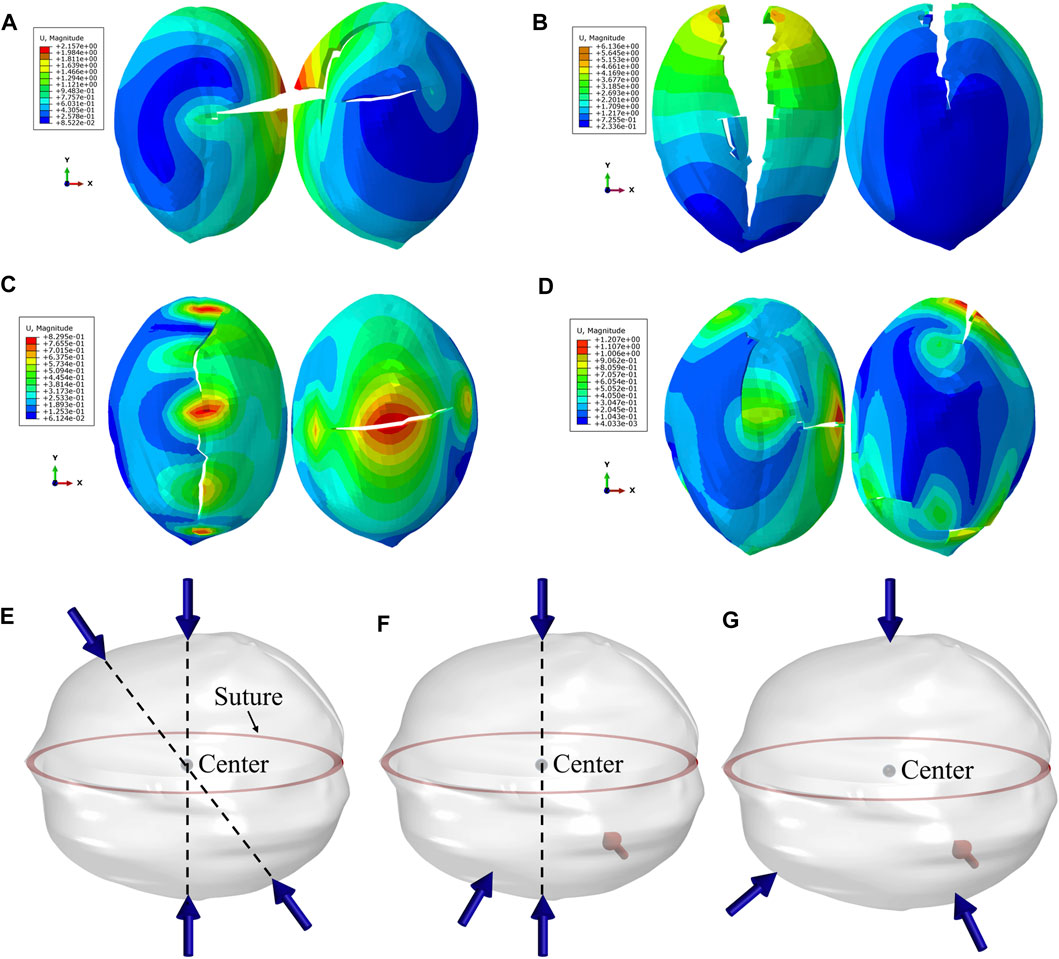
FIGURE 13. (A–D) Schematic diagram of cracks in four typical loading modes. Three typical loading situations (E) model A, (F) model B, (G) model C.
The internal energy of a particle increases when new cracks are formed, but it eventually reaches a limit and does not continue to grow indefinitely. When the
In Figure 13, we can observe the fracture cases for each of the four loading forms depicted in Figure 12. Cracks are generated during the extrusion of walnuts, and the distance between the fracture surfaces on both sides of the cracks increases with the compression. As walnut is an elastic-plastic material, the distance between the bilateral fracture surfaces is reversible for a certain time after the start of loading, meaning that it will return to zero when the loading is canceled. During this time, the walnut shell belongs to the elastic material. However, after a certain moment when the stress exceeds the elastic strength of the walnut, the resulting crack becomes irreversible, and the walnut shell belongs to the plastic material. The transition from elastic to plastic drastically changes the energy of the walnut shell, represented by the kinetic energy diagram in Figure 12. The dramatic change marks the node of the transition from elastic to plastic walnut shell. We should also pay attention to frictional dissipation energy and external work. Although the external force work increases with the number of loading points, the friction loss also increases due to the increase in the number of loading points.
Breaking a walnut shell quickly and efficiently is crucial in the process. This paper defines the ease of breaking the shell by the time sequence of kinetic energy fluctuation nodes’ appearance and the rate of shell breaking by crack propagation. When kinetic energy fluctuation nodes appear earlier, less energy is consumed overall, making it relatively easy to break the shell. The 3-point and 4-point loading effects are better than the 5-point and 6-point loading effects, as they show different values of external work and energy dissipation. Additionally, the walnut model under 4-point loading not only breaks the shell easily but also does it quickly due to its more significant average crack propagation rate compared to the 3-point loading. Therefore, this study concludes that using the 4-point loading effect is the best method to break the walnut shell.
The above analysis led to schematic diagrams outlining various loading methods for 4-point loading, as depicted in Figure 13E, illustrating the loading schematic for the shell breakage most susceptible to damage, with all loading points found on a single plane. Figures 13F, G depict loading points that can form multiple planes. However, observations of surface cracks on particles indicate that these loading points have minimal contribution to particle fragmentation, which is consistent with the research of Fang (Fang et al., 2022).
4 Conclusion
In this work, the effect of multipoint loading on the crack extension rate and the number of cracks is analyzed using an innovative approach of FDEM combined with cohesive cells. The main conclusions can be summarized as follows:
(1) The number and location of loading points significantly affect the crack propagation rate. The intensity of the stress wave generated by the loading point decreases step by step from the center outward, and when the loading point gradually moves toward a fixed element (i.e., the distance between loading points decreases), the stress growth rate of the element will increase progressively, and the failure threshold of each element is the same, which leads to an increase in the crack propagation speed.
(2) The number of cracks increases linearly with the number of loading points. The analysis of the energy variation at different loading quantities shows that each sudden change in damage dissipation energy represents the generation of a new crack. However, there is no specific correlation between the number of cracks and the location of the loading points.
Data availability statement
The raw data supporting the conclusion of this article will be made available by the authors, without undue reservation.
Author contributions
BH: Writing–original draft. GS: Methodology, Writing–original draft. YZe: Funding acquisition, Project administration, Resources, Writing–review and editing. JY: Validation, Writing–original draft. XF: Supervision, Writing–review and editing. YZh: Investigation, Writing–review and editing. HZ: Validation, Writing–review and editing. JW: Supervision, Writing–review and editing.
Funding
The author(s) declare financial support was received for the research, authorship, and/or publication of this article. This work has been financially supported and encouraged by the National Science Foundation for Young Scientists of China (Grant No. 12002229), Bingtuan Science and Technology Program (Grant No. 2022CB008, 2018CB014), Graduate research innovation program, Xinjiang Uygur Autonomous Region (Grant No. XJ 2022G247), Graduate research innovation program, Tarim University (Grant No. TDGRI202250), Shishi Science and Technology Program (Grant Nos 2021ZB01, 2022ZB05, and 2022ZB07), Modern Agricultural Engineering Key Laboratory at Universities of Education Department of Xinjiang Uygur Autonomous Region (TDNG2022101).
Acknowledgments
The authors thank Haipeng Lan from Tarim University for thesis supervision. The authors are grateful to the reviewers for their comments.
Conflict of interest
The authors declare that the research was conducted in the absence of any commercial or financial relationships that could be construed as a potential conflict of interest.
Publisher’s note
All claims expressed in this article are solely those of the authors and do not necessarily represent those of their affiliated organizations, or those of the publisher, the editors and the reviewers. Any product that may be evaluated in this article, or claim that may be made by its manufacturer, is not guaranteed or endorsed by the publisher.
References
Carlos Gianpaul, R. R., Marco Antonio, T. C., and Jiménez de Cisneros Fonfría, J. J. (2020). Design and analysis of an automatic shell cracking machine of metohuayo (“Caryodendron orinocense karst”) with a capacity of 50 kg/h. Agriculture 10, 537. doi:10.3390/agriculture10110537
Carmona, H. A., Wittel, F. K., Kun, F., and Herrmann, H. J. (2008). Fragmentation processes in impact of spheres. Phys. Rev. E 77, 051302. doi:10.1103/PhysRevE.77.051302
Celik, H. K., Caglayan, N., and Rennie, A. E. W. (2017). Nonlinear FEM based high-speed shell shattering simulation for shelled edible agricultural products: pecan fruit shattering. J. Food Process Eng. 40, e12520. doi:10.1111/jfpe.12520
Fang, C., Nie, Z., Gong, J., Li, B., Hu, W., and Mohammed, A. (2022). Discrete element simulation of effects of multicontact loading on single particle crushing. Particuology 69, 49–60. doi:10.1016/j.partic.2021.11.012
Gálvez, J. C., Červenka, J., Cendón, D. A., and Saouma, V. (2002). A discrete crack approach to normal/shear cracking of concrete. Cem. Concr. Res. 32, 1567–1585. doi:10.1016/S0008-8846(02)00825-6
Gao, Y., De Simone, G., and Koorapaty, M. (2021). Calibration and verification of DEM parameters for the quantitative simulation of pharmaceutical powder compression process. Powder Technol. 378, 160–171. doi:10.1016/j.powtec.2020.09.019
Han, W., Jiang, Y., Luan, H., Du, Y., Zhu, Y., and Liu, J. (2020). Numerical investigation on the shear behavior of rock-like materials containing fissure-holes with FEM-CZM method. Comput. Geotechnics 125, 103670. doi:10.1016/j.compgeo.2020.103670
Jin, W., Jiao, Y., Liu, L., Yuan, Y., and Li, S. (2017). Dense crystalline packings of ellipsoids. Phys. Rev. E 95, 033003. doi:10.1103/PhysRevE.95.033003
Kacal, M., and Koyuncu, M. A. (2017). Cracking characteristics and kernel extraction quality of hazelnuts: effects of compression speed and positions. Int. J. Food Prop., 1–11. doi:10.1080/10942912.2017.1352600
Kermode, J. R., Albaret, T., Sherman, D., Bernstein, N., Gumbsch, P., Payne, M. C., et al. (2008). Low-speed fracture instabilities in a brittle crystal. Nature 455, 1224–1227. doi:10.1038/nature07297
Kumar Verma, R., Nguyen, G. D., Karakus, M., Taheri, A., and Bui, H. H. (2022). A combined numerical-experimental approach to analyzing fracture initiation and development in brittle rocks. Comput. Geotechnics 145, 104663. doi:10.1016/j.compgeo.2022.104663
Labuz, Jf, Shah, Sp, and Dowding, Ch (1985). Experimental-analysis of crack-propagation in granite. Int. J. Rock Mech. Min. Sci. 22, 85–98. doi:10.1016/0148-9062(85)92330-7
Li, Y., Deng, J. G., Liu, W., and Feng, Y. (2017). Modeling hydraulic fracture propagation using cohesive zone model equipped with frictional contact capability. Comput. Geotech. 91, 58–70. doi:10.1016/j.compgeo.2017.07.001
Lim, B. Y., Shamsudin, R., Hang, B. T., Baharudin, T., and Yunus, R. (2016). Performance evaluation and cfd multiphase modeling for multistage jatropha fruit shelling machine. Industrial Crops Prod. 85, 125–138. doi:10.1016/j.indcrop.2016.02.057
Liu, R., and Sancaktar, E. (2018). Identification of crack progression in filled rubber by micro X-ray CT-scan. Int. J. Fatigue 111, 144–150. doi:10.1016/j.ijfatigue.2018.01.033
Luo, X., Luo, R., and Lytton, R. L. (2015). Energy-based crack initiation criterion for viscoelastoplastic materials with distributed cracks. J. Eng. Mech. 141, 04014114. doi:10.1061/(ASCE)EM.1943-7889.0000830
Ma, G. (2014). Modeling the particle breakage of rockfill materials with the cohesive crack model. Comput. Geotechnics 12. doi:10.1016/j.compgeo.2014.05.006
Ma, G. (2018). The effect of different fracture mechanisms on impact fragmentation of brittle heterogeneous solid. Int. J. Impact Eng. 12. doi:10.1016/j.ijimpeng.2017.11.016
Ma, G., Zhou, W., Zhang, Y., Wang, Q., and Chang, X. (2018). Fractal behavior and shape characteristics of fragments produced by the impact of quasi-brittle spheres. Powder Technol. 325, 498–509. doi:10.1016/j.powtec.2017.11.030
Munjiza, A., Owen, D. R. J., and Bicanic, N. (1995). A combined finite-discrete element method in transient dynamics of fracturing solids. Eng. Comput. 12, 145–174. doi:10.1108/02644409510799532
Rabczuk, T., Zi, G., Bordas, S., and Nguyen-Xuan, H. (2008). A geometrically non-linear three-dimensional cohesive crack method for reinforced concrete structures. Eng. Fract. Mech. 75, 4740–4758. doi:10.1016/j.engfracmech.2008.06.019
Richards, L. E., and Jolliffe, I. T. (1988). Principal component analysis. J. Mark. Res. 25, 410. doi:10.2307/3172953
Sütyemez, M., Burak Bükücü, Ş., and Özcan, A. (2021). ‘Helete güneşi’, a new walnut cultivar with late leafing, early harvest date, and superior nut traits. Agriculture 11, 991. doi:10.3390/agriculture11100991
Syed, Z. H., Ahad, T., Rather, A. H., and Naik, H. R. (2016). Development of walnut dehulling machine and assessment of its performance using Ethephon and Tween-80 as pre-treatments for hull loosening. J. Food Sci. Technol. 53, 2835–2843. doi:10.1007/s13197-016-2261-5
Tamás, K., Földesi, B., Péter Rádics, J., Jóri, I. J., and Fenyvesi, L. (2015). A simulation model for determining the mechanical properties of rapeseed using the discrete element method. Period. Polytech. Civ. Eng. 59, 575–582. doi:10.3311/PPci.8173
Tatone, B. S. A., and Grasselli, G. (2015). A calibration procedure for two-dimensional laboratory-scale hybrid finite–discrete element simulations. Int. J. Rock Mech. Min. Sci. 75, 56–72. doi:10.1016/j.ijrmms.2015.01.011
Todisco, M. C., Wang, W., Coop, M. R., and Senetakis, K. (2017). Multiple contact compression tests on sand particles. Soils Found. 57, 126–140. doi:10.1016/j.sandf.2017.01.009
Tscheuschner, H.-D., and Mohsenin, N. N. (1987). Physical properties of plant and animal materials. Structure, physical characteristics and mechanical properties. Nahrung 31, 702. doi:10.1002/food.19870310724
Wu, Z., Xu, J., Chen, H., Shao, L., Zhou, X., and Wang, S. (2022). Shear strength and mesoscopic characteristics of basalt fiber–reinforced loess after dry–wet cycles. J. Mater. Civ. Eng. 34, 04022083. doi:10.1061/(ASCE)MT.1943-5533.0004225
Xianjie, H., Du, W., Zhao, Y., Sun, Z., Zhang, Q., Wang, S., et al. (2020). Dynamic tensile behaviour and crack propagation of coal under coupled static-dynamic loading. Int. J. Min. Sci. Technol. 30, 659–668. doi:10.1016/j.ijmst.2020.06.007
Yu, Y., Zhao, G., and Ren, M. (2023). Numerical simulation study on particle breakage behavior of granular materials in confined compression tests. Particuology 74, 18–34. doi:10.1016/j.partic.2022.04.004
Zhang, H., Shen, L., Lan, H., Li, Y., Liu, Y., Tang, Y., et al. (2018). Mechanical properties and finite element analysis of walnut under different cracking parts. Int. J. Agric. Biol. Eng. 11, 81–88. doi:10.25165/j.ijabe.20181106.3309
Zhang, Y.-Y., Shen, R.-L., Li, M.-Z., Pang, J.-C., Zhang, L., Li, S.-X., et al. (2020). Mechanical damage behavior of metal matrix composites with the arbitrary morphology of particles. J. Mater. Res. Technol. 9, 7002–7012. doi:10.1016/j.jmrt.2020.05.014
Zhao, Y., Chen, L., Ji, W., Guo, J., and Wang, J. (2021). Study on a novel energy-saving cryogenic pre-treatment equipment for walnut kernel peeling. Food control. 121, 107650. doi:10.1016/j.foodcont.2020.107650
Zheng, W., and Tannant, D. D. (2018). Grain breakage criteria for discrete element models of sand crushing under one-dimensional compression. Comput. Geotechnics 95, 231–239. doi:10.1016/j.compgeo.2017.10.004
Keywords: multi-point loading, walnuts crush, FDEM, cohesive, crack expansion
Citation: Han B, Su G, Zeng Y, Yang J, Fan X, Zhang Y, Zhang H and Wang J (2023) FDEM investigation on the crack propagation characteristics of walnut shell under multi-contact loadings. Front. Mater. 10:1293683. doi: 10.3389/fmats.2023.1293683
Received: 18 September 2023; Accepted: 09 October 2023;
Published: 17 October 2023.
Edited by:
Erkan Oterkus, University of Strathclyde, United KingdomReviewed by:
Kailu Xiao, Texas A and M University, United StatesCongrui Grace Jin, University of Nebraska-Lincoln, United States
Copyright © 2023 Han, Su, Zeng, Yang, Fan, Zhang, Zhang and Wang. This is an open-access article distributed under the terms of the Creative Commons Attribution License (CC BY). The use, distribution or reproduction in other forums is permitted, provided the original author(s) and the copyright owner(s) are credited and that the original publication in this journal is cited, in accordance with accepted academic practice. No use, distribution or reproduction is permitted which does not comply with these terms.
*Correspondence: Yong Zeng, MTU1MDQ1Nzc2NTBAMTI2LmNvbQ==