 Jing Yang1
 Liming Tan
 Chenchen Zhang
94% of researchers rate our articles as excellent or good
Learn more about the work of our research integrity team to safeguard the quality of each article we publish.
Find out more
ORIGINAL RESEARCH article
Front. Mater., 28 September 2023
Sec. Structural Materials
Volume 10 - 2023 | https://doi.org/10.3389/fmats.2023.1284928
This article is part of the Research TopicAsphalt Pavement Performance under Complex Service ConditionsView all 10 articles
Rutting is one of the common distresses observed in asphalt pavement, influenced by temperature and load conditions. To clarify the permanent deformation behavior of steel-concrete composite beam (SCCB) bridge deck pavement under temperature-load coupling effect and provide references for the distress cause analysis, five typical SCCB bridge deck pavements were selected. The temperature distribution and the temperature stress of the pavement structures were analyzed by numerical simulation under periodic temperature variations. In addition, considering the daily variation in traffic volume, the permanent deformation of the five pavement structures were calculated under temperature-load coupling effect. Finally, the influence of heavy load on the development of rutting distress was also investigated. The results show that the temperature field and temperature stresses within the SCCB bridge deck pavement exhibit periodic variations under periodic temperature variations. Additionally, after 500,000 times of standard axle load application, “EA + SMA” exhibits the smallest permanent deformation and the best resistance to rutting distress under temperature-load coupling effect. Finally, heavy load conditions have a great influence on the permanent deformation of SCCB bridge deck pavement. In areas with severe rutting distresses, it is recommended to use “EA + SMA” pavement structure in SCCB bridge.
Steel-concrete composite beam (SCCB) bridges, with advantages such as lightweight, large span, low cost, and rapid construction, have been widely used in China. The SCCB bridge is composed of steel box girders and reinforced concrete slabs. As an important component of the bridge traffic system, the SCCB bridge deck pavement can greatly mitigate the impact of vehicle dynamic loads on the bridge deck, protecting the bridge deck and dispersing wheel loads. It also meets the requirements of stable and comfortable driving.
With the continuous increase in traffic volume, heavy vehicles, and the impact of external natural factors such as climate, pavement distresses begin to occur. In summer, the surface temperature of the asphalt pavement layer is usually 20°C∼30°C higher than the air temperature (Mallick et al., 2009), which leads to rutting distress under such high-temperature conditions. Rutting distress is essentially the permanent deformation of the pavement layer caused by repeated vehicle loads. When the shear stress generated by the vehicle load exceeds the shear strength of the asphalt mixture, continuous flow deformation accumulates, resulting in flow rutting (Liu et al., 2021). The resistance of asphalt mixture to shear deformation is insufficient, leading to particularly pronounced rutting under high temperatures and heavy loads (Chen et al., 2021). It will not only damage the durability of the bridge deck pavement structure but also significantly affect driving safety and comfort. Therefore, it is critical to clarify the distress causes and the applicability of various pavement structures under complex environmental conditions to mitigate distresses and extend the service life of bridge deck pavement.
To control rutting distress, it is necessary to analyze the mechanical behavior of the bridge deck pavement. Unlike the design stage, the maintenance stage requires consideration of the coupling effects of multiple factors to determine the true causes of the distress. Many researchers have conducted systematic research on the temperature-load coupling effect of asphalt pavement, but they have mainly focused on ordinary asphalt pavements or steel bridge deck pavements. Huang et al. (2009) analyzed the variation of rutting under the vehicle dynamic loads based on a asphalt pavement structure model that considers temperature field changes. Swarna et al. (2018) analyzed the vertical deformation under the coupling effect of temperature and vehicle load, providing a theoretical basis for pavement design. Jiang et al. (2018) conducted repeated loading tests to simulate actual traffic loads and established the load-temperature master curve for asphalt mixture. They studied the effects of temperature and confining pressure on the permanent strain of the asphalt mixture. Zhang (2019) analyzed the mechanical response of steel bridge deck pavement under the combined effect of temperature and dynamic load under the most unfavorable load position. In addition, some scholars have analyzed the influence of the non-uniform temperature field of orthotropic steel bridge deck during the paving process on the pavement layer (Liu et al., 2016; Liu et al., 2019; Fan et al., 2021). However, there are few research on the temperature-load coupling effect in the SCCB bridge deck pavement.
Due to the influence of the supporting structure and bridge deck type, the mechanical response of the pavement layer of SCCB bridges is different from that of steel bridges, concrete bridges, and ordinary asphalt pavements. For SCCB bridges, the difference in stiffness between steel and concrete leads to a more complex stress distribution under vehicle loads. At the same time, steel and concrete belong to different thermal conductive materials, and they exhibit different deformations under the influence of solar radiation and sudden changes in external temperature. All these factors contribute to a more complex mechanical response of SCCB bridge deck pavement under the coupling effect of temperature and load. In recent years, many researchers have evaluated the mechanical response of SCCB bridge, mainly including the flexural behavior (Cheng et al., 2021; He et al., 2021), shear behavior (Kong et al., 2021), and temperature gradient effect of SCCB (Wang et al., 2021), or analyzed the properties of the concrete layer in SCCB (Zhang et al., 2021). However, existing research has relatively little consideration for the mechanical response of SCCB bridge deck pavement.
Therefore, to clarify the permanent deformation behavior of SCCB bridge deck pavement under temperature-load coupling effect and provide references for the distress cause analysis, the whole bridge analysis was firstly conducted to identify the most unfavorable beam segment based on a SCCB bridge located in Yunnan Province, China. Additionally, the most unfavorable conditions of annual temperature difference were selected, and the temperature field model for the SCCB bridge deck pavement was established. Besides, considering the influence of temperature effects, a comparative analysis was conducted on five typical pavement structures to analyze the temperature stress in the bridge deck pavement under periodic temperature variations. Finally, based on the pavement temperature field and the daily variation pattern of traffic volume, the influence of temperature-load coupling on the development of permanent deformation in SCCB bridge deck pavement was examined.
The whole suspension bridge model was established to analyze the most unfavorable beam segment by using Midas software. The bridge is a single-span cable-stayed suspension bridge with a single tower, and the approach bridge consists of 2 m × (3 × 41.5) m of pre-stressed concrete continuous box girder bridges. The total length of the entire bridge is 1,020 m. The main bridge is a steel truss suspension bridge, and the steel truss is composed of the main truss, main cross truss, and upper and lower chord members. The main truss has a height of 6 m, a width of 27 m, and a standard segment length of 11.5 m.
In the modeling process, the stiffening girder and main tower were simulated using beam elements, while the main cables and suspenders were simulated using tension-only elements. The segment length of the main beam is 11.5 m, the segment length of approach bridge is 41.5 m, and the height of the main tower is set at 93.5 m. The whole bridge model is shown in Figure 1, and the material parameters are listed in Table 1. In the whole bridge analysis, the vehicle load was taken from the “General Specifications for Design of Highway Bridges and Culverts (JTG D60-2015)” (MOT, 2015), specifically the vehicle load for Highway Class-I. The loading method is applied as the influence line loading.

FIGURE 1. The whole bridge model.
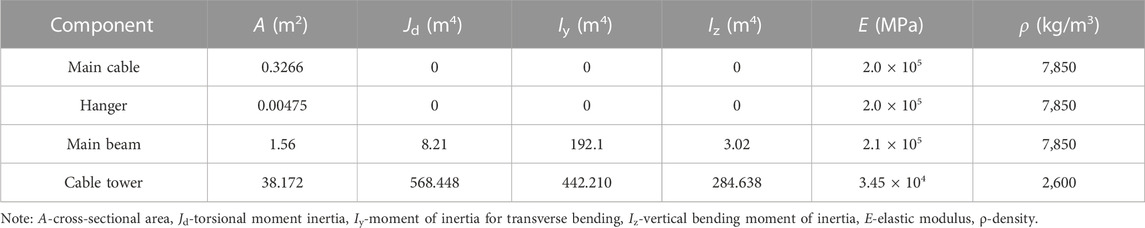
TABLE 1. The component materials and their section feature value.
The vertical bending moment envelope diagram of the whole bridge is shown in Figure 2. The maximum vertical bending moment was 5.6 × 10⁵ kN·m, located near the mid-span of the main span, while the minimum vertical bending moment was −6.5 × 10⁵ kN·m, located on the right side of the main girder. It can be determined that the most unfavorable beam segment was located near the mid-span of the main span and on the right side of the main girder. Therefore, the right side of the main girder was selected as the most unfavorable beam segment for the analysis of temperature stress and temperature-load coupling.

FIGURE 2. Vertical bending moment envelope of whole bridge.
A periodic temperature curve was fitted by annual temperature in a specific region in Yunnan Province in China. The average lowest temperature during the cold season was chosen as the simulated lowest temperature, and the average highest temperature during the hot season was chosen as the simulated highest temperature, which were fitted as a temperature cycle in a day, as displayed in Figure 3.
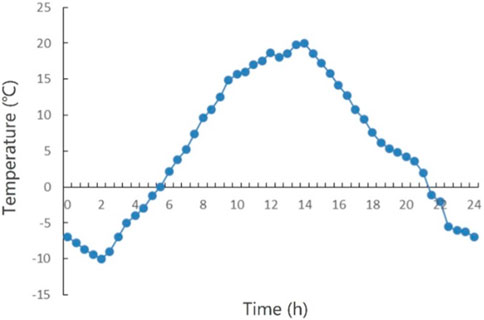
FIGURE 3. Variation curve of external temperature in 1 day.
The local beam segment model was established using solid elements in ABAQUS finite element software, the pavement layer and bridge deck were discretized using solid linear reduced integral elements C3D8R. In the meshing model, the denser mesh was partitioned for the bridge deck pavement and load position, with an element size of 5 mm, while the element size of other components was set as 10 mm. The bridge deck was made of C60 reinforced concrete with a thickness of 16 cm. Both the top and bottom layers were 4 cm thick asphalt concrete, as shown in Figure 4. Five commonly used bridge deck pavement structures were chosen to analyze the temperature distribution under periodic temperature change conditions, including “double-layer asphalt concrete (AC),” “double-layer stone mastic asphalt (SMA),” “AC + SMA,” “gussasphalt concrete (GA)+SMA,” and “epoxy asphalt (EA)+SMA.” The thermal parameters of pavement materials are listed in Table 2, and the thermodynamic constants of temperature field analysis are shown in Table 3.
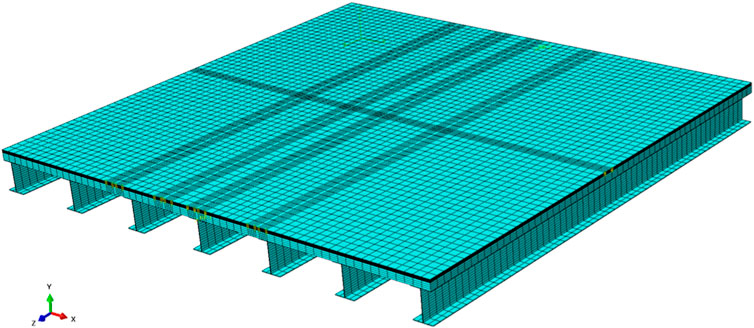
FIGURE 4. Local beam segment model.
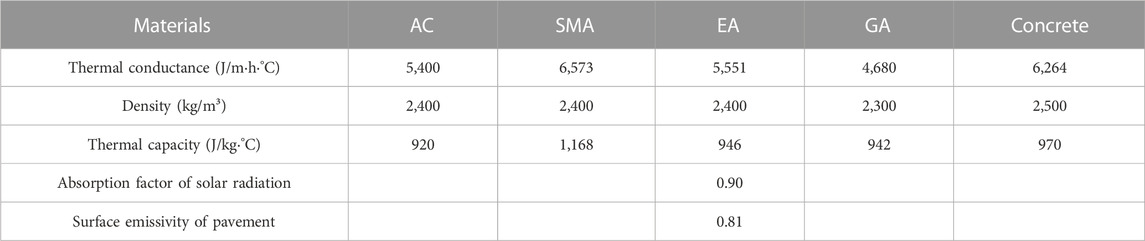
TABLE 2. Thermal parameters of pavement materials (Jiang, 2021).
TABLE 3. Thermodynamic constants of temperature field analysis (Jiang, 2021).
The bridge deck pavement is fully attached to the concrete bridge deck and is subjected to both vehicle loads and the influence of external cyclic temperature variations. Due to the large temperature difference within a day in the region where the bridge is located, the bridge deck pavement exhibits complex stress characteristics. Therefore, the following basic assumptions were introduced when establishing the model:
(1) Each layer of the bridge deck pavement is uniform, continuous and isotropic.
(2) The interfacial contact condition between layers are completely continuous. In this case, the bonding layer was not specially treated, and its thickness was included in the asphalt concrete paving layer.
In order to facilitate calculations in temperature field analysis, the following assumptions were made in this study:
(1) The temperature and heat flow between the layers were assumed to be continuous.
(2) The heat was transferred one-dimensionally, downwards along with the traffic driving direction.
(3) Except for the given thermo-physical parameters, the other parameters were assumed to be constant.
(4) The temperature field of the bridge deck pavement structure varies cyclically on a daily basis.
(5) After several temperature cycles, the temperature field of the bridge deck pavement structure tended to change steadily and periodically.
The temperature of the bridge deck pavement structure versus time is displayed in Figure 5.
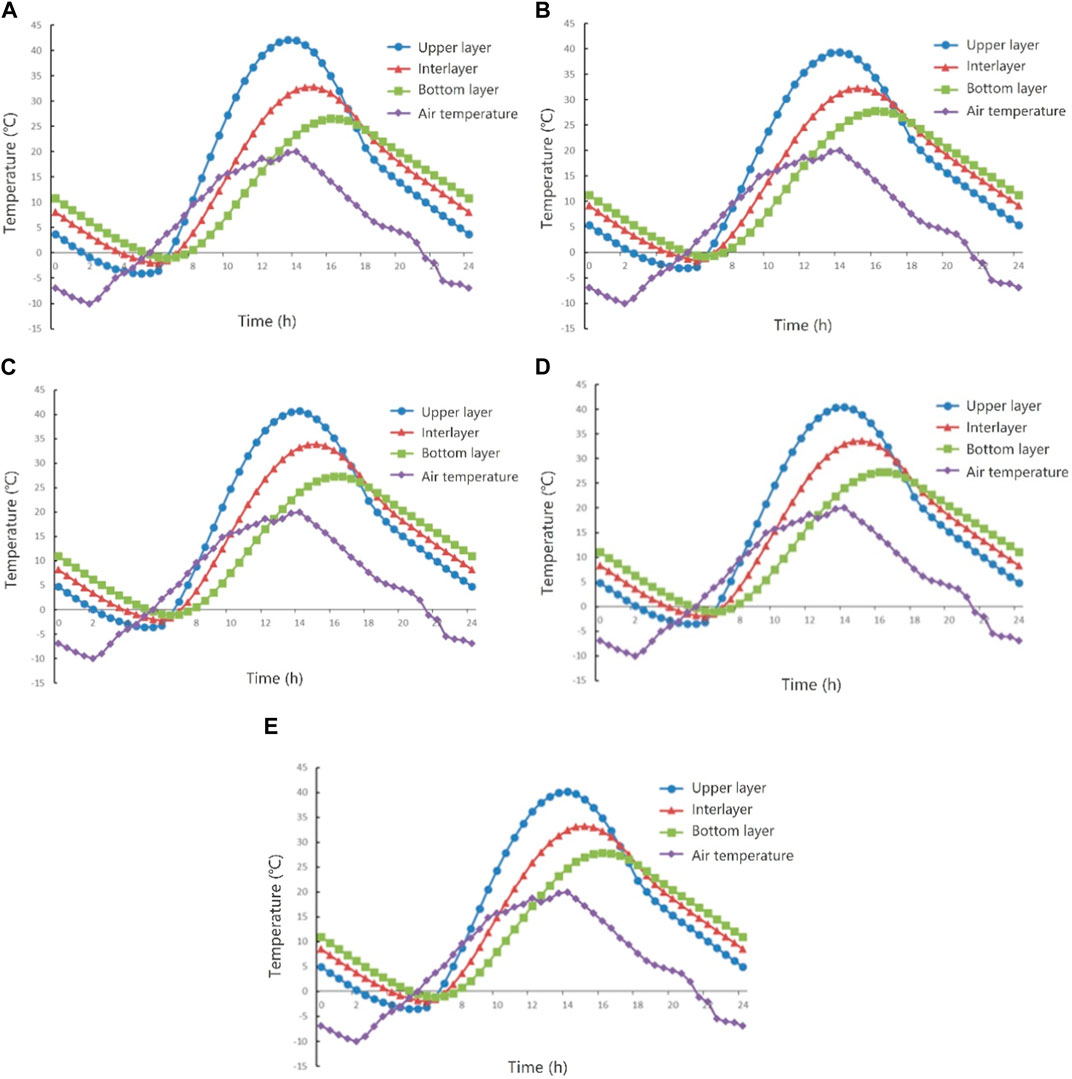
FIGURE 5. Temperature-time distribution of different pavement structures: (A) double-layer AC, (B) double-layer SMA, (C) AC + SMA, (D) GA + SMA, and (E) EA + SMA.
It can be observed that the temperature field variations of different pavement structures are generally consistent. Under the influence of periodic temperature variations in the external environment, the temperature of the bridge deck pavement also exhibited periodic changes, following the periodic temperature field variations in the external environment. And the temperature changed significantly, especially on the surface of the pavement. The “double-layer AC” exhibited the highest pavement surface temperature, reaching 42.16°C, while the “double-layer SMA” had a relatively lower maximum temperature of 39.40°C. The lowest pavement surface temperature followed the same pattern as the highest temperature. The “double-layer AC” had the lowest surface temperature, reaching −4.07°C, while the “double-layer SMA” had the highest minimum surface temperature, which is −3.10°C. The temperature difference on pavement surface of five pavement structures was around 45°C.
The thermoelastic layered system theory was adopted in this article. For the purpose of facilitating the analysis and calculations in temperature stress, the following basic assumptions were made in this article:
(1) Each structural layer satisfies the small deformation condition, ensuring the continuity of displacements between layers. Furthermore, there is no relative displacement between the bridge deck and the steel girder.
(2) The Poisson’s ratio of each structural layer remains constant, unaffected by temperature variations or load time. The shrinkage and expansion of the concrete bridge deck are not taken into account.
(3) In order to analyze the temperature stress in the bridge deck pavement under periodic temperature variations, unless otherwise specified, the analysis is conducted with reference to time t = 0. It is assumed that at t = 0, the temperature stress in the pavement is zero.
The material parameters are shown in Table 4.
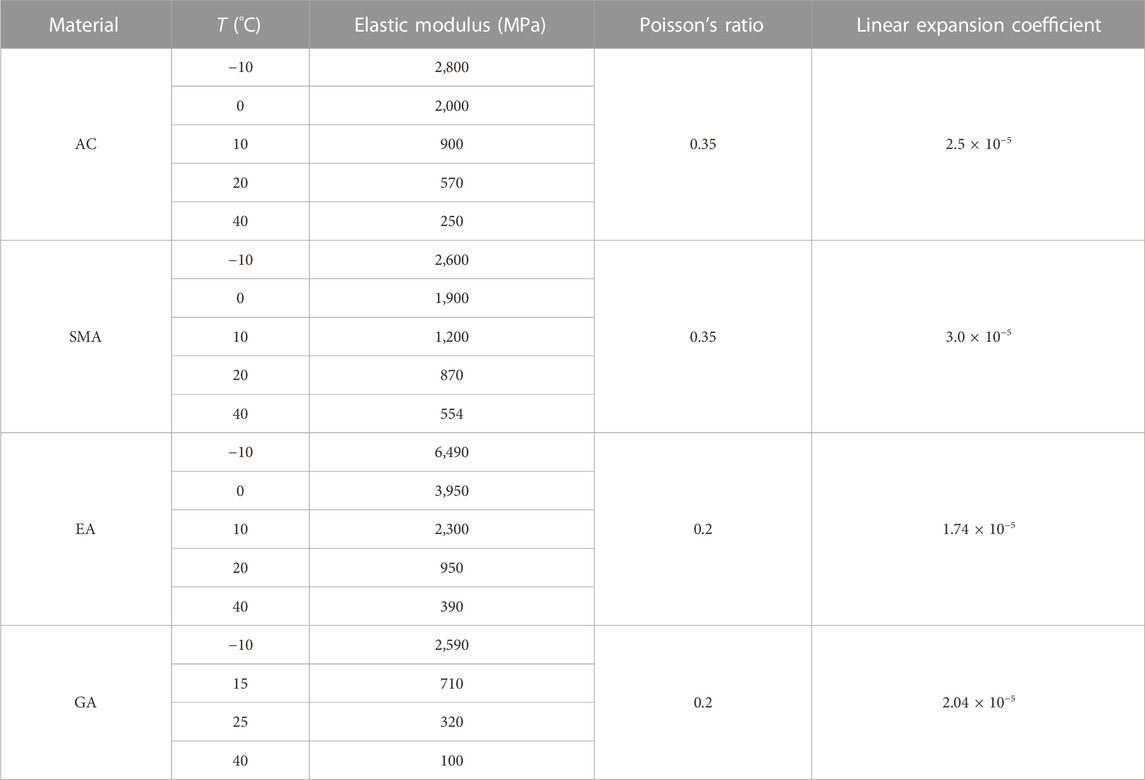
TABLE 4. Mechanical parameters and linear expansion coefficient of asphalt mixture (Ma et al., 2021).
According to reference (Wang et al., 2009), it is stated that when the contact condition between pavement layers is completely smooth, the temperature stress in the pavement is minimal. Conversely, when the contact condition between pavement layers is completely continuous, the temperature stress in the pavement is maximized. Therefore, this study defined the contact relationship between asphalt pavement layers and between asphalt pavement layer and concrete bridge deck as fully bonded.
During the temperature stress analysis, it is necessary to utilize the boundary conditions of the most unfavorable beam segment obtained from the whole bridge analysis, as discussed in Section 2.2. The vertical bending moments obtained from the most unfavorable beam segment were applied as boundary conditions in the local beam segment model. The schematic diagram of the moment loading on the local beam segment is shown in Figure 6. Simultaneously, the horizontal displacement of the bridge deck pavement was constrained. Since the bridge deck are assembled on the steel girder, it was assumed that no relative displacement occurs between them. Therefore, the bottom surface of the bridge deck was defined as fully fixed.
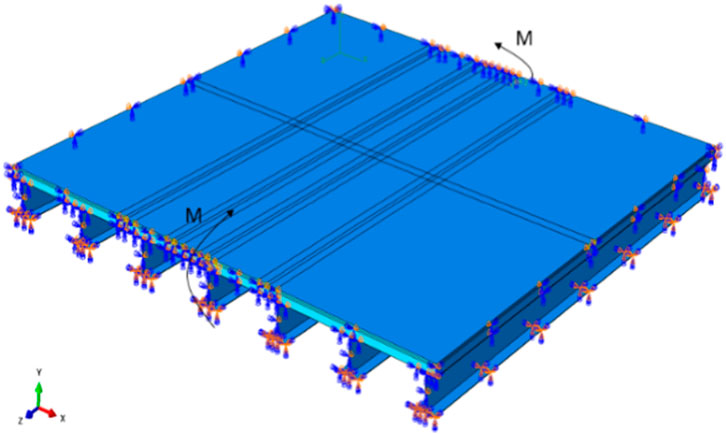
FIGURE 6. The bending moment of the most unfavorable beam segment.
When studying the daily variation pattern of temperature stress in the bridge deck pavement, the temperature fields of the pavement layer at different temporal points, obtained in the previous analysis, were imported into the finite element model as predefined fields. It was assumed that the initial temperature stress in the pavement at t = 0 was zero. The temperature stress results are presented in Figure 7.
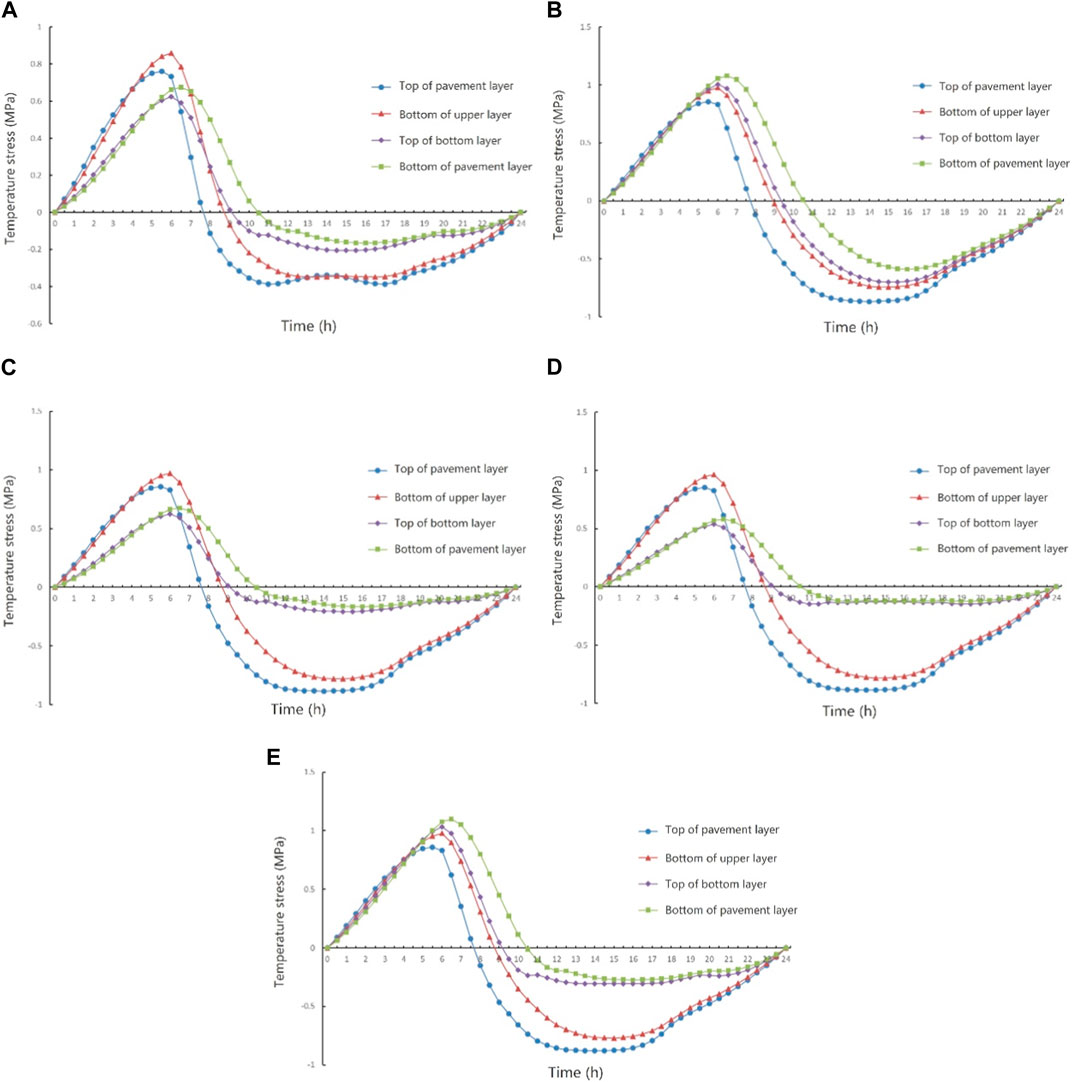
FIGURE 7. Temperature stress-time distribution of different pavement structures: (A) double-layer AC, (B) double-layer SMA, (C) AC + SMA, (D) GA + SMA, and (E) EA + SMA.
It can be seen from the figure that for the pavement surface, the maximum tensile stress occurs at 5:30, when the pavement surface temperature is the lowest. Apart from the “double-layer AC” with a maximum tensile stress of 0.76 MPa, the maximum tensile stresses on the surfaces of the other four pavement structures are around 0.85 MPa. The “double-layer AC” exhibits the maximum compressive stress on its surface at 17:00, with a value of 0.39 MPa. On the other hand, the other four pavement structures have maximum compressive stresses around 0.87 MPa on their surface, occurring at 14:00. Based on this, it can be preliminarily inferred that the extreme values of temperature stress on the pavement surface are related to the upper layer material of the pavement. When the upper layer material is SMA, the extreme values of temperature stress on the pavement surface in the four pavement structures (“double-layer SMA,” “AC + SMA,” “GA + SMA,” and “EA + SMA”) occur at approximately the same time. This is because the upper layer of the pavement is directly influenced by solar radiation, and its temperature variation is more consistent with the external air temperature changes. Due to the fact that temperature stress is generated as a result of temperature variations within the pavement, the temperature stress variation pattern on the pavement surface is also consistent with the changes in external air temperature.
For the bottom of the upper layer, the maximum tensile stress all occurs at 6:00. The maximum tensile stress between the upper-lower layers of “double-layer AC” is 0.86 MPa, while that of the other four pavement structures are around 0.98 MPa. The maximum compressive stresses occur around 15:00. Except for “double-layer AC” which has a value of 0.35 MPa, the maximum compressive stresses of other pavement structures are around 0.77 MPa.
For the bottom of the pavement, the maximum tensile stress of all five pavement structures occurs at 6:30. Except for “GA + SMA,” which has the maximum compressive stress at 13:00, the other four pavement structures have the maximum compressive stress at 16:00 on the bottom of the pavement. The maximum tensile stress at the bottom of the pavement in “double-layer AC,” “AC + SMA,” and “GA + SMA” is around 0.6 MPa, which has a big difference with that of “double-layer SMA” and “EA + SMA.” This is because the elastic modulus of AC and GA is small at high temperature, and the temperature stress generated is relatively small under the condition of the same temperature. Except for “GA + SMA,” where the maximum compressive stress occurs at 13:00, the maximum compressive stress at the bottom of the other four pavement structures occurs at 16:00. At the same time, “GA + SMA” has the lowest maximum compressive stress at the bottom, which is 0.12 MPa, while “double-layer SMA” has the highest maximum compressive stress at the bottom, which is 0.59 MPa.
In summary, the temperature stress in the bridge deck pavement is primarily tensile stress at night and compressive stress during the day. From 0:00 to 6:00, as the ambient temperature gradually decreases, the asphalt concrete shrinks when it gets colder, causing the tensile stress to continuously increase. From 6:00 to 14:00, especially between 6:00 and 10:30, the temperature of the bridge deck pavement rapidly increases under the influence of solar radiation. The asphalt concrete heats up and undergoes thermal expansion deformation, causing the internal temperature stress to shift from a state of tension to compression.
According to the “General Specifications for Design of Highway Bridges and Culverts” (JTG D60-2015), the single side of a dual-wheel rear axle with a vehicle load of 140 kN for Highway Class-I was taken, the load distribution was double-wheel rectangular uniform load. The rectangle load size was 0.25 m × 0.20 m, the distance between two vehicle tire centers was 0.30 m, and the tire contact pressure was 0.7 MPa, as shown in Figure 8.
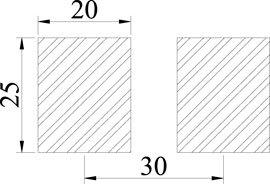
FIGURE 8. Diagram of double-wheel rectangular uniform load.
The method of cumulative load time was employed in this study to transform the dynamic load into static load for the purpose of analyzing permanent deformation (Faruk et al., 2016). The load times are converted into cumulative load time according to Eq. 1.
Where, t is the action time of wheel load; N is the load application times; P is the axle load of the vehicle;
According to Eq. 1, it can be determined that when the vehicle speed is 80 km/h, the one action time of axle load is 0.00804 s, and the cumulative load time for 500,000 axle loads is 4,020 s.
Based on the daily distribution of traffic volume and the cumulative load time mentioned above, it is possible to approximate the segmented cumulative time of load effects for each hour within a day by considering the distribution of traffic volume during different time periods, as shown in Table 5.
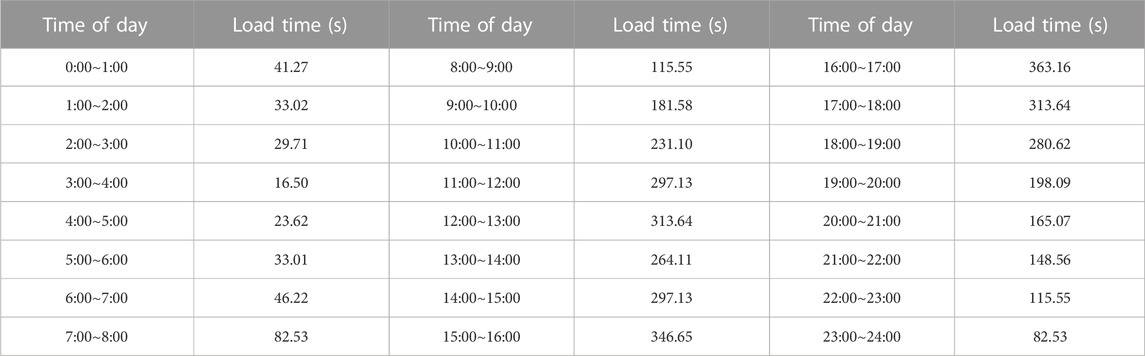
TABLE 5. Cumulative load time in different periods of a day.
The creep parameters of asphalt mixture are presented in Table 6. Due to the excellent high-temperature performance of epoxy asphalt mixture, the rutting distress is rarely occurred. Additionally, considering the temperature conditions in this study, the internal temperature of the epoxy asphalt may not exceed 30°C. Therefore, it is assumed that the creep effect of the epoxy asphalt mixture is negligible.
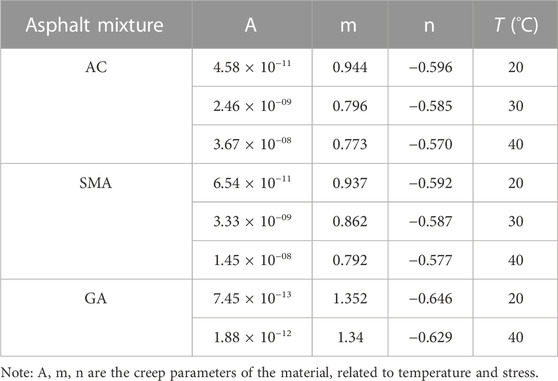
TABLE 6. Creep parameters of asphalt mixture (Wang, 2012; Ma et al., 2021).
To verify the rationality of the model, the rutting depth, which is highly sensitive to temperature and load, was chosen as the index in this section. A two-way four-lane SCCB suspension bridge was evaluated in this section which was comprised of 35 mm AC in the lower layer and 35 mm SMA in the upper layer. The rutting depth of two upstream lanes, Lane 1 and Lane 2, were detected after the bridge had been used for 15 months, as presented in Figure 9. The findings are displayed in Figure 10.

FIGURE 9. Rutting depth detection on the bridge deck pavement.
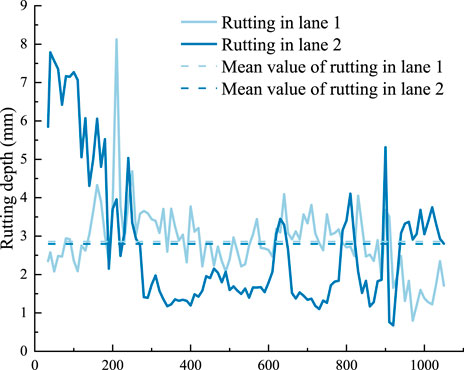
FIGURE 10. The detecting results of rutting depth on the bridge deck pavement.
The rutting depth under 500,000 axle loads was calculated to be about 2.75 mm. Compared with the measured average rutting depth of Lane 1 (2.86 mm) and Lane 2 (2.80 mm), the absolute error was only 3.85% and 1.79%, respectively. Evidently, the validation of the model was verified and demonstrated by the marginal error of less than 5%.
The creep strain cloud diagram and the permanent deformation at wheel track of the five bridge deck pavement structures under a ground contact pressure of 0.7 MPa are displayed in Figure 11. The horizontal axis 0 represents the position of the load center.
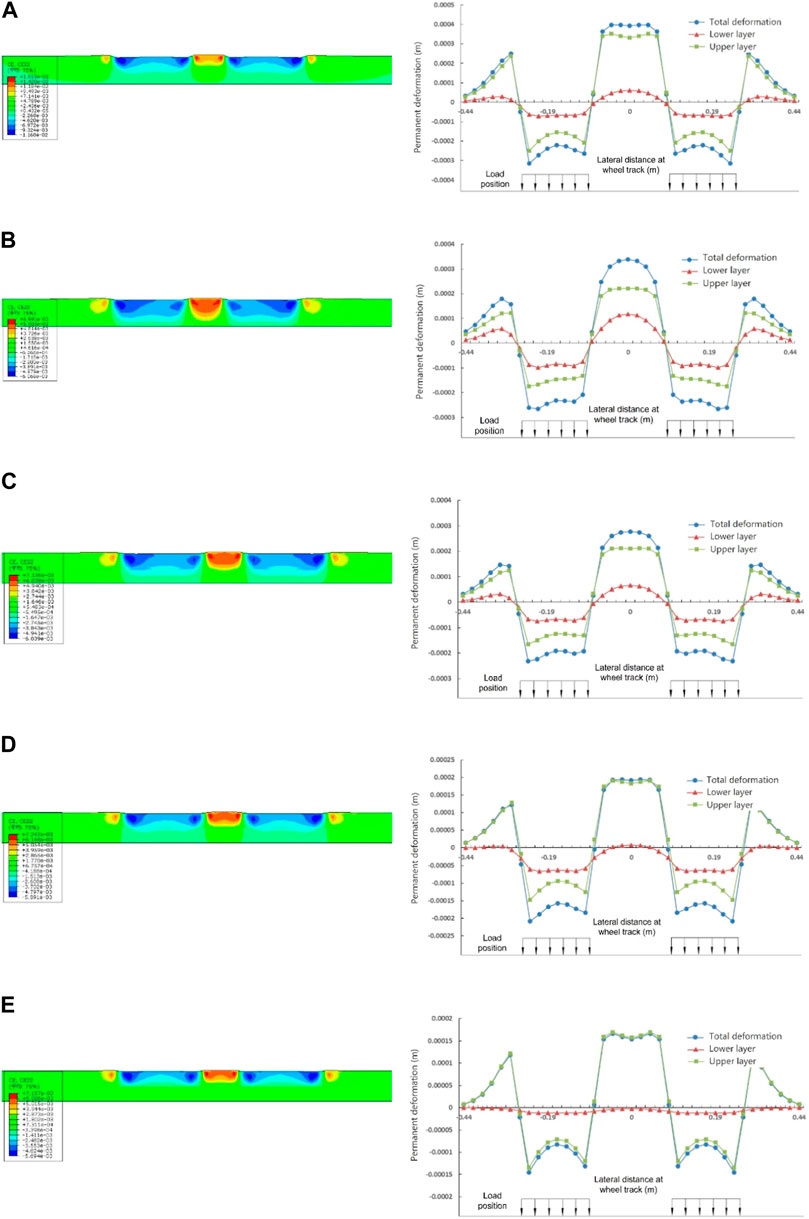
FIGURE 11. Creep strain and permanent deformation at wheel track of different pavement structures: (A) double-layer AC, (B) double-layer SMA, (C) AC + SMA, (D) GA + SMA, and (E) EA + SMA.
It can be obtained from the figure that “double-layer AC” exhibits relatively significant permanent deformation, with the deformation primarily occurring in the upper layer. Compared to “double-layer AC,” “double-layer SMA” exhibits relatively smaller subsidence deformation and heave deformation, indicating better resistance to rutting distress. The deformation results obtained from “AC + SMA” and “double-layer SMA” exhibit similar variations, which mainly occurs at upper SMA layer. The permanent deformation of “GA + SMA” is different from the above three pavement structures. The heave deformation of the upper layer primarily occurs at the center of the wheel track. Compared to “double-layer SMA,” the heave deformation gradually increases from the center of the wheel track towards the sides, but the increment is relatively small, exhibiting a concave-shaped distribution. Besides, the permanent deformation of the lower layer is mainly subsidence deformation at the wheel track, with minimal occurrence of heave deformation. In addition, the deformation is reduced by approximately 30% compared to “double-layer SMA.” The permanent deformation of “EA + SMA” is the smallest among the five pavement structures, which is attributed to the rutting resistance performance of epoxy asphalt concrete.
In this section, the load time is divided into 24 analysis steps, with each step representing 1 h of a day. The objective is to analyze the variation patterns of permanent deformation in the SCCB bridge deck pavement for each hour of a day. Taking “double-layer SMA” as an example, the permanent deformation at wheel track versus time is shown in Figure 12. It can be observed that, except for the initial load stage from 0:00 to 1:00, the heave deformation between the wheel track is concentrated during the high-temperature period from 10:00 to 18:00. During this time, there is a higher frequency of vehicle load, and the effects of solar radiation are evident. Therefore, the period from 10:00 to 18:00 is the main period during which heave deformation occurs in the pavement layer, accounting for approximately 90% of the total deformation. The heave deformation in the remaining periods is relatively small, and the deformation curve exhibits a roughly inclined “S” shape distribution. The maximum value of subsidence deformation in SCCB bridge deck pavement is slightly smaller than that of heave deformation. In addition to the initial load stage from 0:00 to 1:00, the bridge deck pavement experiences a slight rebound in subsidence deformation during the time periods of 1:00 to 5:00 and 19:00 to 23:00. However, the magnitude of the rebound is relatively small. This is because these time periods correspond to the cooling phase, during which asphalt concrete exhibits shrinkage rebound due to its viscoelastic behavior. The period from 10:00 to 16:00, which corresponds to the heating phase, is the main stage for subsidence deformation in the pavement, accounting for approximately 70% of the total deformation. Additionally, the maximum subsidence deformation occurs during the 12:00 to 13:00 period. In conclusion, whether it is heave deformation or subsidence deformation, the maximum deformation occurs during high-temperature periods. This is because asphalt mixtures have poor stability in high-temperature conditions and are prone to shear deformation. Additionally, traffic volume is mainly distributed during high-temperature periods. Under the combined influence of these factors, significant permanent deformation occurs.
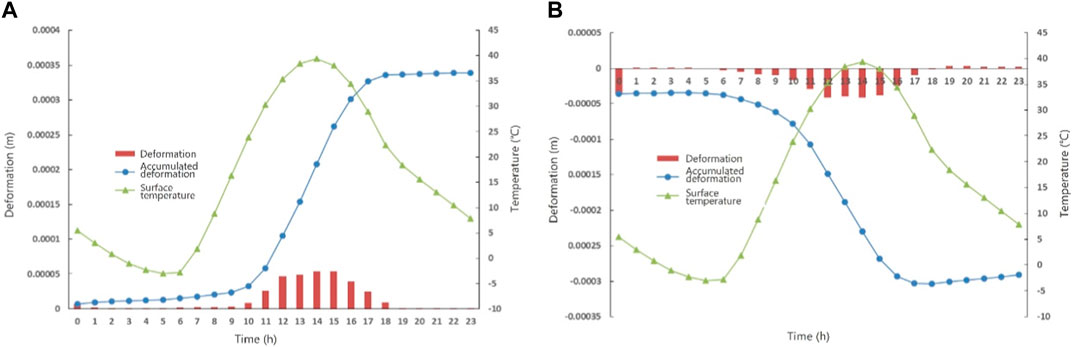
FIGURE 12. Permanent deformation at wheel track versus time of double-layer SMA: (A) heave deformation, and (B) subsidence deformation.
Due to the fact that SCCB bridges are often located in traffic throat and suffered severe heavy load condition, it is necessary to investigate the permanent deformation of bridge deck pavement under heavy load conditions in order to ensure their long-term use. Two different ground contact pressures, 0.9 and 1.1 MPa (Wang, 2014), were selected for analysis, and the results were compared with the results of 0.7 MPa mentioned above. This section will focus only on the comparison between “double-layer SMA” and “EA + SMA.” Additionally, variations in ground contact pressure due to different load levels and changes in load application shape will not be considered. The load conditions under different ground contact pressure are shown in Table 7.

TABLE 7. Load conditions under different ground contact pressure.
The permanent deformation of SCCB bridge deck pavement after 500,000 load applications under different ground contact pressure is shown in Figure 13. The permanent deformation of the pavement increases with the increase of ground contact pressure. And the permanent deformation at wheel track follows a similar lateral distribution pattern as under non-heavy load conditions. For “double-layer SMA,” when the ground contact pressure is 0.9 MPa, the heave deformation increases by 11.86% and the subsidence deformation increases by 15.12% compared to the results of 0.7 MPa. Besides, when the ground contact pressure is 1.1 MPa, the heave deformation increases by 19.62% and the subsidence deformation increases by 25.00%. For “EA + SMA,” when the ground contact pressure is 0.9 MPa, the heave deformation increases by 11.56% and the subsidence deformation increases by 15.71%; when the ground contact pressure is 1.1 MPa, the heave deformation increases by 19.20% and the subsidence deformation increases by 26.00%. As the ground contact pressure increases, the increment in permanent deformation becomes relatively smaller. This is because the development of rutting distress forms a compacted and squeezed structure between the aggregates in the asphalt mixture, which hinders further rutting formation.
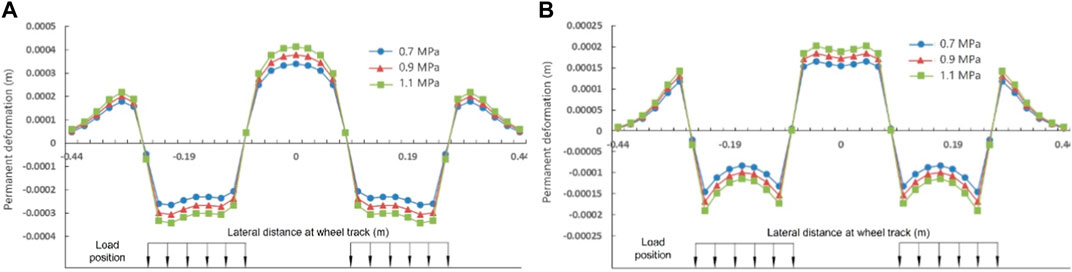
FIGURE 13. Permanent deformation under different ground contact pressure: (A) double-layer SMA, and (B) EA + SMA.
(1) The temperature field of the SCCB bridge deck pavement exhibits significant periodic variations with the changes in external temperature, with the temperature of the pavement surface showing the largest fluctuations. Under the temperature conditions simulated in this study, the temperature range of the pavement structure is between −5°C and 45°C, and the temperature field differences among the five pavement structures are relatively small.
(2) Under the periodic temperature variation conditions considered in this study, the temperature stress in SCCB bridge deck pavement exhibits periodic variations. The temperature stress is primarily tensile stress during the low-temperature periods, while it is compressive stress during the high-temperature periods.
(3) After 500,000 times of standard axle load, the permanent deformation of “double-layer AC” and “double-layer SMA” are similar, which is around 0.30 mm, and the permanent deformation of “AC + SMA” and “GA + SMA” are around 0.22 mm. The permanent deformation of “EA + SMA” is the smallest, which is 0.17 mm, indicating that “EA + SMA” has the best rutting resistance. Therefore, in areas with severe rutting distresses, it is recommended to use “EA + SMA” pavement structure in SCCB bridge.
(4) The permanent deformation of the SCCB bridge deck pavement increases rapidly during high-temperature periods, while it remains relatively small during low-temperature periods, influenced by the external temperature and traffic volume distribution. The daily deformation curve exhibits a roughly inclined “S” shape distribution.
(5) Heavy load conditions have a great influence on the permanent deformation of SCCB bridge deck pavement. Under the same temperature conditions and cumulative load time, the permanent deformation increases with the increase of ground contact pressure. Moreover, the lateral distribution pattern of permanent deformation at the wheel track remains relatively consistent. Thus, efforts should be made to avoid overload and heavy load conditions as much as possible.
The raw data supporting the conclusion of this article will be made available by the authors, without undue reservation.
JY: Conceptualization, Methodology, Writing–original draft. LT: Data curation, Software, Visualization, Writing–original draft. XQ: Investigation, Software, Writing–review and editing. CZ: Writing–review and editing.
The author(s) declare financial support was received for the research, authorship, and/or publication of this article. The authors appreciate the financial support from Yunnan Provincial Department of Transportation Technology Innovation and Demonstration Project [No. (2021)86-(3)].
The authors declare that the research was conducted in the absence of any commercial or financial relationships that could be construed as a potential conflict of interest.
All claims expressed in this article are solely those of the authors and do not necessarily represent those of their affiliated organizations, or those of the publisher, the editors and the reviewers. Any product that may be evaluated in this article, or claim that may be made by its manufacturer, is not guaranteed or endorsed by the publisher.
Chen, L. L., Liu, G., Yao, B., and Qian, Z. D. (2021). Rutting prediction model for semirigid base asphalt pavement based on hamburg wheel tracking test. Int. J. Geomech. 21, 04021215. doi:10.1061/(ASCE)GM.1943-5622.0002194
Cheng, Z. Y., Zhang, Q. H., Bao, Y., Deng, P. H., Wei, C., and Li, M. Z. (2021). Flexural behavior of corrugated steel-UHPC composite bridge decks. Eng. Struct. 246, 113066. doi:10.1016/j.engstruct.2021.113066
Fan, L., Yang, W. P., Zhou, D., and Li, Z. Y. (2021). Temperature distribution and mechanical response of orthotropic steel bridge deck during paving of gussasphalt pavement. Int. J. Steel Struct. 21, 315–328. doi:10.1007/s13296-020-00440-3
Faruk, A. N. M., Liu, W., Lee, S. I., Naik, B., Chen, D. H., and Walubita, L. F. (2016). Traffic volume and load data measurement using a portable weigh in motion system: A case study. Int. J. Pavement Res. Tech. 9, 202–213. doi:10.1016/j.ijprt.2016.05.004
He, Z. Q., Ou, C. X., Tian, F., and Liu, Z. (2021). Experimental behavior of steel-concrete composite girders with UHPC-grout strip shear connection. Buildings 11, 182. doi:10.3390/buildings11050182
Huang, X. M., Yang, Y. W., Li, H., and Liu, M. (2009). Asphalt pavement short-term rutting analysis and pridiction considering temperature and traffic loading conditions. J. Southeast Univ. En. Ed.) 25, 385–390.
Jiang, J. W., Dong, Q., Ni, F. J., and Yu, H. f. (2018). Development of permanent deformation master curves of asphalt mixtures by load-temperature superposition. J. Mater. Civ. Eng. 30, 04018098. doi:10.1061/(ASCE)MT.1943-5533.0002300
Jiang, S. (2021). Prediction of rutting of composite guss asphalt steel bridge deck pverlay (Nanjing: Southeast Universit). [master’s thesis].
Kong, F. L., Huang, P. M., Han, B., Wang, X. Z., and Liu, C. Q. (2021). Experimental study on behavior of corrugated steel-concrete composite bridge decks with MCL shape composite dowels. Eng. Struct. 227, 111399. doi:10.1016/j.engstruct.2020.111399
Liu, G., Chen, L. L., Qian, Z. D., Zhang, Y. H., and Ren, H. S. (2021). Rutting prediction models for asphalt pavements with different base types based on RIOHTrack full-scale track. Constr. Build. Mater. 305, 124793. doi:10.1016/j.conbuildmat.2021.124793
Liu, Y., Qian, Z. D., and Hu, H. Z. (2016). Thermal field characteristic analysis of steel bridge deck during high-temperature asphalt pavement paving. KSCE J. Civ. Eng. 20, 2811–2821. doi:10.1007/s12205-016-0027-2
Liu, Y., Qian, Z. D., and ZhengZhang, D. M. (2019). Interlaminar thermal effect analysis of steel bridge deck pavement during gussasphalt mixture paving. Int. J. Pavement Eng. 20, 1323–1335. doi:10.1080/10298436.2017.1413240
Ma, T., Liao, G. Y., and Huang, X. M. (2021). Application of ABAQUS finite element software in road engineering. Nanjing: Southeast University Press.
Mallick, R. B., Chen, B. L., and Bhowmick, S. (2009). Harvesting energy from asphalt pavements and reducing the heat island effect. Int. J. Sustain. Eng. 2, 214–228. doi:10.1080/19397030903121950
MOT (Ministry of Transport of P.R. China) (2015). General specification for design of Highway bridges and Culverts, JTG D60-2015. Beijing: China Communications Press.
Swarna, S. T., Reddy, K. S., Reddy, M. A., and Pandey, B. B. (2018). Analysis of stresses due to traffic and thermal loads in two-lift bonded concrete pavements by finite element method. Adv. Civ. Eng. Mater. 7, 20170028–20170222. doi:10.1520/ACEM20170028
Wang, D., Tan, B. K., Wang, X., and Zhang, Z. H. (2021). Experimental study and numerical simulation of temperature gradient effect for steel-concrete composite bridge deck. Meas. Control-Uk 54, 681–691. doi:10.1177/00202940211007166
Wang, H. (2012). Analysis of steel deck pavement performance subjected to coupling of heavy load and temperature (Nanjing: Southeast University). [master’s thesis].
Wang, Q., Tong, S. J., Wang, X. C., and Zeng, W. (2009). Analysis on the temperature field and temperature stress of bridge deck pavement. J. Xi’an Univ. Arch. Tech. Nat. Sci. Ed.) 41, 219–224.
Wang, Y. (2014). Study on rutting prediction of long-span steel bridge deck compound gussasphalt pavement (Nanjing: Nanjing Forestry University). [master’s thesis].
Zhang, H. T. (2019). Asphalt concrete bridge deck analysis of mechanical response under temperature and dynamic load (Xi’an: Chang’an University). [master’s thesis].
Keywords: steel-concrete composite beam bridge, asphalt pavement, temperature-load coupling, mechanical response, permanent deformation
Citation: Yang J, Tan L, Qi X and Zhang C (2023) Investigation on permanent deformation in steel-concrete composite beam bridge deck pavement under temperature-load coupling effect. Front. Mater. 10:1284928. doi: 10.3389/fmats.2023.1284928
Received: 29 August 2023; Accepted: 18 September 2023;
Published: 28 September 2023.
Edited by:
Leilei Chen, Southeast University, ChinaReviewed by:
Yang Liu, Southeast University, ChinaCopyright © 2023 Yang, Tan, Qi and Zhang. This is an open-access article distributed under the terms of the Creative Commons Attribution License (CC BY). The use, distribution or reproduction in other forums is permitted, provided the original author(s) and the copyright owner(s) are credited and that the original publication in this journal is cited, in accordance with accepted academic practice. No use, distribution or reproduction is permitted which does not comply with these terms.
*Correspondence: Chenchen Zhang, emNjQGFoc2R4eS5lZHUuY24=
Disclaimer: All claims expressed in this article are solely those of the authors and do not necessarily represent those of their affiliated organizations, or those of the publisher, the editors and the reviewers. Any product that may be evaluated in this article or claim that may be made by its manufacturer is not guaranteed or endorsed by the publisher.
Research integrity at Frontiers
Learn more about the work of our research integrity team to safeguard the quality of each article we publish.