 Beian Li1
 Yongsi Li
 Lu Ke
Lu Ke
95% of researchers rate our articles as excellent or good
Learn more about the work of our research integrity team to safeguard the quality of each article we publish.
Find out more
ORIGINAL RESEARCH article
Front. Mater. , 12 October 2023
Sec. Structural Materials
Volume 10 - 2023 | https://doi.org/10.3389/fmats.2023.1276118
This article is part of the Research Topic Recent Advances in Durability Improvement and Low-Carbon Strategy of Engineering Materials and Structures View all 17 articles
Ultra-high performance concrete has excellent mechanical properties such as ultra-high strength and high durability, and has a broad application prospect in the field of bridge engineering. To make full use of the superior mechanical properties of UHPC and reduce the cost of the bridge, the particle swarm optimization algorithm is used to optimize the structural design of the UHPC beam bridge; Aiming at the problem that the traditional particle swarm optimization algorithm is easy to fall into local optimum, the nonlinear adaptive weight update method is used to improve the particle swarm optimization algorithm. Based on the above-mentioned improved particle swarm optimization algorithm, the optimal design method of ordinary reinforced UHPC beams and prestressed UHPC beams with commonly used highway spans is studied. The reliability of the optimized structural limit state is analyzed by Monte Carlo (MC) importance sampling method. The results show that compared with the traditional particle swarm optimization algorithm, the improved particle swarm optimization algorithm has higher convergence speed and convergence accuracy. The optimal height-span ratio of ordinary reinforced UHPC beams decreases with the increase of the span, and the construction cost gradually increases; The optimal height-span ratio of the prestressed beam decreases first and then increases with the increase of the span, and the construction cost gradually increases. The calculation results of load capacity reliability indexes of optimization results are all higher than the target reliability indexes of similar components stipulated in China’s “Uniform Standard for Structural Reliability Design of Highway Engineering”.
Compared with conventional concrete, UHPC, designed based on particle packing theory, has excellent durability and significant compressive strength (Zhou et al., 2022; Ke et al., 2023a; Zhou et al., 2023). And UHPC can be combined with carbon fiber-reinforced polymer for high load or corrosive environments (Ke et al., 2023b; Ke et al., 2023c). Incorporating UHPC materials into bridge engineering structures can effectively reduce the structural weight and improve durability, and has broad application prospects (Zhou et al., 2018; Xue et al., 2020). To make full use of the excellent performance of UHPC and minimize the cost, it is necessary to optimize the design of UHPC simply supported beam bridges.
At present, a lot of research has been carried out on the optimal design of concrete beams at home and abroad. Giuseppe et al. (Quaranta et al., 2014) used a special technique based on differential evolution to minimize the cost of prestressed concrete beams. Guo and Zhang (2022) proposed a multi-objective model for the optimal design of reinforced concrete beams, where the optimal solution involves a trade-off between cost and deflection. Zekeriya et al. (Aydın and Ayvaz, 2013) optimized the overall cost of prestressed concrete bridges based on an improved hybrid genetic algorithm, considering working stress, ultimate strength, ductility limit, deflection, and geometric constraints. Akintunde (2021) carried out cost optimization of tension reinforcement in structural members by artificial neural networks. The results show that artificial neural network (ANN) can be used to design single-reinforced rectangular beams that minimize the cost of reinforced concrete beams while meeting code requirements. Although there are many methods for the optimal design of simply supported concrete beam bridges, most of them have the disadvantages of complex algorithms, large amounts of calculation, and difficulty in determining parameters.
Particle Swarm Optimization (PSO) is a concept of swarm intelligence that draws inspiration from neuroscience, cognitive psychology, social behavior, and behavioral science research (Wang et al., 2021). It is mainly used in the field of optimization (Jain et al., 2018; Aje and Josephat, 2020). In recent years, the PSO has been gradually applied in the field of civil engineering. For example, Wei et al. (2022) solved the reasonable main cable curve of the suspension bridge through the improved particle swarm optimization, and compared it with the N-R iterative method and the finite element method. The results show that the proposed improved particle swarm optimization method has high accuracy and fast calculation speed. Khajehzadeh et al. (2011) developed an improved particle swarm optimization method to optimize the design of the extended foundation and retaining wall so that the total cost is the lowest under the constraint conditions. Luh and Lin (2011) proposed a two-stage PSO-based optimization scheme for truss structures. Although PSO algorithms have been applied to the field of structural engineering, there is limited literature on the optimization of UHPC simply-supported beams.
In this article, based on the improved particle swarm optimization, the optimal design of the UHPC simply supported beam bridge is carried out with the lowest cost of the main beam of the superstructure as the objective function. Ordinary reinforced UHPC beams with spans of 10, 13, 16, 20, 25, and 30 m and prestressed UHPC beams with spans of 20, 25, 30, 35, 40, and 50 m were studied. The influence of the bridge span and the height of the main beam on the cost is respectively analyzed in this paper. Finally, The Monte Carlo importance sampling method is used to analyze the reliability of the limit state of the load-carrying capacity and the serviceability limit state of the optimization results and compare the reliability levels of structures with different spans and different height-span ratios.
Each particle in the particle swarm optimization algorithm represents a point in the d-dimensional space, and each particle has its own speed and position, as well as the fitness value of the corresponding objective function. Assuming that each particle is a small bird in a flock of birds, the position and speed of each bird are different. To achieve the purpose of finding food, each small bird constantly adjusts its position according to its own experience and that of its companions The flight speed changes its own position; the position closest to the food experienced by each bird during the flight is called the individual optimal position, and the optimal position where the entire population can find food at present is called the global optimal position.
In the standard particle swarm optimization algorithm, the position and velocity of the ith particle in the d-dimensional search space are denoted by Xi(xi,1, xi,2… xi,d) and Vi = (vi,1, vi,2… vi,d) respectively. In each iteration, the particle updates its velocity and position through the optimal solution Pi = (pi,1, pi,2… pi,d) found by itself and the optimal solution Pg = (pg,1, pg,2… pg,d) currently found by the entire population. At the same time, a certain inertial velocity is retained, to achieve the purpose of generating new populations. Particles update their velocity according to the Eq. 1 and update their positions according to Eq. 2. Position update is realized by speed update (Zhong et al., 2022).
where w is the inertia weight, which generally takes the value range between 0.4 and 0.9; c1 and c2 are the learning factors, which generally take c1 and c2 as 2; r1 and r2 take the random numbers uniformly distributed between 0 and 1; t is the number of iterations (Marini and Walczak, 2015).
The Self-Adaptive Particle Swarm Optimization (SAPSO) improves the convergence speed and optimization effect of the algorithm by introducing an adaptive mechanism. The SAPSO algorithm solves the imbalance problem between the ability to search the local optimal solution and the global optimal solution of the PSO algorithm, and changes the constant inertia weight coefficient to a nonlinear inertia weight coefficient that dynamically changes according to the fitness value (Chun and Zhenglin, 2012). The equation is as follows:
where f is the current fitness value of the particle; favg is the average fitness value of all the current particles of the particle; fmin is the minimum fitness value of all the current particles of the particle; wmin, wmax are the minimum and maximum values of inertia coefficient, generally take wmin = 0.4, wmax = 0.9.
In Eq. 3, the inertia coefficient changes with the change of particle fitness. When the fitness of each particle tends to be the same or tends to be the optimal solution, the inertia coefficient will increase, otherwise the inertia coefficient will decrease. The inertia coefficient is smaller for particles with better-than-average fitness values, and conversely, it is larger for particles with worse-than-average fitness values.
Breed Particle Swarm Optimization (BPSO) is an algorithm obtained by referring to hybridization in genetic algorithm based on the standard particle swarm algorithm (Chun and Zhenglin, 2012). After each iteration of the algorithm is completed, a certain number of particles are randomly selected for hybridization according to a certain hybridization probability, and the same number of offspring particles (child) are generated by hybridization, and the offspring particles are used to replace the parent particles (parent). Through the hybridization operation, the diversity of the particle population is increased, which is conducive to the optimization results jumping out of the local optimal solution. The calculation equation of offspring position is as follows.
where p is a random number between 0 and 1; parent1 (x) is the position of the first parent particle; parent2 (x) is the position of the second parent particle.
The velocity equations of the offspring particles are as follows.
where parent1 (v) is the velocity of the first parent particle; parent2 (v) is the velocity of the second parent particle.
The improved particle swarm optimization (IPSO) is based on the BPSO, adding an algorithm for selecting a hybrid operation, that is, after each iteration is completed, the fitness values are sorted, and the target fitness value is selected from it. After each iteration is completed, the fitness values are sorted, and some particles with good target fitness are selected from them to directly enter the next-generation, instead of simply randomly selecting a certain proportion of particles for hybridization; the remaining particles are randomly hybridized, Then compare with the particles of the parent generation, and select the better particles to enter the next-generation. At the same time, the adaptive inertia weight is used to improve the learning strategy of the particles, making full use of the excellent performance of the population, which is more conducive to jumping out of the local optimal results and speeding up the convergence speed. The search ability of the area between particles is improved, and it is easy to get rid of the local optimal solution, to obtain better search results. The flow chart of the IPSO is shown in Figure 1, and the specific steps are as follows.
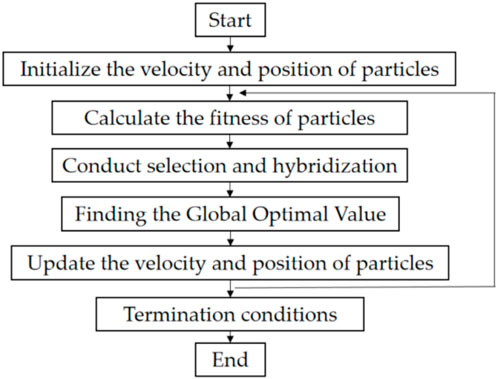
FIGURE 1. Flow chart of IPSO.
Step 1. Determining the population size;
Step 2. Initialize the velocity and position of the population particles;
Step 3. Calculate the fitness value of each particle, then sort the fitness value, and select the particles with better fitness value to directly enter the next-generation
Step 4. Perform hybrid selection on the particles with poor fitness, and select the same number of particles from the results to enter the next-generation
Step 5. The speed and position are updated by Eqs 1, 2, and the inertia weight is updated by Eq. 3
Step 6. Check whether the iteration termination condition is satisfied, if not, go to Step 3, until the convergence condition is met or the maximum number of iterations is reached, and the corresponding optimal fitness value is obtained.
The fitness of PSO is the value of the objective function. This section compares the convergence performance of each optimization algorithm by solving the minimal value of the Ackley function, which has the characteristics of a large space of feasible solutions and the existence of a large number of local minima, so it is more difficult to solve the global optimal solution, which has the following functional form.
The PSO, SAPSO, BPSO, and IPSO are used to calculate the Ackley function, respectively. The iterative process of calculating the Ackley function by four different algorithms is shown in Figure 2. From Figure 2, it can be seen that the smallest fitness is obtained by using the IPSO calculation. Therefore, it can be proved that the IPSO proposed in this article is less likely to fall into the local optimum and the optimal solution obtained is more accurate compared with the other three algorithms.
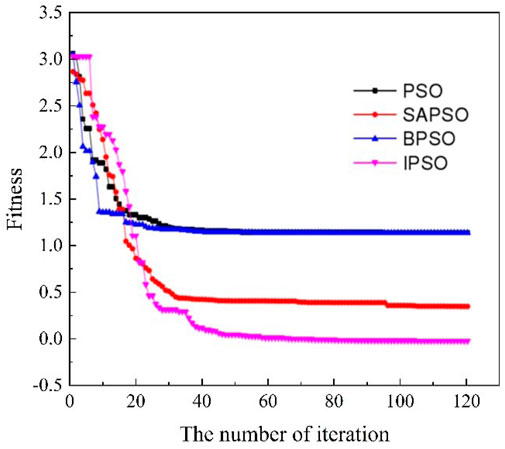
FIGURE 2. Iterative process of calculating Ackley function by different algorithms.
Many factors affect the cost of the main beam in bridge design. The main parameters include the concrete strength grade, the type of prestressed steel bars and ordinary steel bars, the size of the main beam section, the formwork cost, and the construction cost. It is very complicated and unnecessary. To simplify the calculation, in the optimal design, the parameters that control the project cost are directly selected as design variables, while other factors do not change much and can be regarded as constants.
(1) Self-weight: calculated based on the actual UHPC and reinforcement dosage. The self-weight of UHPC is 26 kN/m3, and the self-weight of reinforcement is 78.5 kN/m3.
(2) Auxiliary facilities and secondary dead loads: Consider bridge paving and guardrails, calculated according to the actual situation.
The moving load is in accordance with the “General Code for Design of Highway Bridges and Culverts” (JTGD60-2015), the road is grade I, the lateral distribution coefficient is calculated according to the hinged beam method, and the impact coefficient is calculated using the fundamental frequency of the structure.
The elastic modulus of UHPC used in this paper is 48.5 GPa, and the compressive strength is 150 MPa. The ordinary reinforced UHPC and prestressed UHPC T-beam bridges are shown in Figure 3.
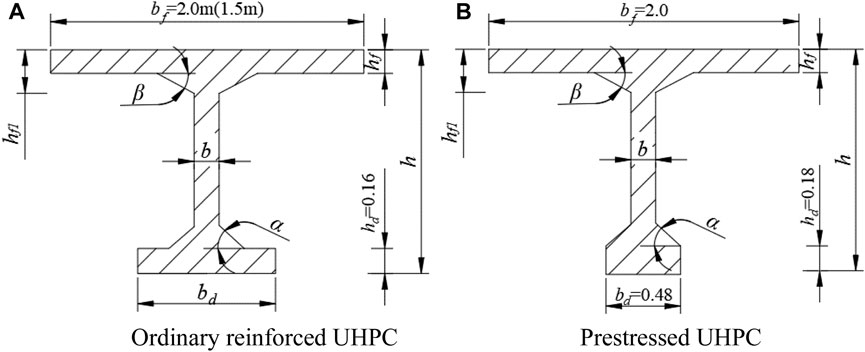
FIGURE 3. Basic section of T-beam. (A) Ordinary reinforced UHPC, (B) Prestressed UHPC.
In this article, the width of the bridge deck is 12 m. When the bridge span is less than 20 m, the flange width is 1.5 m and eight beams are used in the transverse direction; when the bridge span is greater than or equal to 20 m, the flange width is 2 m, and six beams are used in the transverse direction.
(1) The equivalent thickness of the upper flange plate is taken as hf ≥ 13 cm, the thickness of the root of the stalk axle is taken as hf1 ≥ 13 cm + b, and the angle of the stalk axle is set at the intersection of the upper flange and the web, with a slope of tanα = 1:1;
(2) The arrangement of reinforcement for the lower flange plate is taken into consideration, with ordinary reinforcement section hd ≥ 13 cm, and prestressed section hd ≥ 18 cm, the lower flange and web intersection to set the stem axle, stem axle slope to take tanβ = 1:1;
(3) The width of the web is taken as b ≥ 10 cm, and the thickness of the end web is taken as bend ≥ b + 8 cm;
(4) Ordinary reinforcement uses HRB400 steel bar with a diameter of 28 mm. Prestressing reinforcement employs Фs 15.2 1860 steel strand, with the number N of steel bars used as the design variable during calculation.
For ordinary concrete members, due to the small tensile strength of ordinary concrete, the contribution of its tensile strength to the structural bearing capacity has not been considered. Compared with ordinary concrete, UHPC materials have higher tensile strength, so their contribution to bearing capacity cannot be ignored, and the contribution of material tensile strength is considered in existing foreign codes or guidelines. According to the literature (Li, 2010), the contribution of the tensile strength of UHPC to the section bearing capacity varies with the reinforcement ratio, and the variation range is 10%–40%.
Theoretically, the strain value at each position on the section can be calculated according to the assumption of a plane section, the stress value can be obtained according to the constitutive relationship, and finally the bearing capacity of the section can be obtained through integral calculation. But such a calculation process is too complicated. In this paper, the compressive stress distribution and tensile stress distribution of UHPC are both equivalent to a rectangle, as shown in Figure 4. According to the principle that the resultant force and acting position of the UHPC compressive stress remain unchanged and the resultant force and acting position of the UHPC tensile stress remain unchanged, the equivalent coefficient of the compression zone can be determined as α = 0.87, β = 0.68, and the equivalent coefficient of the tension zone can be determined as k = 0.25.
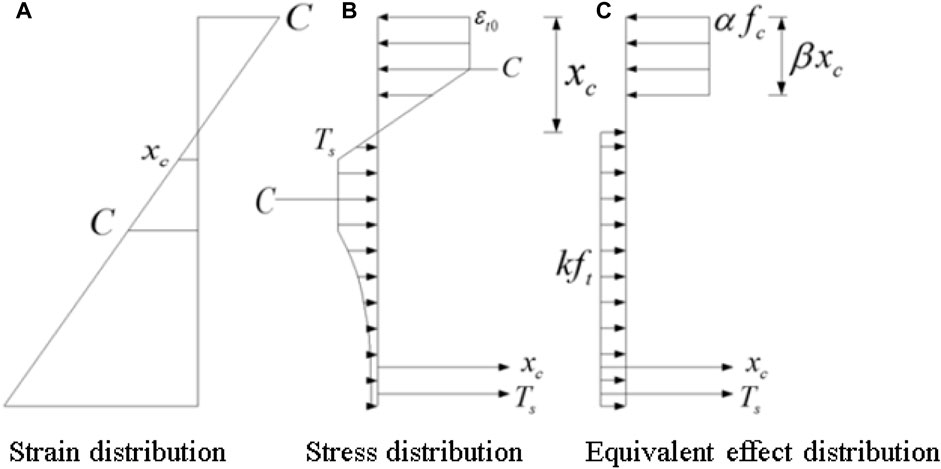
FIGURE 4. Stress-strain distribution diagram. (A) Strain distribution, (B) stress distribution, (C) equivalent effect of distribution.
The T-shaped section can be divided into two types according to the height of the compression zone of the section. The first category is that the height of the compression zone is smaller than the thickness of the flange plate; the second category is that the height of the compression zone is greater than the thickness of the flange plate. The formulas for calculating the flexural capacity of these two sections are introduced below.
When the following formula is satisfied, it is the first type of section:
The height of the compression zone is calculated according to the following formula:
The formula for calculating the flexural capacity of the first type of section is as follows:
When Eq. 9 is not satisfied, the section belongs to the second type of section. The height of the compression zone is calculated according to the following formula:
The formula for calculating the flexural capacity of the second type of section is as follows:
where M is the design value of flexural capacity; fc is the compressive strength of UHPC; ft is the tensile strength of UHPC; fy and fp are the tensile strength of steel bar and steel strand respectively; As, Ap are the cross-section areas of steel bars and steel strands, respectively; h0 is the distance from the steel bar to the edge of the compression zone of the section; and c0 is the distance from the steel bar to the edge of the tension zone of the section.
According to the French guidelines for the design of UHPC structures (AFGC/SETRA, 2013), the shear capacity of ordinary reinforced UHPC and prestressed UHPC members is calculated according to the following equation:
For ordinary reinforced UHPC members:
For prestressed UHPC members:
where VRd,c, VRd,s, VRd,f are the contributions of UHPC, reinforcement, and fibers to the shear carrying capacity, respectively; γcf, γE are material sub-factors taken as γcf γE=1.5; fck is the standard value of the compressive strength of UHPC; bw is the minimum width of the section in tension; d is the distance from the tensile reinforcement to the compression zone of the section; Asw is the area of the vertical shear reinforcement; s is the spacing of the shear reinforcement; fywd is the yield strength of shear resistant reinforcement; θ is the angle between the principal compressive stress and the beam axis; Afv is the area of the fiber affected zone, Afv = bwd; σRd,f is the participating tensile strength.
Maximum shear capacity:
The following equation determines the final shear capacity:
According to the French Design Guide for UHPC structures, the crack width at the location of the reinforcement is calculated according to the following formula:
where sr,max,f is the maximum crack spacing; εsm,f is the average strain of the reinforcement; εcm,f is the average strain of the UHPC.
The width of surface cracks in UHPC structures can be calculated based on the width of cracks at the location of reinforcement:
where h is the height of the section; d is the effective height of the section; x is the height of the compression zone; x' is the height of the elastic tension zone.
For the design of bridge structures, there are many constraints to be considered, such as strength constraints, cracking constraints, and deflection constraints. For ordinary reinforced UHPC structures, the following constraints are defined:
(1) Flexural capacity constraints
where Md is the design value of the bending moment; Mu is the flexural capacity.
(2) Deformation constraints
where k is the long-term growth coefficient of deflection, taken as 1.35; Ms is the frequency value of the moving load; BI is the converted stiffness of the mid-span section.
(3) Crack width constraint
Due to the excellent crack self-healing ability of UHPC, the durability of the structure will not be affected when the cracks in UHPC structures do not exceed 0.05 mm (Makita and Brühwiler, 2014).
where wmax is the maximum crack width.
(4) Stress condition constraints
According to the literature (Ministry of Transport of the People’s Republic of China, 2004), the stress constraint conditions of prestressed members are shown in Table 1.
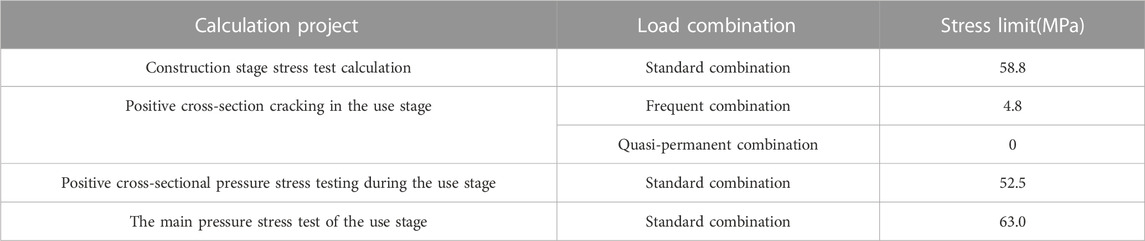
TABLE 1. Stress constraints of prestressed members.
The determination of the objective function is the most important step in the optimization design. In the optimal design of bridge section, the most applicable price standard is the lowest bridge section cost. The minimum cost of the main beam of the upper structure is the objective function, as shown in Eq. 26.
where P is the cost per unit area; B is the bridge deck width; Ac is the cross-sectional area of the main beam; Gs is the amount of reinforcement per unit area; Pcu is the unit price of UHPC; Psu is the unit price of reinforcement.
In this paper, the commonly used particle swarm optimization algorithm is improved, and the optimization program of particle swarm optimization algorithm is compiled. Using the compiled MATLAB optimization program, the design and optimization of ordinary reinforced UHPC beams with spans of 10, 13, 16, 20, 25, and 30 m and prestressed UHPC beams with spans of 20, 25, 30, 35, 40, and 50 m were carried out. For ordinary reinforced UHPC beams, only three variables changed during the optimization design process, namely, beam height: h, base plate width: bd, and number of steel bars: N. For prestressed UHPC beams, only two variables changed during the optimization design process, namely, the beam height h and the number of prestressed steel bars N. The cost iteration curves of simply supported beam bridges are shown in Figure 5, where (a) is the cost of ordinary reinforced UHPC beams with spans of 10–30 m under different iterations; (b) is the cost of prestressed UHPC beams with spans of 20–50 m under different iterations.
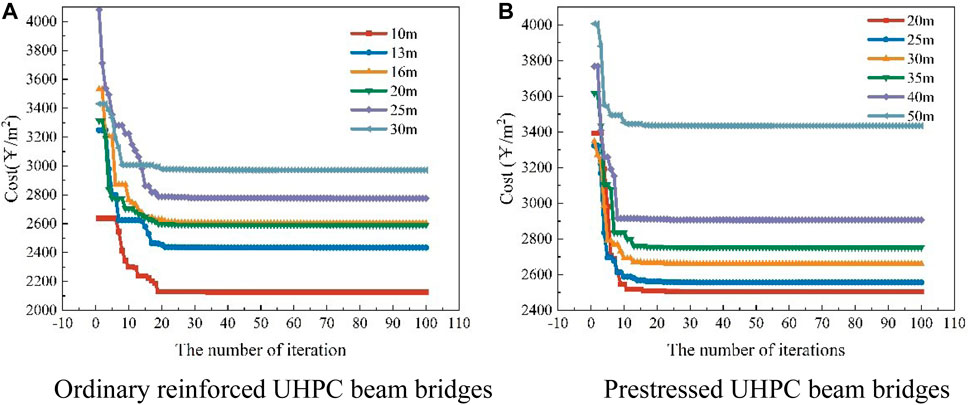
FIGURE 5. Iteration curve. (A) Ordinary reinforced UHPC beam bridges, (B) Prestressed UHPC beam bridges
It can be seen from Figure 5 that when the IPSO is used to optimize the design of ordinary reinforced UHPC beams and prestressed UHPC beams with different spans, the number of iterations is stable and the convergence process is rapid. The optimization results of ordinary reinforced UHPC beams are shown in Table 2, and the optimization results of prestressed UHPC beams are shown in Table 3.
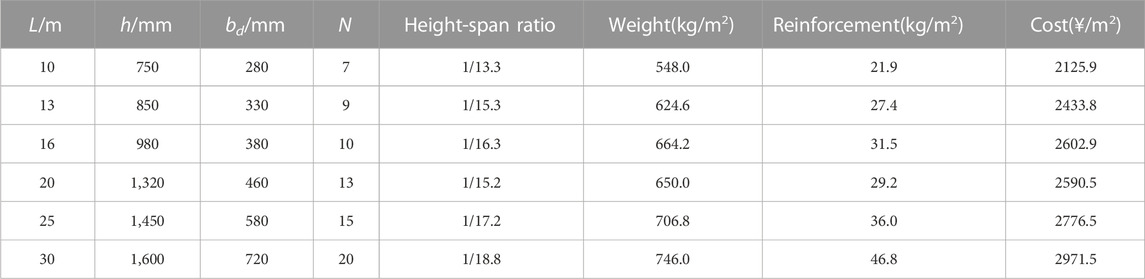
TABLE 2. Optimization results of ordinary reinforced UHPC beams.
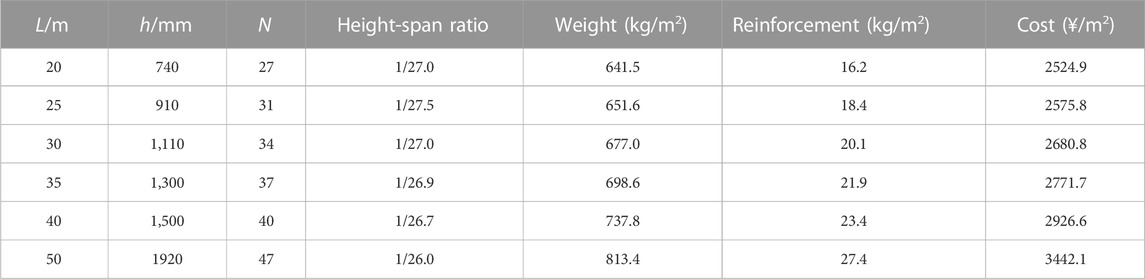
TABLE 3. Optimization results of prestressed UHPC beams.
It can be seen from Table 2 and Table 3 that with the increase of the span, the optimal beam height of ordinary reinforced UHPC beams increases, the optimal height-span ratio decreases, and the width of the bottom plate, the number of steel bars, and the cost all increase; With the increase of the span, the optimal beam height of the prestressed UHPC beam increases, the height-span ratio first decreases and then increases, and the number of steel bars and the cost increase.
In the bridge design process, there are often requirements for the clearance height under the bridge, and the height of the main beam needs to be controlled. Based on the improved particle swarm optimization algorithm, the optimization results can be obtained when the beam height is limited to different values. Among them, Table 4 shows the optimization results of the fixed beam height of ordinary reinforced UHPC beams, and Table 5 shows the optimization results of the fixed beam height of prestressed UHPC beams.
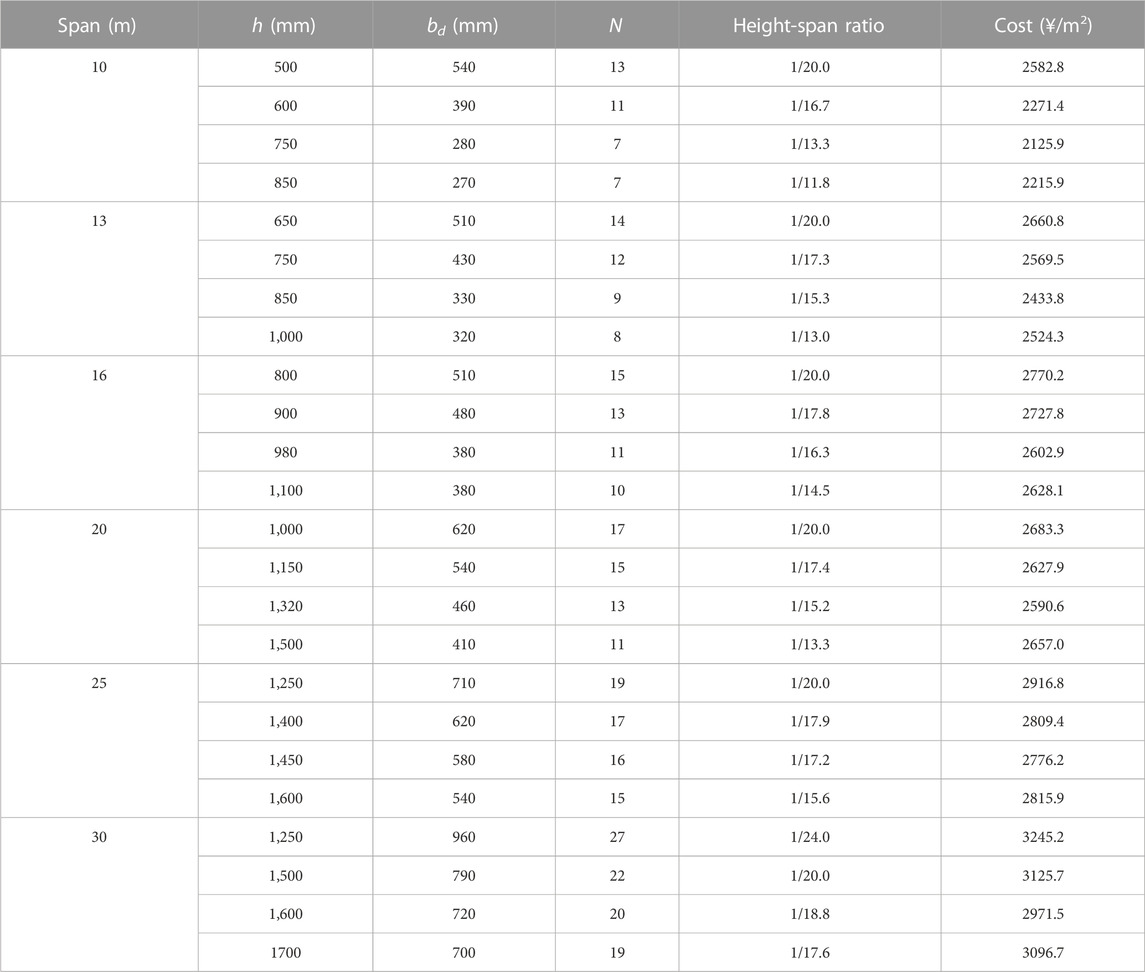
TABLE 4. Optimization results of the fixed beam height of ordinary reinforced UHPC beams.
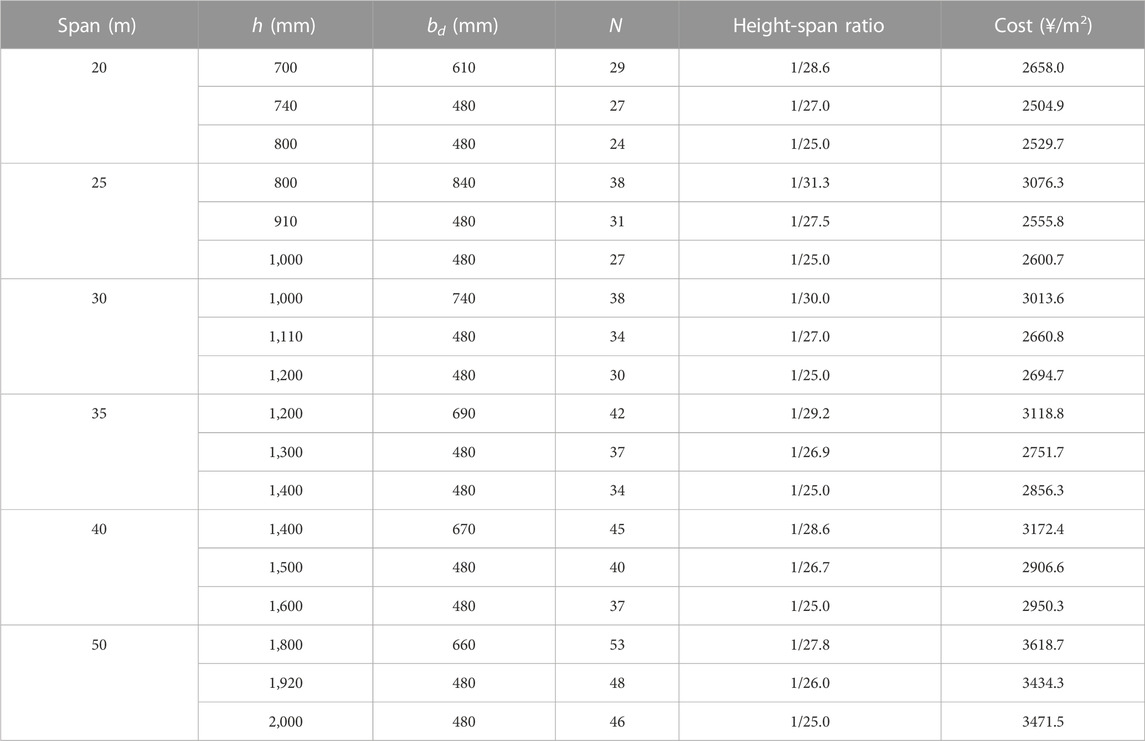
TABLE 5. Optimization results of the fixed beam height of prestressed UHPC beams.
From Table 4 and Table 5, it can be seen that when the beam height is increased on the basis of the optimal beam height, the base plate width and the number of steel bars of the ordinary reinforced UHPC beam are reduced; the base plate width of the prestressed UHPC beam is unchanged, and the amount of steel bars is reduced. When the beam height is reduced on the basis of the optimal beam height, the base plate width and the number of steel bars of the ordinary reinforced UHPC beam and the prestressed UHPC beam both increase. When the span of the bridge increases, the cost per square meter of the ordinary reinforced UHPC beam and the prestressed UHPC beam both increase; under the condition of the same span of the bridge, with the increase of beam height, the cost per square meter decreases at first and then increases.
According to the optimization results, the following conclusions are obtained: 1) The thickness of the upper flange does not change, the main reason is that the upper flange is wide, and increasing the thickness has a greater impact on the cost; The thickness of the web does not change, the main reason is that compared with increasing the bottom plate width, increasing the web width contributes less to the stiffness of the beam. 2) When the beam height is increased on the basis of the optimal beam height, in order to meet the layout of the prestressed pipe, the width of the beam floor remains unchanged; when the beam height is reduced on the basis of the optimal beam height, it is necessary to greatly increase the width of the bottom plate to meet the requirements of structural stiffness. 3) Under the same span, the number of steel bars increases with the decrease of beam height, because with the decrease of beam height, the internal force arm of steel bar also decreases. In order to meet the requirements of flexural capacity, it is necessary to increase the number of steel bars. 4) As the UHPC cost is the main factor affecting the construction cost, the price of steel bar and steel strand is only a small part, so the change of beam section size will directly affect the construction cost. For the beam with higher beam height, the increase of beam height is the main reason for the increase of cost; for the beam with lower beam height, in order to meet the needs of stiffness, the horseshoe section increases greatly, which leads to the increase of cost.
The reliability analysis of the bridge section optimized results was conducted under the current bridge design codes in China. Based on these codes, limit state equations were defined for the bridge structure’s load-carrying capacity and normal use states. The Monte Carlo (MC) important sampling method was used to analyze the reliability of the optimized structure in these limit states. The reliability levels of beams with different span and height-span ratios were compared.
For simply supported beams, the effects of constant load and live load (vehicle load) are mainly considered, and the values of the mid-span moment and support shear force generated by both are calculated. MD1 is the value of the mid-span moment for the self-weight of the precast beam, MD2 is the value of the mid-span moment for the secondary dead load (including paving and guardrail), VD1 is the value of support point shear for the self-weight of the precast beam, VD2 is the value of support point shear for the secondary dead load (including paving and guardrail); MQ1 is the bending moment value of vehicle load for the mid-span section, MQ2 is the bending moment value of the impact load; VQ1 is the value of vehicle load shear at the support point section, VQ2 is the value of impact load shear. The load value is calculated based on the optimization results.
Take each parameter in the reliability calculation function as a random variable, and refer to the relevant domestic and foreign literature to list the statistical parameters of each random variable in Table 6. There is no relevant literature on the statistical parameters of the tensile strength fpk of prestressed steel bars in actual engineering statistics parameters in China. Here, reference is made to the data of ordinary steel bars, and its coefficient of variation is taken as 0.1.
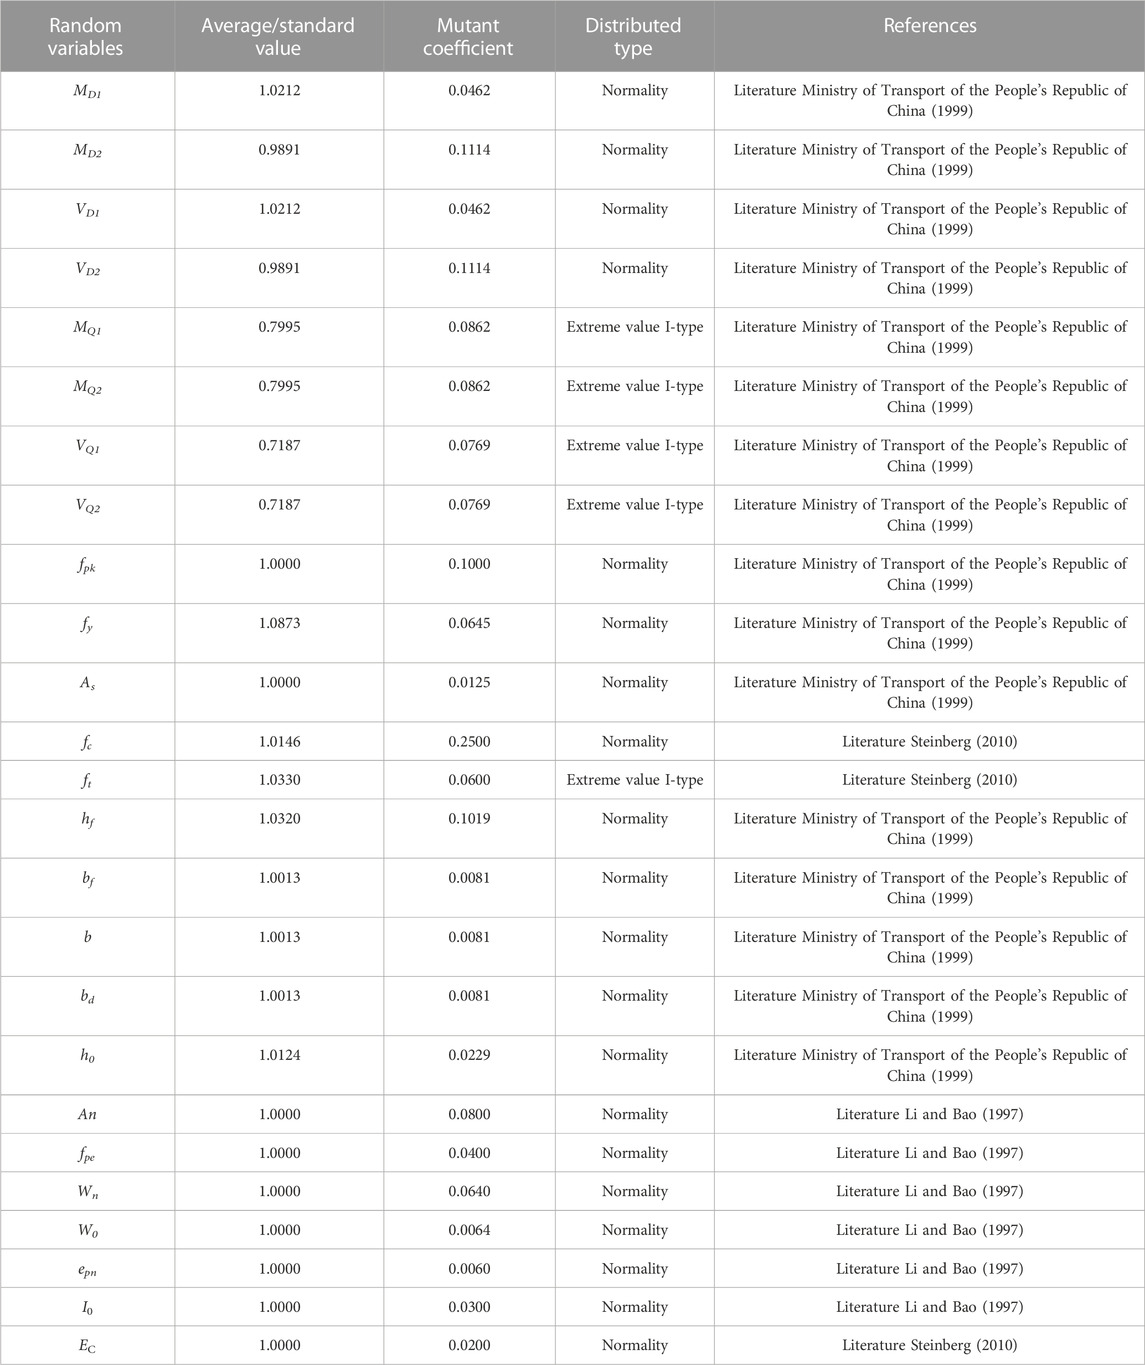
TABLE 6. Statistical parameters of random variables.
For the T-section, the flexural capacity function in the ultimate limit state is as follows:
The first type of cross-section can be expressed as:
where α is the equivalent rectangular stress distribution conversion factor in the compressive zone; fc is the design value of concrete axial compressive strength; bf is the calculated width of the flange in the compressive zone of the T-shaped section; x is the height of the compressive zone; h0 is the effective height of the section; ft is the design value of concrete axial tensile strength; β is the equivalent rectangular stress coefficient in the tensile zone UHPC.
The second type of cross-section can be expressed as:
The shear capacity function of the prestressed UHPC beam is as follows:
where γcf, γE are the material sub-factor, taken as: γcf γE = 1.5; fck is the standard value of UHPC compressive strength; bw is the minimum width of the section in tension; d is the distance from the tensile reinforcement to the compressive flange of the section; Afv is the area of the fiber affected zone; σRd,f is the participating tensile strength; θ is the angle between the principal compressive stress and the beam axis; σRd,f is the participating tensile strength.
According to the structural requirements of ordinary reinforced UHPC beams, double-leg stirrups with a diameter of 8 mm are used, and the distance between the stirrups is 15 cm; the function of the shear reliability of ordinary reinforced UHPC beams is as follows:
where Asw is the area of the vertical shear reinforcement; s is the spacing of the shear reinforcement; fywd is the yield strength of shear-resistant reinforcement.
As shown in Figure 6, the reliability index of the flexural capacity of ordinary reinforced UHPC beams decreases and then increases as the beam height increases. This is mainly because, at lower beam heights, the stiffness of the beam and the crack width are the primary constraints, while the flexural capacity is a secondary constraint. In order to meet the crack width constraint, additional reinforcement must be added, which causes an increase in the reliability index.
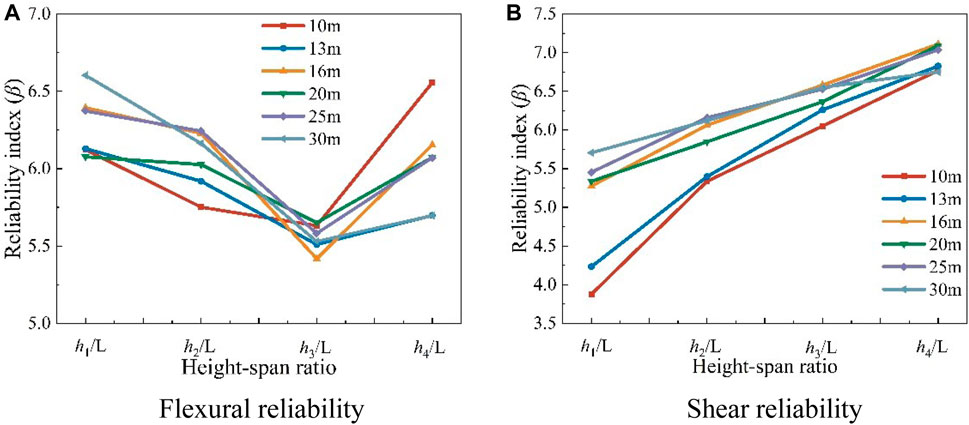
FIGURE 6. Reliability index of ordinary reinforced UHPC beam. (A) Flexural reliability, (B) Shear reliability.
As the beam height increases, the reliability index of the shear capacity of ordinary reinforced UHPC beams also gradually increases. This is because the web mainly provides the shear capacity of the beam, and as the height of the beam increases, so does the height of the web. Although the increase in height is accompanied by an increase in the self-weight of the beam, the increase in self-weight is slower than the increase in shear capacity.
In the “Unified standard for reliability design of highway engineering structures (JTG 2120-2020),” the target reliability index of the bearing capacity limit state of highway bridge structures with a safety level of one and ductile failure is 4.7, while the target reliability index corresponding to brittle failure is 5.2. The flexural failure of concrete beams belongs to ductile failure, while the shear failure belongs to brittle failure, so 4.7 and 5.2 can be taken as the target reliability indexes of flexural and shear capacities respectively. It can be seen from Figure 6 that the minimum reliability indexes of the flexural and shear capacities of ordinary reinforced UHPC beams at the optimum beam height are 5.42 and 5.39, respectively. It can be seen from Figure 7 that the minimum reliability indexes of the flexural and shear capacity of the prestressed UHPC beam at the optimal beam height are 4.92 and 5.35, respectively. The calculated reliability indexes all meet the requirements of “Unified standard for reliability design of highway engineering structures.”
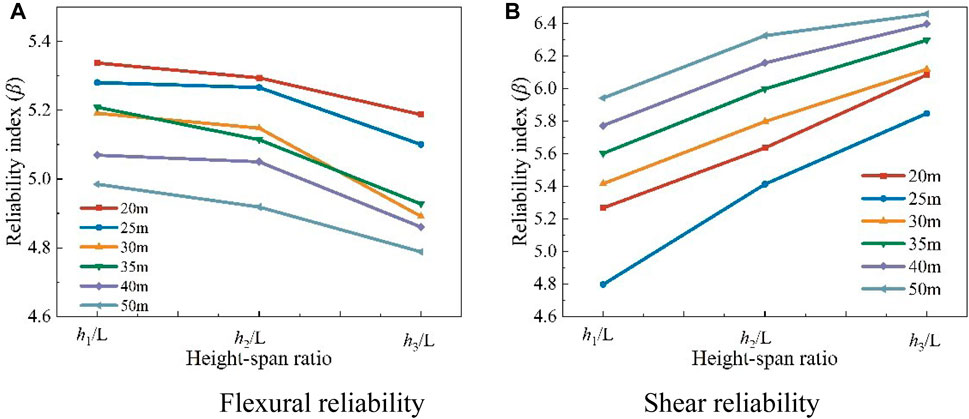
FIGURE 7. Reliability index of prestressed UHPC beam. (A) Flexural reliability, (B) Shear reliability.
As shown in Figure 7, the reliability index of the flexural capacity of the prestressed UHPC beam gradually decreases as the beam height increases. This is because as the beam height increases, the stiffness constraint condition weakens, and the constraint effect of the load-carrying capacity increases. In order to find the minimum solution that meets the requirements of the code, the reliability index of the flexural capacity is reduced.
The reliability standard for highway projects does not clearly specify the requirements for the reliability of serviceability limit states. The literature (Li and Bao, 1997) suggests that the acceptable probability of failure for serviceability limit states is approximately between 5% and 25%, and the corresponding target reliability index ranges from 0.675 to 1.645.
For the serviceability limit state, the specified crack width limit is taken as the resistance that the structural member should have. The maximum crack width generated by the beam under the actual load is considered the load effect. The limit state equation is established as follows:
where
As shown in Figure 8, the change law of the maximum crack width reliability index of ordinary reinforced UHPC beams increases first and then decreases. The reliability index is the smallest at the optimal result.
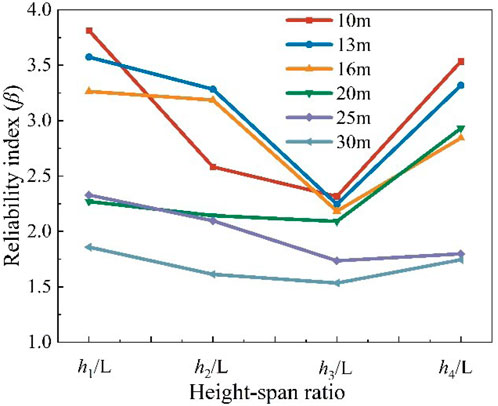
FIGURE 8. Reliability index of maximum crack width.
The crack resistance of prestressed concrete includes two parts: the normal section crack resistance and the inclining crack resistance. This article focuses on the normal section crack resistance. The normal section crack resistance is primarily governed by the normal tensile stress of the concrete. The normal section crack resistance test involves selecting many sections, such as a simply supported beam’s mid-span section or a continuous beam’s mid-span section and support point section. The normal tensile stress of the concrete at the edge of the crack resistance test is calculated under the combined effect of load frequency.
For fully prestressed concrete structures, the limit state equation for the reliability of normal section crack resistance can be expressed as:
Calculate the reliability index of the normal section crack resistance of prestressed UHPC simply supported beams under different height-span ratios, as shown in Figure 9.
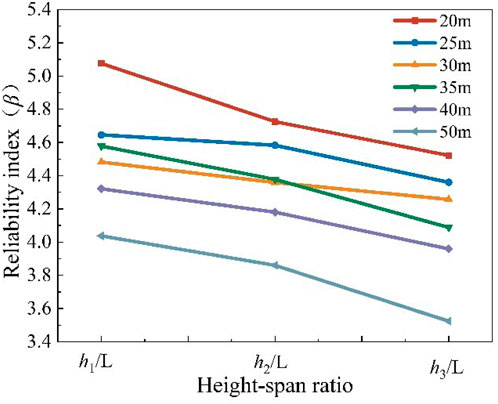
FIGURE 9. Reliability index of normal section crack resistance.
It can be seen from Figure 9 that the reliability index of normal section crack resistance of prestressed UHPC beam increases gradually with the decrease of the height-span ratio. The main reason is that as the beam height decreases, it is necessary to increase the steel strands to meet the requirements of the flexural capacity. Adding steel strands will increase the prestress of the entire section, the restraint effect of the normal section crack resistance will be weakened, and the reliability index will be improved.
In order to ensure that the structure does not produce excessive deformation during use, the deflection of the beam in the service phase is limited. The formula for calculating the deflection of a simply supported beam is as follows:
For class A components, take B0 = 0.95EcI0; for concrete components, the section conversion stiffness B is calculated according to the following equation:
The function of deflection reliability is as follows:
where L is the calculated span; ηθ is the long-term growth coefficient of deflection, which is 1.35; fs is the deflection value generated by deducting the self-weight under the combination of short-term effects. The results of the deflection reliability calculation are shown in Figure 10.
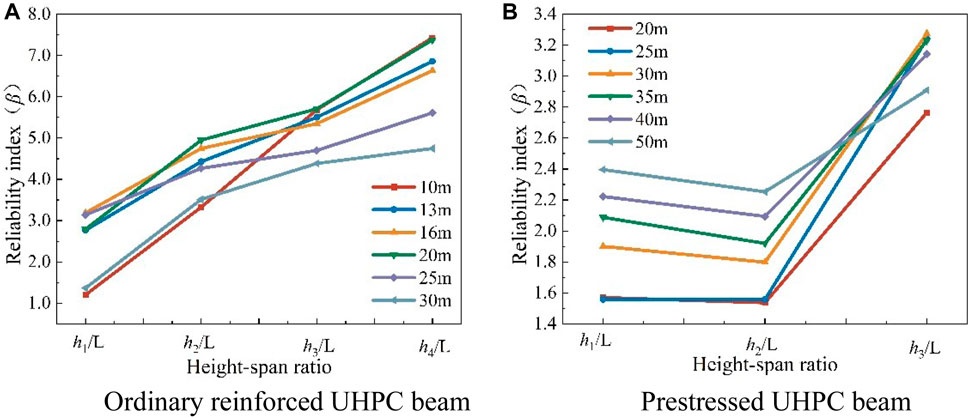
FIGURE 10. Deflection reliability index. (A) Ordinary reinforced UHPC beam, (B) Prestressed UHPC beam.
The results show that the deflection reliability index of ordinary reinforced UHPC beams decreases gradually with the decrease of beam height; The reliability index of prestressed UHPC beams is the smallest at the optimal beam height. The main reason is that the deflection constraints of ordinary reinforced UHPC beams are not the main constraints, while the deflection constraints of prestressed UHPC beams are the main constraints. In the optimization process, the deflection value is close to the limit value, reducing the beam height of the prestressed UHPC beam requires increasing the transverse dimension of the section to meet the deflection constraints, which has little effect on the reliability index of the deflection. However, increasing the beam height greatly improves the deflection reliability index.
Based on the improved particle swarm optimization algorithm, the optimal design of ordinary reinforced UHPC and prestressed UHPC simply supported beam bridges with commonly used highway spans is carried out.
1) The IPSO is based on the strategy of genetic algorithm to select hybridization. Non-linear adaptive weights are used to update the weight coefficients, which solves the deficiency that the traditional particle swarm algorithm is easy to fall into local optimal solutions and improves the convergence speed and convergence accuracy of the algorithm.
2) The optimal height-span ratio of ordinary reinforced UHPC beams decreases with the increase of the span, and the construction cost gradually increases; the optimal height-span ratio of the prestressed beam decreases first and then increases with the increase of the span, and the construction cost gradually increases.
3) For ordinary reinforced UHPC beams, the main factors affecting the optimization results are the flexural capacity and the crack width constraint.
4) For prestressed UHPC beams, the main factors affecting the optimization results are the flexural capacity and deflection constraints. As the high-span ratio approaches 1/27, deflection becomes the primary factor affecting optimization results while meeting flexural capacity.
5) The calculation results of load capacity reliability indexes of optimization results are all higher than the target reliability indexes of similar components stipulated in China’s “Uniform Standard for Structural Reliability Design of Highway Engineering".
The original contributions presented in the study are included in the article/Supplementary Material, further inquiries can be directed to the corresponding author.
BL: Conceptualization, Data curation, Methodology, Writing–original draft. YL: Conceptualization, Methodology, Writing–review and editing. XGL: Formal Analysis, Investigation, Writing–original draft. XLL: Formal Analysis, Investigation, Writing–original draft. SZ: Supervision, Validation, Writing–review and editing. LK: Supervision, Validation, Writing–review and editing.
The authors declare financial support was received for the research, authorship, and/or publication of this article. This research was supported by the Department of Science and Technology of Guangxi Zhuang Autonomous Region (Nos: 2022AB23056).
The authors acknowledge the support extended to the work by postgraduate students working under the guidance of the authors.
Authors BL, XGL, and XLL were employed by Guangxi Xinxiang Expressway Co., Ltd.
The remaining authors declare that the research was conducted in the absence of any commercial or financial relationships that could be construed as a potential conflict of interest.
All claims expressed in this article are solely those of the authors and do not necessarily represent those of their affiliated organizations, or those of the publisher, the editors and the reviewers. Any product that may be evaluated in this article, or claim that may be made by its manufacturer, is not guaranteed or endorsed by the publisher.
Aje, O. F., and Josephat, A. A. (2020). The particle swarm optimization (PSO) algorithm application–A review. Glob. J. Eng. Technol. Adv. 3 (3), 1–6. doi:10.30574/gjeta.2020.3.3.0033
Akintunde, O. P. (2021). Optimal design prediction of a singly reinforced concrete beam steel using artificial neural network. J. Civ. Eng. Res. Technol. 110, 3. SRC/JCERT-110. doi:10.47363/JCERT/2021(3)110
Aydın, Z., and Ayvaz, Y. (2013). Overall cost optimization of prestressed concrete bridge using genetic algorithm. KSCE J. Civ. Eng. 17, 769–776. doi:10.1007/s12205-013-0355-4
Chun, G., and Zhenglin, W. (2012). Proficient in MATLAB optimization calculations. 2nd ed. Beijing: Electronic Industry Press.
Guo, K., and Zhang, L. (2022). Multi-objective optimization for improved project management: current status and future directions. Automation Constr. 139, 104256. doi:10.1016/j.autcon.2022.104256
Jain, N. K., Nangia, U., and Jain, J. (2018). A review of particle swarm optimization. J. Institution Eng. (India) Ser. B 99, 407–411. doi:10.1007/s40031-018-0323-y
Ke, L., Liang, L., Feng, Z., Zhou, J., and Li, Y. (2023a). Bond performance of CFRP bars embedded in UHPFRC incorporating orientation and content of steel fibers. J. Build. Eng. 73, 106827. doi:10.1016/j.jobe.2023.106827
Ke, L., Ai, Z., Feng, Z., Chen, Z., and Yoo, D. Y. (2023b). Interfacial bond behavior between ribbed CFRP bars and UHPFRC: effects of anchorage length and cover thickness. Eng. Struct. 286, 116140. doi:10.1016/j.engstruct.2023.116140
Ke, L., Zhu, F., Chen, Z., Feng, Z., Zhou, J., and Li, Y. (2023c). Fatigue failure mechanisms and probabilistic S-N curves for CFRP–steel adhesively bonded joints. Int. J. Fatigue 168, 107470. doi:10.1016/j.ijfatigue.2022.107470
Khajehzadeh, M., Taha, M. R., El-Shafie, A., and Eslami, M. (2011). Modified particle swarm optimization for optimum design of spread footing and retaining wall. J. zhejiang university-science A 12, 415–427. doi:10.1631/jzus.a1000252
Li, Y. H., and Bao, W. G. (1997). Structural reliability and probability limit state design of highway bridge structure. Beijing: China Communications Press. In Chinese.
Li, L. (2010). Research on the force performance and design method of activated powder concrete beams. Harbin: Harbin Institute of Technology.
Luh, G., and Lin, C. (2011). Optimal design of truss-structures using particle swarm optimization. Comput. Struct. 89 (23-24), 2221–2232. doi:10.1016/j.compstruc.2011.08.013
Makita, T., and Brühwiler, E. (2014). Tensile fatigue behaviour of ultra-high performance fibre reinforced concrete (UHPFRC). Mater. Struct. 47 (3), 475–491. doi:10.1617/s11527-013-0073-x
Marini, F., and Walczak, B. (2015). Particle swarm optimization (PSO). A tutorial. Chemom. Intelligent Laboratory Syst. 149, 153–165. doi:10.1016/j.chemolab.2015.08.020
Ministry of Transport of the People's Republic of China (1999). Uniform standard for structural reliability design of highway engineering: GB/T50283-1999. Beijing.
Ministry of Transport of the People's Republic of China (2004). Code for design of highway reinforced concrete and prestressed concrete bridges and Culverts: Jtg D62-2004. Beijing.
Quaranta, G., Fiore, A., and Marano, G. C. (2014). Optimum design of prestressed concrete beams using constrained differential evolution algorithm. Struct. Multidiscip. Optim. 49, 441–453. doi:10.1007/s00158-013-0979-5
Steinberg, E. (2010). Structural reliability of prestressed UHPC flexure models for bridge girders. J. Bridge Eng. 15 (1), 65–72. doi:10.1061/(asce)be.1943-5592.0000039
Wang, Z., Li, D., Wang, Z., Liu, A., and Tao, R. (2021). Research on dynamic balance of spindle rotor system based on particle swarm optimization. Adv. Mater. Sci. Eng. 2021, 1–12. doi:10.1155/2021/9728248
Wei, Z., Shen, M., Song, X., Wang, J., Lv, M., Jia, S., et al. (2022). Study on the main cable curve of suspension bridge based on the improved particle swarm optimization (IPSO) method. Appl. Sci. 12 (11), 5445. doi:10.3390/app12115445
Xue, J., Briseghella, B., Huang, F., Nuti, C., Tabatabai, H., and Chen, B. (2020). Review of ultra-high performance concrete and its application in bridge engineering. Constr. Build. Mater. 260, 119844. doi:10.1016/j.conbuildmat.2020.119844
Zhong, X., Tao, W., Zou, L., Yang, H., and Yao, S. (2022). Servo system control of turntable lipstick-filling machine based on particle swarm optimization. Adv. Mater. Sci. Eng. 2022, 1–11. doi:10.1155/2022/8968510
Zhou, M., Lu, W., Song, J., and Lee, G. C. (2018). Application of ultra-high performance concrete in bridge engineering. Constr. Build. Mater. 186, 1256–1267. doi:10.1016/j.conbuildmat.2018.08.036
Zhou, C., Wang, J., Jia, W., and Fang, Z. (2022). Torsional behavior of ultra-high performance concrete (UHPC) rectangular beams without steel reinforcement: experimental investigation and theoretical analysis. Compos. Struct. 299, 116022. doi:10.1016/j.compstruct.2022.116022
Keywords: ultra-high performance concrete, simply supported beam bridge, optimization design, improved particle swarm optimization, reliability
Citation: Li B, Li Y, Liu X, Liu X, Zhu S and Ke L (2023) Section optimization design of UHPC beam bridges based on improved particle swarm optimization. Front. Mater. 10:1276118. doi: 10.3389/fmats.2023.1276118
Received: 11 August 2023; Accepted: 19 September 2023;
Published: 12 October 2023.
Edited by:
Zhongya Zhang, Chongqing Jiaotong University, ChinaReviewed by:
Jianan Qi, Southeast University, ChinaCopyright © 2023 Li, Li, Liu, Liu, Zhu and Ke. This is an open-access article distributed under the terms of the Creative Commons Attribution License (CC BY). The use, distribution or reproduction in other forums is permitted, provided the original author(s) and the copyright owner(s) are credited and that the original publication in this journal is cited, in accordance with accepted academic practice. No use, distribution or reproduction is permitted which does not comply with these terms.
*Correspondence: Yongsi Li, MjExMDM5MTA0NkBzdC5neHUuZWR1LmNu
Disclaimer: All claims expressed in this article are solely those of the authors and do not necessarily represent those of their affiliated organizations, or those of the publisher, the editors and the reviewers. Any product that may be evaluated in this article or claim that may be made by its manufacturer is not guaranteed or endorsed by the publisher.
Research integrity at Frontiers
Learn more about the work of our research integrity team to safeguard the quality of each article we publish.