 Haotian Dong
 Jie Cheng
 Yuhao Feng
95% of researchers rate our articles as excellent or good
Learn more about the work of our research integrity team to safeguard the quality of each article we publish.
Find out more
ORIGINAL RESEARCH article
Front. Mater. , 28 September 2023
Sec. Structural Materials
Volume 10 - 2023 | https://doi.org/10.3389/fmats.2023.1275630
This article is part of the Research Topic Nanoscale Insight into the Hydration Products of Cementitious Materials: From Theory to Engineering View all 5 articles
Mineral admixtures are increasingly being employed in concrete production to replace cement, thus reducing carbon dioxide emissions. However, leaching of silicon can exert a significant influence on the cement hydration process. In this study, density functional theory was used to study the influence of [H2SiO4]2- on the adsorption and dissociation of water on the C3S surface in the initial hydration process. The results demonstrate that [H2SiO4]2- can promote the dissociation of water molecules around it. This is mainly due to the fact that the two non-hydroxylated O atoms of [H2SiO4]2- can adsorb the dissociated H from water molecules, thus preserving more active ionic O sites on the C3S surface, thereby promoting the dissociation of water molecules. The charge transfer and bonding mechanisms of the adsorption of [H2SiO4]2- with its hydration shell were also calculated. This work provides an atomic-level understanding of the influence of the aluminum phase from the mineral admixture on the initial hydration of cement and also offers certain assistance for the widespread application of mineral admixtures.
Cement, as the most widely used material worldwide, has experienced a remarkable surge in production, escalating from 3.3 billion tones in 2010 to 4.1 billion tones in 2022 (Garside, 2023). According to the data provided by the International Energy Agency, the cement industry emitted 2.4 gigatons of CO2 in 2019, corresponding to 7% of the overall global carbon dioxide emissions (IEA, 2019a; IEA, 2019b). Consequently, investigating approaches to mitigate carbon dioxide throughout the entire lifecycle of cement has become of paramount significance. In response to the challenges posed by global climate change, researchers have initiated investigations into the incorporation of cementitious materials as additives to reduce the quantity of cement employed in concrete structures. Among these substituted materials, mineral admixtures, including fly ash, slag, silica fume, limestone powder, steel slag powder, phosphorus slag powder, zeolite powder, copper tailings powder, and red mud, have taken precedence. However, many of these mineral admixtures contain aluminum, and during the cement hydration process, these aluminum-bearing components are inevitably dissolved into the liquid phase. As a result, they can significantly affect the cement hydration process and subsequently influence the microstructure of the hydration products.
In recent years, certain scholars have focused on directing their attention toward comprehending the impact of mineral admixtures on the hydration process of cement through partial substitution. For instance, Keren Zheng and collaborators conducted an examination on how phosphorus slag influences the hydration and performance of Portland cement. It was ascertained that a minute quantity of phosphate undergoes dissolution during the initial stages of hydration, thereby prolonging the dormant period and diminishing the primary exothermic peak (Zheng et al., 2015). Longfei Zhou et al. conducted a study to explore the impact of the alumina tailings content and particle size on the hydration mechanism of cement–tailings composite cementitious materials. Their investigation revealed that as the content of alumina tailings increased, the induction period of the cement–alumina tailings system exhibited a significant extension, concomitant with a decrease in the overall heat generated during the hydration process (Zhou et al., 2021). Some researchers have investigated the impact of mineral admixtures on the formation of C-S-H gel in cement paste when partially replacing cement. Shuhua Liu examined the hydration performance of a composite system comprising Portland cement and copper tailings powder. The study revealed that the residual SiO2 in the copper tailings powder reacted with the C-S-H gel formed in the previous stages, resulting in a C-S-H gel with a lower Ca/Si ratio. However, Liu did not provide an explanation for the mechanism underlying the interaction between SiO2 and the C-S-H gel (Liu et al, 2020). Geng Yao explored the utilization of iron tailings as a cementitious material and observed that the predominant hydration products in the iron tailings–calcium oxide–gypsum system were fibrous calcium aluminate hydrates and amorphous C-S-H gel. As the curing time increased, the Ca/Si atomic ratio of the C-S-H gel gradually decreased (Yao et al., 2020). Yue Liu conducted a study on the influence of adding red mud during the hydration process. Through techniques such as atomic force microscopy, quantitative backscattered electron microscopy, and quantitative X-ray diffraction analysis, it was found that the addition of red mud promoted the formation of aluminum-containing phases in the C-(A)-S-H gel, resulting in increased Al/Ca, Si/Ca and Fe/Ca ratios. Although this study provided some insights into the impact of red mud on the microstructure of the C-(A)-S-H gel, the specific molecular-level effects remain uncertain (Liu et al., 2023).
Despite numerous investigations into the influence of mineral admixtures on the cement hydration process, significant progress in this field remains limited. Previous studies have primarily focused on the changes in hydration heat and properties of the C-S-H gel during hydration, yet a comprehensive understanding of the underlying molecular-level mechanisms driving these changes remains elusive. Notably, the impact of mineral admixtures partially replacing cement on the cement hydration mechanism has received insufficient attention at the molecular level.
In recent years, there has been a growing interest among researchers in computational chemistry. The application of molecular dynamics methods to investigate the mechanisms of cement hydration is of paramount importance. Dongshuai Hou et al. conducted a study utilizing the density functional theory (DFT) approach to investigate the impact of copper doping on the hydration process of dicalcium silicate (C2S). The findings revealed that the inclusion of copper during the production of cement clinker using copper tailings significantly influences the hydration characteristics of C2S (Hou et al., 2022). Yue Zhang utilized the DFT approach to interrogate the adsorption characteristics of isolated water molecules on low-index C3S surfaces. The investigation unveiled the coexistence of molecular adsorption and dissociative adsorption phenomena on the C3S surfaces, with a distinct inclination toward the latter. Remarkably, all ionic oxygen (O) atoms residing on the C3S surfaces exhibited a pronounced propensity for attracting and securing hydrogen (H) atoms released from dissociated water molecules. Conversely, exclusive formation of O-H chemical bonds was observed solely in conjunction with two-coordinated covalent oxygen atoms stationed on the surfaces (Zhang et al., 2019). In this study, the density functional theory (DFT) was employed to investigate the effect of dissolved Si ions derived from mineral admixture on cement hydration. The adsorption behavior of Si ions and water molecules on the C3S (111) surface was calculated. The role of the hydration shell of Si ions in C3S hydration was primarily considered. This study has a certain theoretical significance in exploring the influence of mineral admixtures on cement hydration and the microstructure of C-S-H gel, and can promote the extensive application of mineral admixtures in concrete.
This study employed first-principles calculations using Vienna Ab initio Simulation Package (VASP) computational software (Kresse and Furthmüller, 1996). The exchange-correlation functional utilized the Perdew–Burke-Ernzerhof (PBE) functional (Wu and Cohen, 2005) within the generalized gradient approximation (GGA) framework. The calculations employed a plane wave basis set and self-consistently solved the Kohn–Sham equation through iterative calculations. A pseudopotential (ECP) method was applied for all calculations in this research. Conjugate gradient relaxation was employed to minimize the total energy and interatomic forces of the structures. For unit cell optimization, a 1 × 1×1 k-point sampling scheme was implemented in the Brillouin zone. The energy cutoff for the calculations was set at 500 eV, while the convergence thresholds for energy and forces were set at 1.0 × 10⁻⁵ eV and 0.02 eV/Å, respectively. Visualizations of all the structures and electronic information were drawn by VMD software (Humphrey et al., 1996).
Figure 1 shows the crystal structure of M3-C3S and the C3S (111) surface utilized in this investigation. In this paper, the abbreviation “C3S” is consistently employed to refer to “M3-C3S”. Among the various C3S structures, M3-C3S was selected for its extensive utilization in practical applications (Mumme, 1995), as well as its considerable adoption in prior DFT studies (Durgun et al., 2012; Durgun et al., 2014; Saritas et al., 2015). The optimized unit cells were employed to determine the lattice parameters of C3S, namely, a, b, c, α, β, and γ, which exhibited good agreement with experimental measurements and certain previous DFT calculations (Table 1). In this study, we selected the C3S (111) surface as the adsorption surface, as shown in (C) (D) of Figure 1. The choice of the C3S (111) surface was based on its lowest surface energy (Zhang et al., 2019).
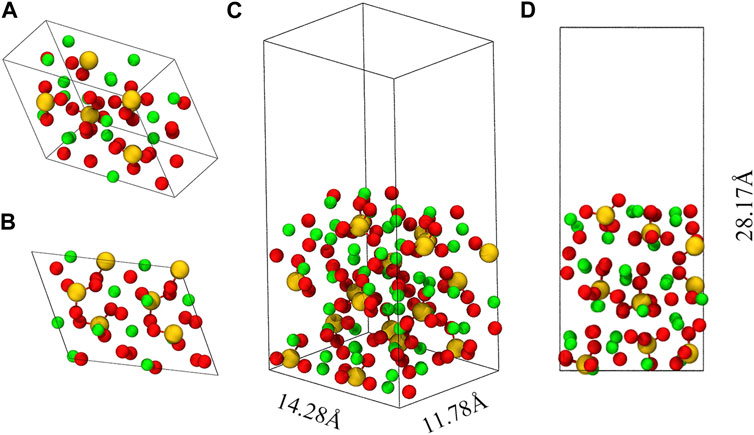
FIGURE 1. Optimized unit cell of M3-C3S and the C3S (111) surface. (A) represents a 45° perspective view of M3-C3S, while (B) provides a side view. (C) represents a 45° perspective view of the C3S (111) surface, while (D) provides a side view. Green represents the Ca atom; yellow represents the Si atom; and red represents the O atom.
TABLE 1. Lattice parameters of M3-C3S.
When cleaving along the (111) direction, we avoid breaking the silicon–oxygen bonds within the Si-O tetrahedra as these bonds typically have high bond energies and are less prone to fracture. The resulting crystal surface will ultimately expose calcium ions, oxygen ions, and intact silicon–oxygen tetrahedra, as shown in (C) (D) of Figure 1. A vacuum layer with a thickness of 15 Å was incorporated along the Z-axis direction of the atomic layer. The introduction of the vacuum layer in the computational simulations was essential to accommodate the adsorbate and prevent any spurious interactions between the periodic structures. The final size of the obtained box is 14.28 Å × 11.78 Å × 28.17 Å.
Sisi Long conducted a comprehensive investigation into the chemical properties of the Si–H2O system and unveiled a significant finding: under highly alkaline conditions with a pH greater than 12, Si ions predominantly exist in the form of [H2SiO4]2- (Long, 2013). Given that the pH values in cement slurries typically range from 7 to 8, the process of cement clinker hydration leads to the generation of alkaline Ca(OH)2, thereby causing the pH to exceed 12. Consequently, this study specifically focused on [H2SiO4]2- as the primary phase in the hydration process.
To ascertain the specific form of [H2SiO4]2−in aqueous solutions, we employed a method wherein water molecules were positioned around [H2SiO4]2-, resulting in the formation of a complex structure: [H2SiO4]2-(H2O)m. Given the generous spatial arrangement surrounding [H2SiO4]2-, the precise quantity of water molecules, labeled as m, capable of participating in the formation of complex structures remained uncertain. To identify the most thermodynamically favorable and structurally stable [H2SiO4]2-(H2O)m arrangement, while maximizing the number of water molecules involved, a systematic approach was adopted. Initially, under the condition of m = 1, the complex structure with the highest binding energy was selected. Subsequently, this structure served as the basis for determining stable complex configurations when m = 2. The increment of m proceeded increasingly until achieving the maximum value.
The formula for calculating the binding energy is as follows:
where Ebin is the binding energy between water molecules and [H2SiO4]2- to form [H2SiO4]2-(H2O) m. Etotal is the energy of [H2SiO4]2- (H2O) m. Esi is the energy of [H2SiO4]2-, and Ewater is the energy of a free water molecule.
The formula for calculating the adsorption energy is as follows:
where Eads is the adsorption energy of [H2SiO4]2-(H2O)m on the C3S (111) surface, Etotal is the total energy after [H2SiO4]2-(H2O)m on the C3S (111) surface, Esi-w is the energy of the [H2SiO4]2-(H2O)m, and Esur is the energy of the C3S (111) surface.
Figure 2 shows the four most stable structures and adsorption energies of [H2SiO4]2- adsorbed on the C3S (111) surface, designated as (A), (B), (C), and (D). Notably, a shared characteristic among these distinct adsorption modes is the alignment of all three O atoms within the adsorbed [H2SiO4]2- structure toward the Ca atoms situated on the C3S (111) surface. Among them, mode (A) demonstrated the highest adsorption energy, suggesting the most stable adsorption mode.
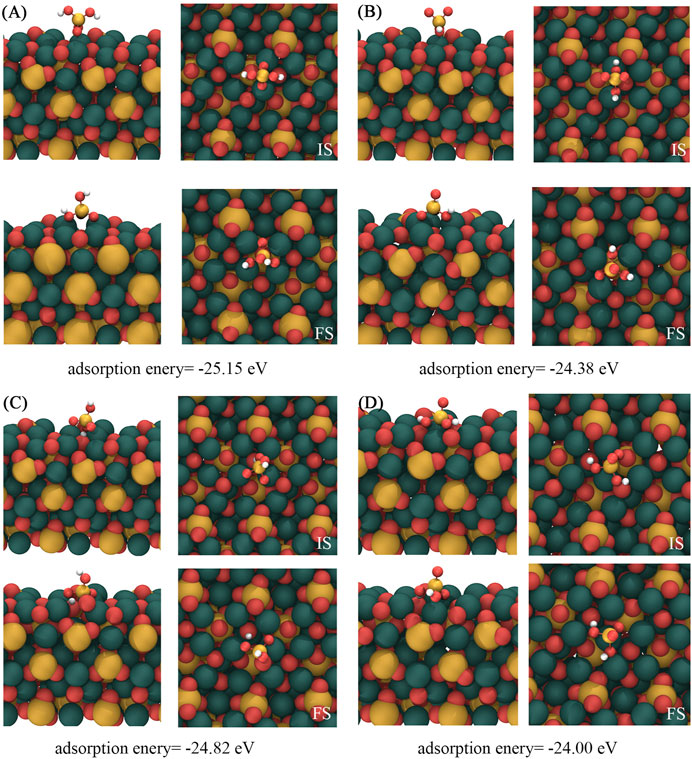
FIGURE 2. Four most stable structures of [H2SiO4]2- adsorbed on the C3S (111) surface. IS represents the initial structure, while FS represents the optimized structure. Red, yellow, white, and dark green spheres represent O, Si, H, and Ca atoms, respectively.
Table 2 shows the alterations observed in the geometric configuration of [H2SiO4]2- on the C3S surface adsorption based on mode A. Throughout the adsorption process, the HO–Si bond length underwent an elongation from 1.633 Å to 1.666 Å, whereas the Si–OH bond length demonstrated an increase from 1.634 Å to 1.751 Å. Concurrently, the O–Si bond length experienced a contraction from 1.648 Å to 1.611 Å, alongside a reduction in the Si–O bond length from 1.648 Å to 1.621 Å. Moreover, the ∠O-Si-O bond angle exhibited an augmentation from 86.608° to 110.420°, while the ∠H-O-Si bond angle displayed a decrease from 116.900° to 114.030° and the ∠Si-O-H bond angle showcased a reduction from 116.416° to 108.915°. Similarly, the ∠HO-Si-OH bond angle underwent a decrease from 103.739° to 99.245°.
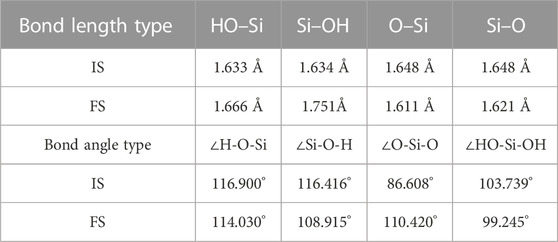
TABLE 2. (A) mode adsorption of [H2SiO4 ]2- bond length and bond angle changes.
Figure 3 visually shows the charge density difference map resulting from the adsorption of [H2SiO4 ]2- in mode (A). The localized changes in charge density serve as a stark manifestation of electron redistribution within the [H2SiO4]2- structure, following adsorption. Notably, Figure 3 highlights a conspicuous charge accumulation between the oxygen (O) atoms orienting toward the C3S (111) surface and the nearest surface calcium (Ca) atoms. This charge accumulation suggests the existence of a chemically bonded interaction between the oxygen and calcium species. Furthermore, the adsorption of [H2SiO4 ]2- on the C3S surface also leads to a redistribution of the electronic structure of Si–O tetrahedra. An electronic dispersion region (orange) can be around around Si atoms, while electronic accumulation regions (green) are found around the bonded O atoms, indicating that during the adsorption process, electrons transfer from the Si atom to the bonded O atoms.
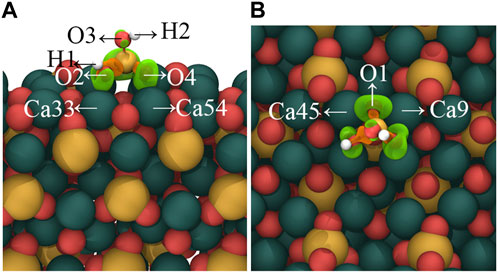
FIGURE 3. Charge density difference map of [H2SiO4]2- adsorbed on the C3S (111) surface in (A) mode. (A) represents the side view, while (B) represents the top view. Orange regions indicate a decrease in charge density, while green regions represent an increase in charge density. Isosurface level: 0.0036 a. u. Red, yellow, white, and dark green spheres represent O, Si, H, and Ca atoms, respectively.
In order to quantitatively study the charge transfer during the adsorption process of [H2SiO4]2- on the C3S surface, Bader charge analysis was conducted, as shown in Table 3. The corresponding atom labels can be found in Figure 3. It can be found that the initial states of O1, O2, O3, O4, H1, and H2 carry respective charges of −0.82 e−, −1.39 e−, −1.40 e−, −0.83 e−, +0.66 e−, and +0.67 e−. Upon adsorption of [H2SiO4]2- onto the C3S (111) surface utilizing mode (A), O1, O2, O3, and O4 witness an augmentation in their negative charges. Specifically, increments of 0.72 e−, 0.05 e−, 0.07 e−, and 0.72 e− are, respectively, observed. Although the positive charge on H1 diminishes by 0.03 e−, the positive charge on H2 remains unaltered, thereby signifying its positional dependency as evidenced in Figure 3. The initial states of Ca9, Ca33, Ca45, and Ca54 carry, respective, charges of +1.51 e−, +1.50 e−, +1.50 e−, and +1.28 e−. Upon adsorption of [H2SiO4]2- onto the C3S (111) surface utilizing mode (A), an increment in the positive charge is observed for Ca9, Ca33, Ca45, and Ca54. Specifically, increments of 0.06 e−, 0.03 e−, 0.06 e−, and 0.28 e− are, respectively, observed.
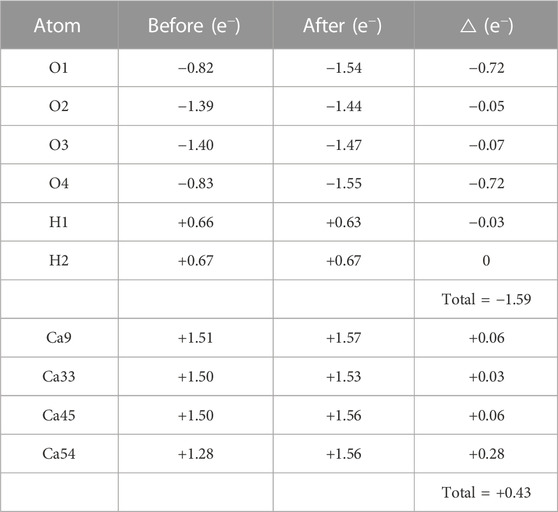
TABLE 3. Bader charge analysis of [H2SiO4]2- adsorbed on the C3S (111) surface in mode (A).
From the aforementioned charge density difference analysis, it can be inferred that the adsorption of [H2SiO4]2- on the C3S surface is mainly attributed to the formation of Ca–O chemical bonds between the O atom in [H2SiO4]2- and the surface Ca atom. Based on the data presented in Table 3, [H2SiO4]2- has gained a charge of −1.59 e−. The collective charge transfer for Ca9, Ca33, Ca45, and Ca54 is determined to be +0.43 e−. This observation strongly indicates that the interaction involving the adsorption of [H2SiO4]2- onto the C3S (111) surface is facilitated through an electron transfer originating from the surface Ca atoms. Importantly, these findings are consistent with the results obtained from the charge density difference analysis.
The most stable configurations of [H2SiO4]2-(H2O)m (m = 1–12) are shown in Figure 4. An independent gradient model based on Hirshfeld partition (IGMH) analysis is employed to illustrate the intermolecular (δginter) and intramolecular (δgintra) interactions (Lu and Chen, 2022). Consequently, IGMH analysis enables the determination of non-covalent interactions between [H2SiO4]2- and water molecules. The IGMH analysis is conducted by Lu and Chen (2012). Through the visual analysis of weak interactions using IGMH analysis, it is evident that two distinct types of weak interactions exist during the adsorption process of [H2SiO4]2- with water molecules: first, hydrogen bonding occurs between water molecules and [H2SiO4]2- ions, and second, hydrogen bonding forms between water molecules themselves. Throughout the entire process of water molecule addition, there is a clear preference for the new water molecules to interact simultaneously with both [H2SiO4]2- and the pre-existing water molecules. This interaction results in the formation of an [H2SiO4]2-(H2O) m+1 structure, incorporating the newly added water molecule. It is noteworthy that this mode of binding yields the highest binding energy, consequently enhancing the stability of the [H2SiO4]2- (H2O) m structure. To demonstrate the aforementioned point, we calculated four different configurations and its binding energy of [H2SiO4]2-(H2O)2. Within varying positions of the water molecule, the IGMH analysis was also performed, as shown in Figure 5. It is observed that the corresponding binding energies are as follows: (A) −0.37 eV, (B) −0.60 eV, (C) −0.24 eV, and (D) −0.19 eV. Based on the energy analysis, it can be concluded that the structure (B), where water molecules simultaneously form hydrogen bonds with both the silicate ion and another water molecule, is the most stable configuration.
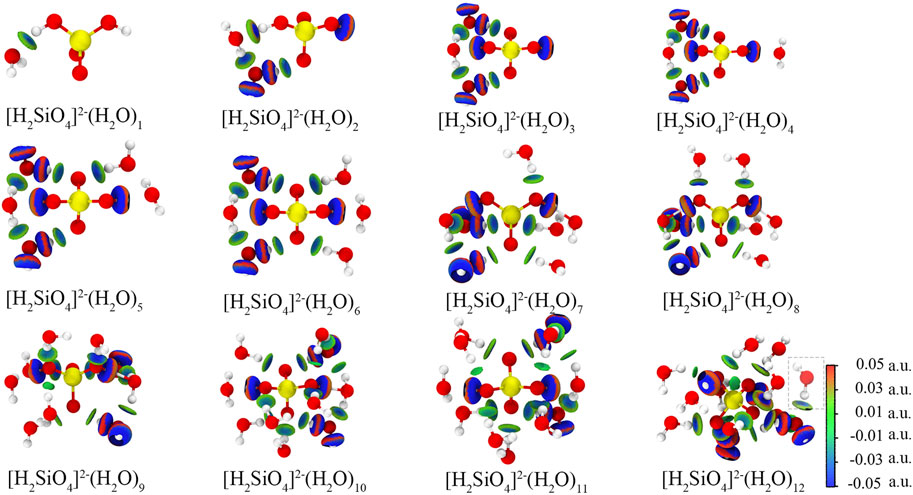
FIGURE 4. Configuration and IGMH analysis results of [H2SiO4]2- (H2O) m configuration. Red, yellow, and white spheres represent O, Si, and H atoms, respectively. Isosurface level: 0.01 a. u.
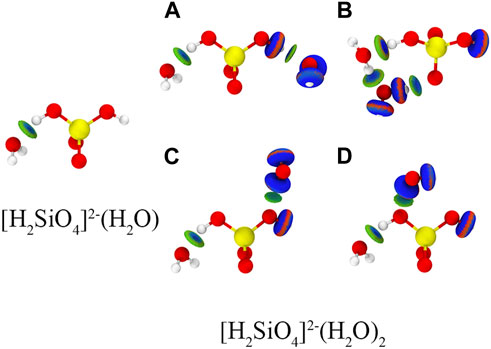
FIGURE 5. Different configuration and binding energy of [H2SiO4]2-(H2O)2. Red, yellow, and white spheres represent O, Si, and H atoms, respectively. Isosurface level: 0.01 a. u.
Furthermore, when m = 12, the new water molecules solely engage in hydrogen bonding with the existing water molecules, without establishing hydrogen bonds with [H2SiO4]2- ions. This observation implies that the 12th water molecule is excluded from the first hydration shell. This observation leads to the inference that [H2SiO4]2-(H2O)11 represents the structurally stable presence of [H2SiO4]2- ions in water. The binding energies of the most stable configurations of [H2SiO4]2-(H2O)m (m = 1–12) are shown in Table 4.
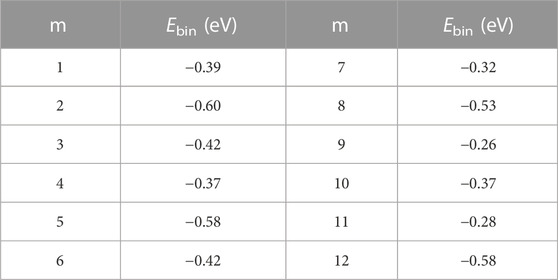
TABLE 4. Binding energies of the most stable configurations of [H2SiO4]2-(H2O)m (m = 1–12).
Although section 3.1 illustrates the adsorption mechanism of isolated [H2SiO4]2- on the C3S surface, in a real hydration process, [H2SiO4]2- adsorbs on the C3S surface in an aqueous environment. Many previous studies have demonstrated that metal ions in the solution tend to first from a hydration shell, thereby influencing the interaction between ions and the solid surface. Taking into account the reasons mentioned previously, this section investigates the adsorption behavior of [H2SiO4]2- with a hydration shell on the C3S surface. According to the calculation results in section 3.2, the monolayer hydration shell of [H2SiO4]2- can accommodate up to 11 water molecules, and its most stable structure has been presented in Figure 4. The four most stable adsorption structures of [H2SiO4]2- (H2O)11 on the C3S surface, along with their adsorption energies, are shown in Figure 6. Table 5 presents a comprehensive overview of the variations observed before and after adsorption in these specific modes.
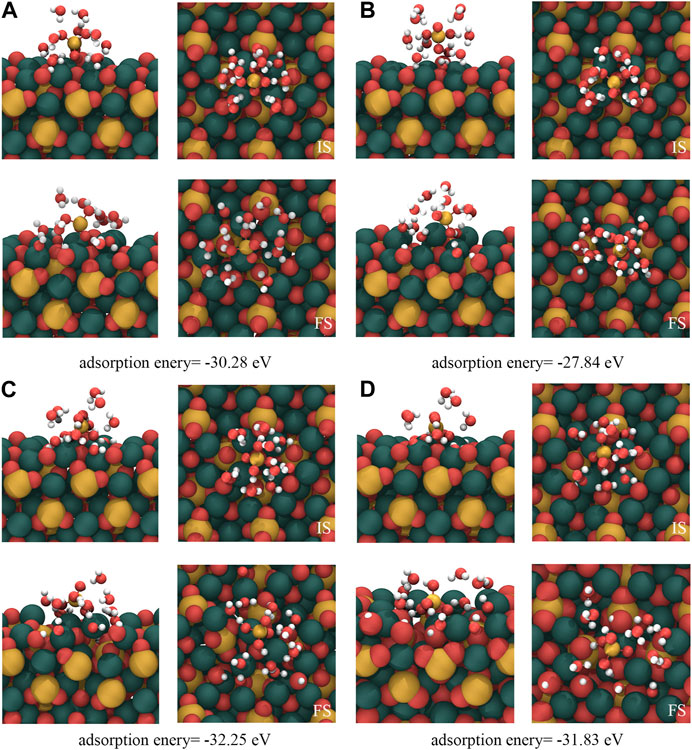
FIGURE 6. Adsorption results of [H2SiO4]2-(H2O)11 on the C3S (111) surface. IS represents the initial structure, while FS represents the computed structure. Red, yellow, white, and dark green spheres represent O, Si, H, and Ca atoms, respectively.
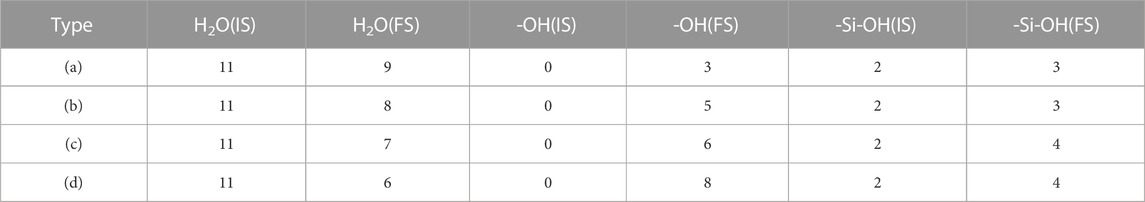
TABLE 5. Adsorption results of [H2SiO4]2- (H2O)11 on the surface of C3S (111).
Within the (A) mode, the dissociation of two water molecules occurs. One oxygen atom originating from the C3S (111) surface reacts with a dissociated hydrogen atom, leading to the formation of a single, independent -OH group. This mode generates a total of three free -OH groups. In mode (B), the adsorption process involves the dissociation of three water molecules. Two oxygen atoms from the C3S (111) surface combine with the dissociated hydrogen atoms, resulting in the formation of two independent -OH groups. Consequently, a total of five free -OH groups are produced. In mode (C), this particular mode entails the dissociation of four water molecules. Among them, three O atoms, including one Si-O tetrahedral O atom located on the surface of C3S (111), establish bonds prior to disassociation with H atoms. Through this mechanism, two independent -OH groups and one -Si–OH group are generated. The net result encompasses the appearance of six independent -OH groups. Within the (D) mode, the dissociation of five water molecules occurs. Four O atoms, notably two surface Si–O tetrahedral O atoms, form connections with H atoms before separation. Consequentially, two independent -OH groups and two -Si-OH groups come into existence. The final outcome encompasses the presence of eight independent -OH groups.
The four adsorption modes of [H2SiO4]2- (H2O)11 show the following common characteristics: (1) During the adsorption process, water molecules in the hydration shell of [H2SiO4]2- dissociate into H+ and OH− ions, while [H2SiO4]2- remains intact and does not dissociate. (2) Throughout the adsorption process, [H2SiO4]2- ions undergo bonding with the dissociated H atoms from the water molecule, thereby giving rise to the formation of [H3SiO4]- ions. (3) The dissociation of water molecules in the hydration shell usually occurs near the ionic O atom on the C3S surface rather than the O atoms within the Si–O tetrahedra, which indicates a high chemical reactivity of ionic O on the C3S surface.
The changes in the geometric structure of [H2SiO4]2-(H2O)11 adsorbed in mode (C) are presented in Tables 6. It can be observed that during the adsorption process, the HO–Si bond length undergoes elongation from 1.653 Å to 1.676 Å, while the Si–OH bond length experiences a contraction from 1.650 Å to 1.645 Å. Additionally, the O–Si bond length extends from 1.644 Å to 1.648 Å, while the Si–O bond length reduces from 1.640 Å to 1.622 Å. These findings indicate that the changes in bond lengths are relatively small.
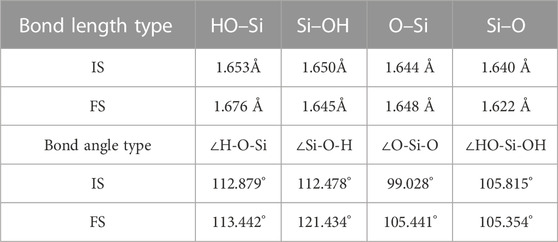
TABLE 6. (C) mode adsorption of [H2SiO4]2-(H2O)11 bond length and bond angle changes.
Moreover, the ∠O-Si-O bond angle increases from 99.028° to 105.441°. The ∠H-O-Si bond angle exhibits a slight increment from 112.879° to 113.442°, whereas the ∠Si-O-H bond angle undergoes a decrease from 112.478° to 121.434°. Additionally, the ∠HO-Si-OH bond angle decreases from 105.815° to 105.354°. Notably, the most substantial variation is observed in the ∠O-Si-O bond angle, which can be attributed to the formation of a hydrogen bond between one oxygen atom and a dissociated hydrogen atom. This hydrogen bonding event consequently induces a perturbation in the orientation of the oxygen atom.
Figure 7 shows the charge density difference of the adsorption outcomes in mode (C). During the adsorption process, distinct charge accumulation regions form between the non-dissociated water molecules and the C3S (111) surface, as indicated by arrows 1, 2, and 3. Furthermore, the dissociated -OH groups exhibit charge accumulation near the C3S (111) surface, demonstrated by arrows 4, 7, 6, and 8. Interestingly, charge accumulation is also observed between two O atoms in [H3SiO4]- and Ca atoms on the C3S (111) surface, marked by arrows 9 and 10. Additionally, the bonding of dissociated H atoms with O atoms on the C3S (111) surface leads to a charge transfer in the vicinity of these O atoms, as denoted by arrows 5, 11, and 12.
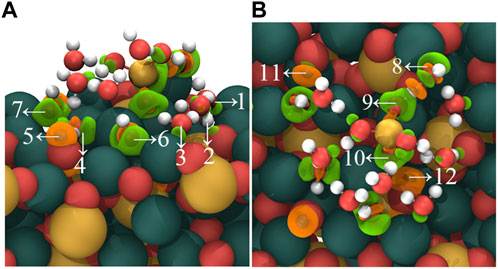
FIGURE 7. Charge density difference map of [H2SiO4]2- (H2O)11 adsorbed on the C3S (111) surface in C mode. (A) represents the side view, while (B) represents the top view. Orange regions indicate a decrease in charge density, while green regions indicate an increase in charge density. Isosurface level: 0.0069 a. u. Red, yellow, white, and dark green spheres represent O, Si, H, and Ca atoms, respectively.
In conclusion, the adsorption of [H2SiO4]2-(H2O)11 onto the C3S (111) surface leads to the establishment of chemical bonds between undissociated water molecules, dissociated -OH groups, dissociated H atoms, and [H3SiO4]- species with the C3S (111) surface.
In order to evaluate the influence of [H2SiO4]2- on the water molecules in the hydration shell, we substituted [H2SiO4]2- with a water molecule and calculated the adsorption configuration on the C3S surface, as well as the bonding mechanism. Based on the most stable configuration of the adsorption of [H2SiO4]2- (H2O)11 on the C3S surface in section 3.3, a substitution was made by replacing [H2SiO4]2- with a water molecule. The initial and stable structures before and after substitution are shown in Figure 8, and the changes in the quantities of OH and Si–OH during the adsorption process are listed in Table 7.
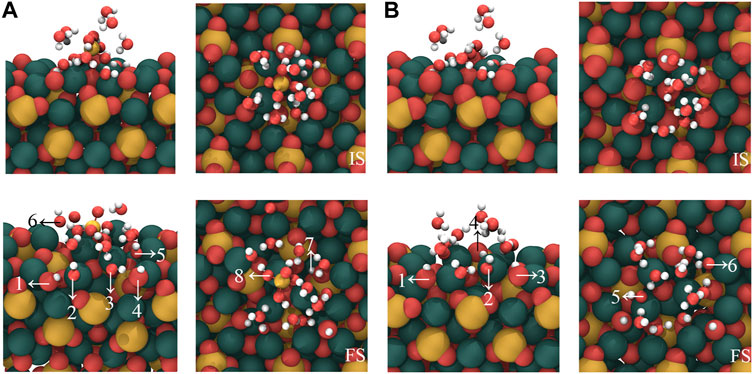
FIGURE 8. Comparison of the adsorption of [H2SiO4]2- ions on the C3S (111) surface by H2O substituting [H2SiO4]2-(H2O)11 structure. Here, (B) represents the substitution of [H2SiO4]2- by one H2O molecule. Red, yellow, white, and dark green spheres represent O, Si, H, and Ca atoms, respectively.

TABLE 7. Comparison of the adsorption results for (A) and (B).
When the cluster entirely consisting of water molecules is adsorbed on the C3S surface, as shown in Figure 8B, three water molecules undergo dissociation. The dissociated H atoms bind with the surface O, resulting in the formation of six OH groups, as indicated by arrows 1–6 in Figure 8B. The dissociated OH groups, on the other hand, adsorb onto the surface Ca atoms, and the resulting Ca–O bond lengths are 2.315 Å, 2.459 Å, and 2.436 Å, respectively, as indicated by arrows 1, 2, and 3 in Figure 8B. As a comparison, in the absence of water molecule substitution, the [H2SiO4]2- (H2O)11 cluster adsorbed on the C3S surface exhibits the dissociation of four water molecules, which is greater than the dissociation count observed during the adsorption of the pure water molecule cluster. Therefore, the presence of [H2SiO4]2- promotes the dissociation of water molecules during the initial hydration stage. Observing the stable adsorption structure, it can be found that not all dissociated H atoms are adsorbed on the surface of O atoms. Instead, two H atoms are adsorbed on the O atom of Si–O, forming two additional Si–OH groups, as indicated by arrows 7 and 8 in Figure 8A. This chemical interaction between O atoms of [H2SiO4]2- and H atoms of water might be a crucial reason in promoting water dissociation.
The Crystal Orbital Hamilton Population (COHP) analysis (Dronskowski and Bloechl, 1993) was conducted to investigate the interactions between Si–water and water–water. The observed positive and negative COHP values correspond to contributions from antibonding and bonding orbital interactions, respectively. As illustrated in Figure 9, the antibonding interaction of Si–water is much stronger than that of water–water, suggesting that Si shows a weaker constrain to its adjacent water molecule in the adsorption process. This weaker constraint may promote the dissociation of water molecules surrounding Si. It can also be found that the absolute value of the integrated COHP of O–H bond in the Si cluster is smaller than that of O–H bond in the pure water cluster, which also confirms that Si exerts weaker constraints on the surrounding water compared to the constraints experienced by water molecules in the water cluster.
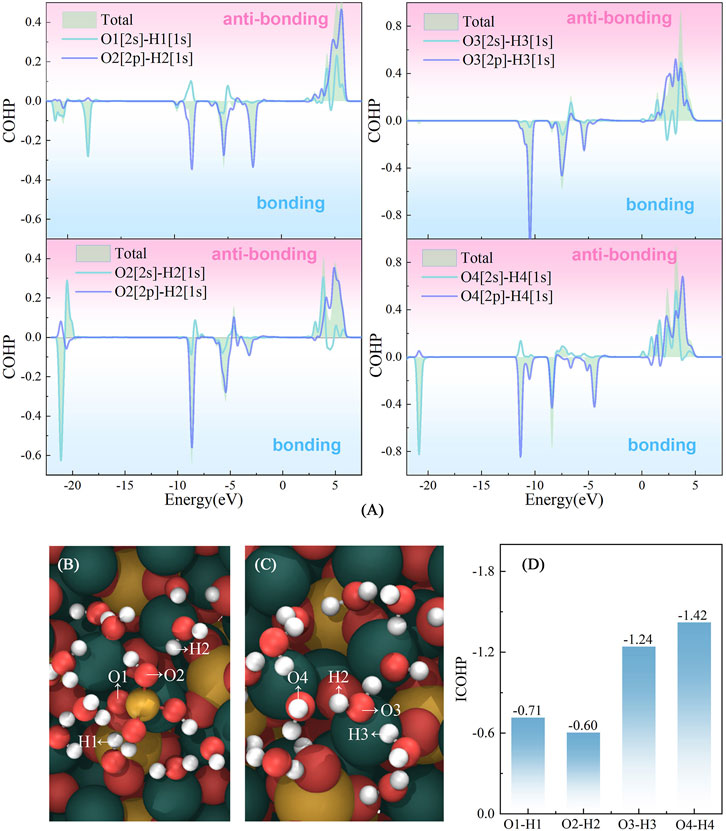
FIGURE 9. Interactions between [H2SiO4]2–water and water–water. (A) Crystal Orbital Hamilton Population of O2s-H1s and O2p-H1s in the [H2SiO4]2-(H2O)11 and pure water clusters; (B) and (C) represent the atomic label applied in (A) and (D). (D) represents integrated COHP below the Fermi level of O-H bonds.
The presence of [H2SiO4]2- ions suggests their significant contribution to the facilitation of water molecule dissociation on the C3S (111) surface, ultimately expediting the hydration process of cement. These observations are consistent with prior investigations into the effects of mineral admixtures on cement hydration (He and Hu, 2018; Siler et al., 2012).
The effects of [H2SiO4]2- on the initial hydration of C3S were investigated by a DFT study at the atomic level. The calculation results show that [H2SiO4]2- can form a hydration shell around the surrounding 11 water molecules through weak interactions. In the adsorption process of [H2SiO4]2-(H2O)11, the dissociation of water within the hydration shell typically takes place in proximity to the ionic O atoms on the C3S surface, as opposed to the O atoms in [H2SiO4]2-. Compared to the cluster of pure water adsorbed on the C3S surface, when [H2SiO4]2-(H2O)11 is adsorbed on the C3S surface, [H2SiO4]2−can promote the dissociation of water molecules. This is mainly due to the adsorption of dissociated H from water on the O atom of [H2SiO4]2-, leading to more active ionic O atoms on the C3S surface. The COHP analysis indicates that compared to pure water, the water molecules around [H2SiO4]2- experience weaker constraints, thereby rendering these water molecules more susceptible to engaging in chemical reactions on the C3S surface. This study offers novel insights into the atomic-level influence of silicon on cement hydration, thus contributing to a deeper understanding of the subject. Additionally, the findings hold significant implications for the widespread utilization of mineral admixtures within the concrete industry.
The original contributions presented in the study are included in the article/Supplementary Material. Further inquiries can be directed to the corresponding author.
HD: conceptualization, visualization, and writing–original draft. JC: visualization and writing–original draft. YF: writing–review and editing. HL: writing–original draft.
The author(s) declare the financial support was received for the research, authorship, and of this article. Financial support from the National key Research and Development project (2022YFE0133800), the National Natural Science Foundation of China (U2006224, 52178221, 51978352, and 52008221), the Natural Science Foundation of Shandong Province (ZR2020JQ25, ZR2022YQ55, 2019KJG010, and ZR2020QE251), and the Taishan Scholars of Shandong Province under Grant tsqn.201812090 are gratefully acknowledged.
Additionally, the authors would like to thank the Innovative New Building Material in Marine Environment Team of Qingdao University of Technology for their valuable input and encouragement that have shaped the trajectory of this research.
The authors declare that the research was conducted in the absence of any commercial or financial relationships that could be construed as a potential conflict of interest.
All claims expressed in this article are solely those of the authors and do not necessarily represent those of their affiliated organizations, or those of the publisher, the editors, and the reviewers. Any product that may be evaluated in this article, or claim that may be made by its manufacturer, is not guaranteed or endorsed by the publisher.
Dronskowski, R., and Bloechl, P. E. (1993). Crystal orbital Hamilton populations (COHP): energy-resolved visualization of chemical bonding in solids based on density-functional calculations. J. Phys. Chem. 97 (33), 8617–8624. doi:10.1021/j100135a014
Durgun, E., Manzano, H., Kumar, P. V., and Grossman, J. C. (2014). The characterization, stability, and reactivity of synthetic calcium silicate surfaces from first principles. J. Phys. Chem. C 118 (28), 15214–15219. doi:10.1021/jp408325f
Durgun, E., Manzano, H., and Pellenq, R. J. M. (2012). Understanding and controlling the reactivity of the calcium silicate phases from first principles. Chem. Mater. 24 (7), 1262–1267. doi:10.1021/cm203127m
Garside, M. (2023). Cement production global 2022. Available at: https://www.statista.com/statistics/1087115/global-cement-production-volume/ (Accessed August 25, 2023).
He, Z., and Hu, L. L. (2018). Hydration mechanism of cement-based materials with different Si-rich mineral admixtures. J. Wuhan Univ. Technol. Sci. 33 (3), 654–660. doi:10.1007/s11595-018-1874-0
Hou, D. S., Ding, Z. H., Wang, P., Wang, M. H., Xu, Q. Q., Wang, X. P., et al. (2022). Influence of cu doping on the hydration of dicalcium silicate: A first-principles study. ACS Sustain. Chem. Eng. 10 (24), 8094–8104. doi:10.1021/acssuschemeng.2c02442
Humphrey, W., Dalke, A., and Schulten, K. (1996). Vmd: visual molecular dynamics. J. Mol. Graph. 14 (1), 33–38. doi:10.1016/0263-7855(96)00018-5
IEA (2019b). Direct CO2 emissions from selected heavy industry sectors. https://www.iea.org/data-and-statistics/charts/direct-co2-emissions-from-selected-heavy-industry-sectors-2019, IEA. Licence: CC BY 4.0.
IEA (2019a). Energy related CO2 emissions, 1990-2019. https://www.iea.org/data-and-statistics/charts/energy-related-co2-emissions-1990-2019, IEA. Licence: CC BY 4.0.
Kresse, G. G., and Furthmüller, J. J. (1996). Efficient iterative schemes for ab initio total-energy calculations using a plane-wave basis set. Phys. Rev. B, Condens. matter 54, 11169–11186. doi:10.1103/PhysRevB.54.11169
Liu, Y., Zhuge, Y., Chen, X., Duan, W. W., Fan, R., Outhred, L., et al. (2023). Micro-chemomechanical properties of red mud binder and its effect on concrete. Compos. Part B Eng. 258, 110688. doi:10.1016/j.compositesb.2023.110688
Liu, S. H., Wang, L., Li, Q. L., and Song, J. W. (2020). Hydration properties of portland cement-copper tailing powder composite binder. Constr. Build. Mater. 251, 118882. doi:10.1016/j.conbuildmat.2020.118882
Long, S. S. (2013). Theoretical and technological research on comprehensive utilization of vanadium and silicon resources in shale coal (Doctoral dissertation). Cent. South Univ. doi:10.7666/d.Y2688494
Lu, T., and Chen, F. (2012). Multiwfn: A multifunctional wavefunction analyzer. J. Comput. Chem. Org. Inorg. Phys. Biol. 33 (5), 580–592. doi:10.1002/jcc.22885
Lu, T., and Chen, Q. (2022). Independent gradient model based on hirshfeld partition: A new method for visual study of interactions in chemical systems. J. Comput. Chem. 43 (8), 539–555. doi:10.1002/jcc.26812
Mumme, W. G. (1995). Crystal structure of tricalcium silicate from a Portland cement clinker and its application to quantitative XRD analysis. N. Jb. Min. Mh. 4, 145–160.
Saritas, K., Ataca, C., and Grossman, J. C. (2015). Predicting electronic structure in tricalcium silicate phases with impurities using first-principles. J. Phys. Chem. C 119 (9), 5074–5079. doi:10.1021/jp510597e
Siler, P., Kratky, J., and Belie, N. D. (2012). Isothermal and solution calorimetry to assess the effect of superplasticizers and mineral admixtures on cement hydration. J. Therm. Analysis Calorim. 107 (1), 313–320. doi:10.1007/s10973-011-1479-8
Wu, Z. G., and Cohen, R. E. (2005). More accurate generalized gradient approximation for solids. Phys. Rev. B 73 (23), 235116. doi:10.1103/PhysRevB.73.235116
Yao, G., Wang, Q., Wang, Z. M., Wang, J. X., and Lyu, X. J. (2020). Activation of hydration properties of iron ore tailings and their application as supplementary cementitious materials in cement. Powder Technol. 360, 863–871. doi:10.1016/j.powtec.2019.11.002
Zhang, Y., Lu, X. Y., Song, D. S., and Liu, S. B. (2019). The adsorption of a single water molecule on low-index C3S surfaces: A DFT approach. Appl. Surf. Sci. 471, 658–663. doi:10.1016/j.apsusc.2018.12.063
Zheng, K. R., Zhou, J., and Gbozee, M. (2015). Influences of phosphate tailings on hydration and properties of portland cement. Constr. Build. Mater. 98, 593–601. doi:10.1016/j.conbuildmat.2015.08.115
Keywords: hydration, tricalcium, [H2SiO4]2, adsorption, DFT
Citation: Dong H, Cheng J, Feng Y and Liu H (2023) The influence of [H2SiO4]2- from mineral admixtures on the hydration process of tricalcium silicate: a DFT study. Front. Mater. 10:1275630. doi: 10.3389/fmats.2023.1275630
Received: 10 August 2023; Accepted: 30 August 2023;
Published: 28 September 2023.
Edited by:
Xiao Wang, China University of Petroleum, ChinaReviewed by:
Wei He, Beijing University of Civil Engineering and Architecture, ChinaCopyright © 2023 Dong, Cheng, Feng and Liu. This is an open-access article distributed under the terms of the Creative Commons Attribution License (CC BY). The use, distribution or reproduction in other forums is permitted, provided the original author(s) and the copyright owner(s) are credited and that the original publication in this journal is cited, in accordance with accepted academic practice. No use, distribution or reproduction is permitted which does not comply with these terms.
*Correspondence: Haotian Dong, ZGh0MTM5NjMzODg3NjBAMTYzLmNvbQ==
Disclaimer: All claims expressed in this article are solely those of the authors and do not necessarily represent those of their affiliated organizations, or those of the publisher, the editors and the reviewers. Any product that may be evaluated in this article or claim that may be made by its manufacturer is not guaranteed or endorsed by the publisher.
Research integrity at Frontiers
Learn more about the work of our research integrity team to safeguard the quality of each article we publish.