 Han Yao1
 Fengkai Han
94% of researchers rate our articles as excellent or good
Learn more about the work of our research integrity team to safeguard the quality of each article we publish.
Find out more
ORIGINAL RESEARCH article
Front. Mater. , 15 September 2023
Sec. Structural Materials
Volume 10 - 2023 | https://doi.org/10.3389/fmats.2023.1273796
This article is part of the Research Topic Advanced Materials and Techniques for Structural Monitoring, Analysis and Control View all 16 articles
Introduction: The study focuses on evaluating the reliability of prefabricated perimeter walls in substations during flood events. It employs a sophisticated numerical model based on actual engineering data to assess their load-bearing capabilities. The research investigates the impact of crucial flood parameters on the structural behavior of these walls, examines the force transmission mechanisms, and suggests “W-shaped” reinforcement techniques to mitigate stress-related issues.
Methods: To meet our research goals, we developed an extensive numerical model for prefabricated perimeter walls, incorporating real-world engineering data. This model enabled us to analyze critical flood parameters, such as flood depth, flow velocity, and flood erosion. Furthermore, we investigated the force transmission mechanisms within the walls and introduced “W-shaped” reinforcement strategies to improve their load-bearing capacity.
Results: Our results indicate that flood depth and flow velocity have a substantial impact on the performance of prefabricated perimeter walls, while flood erosion has a minor effect. Safety concerns become prominent when flood depth exceeds 1.0 m or flow velocity surpasses 3 m per second. Analysis of force transmission mechanisms reveals greater displacements at higher water levels. Critical areas, including wall panel-column and wall panel-foundation connections, experience heightened stress levels.
Discussion: Our study highlights the significant role of flood depth and flow velocity in evaluating the load-bearing capacity of prefabricated perimeter walls in substation environments. To address potential structural weaknesses, we recommend implementing “W-shaped” wall reinforcement methods, which efficiently decrease both displacement and stress. These findings carry implications for substation design and flood resilience, underscoring the importance of comprehensive flood risk management strategies to protect internal facilities during floods.
As a vital component of the power grid, substations play a crucial role in the transmission and distribution of electricity, making their safe and stable operation essential for national economic development (Li et al., 2011). Substations are typically constructed in areas with convenient transportation and flat terrain, and perimeter walls are installed around the sites. These walls act as the first line of defense to ensure the safe and stable operation of internal facilities in substations during flood disasters. In recent years, there has been a frequent occurrence of regional natural disasters. In the first half of 2022 alone, there were 18 instances of regional heavy rainfall across the country, posing significant threats to the safe and stable operation of substations. For instance, the unprecedented heavy rainfall in Zhengzhou, China on July 20 (Zhang et al., 2022; Yin et al., 2023), caused flooding that breached the perimeter walls of multiple substations, resulting in severe damage to internal facilities and substantial economic losses. Therefore, reinforcing the perimeter walls of substations to enhance their load-bearing capacity is crucial to ensuring their safe and stable operation during flood disasters.
Several scholars have conducted a series of studies on the flood-resistant and load-bearing performance of walls using experimental methods. Guangwu et al. (2022) based on field investigation data of the Damaugou flash flood event and corresponding simulations using FLO-2D, analyzed the causes of the disaster and validated failure criteria. Zha et al. (2022) conducted destructive compression tests on floodwall columns, deriving stress-strain models to provide design references for the optimization of movable floodwalls. Wu et al. (2017) conducted experimental research and on-site monitoring of urban floodwalls, revealing that the overall stability and sealing performance of the lightweight aluminum alloy column floodwall structure were excellent. Jansen et al. (2020) assessed the impact of floods on modern Dutch residential buildings through laboratory testing and structural modeling. They developed physically based vulnerability curves and explained the methods for assessing the physical collapse of residential buildings. Medero et al. (2010) established a scaled model of Earth Walls to investigate the impact of flood cycles on wall structures. Their research demonstrated that adding fibers to Earth Walls can enhance their flood resistance. Zhou and Chen (2011) studied the load-bearing performance of movable floodwalls, providing theoretical calculation methods for stress and strain in floodwalls. They obtained experimental data on movable floodwalls, confirming the reliability of the theoretical calculations.
Scholars have also achieved numerous results using numerical simulations. Zhang et al. (2018) conducted force analysis on bend water flow patterns and investigated the stress characteristics of bend floodwalls under flood conditions. They derived a formula for calculating the stability coefficient of bend river floodwalls, providing theoretical references for the design and research of similar riverbank floodwalls. Keawsawasvong and Ukritchon (2017) established a numerical model for cantilever floodwalls in cohesive soils, analyzing the mechanical properties of the walls in both homogeneous and non-homogeneous clay layers. They clarified the influence of wall embedment depth on flood resistance. Gallien (2012) (Wang et al., 2004; Bokhove et al., 2019) conducted flood simulations and analyzed hydrological risks, providing effective analysis and decision-making support for flood control planning.
In conclusion, it can be observed that scholars have primarily focused on the research of flood-resistant walls, such as urban movable floodwalls (Miguel et al., 2021; Giacomo and Izzo, 2022) and masonry buildings (Heliová, 2023; Khadka et al., 2023) in rural areas. However, there is a lack of research on the stress characteristics, force transmission mechanism, and flood resistance performance of prefabricated perimeter walls in substations. As the proportion of prefabricated concrete walls in substation perimeters increases, conducting research on the flood resistance performance of prefabricated walls becomes crucial for ensuring the safe and stable operation of substations during flood disasters.
This study is grounded in a real substation project. It begins by creating a finite element model for prefabricated substation walls in the second section. The following sections delve into examining how floodwater depth, flow velocity, and erosion depth affect the structural performance and load-bearing capacity of these walls. Lastly, the fifth section introduces and validates an innovative “W”-shaped reinforcement device.
This study is conducted based on the substation wall project at the 500 kV Xinyang substation in Henan, China, with a focus on analyzing the structural characteristics of the substation wall. Visual representations of the site are provided in Figure 1. Xinyang is situated in the transitional zone between the southwestern hills and the eastern plains, with a distinct boundary between the mountainous, hilly, and plain regions. Elevations in the mountainous areas generally exceed 400 m, while the hilly regions range from 150 to 400 m, and the plain areas are below 110 m in elevation. The substation is located in the plain area, characterized by level terrain. The foundation soil layer is a single layer of compacted heterogeneous fill soil with a thickness of approximately 2.5 m, and the wall’s foundation is positioned within this soil layer. The Xinyang region experiences frequent shifts between cold and warm air masses, with significant interannual variations in precipitation, especially during concentrated summer rainfall events. Currently, urban drainage systems in the area generally have low standards, leading to inadequate underground drainage during heavy rainfall. The site is located in a local depression, and due to surrounding road construction, eastward drainage is hindered. Analysis indicates that the maximum flood depth at the site during a 50-year return period is 0.3 m, with a risk of flooding during rare disasters like the July 20th extreme rainfall event in Zhengzhou, as illustrated by the measured rainfall data in Figure 2.
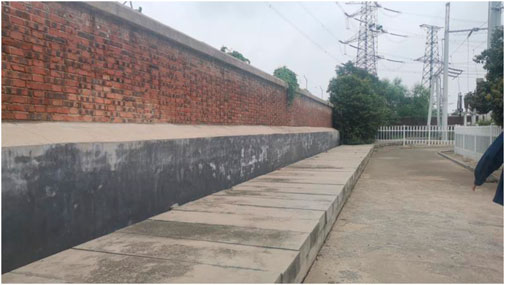
Figure 1. Pictures of the site.
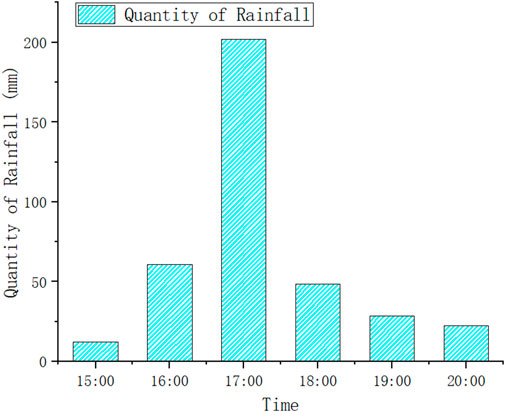
Figure 2. Real-time rainfall.
The prefabricated concrete structure of the walls is shown in Figure 3. The prefabricated perimeter wall consists of five components: foundation, columns, wall panels, column caps, and wall panel compression tops. The foundation is buried underground, and it is connected to the wall panels and columns in the upper part. The total height of the wall is 2.3 m, composed of five vertically assembled prefabricated wall panels. The dimensions of the prefabricated wall panels are 2,840 mm × 60 mm × 450 mm (length × width × height), and the wall top aligns with the columns. The standard column dimensions are 300 mm × 300 mm × 2,250 mm, with a center-to-center distance between adjacent columns of 3.0 m. Both the wall and columns are constructed using C30 concrete and reinforced with steel bars. The foundation dimensions for the lower part of the wall are 0.25 m wide, 2.40 m long, and 1.20 m high. For the lower part of the columns, the foundation dimensions are 0.55 m wide, 0.60 m long, and 1.20 m high. The dimensions of the column caps are 370 mm × 370 mm × 70 mm, while the wall panel compression tops measure 2,620 mm × 240 mm × 60 mm. Both the column caps and wall panel compression tops are constructed using C30 concrete. A telescopic joint is installed every 30 m along the perimeter wall, with a column placed on each side of the telescopic joint.
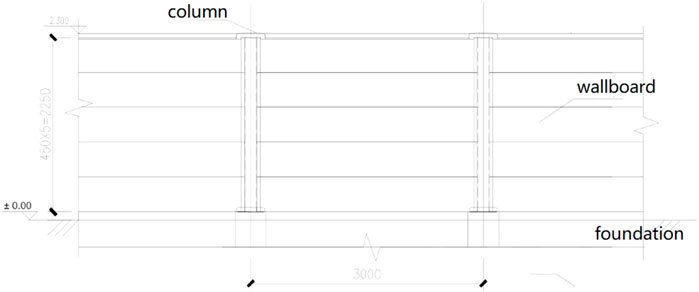
Figure 3. Overall layout of the wall.
A refined finite element model of a 10-span prefabricated perimeter wall is established, with each modeling unit between two telescopic joints, as shown in Figure 4. The foundation, structural columns, and wall panels are modeled using solid elements to accurately simulate their mechanical behavior. The steel bars are represented using three-dimensional truss elements, capable of transmitting axial forces but not bending moments. This study employs a damage plasticity model to simulate the mechanical behavior of concrete and an ideal elastoplastic model for plastic materials like steel bars to describe their behavior after reaching the yield stress and entering a fully plastic state.
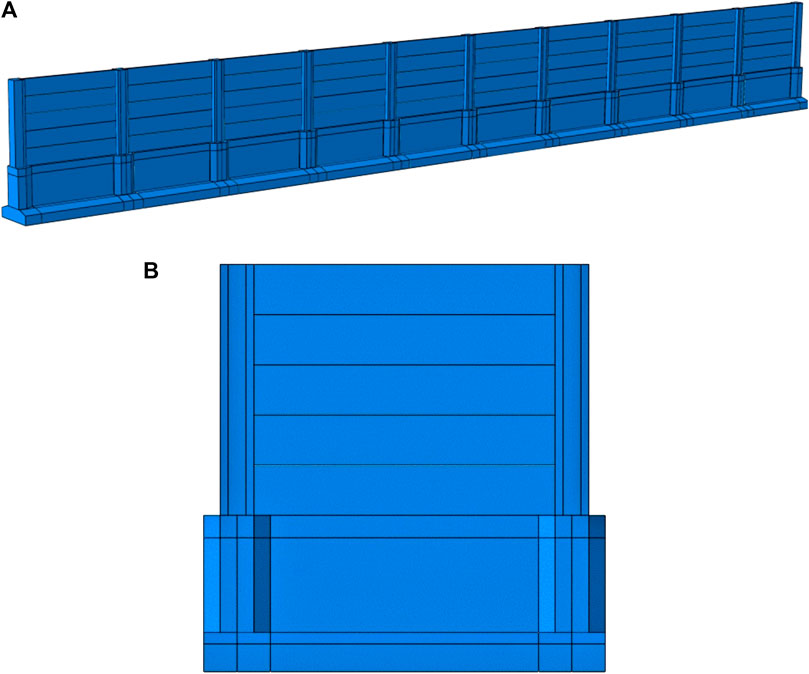
Figure 4. (A) Finite element model of the prefabricated wall. (B) Single-span fence.
Based on the actual engineering, rigid connections are established between the columns and the foundation, columns and wall panels, and wall panels and the foundation in the finite element model, using the “Tie” command to simulate rigid behavior. There is no connection between the wall panels; instead, face-to-face contact is defined to model their normal and tangential interactions. After arranging the steel reinforcement according to the requirements, the “embedded region” command is used to embed the steel bars into the concrete components, allowing them to deform together when subjected to external forces. Given the primary focus of this study on analyzing the impact of flood loads on the upper structure of the wall, a simplification approach was employed. In this approach, the ground is treated as a rigid body, and rigid connections were established between the foundation and the subgrade, thus disregarding the influence of soil-structure interaction. The preliminary analysis suggests that the connection areas between the wall and columns, as well as the center of the wall panels, are complex regions of stress under flood loads. Therefore, the mesh size for the wall-column connection is controlled within 30 mm, and the foundation mesh size is controlled within 60 mm to ensure computational accuracy while reducing computational complexity.
The location of the project is in a relatively shallow inundation area with minimal interaction between water flow and waves. Therefore, the coupling load of waves is neglected, and only dynamic water load and wave load are considered, along with the effect of static water pressure.
The formula for calculating static water pressure is shown in Eq. 1.
Where
In this practical project, the calculation of
Where
Due to the reflection effect of the vertical wall, the limiting wave height in front of the vertical wall is different from that on the beach. In this regard, Danel’s experimental results on the limit stationary waves can be used to predict the limiting incident wave height Hlim. The calculation of Hlim is given in Eq. 3.
The distribution of the maximum wave pressure intensity above the still water level forms a triangular shape, with
The dynamic water load (Qiu et al., 1996; GB 50286-2013, 2013; Li et al., 2001) is the primary load acting on the perimeter wall surface, and its calculation formula is given in Eq. 4.
Where
Where
Based on the monitoring data of the 500 kV substation wall project in Xinyang, Henan, China, the flood flow velocity was recorded as 2 m/s, and the flood water depth was 1 m. This section analyzes the stress characteristics of the wall using the finite element model and load calculations, and provides the stress and displacement variations of the perimeter wall under typical parameters.
Flood depth is a significant factor influencing the magnitude of flood load. In this section, while keeping the substation perimeter wall subjected to a flood load with a velocity of 2 m/s, an analysis was conducted to assess the maximum stress and displacement of the wall under different water depths. The study aims to determine the impact of water depth on the stress and displacement characteristics of prefabricated perimeter walls.
To quantitatively assess the influence of floodwater depth on the stress performance of prefabricated perimeter walls, displacement monitoring points 1–5 were strategically placed at critical response locations, and stress monitoring points 6–10 were positioned at locations with complex stress patterns. The changes in displacement and stress responses with increasing floodwater depth are illustrated in Figure 3. From Figure 5A, it can be observed that displacement at monitoring points 1 and 2 remains relatively small, below 0.02 m, when the flood depth is less than 1.0 m. However, as the flood depth exceeds 1.0 m, the wall displacement increases significantly, leading to abrupt and irreversible failure. Monitoring points 3, 4, and 5 exhibit similar displacement behavior to points 1 and 2 when the flood depth is less than 1.0 m. Nevertheless, as the flood depth exceeds 1.0 m, the displacement increment becomes smaller, resulting in a notable difference compared to points 1 and 2.
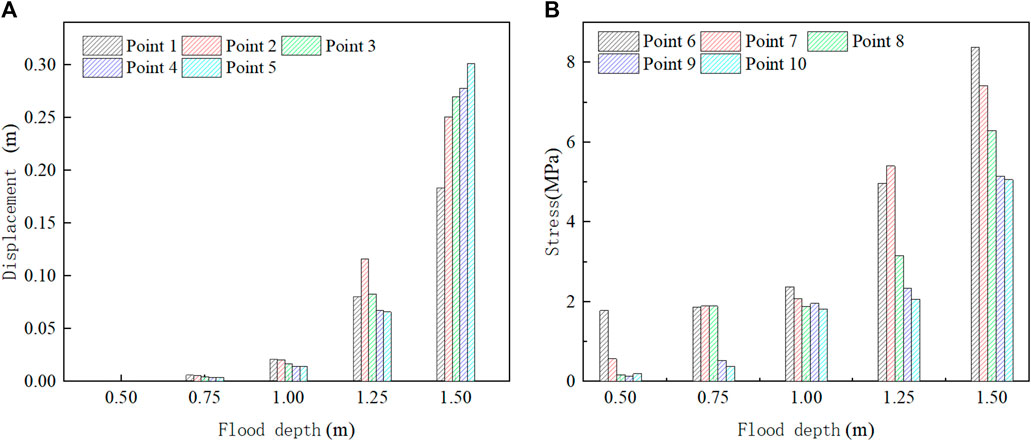
Figure 5. (A) Displacement variation with flood depth. (B) Variation of stress with flood depth.
From Figure 5B, it can be observed that, similar to the displacement pattern, the stress at monitoring points 6 and 7 remains relatively small when the flood depth is less than 1.0 m. However, as the flood depth exceeds 1.0 m, the wall stress increases significantly. Monitoring points 8, 9, and 10 exhibit a continuous increase in stress with the increase of flood depth. Nevertheless, due to the minimal force transmission between wall panels, the stress at the upper monitoring points remains smaller than the stress at the lower monitoring points as the floodwater load primarily acts on individual wall panels.
This section explores the effect of floodwater flow velocity on the load-bearing performance of the substation perimeter wall, using a refined finite element model with a flood depth of 1.0 m. The study addresses the increasing impact and inertial forces associated with higher floodwater flow velocities, which can potentially compromise the safety of the building structure.
Figure 6A shows the displacement curves for monitoring points 1–5 at flow velocities ranging from 1 m/s to 5 m/s. It can be observed that at flood flow velocities below 2 m/s, monitoring points 1 and 2 exhibit minimal displacements (less than 0.03 m) due to the limited inertia and impact forces of the water, resulting in minor wall deformation. However, when the flood flow velocity exceeds 2 m/s, the inertia and impact forces rapidly increase, leading to significant deformations at monitoring points 1 and 2. As for monitoring points 3, 4, and 5 located above the still water level and not directly influenced by floodwater load, their deformations are relatively unaffected by changes in flood flow velocity. Thus, at lower flow velocities, their deformations remain similar to those observed at monitoring points 1 and 2, while at flow velocities exceeding 2 m/s, the deformations show a smaller increase.
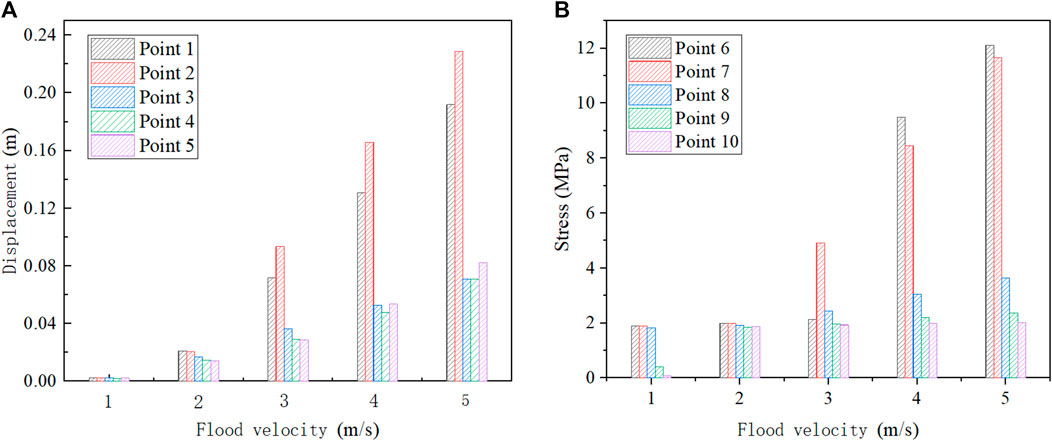
Figure 6. (A) Displacement variation with flood velocity. (B) Variation of stress with flood velocity.
As shown in Figure 6B, the stress-strain curves for monitoring points at flow velocities ranging from 1 m/s to 5 m/s are depicted. Monitoring points 6 and 7 are located on wall panels directly subjected to floodwater loads. At flow velocities below 2 m/s, the stress values at these points remain relatively stable. However, when the flow velocity exceeds 2 m/s, the stress at monitoring points 6 and 7 noticeably increases. As for monitoring points 8, 9, and 10, at flow velocities below 2 m/s, their stress values are similar to those observed at monitoring points 6 and 7. At flow velocities exceeding 2 m/s, due to the limited force transmission between wall panels, the stress increase is more gradual.
Flood-induced erosion of the subsoil beneath perimeter walls also affects the hydrodynamic load acting on the building structure. Increasing erosion depth results in a greater impact on the foundation under flood conditions. This section investigates the load-bearing performance of prefabricated perimeter walls with the gradual erosion of the left three-span foundation under a water depth of 1.0 m and flow velocity of 2 m/s, revealing the influence of erosion depth on the wall’s performance.
Figure 7 illustrates displacement and stress curves at monitoring points under different erosion depths. It is clear that varying erosion depths have led to minimal alterations in both displacement and stress levels of the substation wall. However, it’s essential to acknowledge that the simplified finite element model utilized in this study incompletely addresses the influence of flood erosion on the system (Assimaki et al., 2005; Fatahi et al., 2014; Avcil et al., 2022; Chaudhary, 2023). Consequently, the effect of erosion depth changes on stress distribution and displacement response of the wall seems relatively minor. This simplification has somewhat limited the comprehensiveness and precision of the analysis.
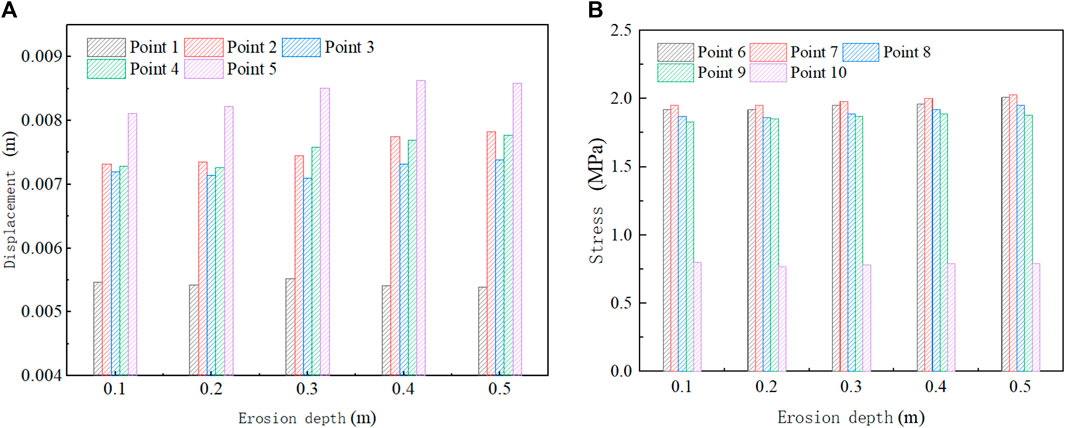
Figure 7. (A) Displacement variation with erosion depth. (B) Variation of stress with erosion depth.
Figure 8 presents the stress contour plot of the perimeter wall, where (a) represents the side facing the flood outside the station (referred to as the “external side”) and (b) represents the side facing the substation facility (referred to as the “internal side”). As depicted in Figure 8, the maximum tensile stress in the wall panels occurs at the two ends and bottom of the external side, while significant tensile stress is observed at the connection between the external side column and the foundation. In other areas, the tensile stress is relatively small. Consequently, under the influence of floodwater load, concrete cracks are primarily observed at key locations, including the wall-column connection, wall-foundation connection, and column-foundation connection. The presence of joints in these areas of prefabricated walls makes them vulnerable to tensile failure.
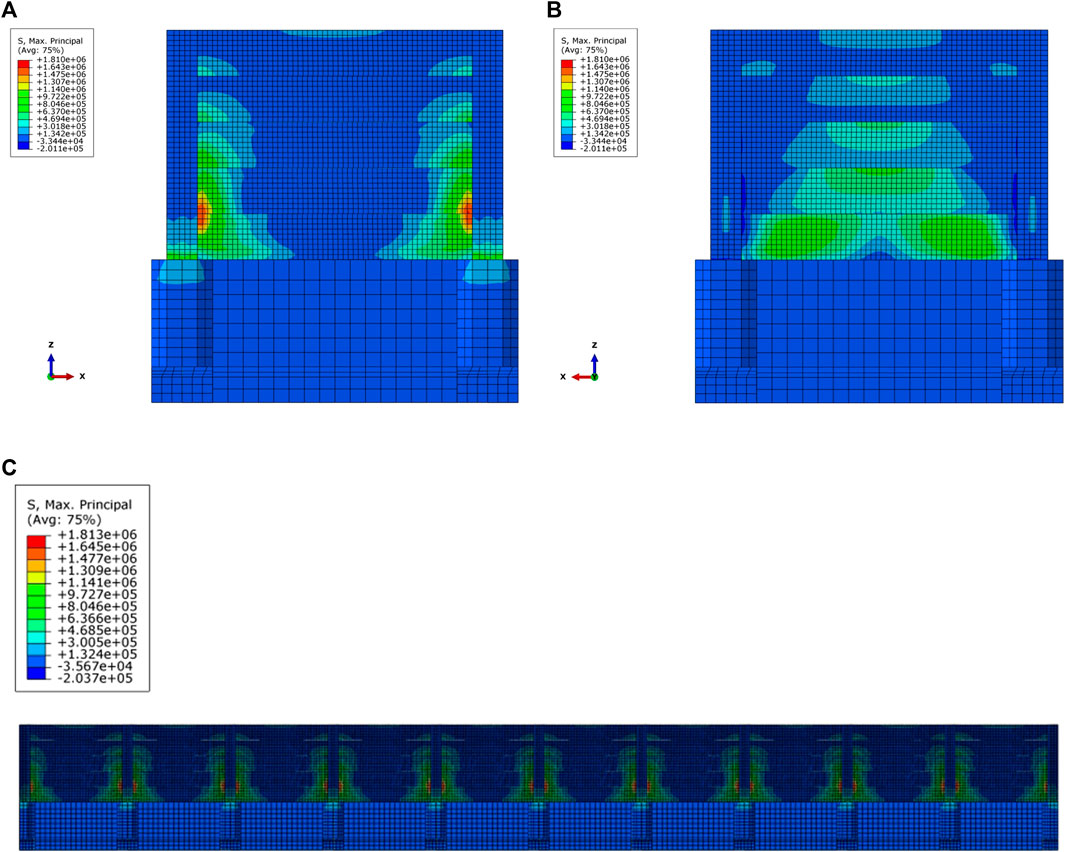
Figure 8. (A) External side. (B) Internal side. (C) Overall wall.
Figure 8 shows the displacement contour map of the prefabricated wall. From the figure, it can be observed that the wall deformation primarily occurs in the vertical direction of the wall. As shown in Figure 9A, the maximum deformation occurs at the center of the wall at the still water level, with significant deformation also observed at the top center. Figure 9B illustrates variations in the displacement contour maps of the wall at different locations under floodwater influence.
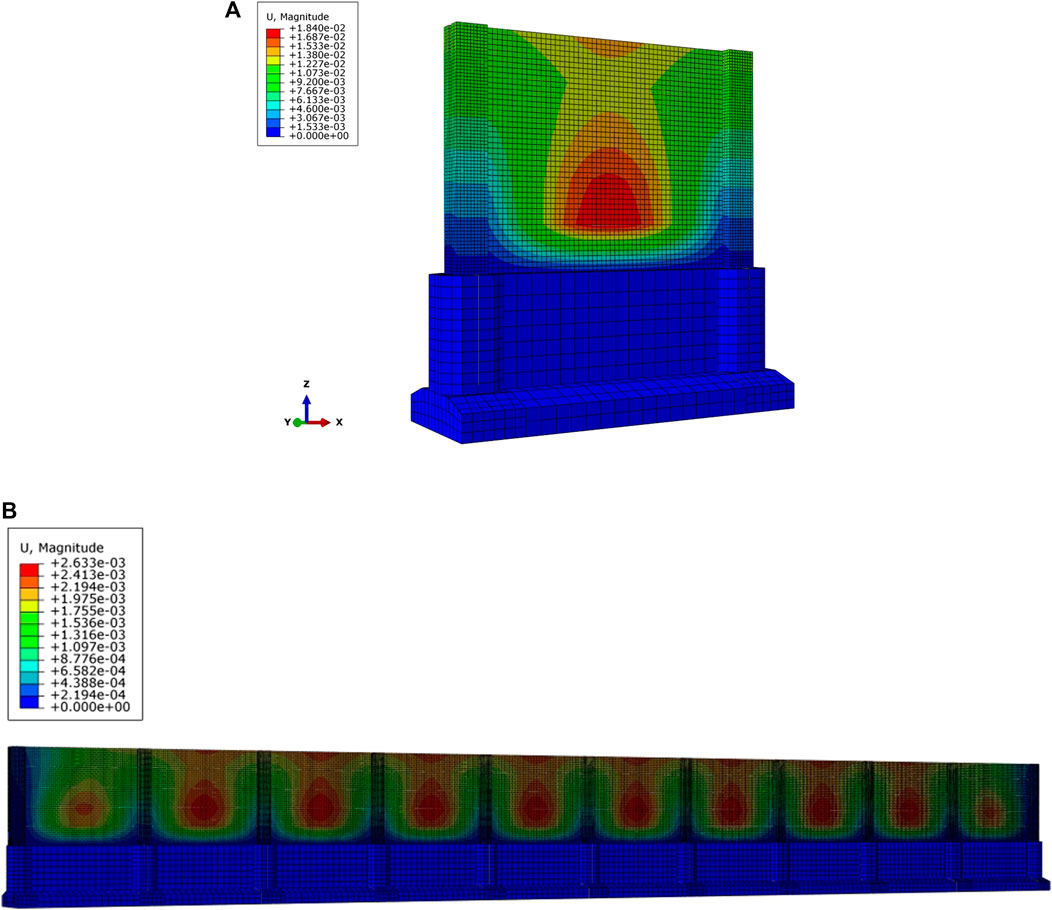
Figure 9. (A) Single-span wall. (B) Overall wall.
Based on the analysis of the structural performance and parameters of the substation prefabricated wall, it was observed that the maximum tensile stress occurs at the connections between the wall panels and other components, and the maximum deformation appears at the center of the wall. To improve the stress distribution, alleviate stress concentration on the wall panels, and reduce wall displacement, this section proposes a “W-shaped” wall reinforcement device, as shown in Figure 10A. The “W-shaped” wall reinforcement device is 2.25 m high, 2.7 m wide, with a panel width of 250 mm and a thickness of 20 mm. It includes crossbeams with a width of 150 mm at the top. The reinforcement device is firmly connected to the columns and foundation on both sides and at the bottom, and it makes contact with the wall panels.
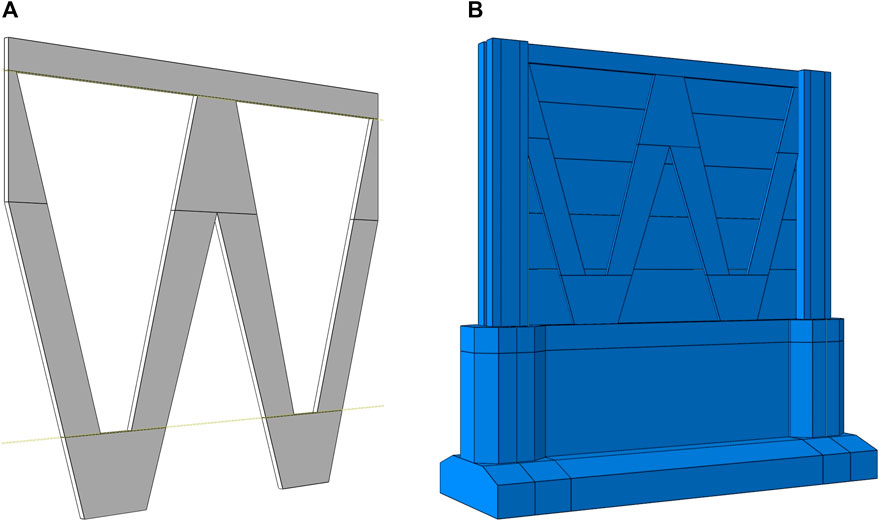
Figure 10. (A) W-type reinforcement device. (B) Finite element model of the W-type wall reinforcement device.
Considering that the wall’s tensile strength is weaker than its compressive strength, and the inner wall panels experience significant tensile stress during flood impacts, the reinforcement device is positioned on the inner side of the prefabricated wall to enhance its performance. The “W-shaped” reinforcement device is combined with the prefabricated wall, as shown in Figure 10B, to investigate the improvement of the wall’s performance through the reinforcement.
When flood load acts on the retaining wall, the wall panels bear the majority of the load due to their larger force-bearing area compared to other parts. Considering the relatively thinner thickness and lower stiffness of the wall panels, the reinforcement devices are designed to primarily share the load carried by the wall panels. Considering the load transmission path in the wall, after the wall panels deform under the flood load, the load is transferred to the stiffer columns, and then from the columns to the foundation. A small portion of the flood load is directly transferred to the foundation through the bottom layer of wall panels. Therefore, when installing the reinforcement devices, they can be securely connected to both the columns and the foundation along with the wall panels.
Under the flood conditions with a depth of 1 m and a flow velocity of 2 m/s, a comparative analysis of the wall’s stress variation before and after reinforcement was conducted. Figure 11, Figure 12, and Figure 13 represent the displacement and stress contour plots of the wall. From Figure 11, it can be observed that after reinforcement, the maximum displacement of the wall is 0.0131 m, which is approximately 40% less than the maximum displacement of the unreinforced wall (0.0202 m), indicating a significant strengthening effect. From Figure 12, it can be observed that the maximum tensile stress of the reinforced wall decreased from 6.61 MPa to 5.11 MPa, reducing by approximately 24%. Moreover, the stress distribution became more uniform, indicating a significant improvement in the wall panel’s force distribution. From Figure 13, it can be seen that the maximum compressive stress of the reinforced wall decreased from 1.68 MPa to 1.41 MPa, reducing by approximately 15%. Additionally, the peak compressive stress is relatively smaller than the tensile stress, indicating improved safety.
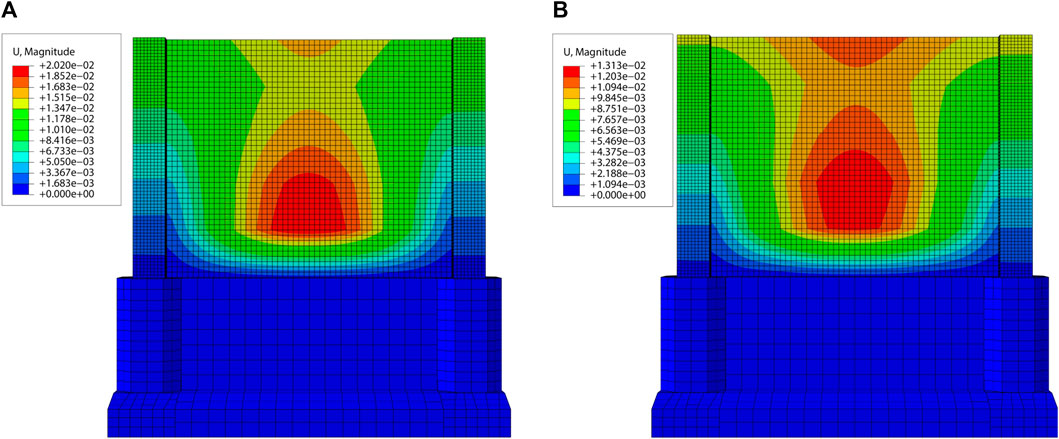
Figure 11. (A) Displacement contour map before reinforcement. (B) Displacement contour map after reinforcement.
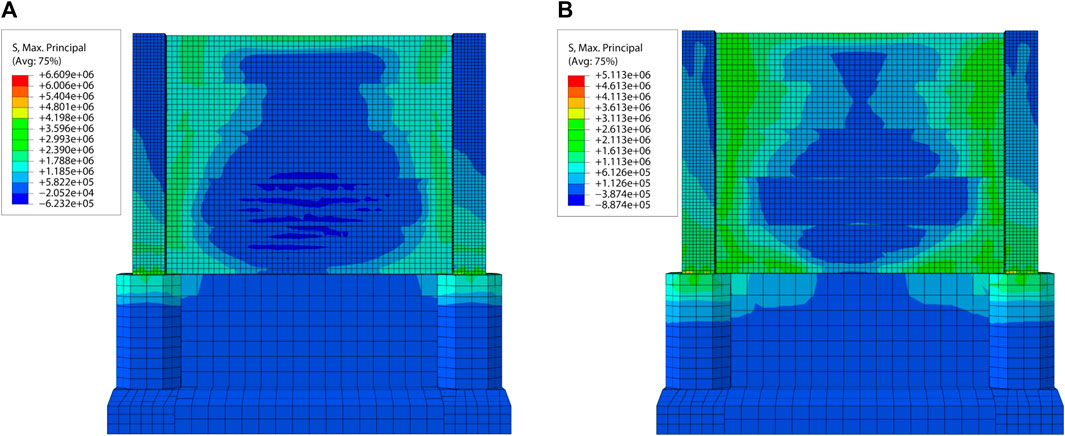
Figure 12. (A) Tensile stress contour map before reinforcement. (B) Tensile stress contour map after reinforcement.
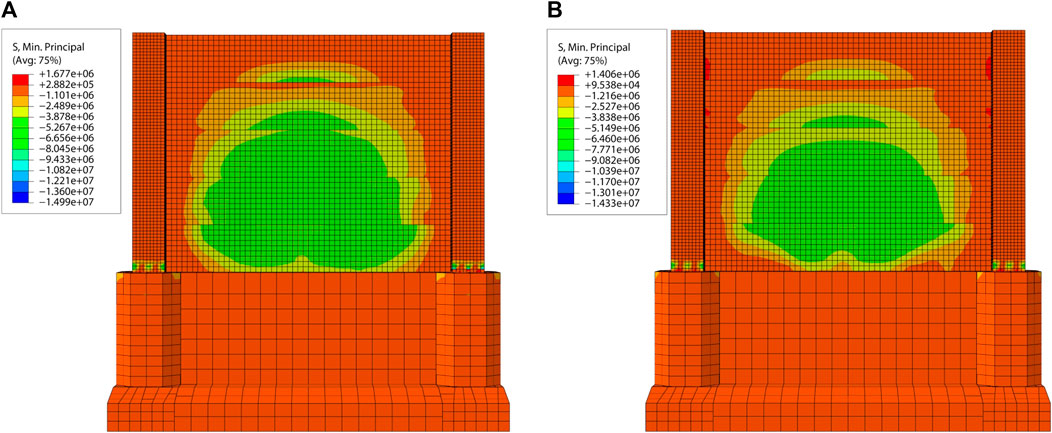
Figure 13. (A) Compressive stress contour map before reinforcement. (B) Compressive stress contour map after reinforcement.
Overall, the “W-type” wall reinforcement device demonstrates excellent performance in reducing wall displacement and stress, effectively alleviating stress concentration phenomena, and ensuring the safety of the assembled wall.
This paper is based on the 500 kV substation wall project in Xinyang, Henan, China, and establishes a detailed numerical model of a 10-span assembled wall. By considering the wave characteristics of the flood, key parameters affecting flood loads are selected to investigate the stress behavior of the wall under different flood loads. The study clarifies the structural response of the substation wall under flood loads and proposes relevant reinforcement measures. The main conclusions are as follows.
(1) The flood depth and flow velocity have critical values, with the critical flood flow velocity at 2 m/s and the critical flood depth at 1.0 m. When the flood depth is less than 1.0 m, the displacement and stress of the wall at different monitoring points are relatively small and show minimal differences. However, when the flood depth exceeds 1.0 m, significant increases in displacement and stress are observed at all monitoring points, with larger differences. The impact of flood flow velocity on stress and displacement follows a similar pattern to that of flood depth. Additionally, the erosion depth of the flood has negligible effects on the stress and displacement of the wall.
(2) When the flood load is relatively low, the maximum deformation of the wall occurs at the center of the wall near the still water level, with the top center of the wall also experiencing significant deformation. However, under higher loads, the maximum deformation shifts to the center of the wall. The deformation pattern of the columns is similar to that of the wall, but due to their higher stiffness compared to the assembly wall, the columns’ deformation is smaller than that of the wall at the same height.
(3) Under the action of flood load, the bottom wall panel directly transfers the load to the foundation and columns. Other wall panels transfer the load to the columns through their ends, and the columns transfer the load to the foundation through the connections at their base. Under the influence of flood load, the wall panels connecting the columns and foundation, as well as the columns connected to the foundation, are prone to tensile failure. The center of the outer wall panel, both sides of the inner wall panel, and the connection between the inner side of the column and the foundation are prone to compressive failure.
(4) The “W-type” wall reinforcement device effectively reduces wall displacement and stress. After reinforcement, the maximum displacement of the wall decreased by approximately 40%, the maximum tensile stress decreased by approximately 24%, and the maximum compressive stress decreased by approximately 15%. Moreover, the device promotes more uniform stress distribution, effectively alleviating stress concentration, and exhibits excellent reinforcement effects.
(5) While this study simplified the consideration of soil-foundation-structure interaction to reduce model complexity, it’s important to recognize the limitations and conservativeness introduced by this simplification. In practical engineering, the interaction between soil and foundation is often significant due to the inherent elasticity and deformability of soil. The rigid contact assumption underestimates the relative displacement between soil and foundation, thereby affecting the accuracy of displacement responses in wall structures. Particularly when dealing with external loads such as floods or earthquakes, this simplification may lead to overly conservative results, overlooking the potential impact of the complex interactions between soil and structure on structural performance.
(6) This study not only offers comprehensive data on the structural behavior and performance of retaining walls in flood environments for practical engineering applications but also successfully introduces and validates an innovative and effective “W”-shaped reinforcement device. This integrated research approach and reinforcement solution hold promise in providing more reliable design criteria for similar projects in future engineering practices, further advancing technological progress and development in related fields.
The raw data supporting the conclusion of this article will be made available by the authors, without undue reservation.
HY: Writing–original draft. LZ: Writing–original draft. QW: Writing–original draft. HH: Writing–original draft. FH: Writing–review and editing. LT: Writing–review and editing.
The author(s) declare that no financial support was received for the research, authorship, and/or publication of this article.
Authors HY, LZ, QW, and HH were employed by State Grid Henan Electric Power Company.
The remaining authors declare that the research was conducted in the absence of any commercial or financial relationships that could be construed as a potential conflict of interest.
All claims expressed in this article are solely those of the authors and do not necessarily represent those of their affiliated organizations, or those of the publisher, the editors and the reviewers. Any product that may be evaluated in this article, or claim that may be made by its manufacturer, is not guaranteed or endorsed by the publisher.
Assimaki, D., Gazetas, G., and Kausel, E. (2005). Effects of local soil conditions on the topographic aggravation of seismic motion: parametric investigation and recorded field evidence from the 1999 athens earthquake. Bull. Seismol. Soc. Am. 95 (3), 1059–1089. doi:10.1785/0120040055
Avcil, F., Ercan, I., Büyüksaraç, A., et al. (2022). The effect of local soil conditions on structure target displacements in different seismic zones. Gümüşhane Üniversitesi Fen Bilim. Derg. 12 (4), 1000–1011. doi:10.17714/gumusfenbil.1107506
Bokhove, O., Kelmanson, M. A., Kent, T., Guillaume, P., and Tacnet, J. M. (2019). Communicating (nature-based) flood-mitigation schemes using flood-excess volume. River Res. Appl. 35 (9), 1402–1414. doi:10.1002/rra.3507
Chaudhary, M. T. A. (2023). Sensitivity of seismic response of pile-supported, multi-span viaduct bridges to interaction between soil-foundation and structural parameters. Innov. Infrastruct. Solutions 8 (6). doi:10.1007/s41062-023-01145-2
Fatahi, B., Tabatabaiefar, S. H. R., and Samali, B. (2014). Soil-structure interaction vs Site effect for seismic design of tall buildings on soft soil. Geomechanics Eng. 6 (3), 293–320. doi:10.12989/gae.2014.6.3.293
Gallien, T. W. (2012). Predictive urban coastal flood modeling: Accounting for tides, surge, waves and flood control infrastructure. Irvine: [D]. University of California.
Giacomo, V., and Izzo, C. (2022). Three-dimensional cfd modelling of urban flood forces on buildings: A case study. J. Phys. Conf. Ser. 2162 (1), 012020. doi:10.1088/1742-6596/2162/1/012020
Guangwu, S., Xiaoqing, C., Jiangang, C., Zhao, W. y., Li, S., and Li, X. n. (2022). Failure criteria of unreinforced masonry walls of rural buildings under the impact of flash floods in mountainous regions. J. Mt. Sci. 19 (12), 3388–3406. doi:10.1007/s11629-022-7491-6
Jansen, L., Korswagen, P. A., Bricker, J. D., Pasterkamp, S., de Bruijn, K. M., and Jonkman, S. N. (2020). Experimental determination of pressure coefficients for flood loading of walls of Dutch terraced houses. Eng. Struct. 216, 110647. doi:10.1016/j.engstruct.2020.110647
Keawsawasvong, S., and Ukritchon, B. (2017). Finite element analysis of undrained stability of cantilever flood walls. Int. J. Geotech. Eng. 11, 355–367. doi:10.1080/19386362.2016.1222044
Khadka, S. S., Acharya, S., Acharya, A., and Marc, J. (2023). Enhancement of Himalayan irregular stone masonry buildings for resilient seismic design. Front. Built Environ. 9. doi:10.3389/fbuil.2023.1086008
Li, H. J., Dai, F. C., Li, W. C., Xu, L., and Min, H. (2011). Stability assessment of a slope under a transformer substation using numerical modelling. Bull. Eng. Geol. Environ. 70, 385–394. doi:10.1007/s10064-010-0318-7
Li, Y. C., Dong, G. H., Sun, Z. C., Xu, S. Q., Mao, K., and Niu, E. Z. (2001). Laboratory study on the interaction between regular obliquely incident waves and vertical walls. CHINA Ocean. Eng. 15 (2), 195–203. doi:10.3321/j.issn:0890-5487.2001.02.005
Medero, G. M., Kennedy, J. H., Woodward, P. K., and Banimahd, M. (2010). Flooding effect on earth walls. Sustainability 3 (1), 69–81. doi:10.3390/su3010069
Miguel, A. M. M., Emmanuel, M., Andr eacute, P., Darius, S., and Proust, S. (2021). Impact of the porosity of an urban block on the flood risk assessment: A laboratory experiment. J. Hydrology 602, 126715. doi:10.1016/j.jhydrol.2021.126715
Nagai, S. (1986). Acoustic power measurements of focused waves: radiation force and Raman-nath methods: radiation force and Raman-nath methods. J. Acoust. Soc. Jpn. (E) 7 (4), 229–231. doi:10.1250/ast.7.229
Nagai, S. (1969). Pressures of standing waves on vertical wall. J. Waterw. Harb. Div. 95 (1), 53–76. doi:10.1061/jwheau.0000623
Qiu, D., Zang, J., and Jia, Y. (1996). Action of cnoidal waves on vertical walls. China Ocean. Eng. 10 (2), 129.
Wang, H. (2017). Water wave pressure on horizontal plate. J. Hydraulics Div. 96 (10), 1997–2017. doi:10.1061/jyceaj.0002724
Wang, X. Y., Zhang, X., and Guo-Wei, L. (2004). Over-standard integrated risk analysis of flood control system. J. Hydraulic Eng. (2), 83.
Wu, J. J., Ni, L. J., Chen, H. Y., Wang, H. L., et al. (2017). Research on water retaining test of movable flood control wall. Water Resour. Power 35, 85–88.
Yin, L., Fan, P., Mao, J., and Jin, S. (2023). Analysis on precipitation efficiency of the “21.7” henan extremely heavy rainfall event. Adv. Atmos. Sci. 40 (3), 374–392. doi:10.1007/s00376-022-2054-x
Zha, X., Guo, L., and Liu, Z. (2022). Strains model of movable type flood walls under different waterhead. Innov. Comput. 791, 1183–1193.
Zhang, R. G., Xu, G. X., Wang, L. F., Kang, H., Su, L. M., and Liu, L. (2018). Stability attenuation of retaining wall under flood in river bend (Article). Yantu Lixue/Rock Soil Mech. 39 (1), 63–70, 77. doi:10.16285/j.rsm.2016.0135
Zhang, Y., Yu, H., Zhang, M., Yang, Y., and Meng, Z. (2022). Uncertainties and error growth in forecasting the record-breaking rainfall in Zhengzhou, Henan on 19-20 July 2021. Sci. China (Earth Sci). 65 (10), 1903–1920. doi:10.1007/s11430-022-9991-4
Keywords: flood load, prefabricated perimeter walls in substations, stress characteristics, force transmission mechanism, “W-shaped” reinforcement
Citation: Yao H, Zhang L, Wang Q, Han H, Han F and Tian L (2023) Analysis of the structural response and strengthening performance of prefabricated substation walls under flood loads. Front. Mater. 10:1273796. doi: 10.3389/fmats.2023.1273796
Received: 07 August 2023; Accepted: 04 September 2023;
Published: 15 September 2023.
Edited by:
Chun-Xu Qu, Dalian University of Technology, ChinaReviewed by:
Jiaxiang Li, Northeastern University, ChinaCopyright © 2023 Yao, Zhang, Wang, Han, Han and Tian. This is an open-access article distributed under the terms of the Creative Commons Attribution License (CC BY). The use, distribution or reproduction in other forums is permitted, provided the original author(s) and the copyright owner(s) are credited and that the original publication in this journal is cited, in accordance with accepted academic practice. No use, distribution or reproduction is permitted which does not comply with these terms.
*Correspondence: Fengkai Han, aGZrc2R1QDE2My5jb20=
Disclaimer: All claims expressed in this article are solely those of the authors and do not necessarily represent those of their affiliated organizations, or those of the publisher, the editors and the reviewers. Any product that may be evaluated in this article or claim that may be made by its manufacturer is not guaranteed or endorsed by the publisher.
Research integrity at Frontiers
Learn more about the work of our research integrity team to safeguard the quality of each article we publish.