 Jinjin He
 Liangqin Jiang1*
 Jing Ji
95% of researchers rate our articles as excellent or good
Learn more about the work of our research integrity team to safeguard the quality of each article we publish.
Find out more
ORIGINAL RESEARCH article
Front. Mater. , 07 September 2023
Sec. Structural Materials
Volume 10 - 2023 | https://doi.org/10.3389/fmats.2023.1267961
To study the seismic behavior of steel-reinforced high-strength concrete composite beams with bonded tendons (PSRHSCBs) under low cyclic loading, 13 PSRHSCBs were designed with the main parameters of the span-to-height ratio of beams (L/H), the cubic strength of concrete (fcu), the eccentricity of H-shaped steel (eH), the volume stirrup ratio (pv), the longitudinal reinforcement ratio (p), and the tension control stress of tendons(σcon). Using the simplified bilinear constitutive model of steel and the nonlinear constitutive model of high-strength concrete, and introducing plastic damage of concrete, fine finite element models were established with ABAQUS software. 11 similar test specimens were conducted by above modeling method, by comparing existing test curves and numerical simulation curves, both of them match well, which verified the validity of the modeling method. Subsequently, parameter analysis for 13 PSRHSCB specimens was performed, and the influence regularity of different parameters on the seismic behavior of this kind of composite beams was obtained. The results show that hysteretic curves of this kind of composite beams are full, and the failure mode is manifested as bending failure. The ultimate load, the energy dissipation capacity and the ductility coefficient of specimens can be improved significantly by increasing pv, on the contrary, the energy dissipation capacity and the ductility coefficient decrease gradually by increasing fcu. The stiffness degradation of specimens significantly slows down with the increasing of L/H and σcon, and the decreasing of eH. Finally, the trilinear skeleton curve model and the restoring force model are established by statistical regression, and the corresponding seismic design suggestions are given, and these can provide theoretical support for the seismic design of such composite beams in actual engineering.
With the advancement of construction engineering towards the super high, heavy load and large span, the traditional reinforced concrete beams’ limitations applied to large-span structures are becoming more and more prominent. To solve this problem, the research group has proposed the assembled prestressed steel-reinforced high-strength concrete composite frame structure system (Ji et al., 2023a), which utilizes fully prestressed steel-reinforced concrete beams (PSRCB) to achieve larger spans, as shown in Figure 1A. By incorporating prestressing tendons within steel-reinforced concrete beams and applying prestress to them, the flexural stiffness of composite beams during normal use can be improved significantly, and the crack resistance of the composite beams can also be enhanced greatly (Sun et al., 2006; Wang et al., 2009; Zhou et al., 2009; Xue et al., 2007). High-strength concrete (HSC) has the characteristics of high strength and good durability. The application of HSC in PSRCB can improve the bearing capacity and stiffness of composite beams significantly, and reduce the sectional size of beams, and improve the service life of beam members in long-span, heavy load, corrosion, and earthquake environments in further (Ahmad and Shah, 1985; Graybeal, 2008; Steninberg, 2010; Taylor et al., 2011), so the steel-reinforced high-strength concrete beams with bonded tendons (PSRHSCB) are more suitable for long-span, heavy-load, super high-rise buildings (Yao et al., 2014; Kuntal et al., 2017; Wang et al., 2018), and it is of a very broad application prospect for this kind of PSRHSCBs in actual engineering.
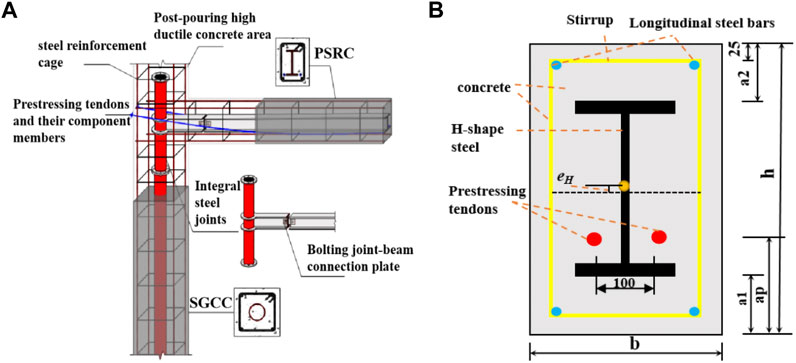
FIGURE 1. (A) The schematic diagram of new assembled frame; (B) The sectional arrangements of this kind of composite beams.
In recent years, there has been extensive research at home and abroad on the mechanical properties of PSRHSCBs (Akiyama et al., 2012; Wu et al., 2019; Jiang et al., 2021). Ji et al. (Ji et al., 2011) carried out simulations and analyses on seven PSRCBs, and the influence regularity of various parameters on the monotonic bending moment-curvature curves of the section and the monotonic load-displacement curves of the components was obtained, finally, the ductility formula and restoring force model for this kind of beams were established systematically by statistical regression. Wang et al. (Wang et al., 2009) employed ANSYS to simulate the bending process of 10 PSRHSCBs under static loads, and by comparisons with experimental data, the results revealed that the cracking load, ultimate load, yield load of the steel bars, and the load-displacement curves obtained from simulation closely matched the experimental results. This confirmation provides strong evidence for the accuracy of the finite element model. In another study, Jia et al. (2013a) conducted shear capacity tests on 8 PSRHSCBs, and the normal section cracking load, yield load, failure mode, and ultimate shear capacity subjected to concentrated loads were examined, and the impacts of various parameters on the shear capacity and ductility of the beams were analyzed. Through regression analysis, the calculation formula for the shear capacity of this kind of beams was proposed. Based on these findings, Jia et al. (2013b) further investigated the shear mechanism of PSRHSCBs by conducting shear performance tests on 14 PSRHSCB specimens and 7 prestressed ultra-high-strength concrete beam (PSRUHSCB) specimens. According to the load-mid-span deflection curves obtained from the test, the influence of different test parameters on the shear ductility of the test beams was studied, and the shear capacity formula of PSRUHSCBs was proposed. Meng et al. (Meng et al., 2014) carried out bending test of 13 PSRUHSCBs and systematically analyzed the failure mode, crack development, and distribution law of the specimens. The relationship between the load level and the comprehensive reinforcement index was investigated, and the formulas for calculating the average crack distance and maximum crack width were put forward. Lu et al. (2021) conducted bending test of 4 partially PSRUHSCBs and one partially prestressed ultra-high strength concrete beams under fatigue load. The load-deflection curves and the correlation between the tensile strain of the non-prestressed tensile steel bar as well as the regulation for degradation of the bending stiffness were obtained, and the results showed that the equivalent stress level was the main factor for the fatigue failure of the specimens. In summary, scholars at home and abroad have carried out a large number of experimental studies on the shear and flexural behavior of PSRHSCBs under static loads, but there are few reports on the seismic behavior of PSRHSCBs under low cyclic loading.
Therefore, to deeply investigate the seismic behavior of PSRHSCBs, 13 PSRHSCBs are designed with the main parameters of the span-to-height ratio of beams (L/H), the cubic strength of concrete (fcu), the eccentricity of H-shaped steel (eH), the volume stirrup ratio (pv), the longitudinal reinforcement ratio (p), and the tension control stress of tendons(σcon) in this paper. ABAQUS software is used to carry out the simulation analysis under low cyclic loading, and hysteretic curves and failure modes are gotten, then the load-displacement (P-Δ) skeleton curves of this kind of beams are extracted. The influence regularity of different parameters on the seismic behavior of such beams are obtained. Based on the parameter study, the trilinear model of PSRHSCBs skeleton curve and the restoring force model of PSRHSCBs are established by statistical regression, and the corresponding seismic design suggestions are given, and these can provide theoretical support for the application and promotion of this kind of beams in practical engineering.
To investigate the seismic behavior of PSRHSCBs under low cyclic loading, A total of 13 PSRHSCB specimens are designed with the main parameters of the span-to-height ratio (L/H) of the beams, the cubic strength of concrete (fcu), the eccentricity of H-shaped steel (eH), the volume stirrup ratio (pv), the longitudinal reinforcement ratio (p), and the tension control stress (σcon), as shown Table 1. All specimens own with a span (L) of 3,000 mm, and the cross-sectional sizes (h×b) of specimens include 320 mm × 220 mm, 360 mm × 220 mm, and 400 mm × 220 mm, so the span-to-height ratios (L/H) of specimens are 9.375, 8.300, and 7.500, respectively. The cubic strength of concrete (fcu) is 60, 70 and 80 Mpa, respectively. The Q235 H-shaped steels are adopted with a cross-sectional size of HN200 × 100 × 5.5 × 8. The H-shaped steels are arranged in three configurations: central symmetry, the eccentricity of 20 mm downward, and eccentricity of 40 mm downward. HRB335 steel bars with a diameter of 18 mm are used as longitudinal reinforcement within the beams. HPB235 steel bars with a diameter of 8 mm are used as the stirrups. Additionally, two 1860 Mpa (fptk) high-efficiency low-relaxation steel strands with a diameter of 15.2 mm are used for prestressing tendons. These prestressing tendons are symmetrically arranged on both sides of the H-shaped steel. The tension control stresses (σcon) is 0.6 fptk, 0.7 fptk, and 0.8 fptk, respectively. The cross-sectional arrangements of the specimens are shown in Figure 1B.
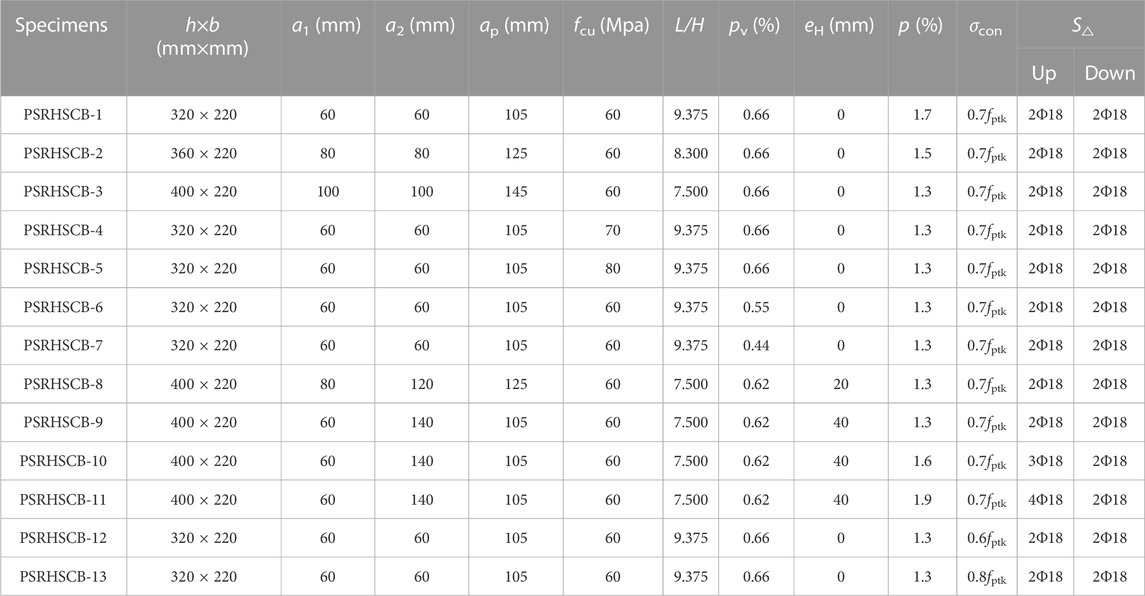
TABLE 1. The main parameters of 13 PSRHSCB specimens.
Based on the Mises yield criterion (Aleksandrova et al., 2012), the ideal elastic-plastic constitutive model (CM) (Ji et al., 2023b) is adopted for the CMs of H-shape steels, longitudinal steel bars, and stirrups as shown in Figure 2A. The expression of the CM can be seen in Eq. 1. The mechanical properties of three kinds of steels are listed in Table 2.
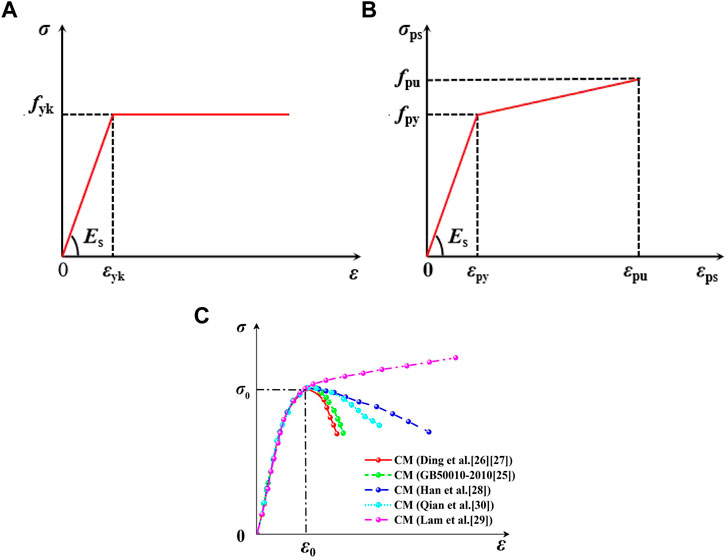
FIGURE 2. (A) The constitutive model of steel; (B) The constitutive model of prestressing tendon; (C) The constitutive model of concrete.
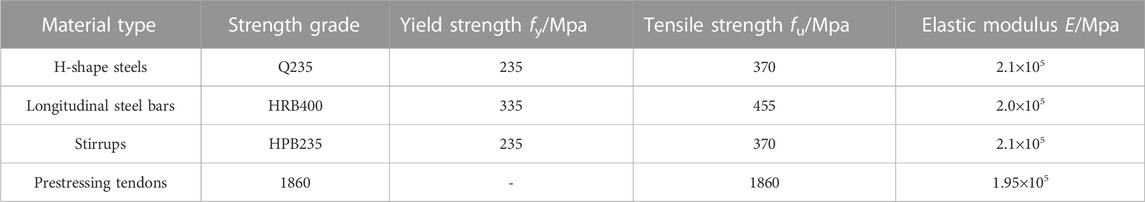
TABLE 2. The mechanical properties of three kinds of steels and prestressing tendons.
Where, Es is the elastic modulus of steel, and fyk is the yield strength of steel, and εyk is the strain at the yield strength.
The expression of the CM for prestressing tendons can be seen in Eq. 2. The mechanical properties of prestressing tendon are shown in Table 2. The CM of prestressing tendons is shown in Figure 2B.
Where, σ is the stress of prestressing tendon, Ep is the elastic modulus of prestressing tendon, fpy is the nominal yield strength of prestressing tendon, fpu is the ultimate strength of prestressing tendon, εp is the strain of prestressing tendon, εpy is the nominal yield strain of prestressing tendon, εpu is the ultimate strain of prestressing tendon, and k is the slope of a hardened section of the prestressing tendon,
Where, εpu is equal to 0.035 (PARK, 1989), fpy = 0.75fpu, Ep = 1.95 × 10⁵N/mm2, εpy = fpy/Ep.
1. The comparisons of CMs for concrete proposed by Qian et al., (2002), Teng et al., (2003), Han et al., (2001), Yu and Ding, (2003); (Ding and Yu, 2004) and the Code for Design of Concrete Structure (GB50010-2010) (Zhao et al., 2015) are shown in Figure 2C. When the strength levels of concrete are less than C60, the unconstrained concrete constitutive model proposed in the GB50010-2010 (Zhao et al., 2015) is used.
(1) Calculation formula for the stress-strain relationship of concrete under uniaxial tension is shown in Eq. 3.
Where
(2) Calculation formula for the stress-strain relationship of concrete under uniaxial compression is shown in Eq. 5.
Where,
2. When the strength levels of concrete are greater than or equal to C60, the stress-strain relationship of concrete proposed by Yu and Ding (Yu and Ding, 2003; Ding and Yu, 2004) is adopted, which is simple in form and has good calculation accuracy.
(1) Equation of the stress-strain relationship curve for concrete under tension is shown in Eq. 7.
Where,
(2) Equation of the stress-strain relationship curve for concrete compressive strength is shown in Eq. 8.
Where,
In the ABAQUS modeling process, the concrete plastic damage model is selected. The specific definition of concrete plastic damage is shown in Table 3.

TABLE 3. The parameters of concrete plastic damage model.
The fine finite element (FE) models of PSRHSCBs are established by ABAQUS software, as shown in Figure 3. Concrete, H-shaped steels and cushion blocks are established by element C3D8R, and longitudinal steel bars, stirrups and prestressing tendons are established by element T3D2 (Ji et al., 2020). During the process of FE modeling, reinforcement cage, H-shaped steel, and prestressing tendons are embedded in the entire model. The interfacial contact between the H-shaped steel and concrete consisted of hard contact in the normal direction and friction contact with coulomb friction coefficient of 0.5 in the tangent direction. Internal prestressing tendons were embedded in the concrete area at specified position. The two reference points (RP-1 and RP-2) are established at a third of the beams respectively. The RP3 is located on the left side of the beams, and the rotation was set along the x-axis (U1 = U2 = U3 = UR2 = UR3 = 0). While RP4 is located on the right side of the beams, and the translation is set along the z-axis and the rotation is set along the x-axis (U1 = U2 = UR2 = UR3 = 0). For static analysis, prestressing effect is applied through the temperature reduction method firstly, then the vertical load is applied according to loading rules. During the quasi-static analysis, vertical cyclic load was applied according to cyclic loading rules.
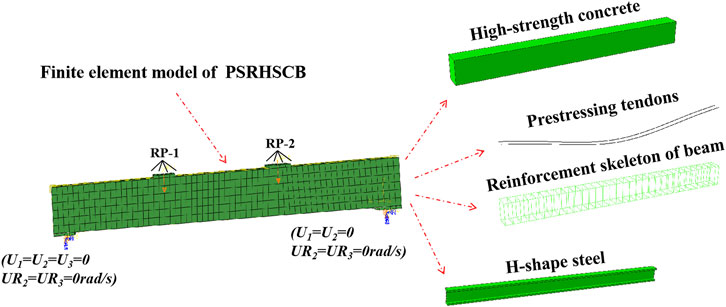
FIGURE 3. Finite element model of PSRHSCB.
To verify the rationality of the finite element modeling method, 6 test specimens from reference (Li, 2007), 3 test specimens from reference (Wang et al., 2012), and 2 test specimens from reference (Xue et al., 2007) are selected for finite element simulation, and the specific parameters of existing test specimens are shown in Table 4.
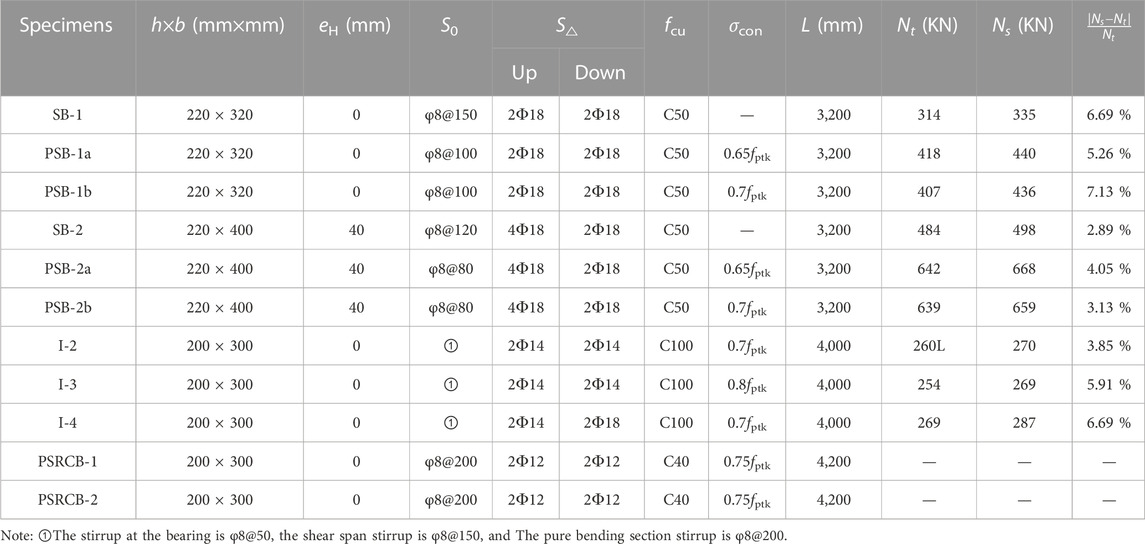
TABLE 4. The specific parameters of existing test specimens.
The static analysis of 9 specimens is carried out, and the load-displacement relationship curves of beams under static load are obtained, as shown in Figure 4. It can be seen from Figure 4 that the beams have experienced the elastic stage, the yield stage and the failure stage during the loading process. Since the trend of the load-displacement curves of the finite element simulation is consistent with the trend of the test load-displacement curves, the simulated results are in good agreement with the test results, which confirms the accuracy of the constitutive model of the materials. Comparing the numerical simulation value of the ultimate bearing capacity with the experimental ultimate bearing capacity, it is found that the error between the simulated value and the experimental value is small, and the average relative error is about 5%, as shown in Table 4. Then, the quasi-static analysis of the two test specimens is carried out, and the overall trends of the simulated skeleton curve and hysteresis curve are in good agreement with the experimental results, as shown in Figure 5, which verifies the rationality of the finite element modeling method in this paper.
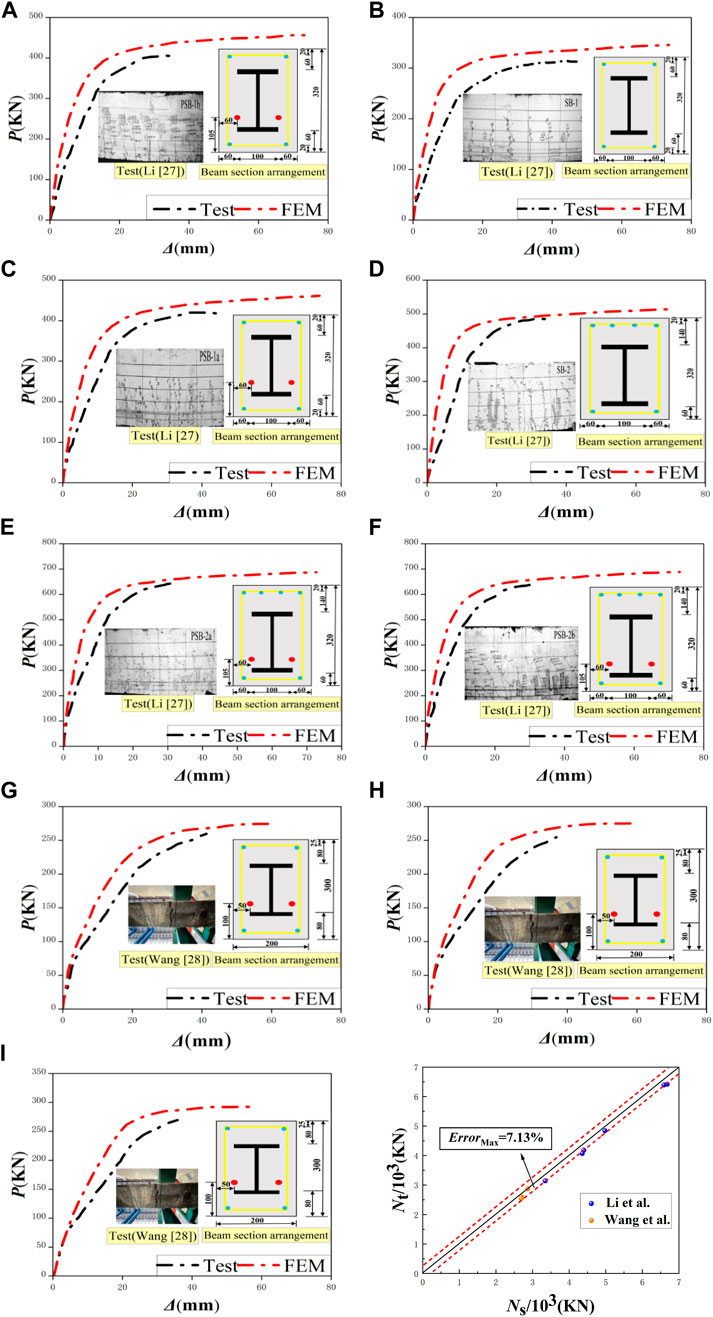
FIGURE 4. (1) Numerical simulation of 9 test pieces and test load and displacement relationship curves: (A) SB-1; (B) PSB-1a; (C) PSB-1b; (D) SB-2; (E) PSB-2a; (F) PSB-2b; (G) I-2; (H) I-3; (I) I-4. (2) Comparison of Ns and Nt for nine specimens.
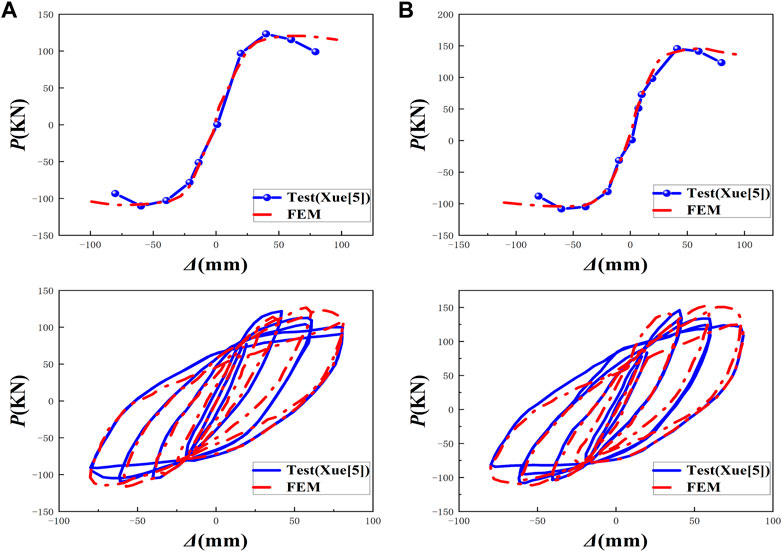
FIGURE 5. (1) Comparison of skeleton curves: (A) PSRCB-1; (B) PSRCB-2. (2) Comparison of hysteretic curves: (A) PSRCB-1; (B) PSRCB-2.
The specimens are subjected to displacement loading, and the cyclic displacement loading is applied at three points along the beams. The mechanical model of PSRHSCBs is shown in Figure 6A, and the loading scheme describing cyclic displacement loading is shown in Figure 6B. Each level of load undergoes a cycle before reaching the yield displacement (denoted as δ). After completing two cycles and reaching the yield displacement load, the specimens are loaded with a multiple of the yield displacement load until they are destroyed. Where n denotes the number of loading cycles.
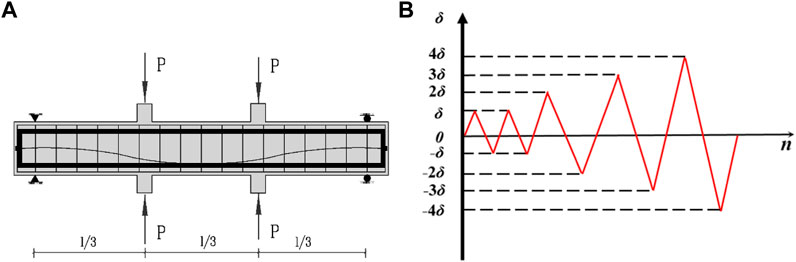
FIGURE 6. (A) The mechanical model of beams; (B) Reciprocating loading scheme.
The hysteretic curves of PSRHSCBs are shown in Figure 7. It can be seen from that the hysteretic curves of 13 PSRHSCBs show a relatively full shuttle shape, indicating that the PSRHSCBs have excellent seismic behavior. In the process of applying cyclic load, the process from the elastic stage to yield and finally to bearing capacity decline can be clearly obtained. By observing the hysteretic curves shown in Figure 7, it can be found that the eH and p have a great influence on the hysteretic curves of PSRHSCBs. With the increasing of eH, the bearing capacity of the beam degrades obviously. With the increase of p, the peak load and corresponding displacement of the hysteresis curve increase obviously, and the ductility increases significantly. This is because when the resistance of the beam section remains unchanged, the increase of p, which makes the bearing capacity of the beam increase.
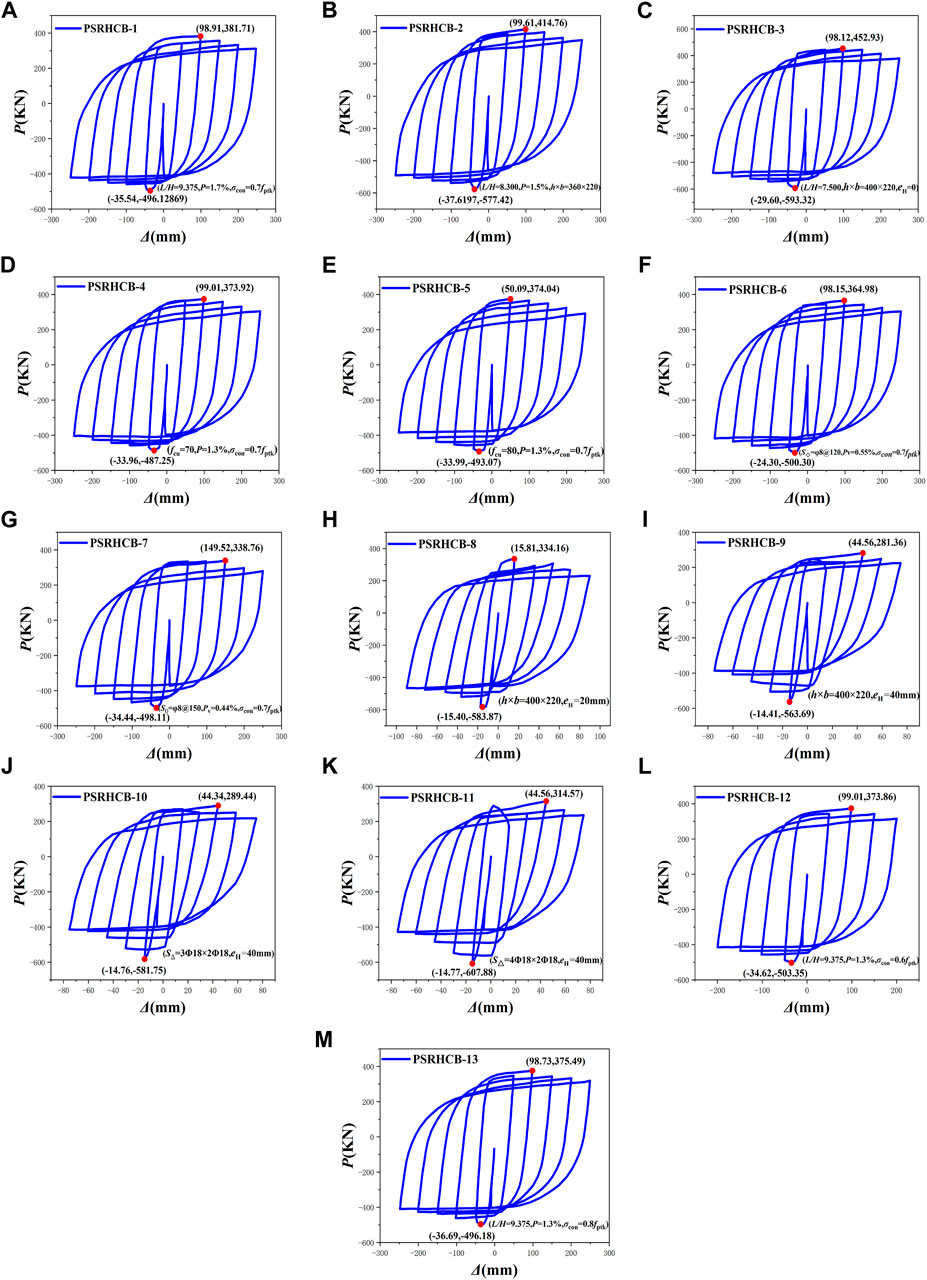
FIGURE 7. Load-displacement hysteretic curves of 13 PSRHSCB specimens: (A) PSRHSCB-1; (B) PSRHSCB-2; (C) PSRHSCB-3; (D) PSRHSCB-4; (E) PSRHSCB-5; (F) PSRHSCB-6; (G) PSRHSCB-7; (H) PSRHSCB-8; (I) PSRHSCB-9; (J) PSRHSCB-10; (K) PSRHSCB-11; (L) PSRHSCB-12; (M) PSRHSCB-13.
The load-displacement (P-Δ) skeleton curves of 13 groups of PSRHSCB specimens are shown in Figure 8, and the skeleton curves of all specimens conform to the rule of three broken lines in the elastic stage, elastic-plastic stage, and descending stage. When the L/H decreases from 9.375 to 8.300 and 7.500 in turn, the bearing capacity of composite beams under positive and negative loads increases gradually, as shown in Figure 8A. It can be seen from Figure 8C, with the increasing of pv, the initial stiffness of the specimens gradually decreases, the peak load increases greatly, and the falling section of the skeleton curves tends to be flattened, which is showing excellent load holding capacity. It can be seen from Figure 8D that with the increasing of eH, the bearing capacity of PSRHSCBs decreases significantly. Figures 8B, E, F show that the influences of fcu, p, and σcon on the peak load of the skeleton curves for PSRHSCBs are not obvious.
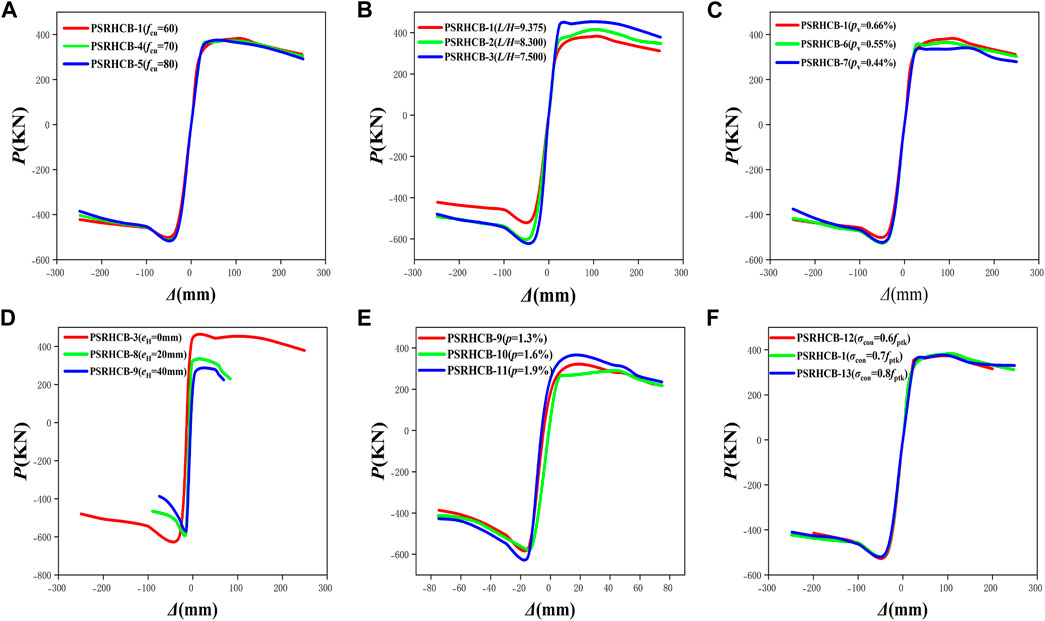
FIGURE 8. Skeleton curves of PSRHSCBs with different parameters: (A) L/H; (B) fcu; (C) pv; (D) eH; (E) p; (F) σcon.
During repeated loading of structures, the degradation of stiffness can be expressed by secant stiffness (Ki) (Ji et al., 2021a), which could be expressed by Eq. 9.
Where Fi denotes the peak horizontal load of the first cycle under the i-th control displacement and Δi refers to the corresponding displacement.
The secant stiffness comparisons of 13 PSRHSCBs with different parameters are shown in Figure 9. The Ki decreases with the increasing of horizontal displacement (Δ), and its decreasing range gradually slows down with the increase of Δ. It can be seen from Figure 9 that with the decreasing of σcon and L/H, the initial stiffness and declining degree of secant stiffness increase gradually. When σcon reaches 0.7fptk, the deformation resistance decreases seriously, which indicates that σcon should not less than 0.7fptk. The eH has a significant effect on the secant stiffness of specimens. With the increase of eH, the initial stiffness of the specimens increases obviously, and the stiffness degradation phenomenon becomes faster. The effects of fcu, pv, and p on the stiffness degradation of specimens are not obvious.
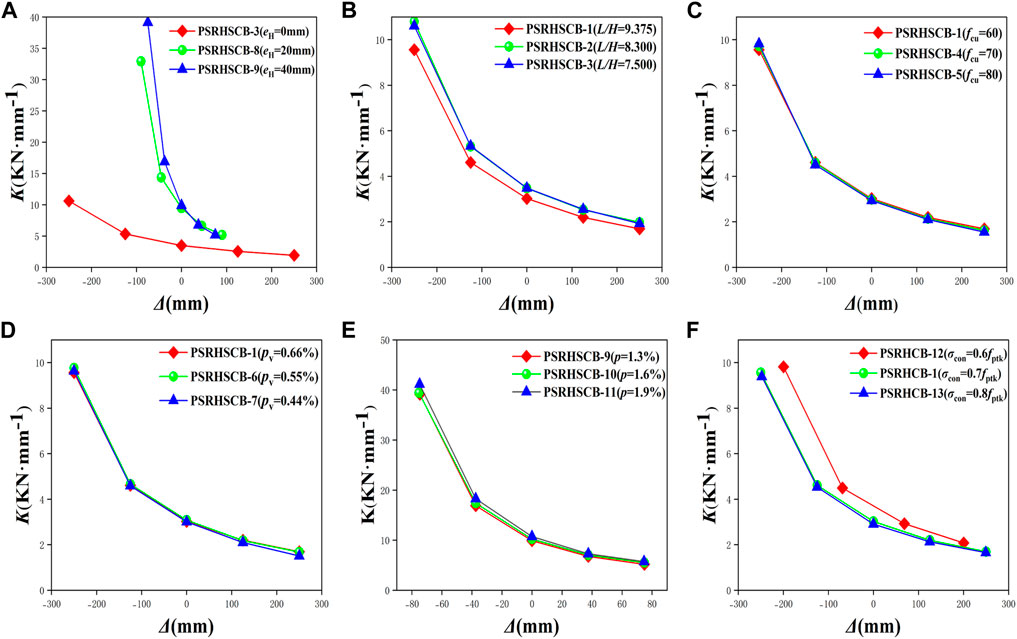
FIGURE 9. The relationships between Ki and Δ for PSRHSCB specimens with different parameters: (A) L/H; (B) fcu; (C) pv; (D) eH; (E) p; (F) σcon.
The energy dissipation capacity is applied to evaluate the ability to absorb the energy released in the earthquake of the structure (Cai et al., 2021). The energy dissipation coefficient (E) is used to evaluate the energy dissipation capacity of PSRHSCB specimens, and the energy dissipation coefficient refers to the ratio of the shadow area to the triangle DFO and the triangle BEO area, as shown in Figure 10 (1).
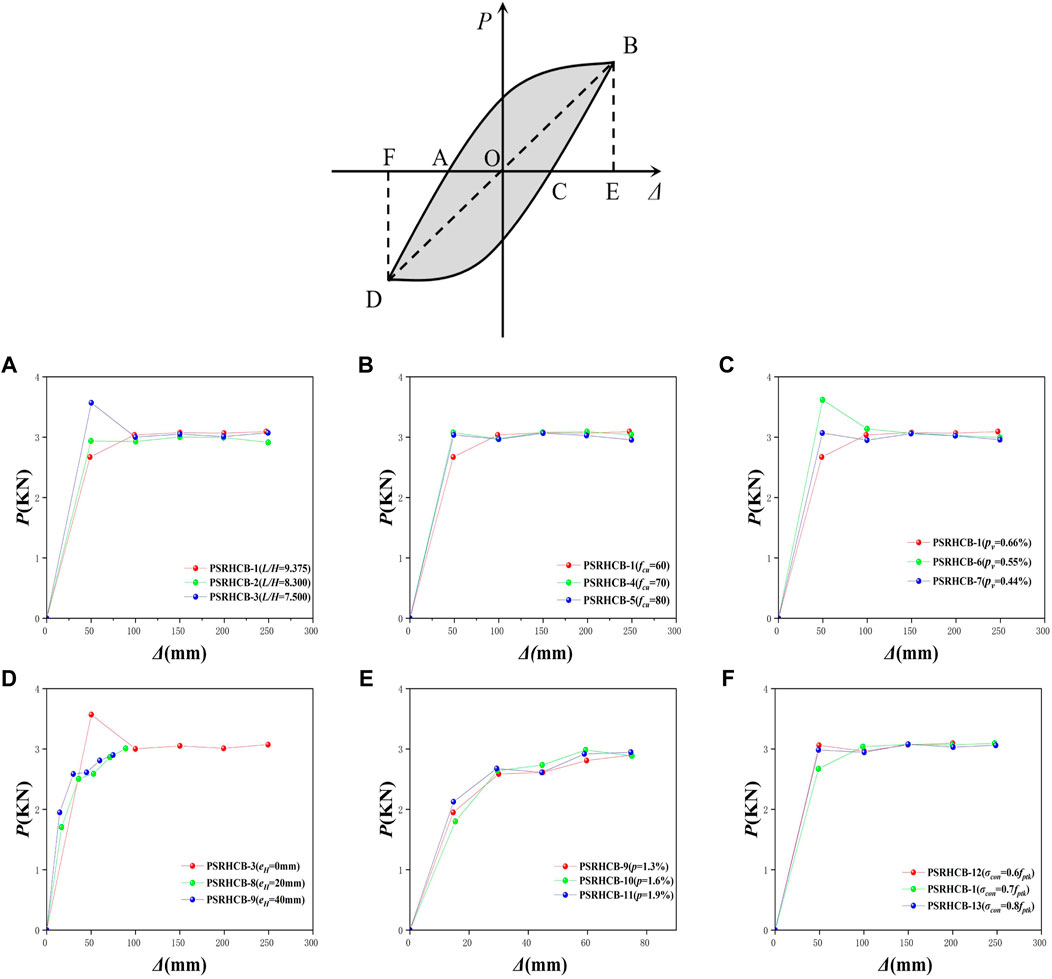
FIGURE 10. (1) Calculation diagram of E. (2) Comparisons of energy dissipation capacity for PSRHSCB specimens with different parameters: (A) L/H; (B) fcu; (C) pv; (D) eH; (E) p; (F) σcon.
The energy dissipation coefficient can be calculated as follows in Eq. 10:
Figure 10 (2) shows the horizontal displacement (Δ) versus the energy dissipation coefficient (E) relationships of the 13 PSRHSCBs under the first reciprocating load of each stage. It can be found from Figure 10 (2) that the energy dissipation capacity values of the 13 PSRHSCBs are substantially similar.
The energy dissipation capacity of PSRHSCBs is shown in Figure 10 (2). With the increase of fu, the energy dissipation capacity of the specimen decreases gradually, while with the increase of L/H and pv, the energy dissipation capacity of the specimen increases gradually. It can be seen from Figure 10 (2) (D) that EH has a great influence on the energy dissipation capacity of PSRHSCBs.When the H-shaped steels are eccentrically arranged, the energy dissipation capacity is poor. It can be seen from Figures 10 E, F (2) that p and σcon have little effect on the energy dissipation capacity of PSRHSCBs. The E of most of the specimens in this paper can reach more than 2.0, indicating that PSRHSCBs have excellent energy dissipation capacity.
Ductility is regarded as the main parameter to measure the deformation performance of the specimens (Ji et al., 2021b), and it can be explained by the ductility coefficient (μ), which can be calculated by Eq. 11.
Where Δu refers to the ultimate displacement and Δy denotes the yield displacement.
Based on the P-Δ curves, the equivalent yield point can be obtained by finding the corresponding point of 0.7 times as Pmax on the curves, and the yield load (Py) can be calculated, as shown in Figure 11 (1) The peak displacement (Δmax), yield displacement, ultimate displacement, and ductility coefficient of the specimens are shown in Table 5. The relationships between μ and L/H, fcu, pv, eH, σcon, and p of the PSRHSCB specimens are shown in Figure 11 (2). It can be seen from Figure 11 (2) that the μ of the PSRHSCBS increases gradually with the decreasing of L/H and fcu. When the L/H decreases from 9.375 to 8.300 and 7.500 in turn, µ increases from 3.091 to 3.100 and 3.716, which increases by 3.16% and 20.23%, respectively. When the fcu decreases from 80Mpa to 70 Mpa and 60 Mpa in turn, µ increases from 2.663 to 3.007 and 3.091, which increases by 12.92% and 16.07%, respectively. So, it can be found that L/H and fcu have significant effects on the ductility of specimens. By consulting the relevant literature, the ductility coefficient of reinforced concrete seismic structures in general engineering is in the range of 3–4. Among the ductility coefficients of 13 specimens calculated by the R-park method, 7 specimens are greater than 3, and the remaining 6 specimens are above 2.6. The six components that do not reach 3 are due to the excessive concrete strength (PSRHSCB-5), the excessive tension control stress (PSRHSCB-7), and the torsion of steel eccentricity (PSRHSCB-8,9,10,11).
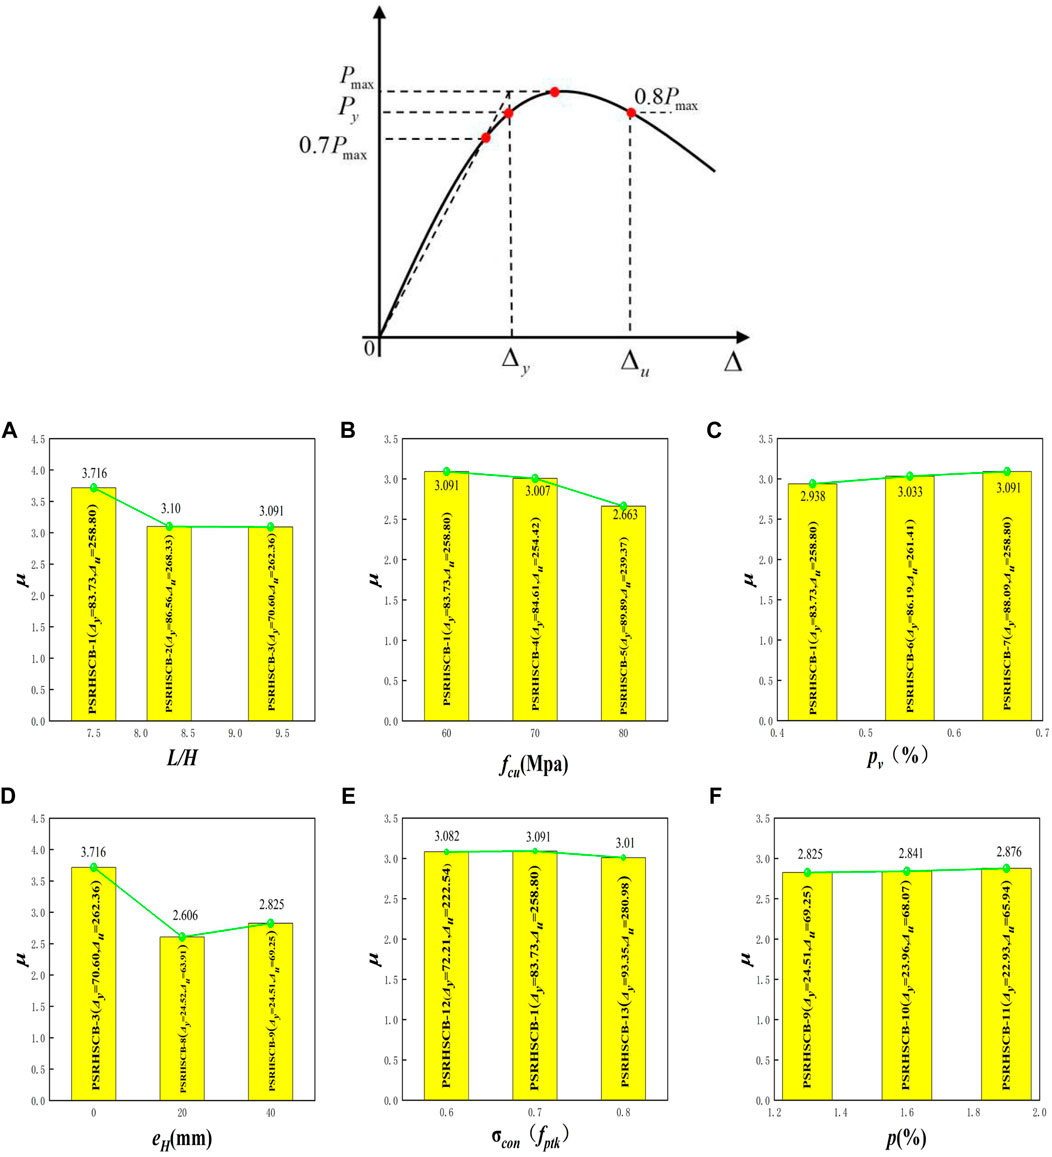
FIGURE 11. (1) The yield displacement obtained by the R.Park method. (2) The relationships between different parameters and μ for PSRHSCB specimens: (A) L/H; (B) fcu; (C) pv; (D) eH; (E) σcon; (F) p.
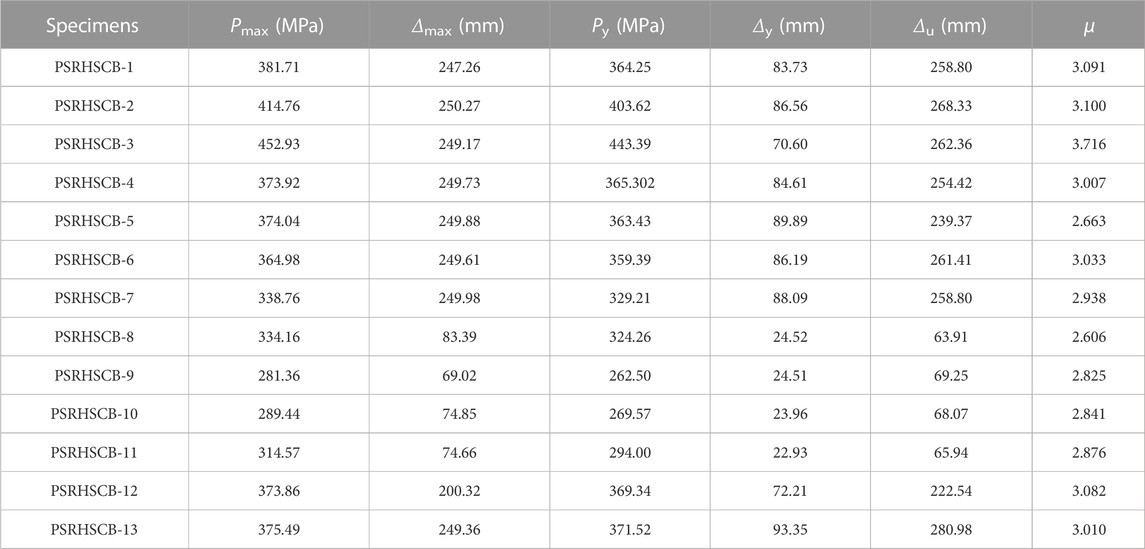
TABLE 5. The ductility coefficients of 13 PSRHSCB specimens.
The failure modes of PSRHSCBs under low cyclic vertical loading are analyzed in this paper. The bending failure at the mid-span section of the beam is the mainly failure mode of the specimen, and the maximum strain appears at the mid-span of the beam. Finally, the steel reinforcement cage, H-shaped steel, and prestressing tendons reach the ultimate strain, and the composite beam is destroyed as a whole. The stress distribution of several representative specimens is shown in Figure 12. As shown in Figure 12, the maximum stress of the steel reinforcement cage and the H-shaped steel is occurred in the middle of the beams.
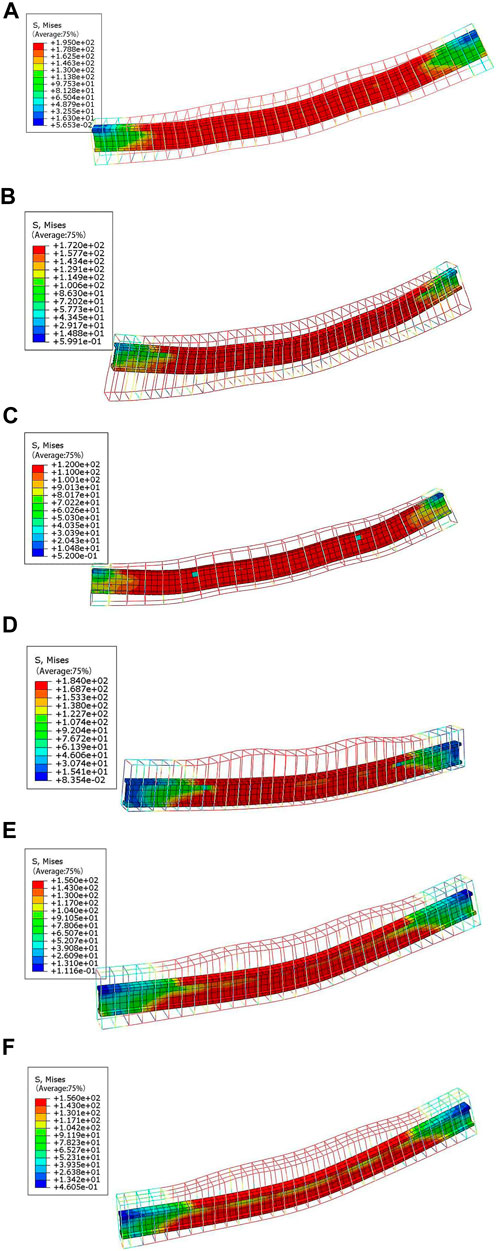
FIGURE 12. The stress distribution of PSRHSCBs: (A) PSRHSCB-1; (B) PSRHSCB-3; (C) PSRHSCB-7; (D) PSRHSCB-8; (E) PSRHSCB-10; (F) PSRHSCB-11.
To establish a load-displacement restoring force model for PSRHSCBs, the ratio coefficient of section steel stiffness to total section stiffness (γ) is introduced, the calculation formulas are as follows (Ji, 2008):
Where, Bss the sectional stiffness of H-shaped steel, Bs is the total stiffness of the beam section, and Bprc is the sectional stiffness of reinforced concrete.
Where, E0 is the elastic modulus of concrete, I0 is the converted section moment of inertia of reinforced concrete.
Where Ess is the elastic modulus of the section of steel, Iss is the moment of inertia of the section of the steel to its centroid axis, yss is the distance from the centroid of the section of the steel to the top surface, Ass is the section area of section steel, and x0 is the distance from the neutral axis to top surface in actual cross-section, calculated according to reference (Zhao et al., 2001).
The γ of 13 specimens is calculated using the above formulas. The values of γ are listed in Table 6.
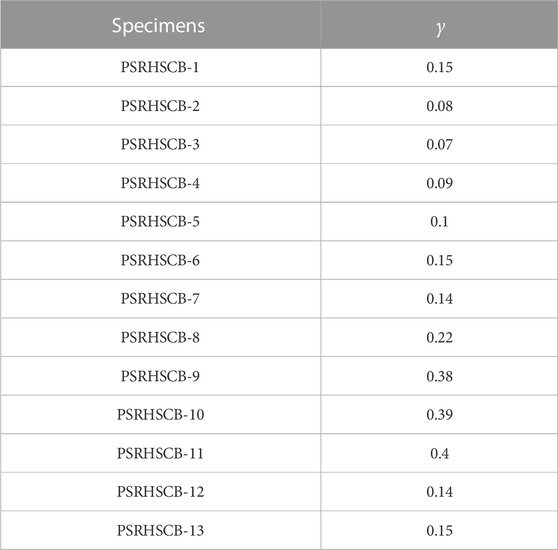
TABLE 6. The value of γ of 13 specimens.
Through the stress nephograms of the finite element model of PSRHSCBs, it can be seen that the H-shaped steel flange yields under both tension and compression. Therefore, the flexural capacity of the normal section of PSRHSCBs is calculated by using the formula proposed in the literature (Ji, 2008). The stress diagram of the H- shaped steel with uniform yield at the flange under tension and compression is shown in Figure 13.
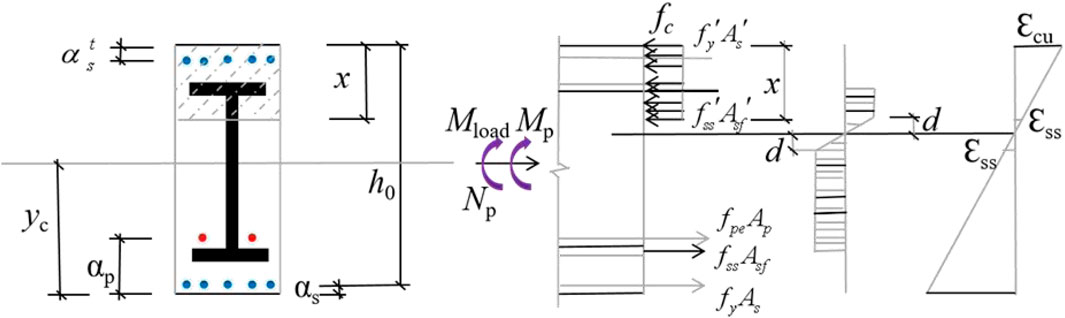
FIGURE 13. Stress diagram for yielding of H-shaped steel flanges under tension and compression.
According to the characteristics of skeleton curves, the trilinear skeleton curve model of PSRHSCBs is obtained by statistical regression, as shown in Figure 14 (1). Regression is required to determine 5 pairs of reference points: peak load Pu(P’u), yield load Py(P’y), yield displacement Δy(Δ'y), peak displacement Δm(Δ'm), and descending section stiffness Kd(K’d).
(1) Numerical analysis regression obtains the expression of the initial section stiffness Bs of the control section in the span of the composite beam as shown in Eq. 16.
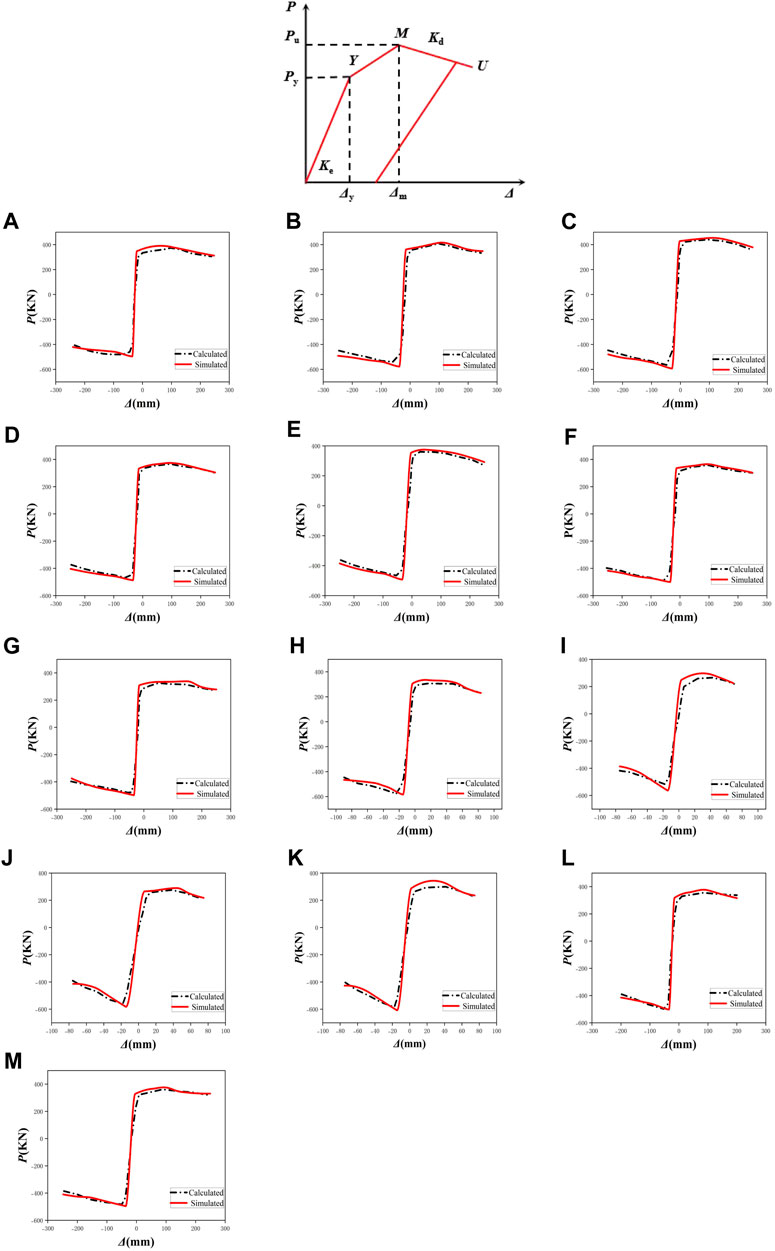
FIGURE 14. (1) Trilinear skeleton curve model. (2) Comparison between simulated and calculated skeleton curves: (A) PSRHSCB-1; (B) PSRHSCB-2; (C) PSRHSCB-3; (D) PSRHSCB-4; (E) PSRHSCB-5; (F) PSRHSCB-6; (G) PSRHSCB-7; (H) PSRHSCB-8; (I) PSRHSCB-9; (J) PSRHSCB-10; (K) PSRHSCB-11; (L) PSRHSCB-12; (M) PSRHSCB-13.
Where, λ is the ratio of shear span to depth, Bss is the sectional stiffness of H-shaped steel, and Bprc is the sectional stiffness of reinforced concrete.
The Initial stage stiffness expression of components (Ji et al., 2021a) is shown in Eq. 17.
Where, L is the span of the beam, and b is the concentration of the distance from the loading point to the bearing.
(2) The peak load is shown in Eq. 18.
Where, D is the distance between two loading points, Pu is the ultimate load when subjected to upward loads; Pu' is the ultimate load when subjected to downward loads.
(3) The yield load is shown in Eq. 19.
Where Py is yield load when subjected to upward load; Py' is Yield loads when subjected to downward loads.
(4) Yield displacement is shown in Eq. 20.
Where Δy is Py corresponding displacement, Δy' is Py' corresponding displacement.
(5) Peak displacement is shown in Eq. 21.
Where Δm is peak displacement when subjected to upward loads, Δm' is peak displacement when subjected to downward loads.
(6) Falling section stiffness is shown in Eq. 22.
When the bearing capacity drops to 85% of the ultimate bearing capacity, the specimen reaches failure.
Where Δy is 0.85Pu Corresponding displacement, Δy' is 0.85 Pu' Corresponding displacement.
Regression gets Eq. 23.
(7) Verification of trilinear skeleton curve model.
The comparisons of the simulated and calculated skeleton curves are shown in Figure 14 (2). It can be found that the skeleton curves obtained by equation are in good agreement with the numerical simulation results, which can provide a reference for engineering design.
The restoring force model (RFM) of PSRHSCB is established by statistical regression, as shown in Figure 15 (1), where the numbers: 0, 1, 2, … , express the walking routes of the model in the process of loading and unloading in forward-backward directions (Ji et al., 2022). The hysteretic curves of 13 specimens were observed, and it was found that the forward and reverse loading paths approximately passed through a “fixed point”. The statistical analysis of the experimental data showed that the fixed point was the intersection of the loading path and the elastic section in the positive and reverse directions, and the ordinates were 0.65 Pu and-0.65 Pu, respectively.
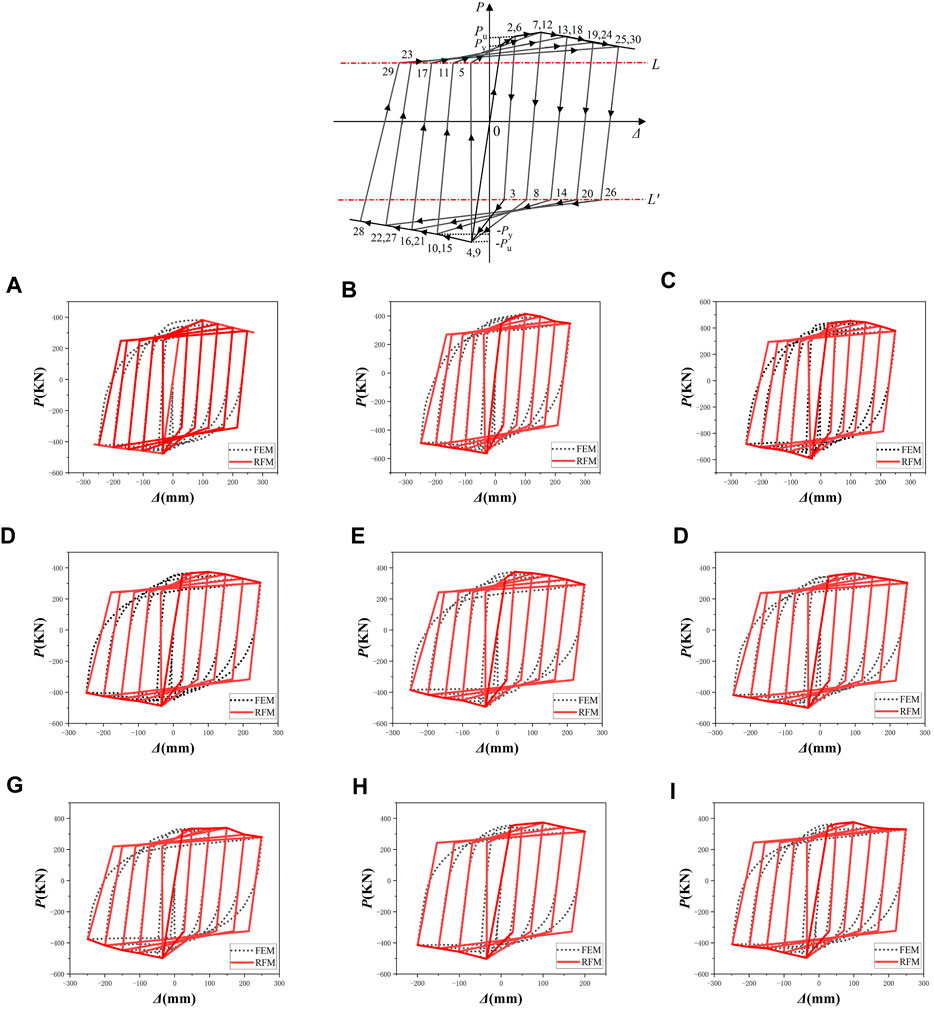
FIGURE 15. (1) Restoring force model for PSRHSCBs. (2) Comparisons between the hysteretic curves obtained by FES and RFM: (A) PSRHSCB-1; (B) PSRHSCB-2; (C) PSRHSCB-3; (D) PSRHSCB-4; (E) PSRHSCB-5; (F) PSRHSCB-6; (G) PSRHSCB-7;(H) PSRHSCB-12; (I) PSRHSCB-13.
The hysteretic rules are expressed as follows:
(1) Loading and unloading rules of elastic stage
Before the restoring force reaches Py, the loading is carried out along the skeleton curve. During unloading, the initial stiffness is taken into account, regardless of stiffness degradation and residual deformation.
(2) Loading and unloading rules of elastoplastic stage
When the restoring force exceeds the horizontal yielding load Py in the forward or backward direction, but is smaller than the peak load Pu, loading occurs along the skeleton curve, whereas unloading conforms to Eq. 24, and the unloading stiffness (Kun) is developed through regression analysis.
Where Δy is the yielding displacement, Δun is the displacement at the unloading point, and Ke is the initial stiffness.
(3) Loading-unloading rules at the descending segment stage
When the restoring force exceeds Pu in the forward or backward direction, Kd in descending segment stage of the skeleton curve is taken as the loading stiffness and unloading stiffness is still calculated according to Eq. 24.
(4) Backward loading and forward reloading rules
In the case of backward loading after forward unloading, when the maximum displacement in the backward direction does not exceed the yield displacement, the walking route is from the point of p = 0.65Pu directly to the yielding point in the backward direction. When the maximum displacement in the backward direction exceeds the yielding displacement, the walking route is from the point of p = 0.65Pu to the maximum displacement point in the backward direction. For forward reloading after backward unloading, the walking route is from the point of p = 0.65Pu to the maximum point in the forward direction.
The comparisons between the hysteretic curves obtained by finite element simulation (FES) and RFM are shown in Figure 15 (2), and it can be seen that both of them are in good agreement, therefore, the restoring force model of this kind of composite beam is reasonable.
To investigate the seismic behavior of PSRHSCBs under low cyclic loading, Thirteen groups of PSRHSCB specimens were designed with different parameters. These parameters included the span-to-height ratio of beams (L/H), the cubic strength of the concrete (fcu), the eccentricity of the H-shaped steel (eH), the volume stirrup ratio (pv), the longitudinal reinforcement ratio (p), and tension control stress of tendons(σcon). Then, the finite element models of 13 PSRHSCBs were established by ABAQUS software. By analyzing the data within the parameter range, the following conclusions can be drawn:
(1) Based on the concrete constitutive model proposed by Ding and Yu, and the prestressing effect applied by temperature reduction method, the finite element models of 13 PSRHCBs were established by using ABAQUS software with reasonable finite element method.
(2) The hysteresis curves of the 13 specimens showed obvious shuttle shape and no pinch phenomenon occurred, which indicates that the structure showed good seismic behavior. Additionally, the skeleton curves of the 13 specimens follow the trilinear rule in the elastic stage, elastic-plastic stage, and descending stage, showing excellent bearing capacity and ductility. The peak load of the skeleton curve increases with the increase of fcu, pv, p, and σcon, and decreases with the increase of L/H and eH, and L/H, pv and eH have more significant effects on the peak load of this kind of novel PSRHSCBs.
(3) The stiffness degradation of PSRHSCBs is significantly influenced by the parameters of eH. Decreasing eH can improve the stiffness degradation of specimens significantly. In addition, the energy dissipation capacity of the specimens increases with the rising of pv and p, and gradually decreases with the rising of L/H and fcu. The L/H, eH and σcon have a great influence on the ductility. With the increase of L/H, the ductility of the specimen decreases gradually. With the increase of eH, the ductility of the specimen decreases first and then increases. On the contrary, with the increase of σcon, the ductility of the specimen increases first and then decreases. In addition, with the increase of σcon, the energy dissipation capacity of specimens increases firstly, and when σcon exceeds 0.7 fptk, the energy dissipation capacity decreases gradually. When eH increases, the energy dissipation capacity of specimens decreases greatly.
(4) Based on the hysteresis curves obtained by the quasi-static analysis, the trilinear skeleton curve model and the corresponding restoring force model are established, and the hysteresis rules are proposed correspondingly, and the skeleton curves and hysteretic curves obtained by equation are in good agreement with the numerical simulation results, indicating that the restoring force model is reasonable and feasible.
The original contributions presented in the study are included in the article/Supplementary Material, further inquiries can be directed to the corresponding authors.
JH: Software, Validation, Writing–original draft, Writing–review and editing. LJ: Writing–review and editing. JJ: Supervision, Writing–review and editing. ZZ: Writing–review and editing. CX: Writing–review and editing. HY: Writing–review and editing. HZ: Writing–review and editing.
The author(s) declare financial support was received for the research, authorship, and/or publication of this article. This work is supported by Joint Guidance Project of Natural Science Foundation of Heilongjiang Province (No. LH 2020E018), Scientific Research Fund of Institute of Engineering Mechanics of China Earthquake Administration (No. 2020D07), China-Pakistan Belt and Road Joint Laboratory on Smart Disaster Prevention of Major Infrastructures (No. 2022CPBRJL-05), Northeast Petroleum University Guided Innovation Fund (No. 2020YDL-02), Guiding Science and Technology Project of Daqing City (No. zd-2021-40).
The authors declare that the research was conducted in the absence of any commercial or financial relationships that could be construed as a potential conflict of interest.
All claims expressed in this article are solely those of the authors and do not necessarily represent those of their affiliated organizations, or those of the publisher, the editors and the reviewers. Any product that may be evaluated in this article, or claim that may be made by its manufacturer, is not guaranteed or endorsed by the publisher.
Ahmad, S. H., and Shah, S. P. (1985). Structural properties of high strength concrete and its implications for precast prestressed concrete. PCI J. 30 (6), 92–119. doi:10.15554/pcij.11011985.92.119
Akiyama, M., Abe, S., Aoki, N., and Suzuki, M. (2012). Flexural test of precast high-strength reinforced concrete pile prestressed with unbonded bars arranged at the center of the cross-section. Eng. Struct. 34, 259–270. doi:10.1016/j.engstruct.2011.09.007
Aleksandrova, N. (2012). Application of mises yield criterion to rotating solid disk problem. Int. J. Eng. Sci. 51, 333–337. doi:10.1016/j.ijengsci.2011.10.006
Cai, Z., Liu, F., Yu, J., Yu, K., and Tian, L. (2021). Development of ultra-high ductility engineered cementitious composites as a novel and resilient fireproof coating. Constr. Build. Mater. 288, 123090. doi:10.1016/j.conbuildmat.2021.123090
Ding, F. X., and Yu, Z. W. (2004). Unified calculation method of mechanical properties of concrete in tensile. J. Huazhong Univ. Sci. Technol.
Graybeal, B. A. (2008). Flexural behavior of an ultrahigh-performance concrete i-girder. J. Bridge Eng. 13 (6), 602–610. doi:10.1061/(ASCE)1084-0702(2008)13:6(602)
Han, L. H., Tao, Z., and Liu, W. (2001). Concrete filled steel tubular structures from theory to practice. J. Fuzhou Univ. Sci. 29 (6), 24–34. doi:10.3969/j.issn.1000-2243.2001.06.004
Ji, J., He, L., Jiang, L., Lin, Y., Ni, S., Wang, Z., et al. (2021a). Seismic behavior of gfrp tube reactive powder concrete composite columns with encased steel. Front. Mater. 8. doi:10.3389/fmats.2021.793392
Ji, J., He, L., Jiang, L., Zhang, Y., Liu, Y., Li, Y., et al. (2023b). Numerical study on the axial compression behavior of composite columns with steel tube SHCC flanges and honeycombed steel web. Eng. Struct. 283, 115883. doi:10.1016/j.engstruct.2023.115883
Ji, J., Li, Y. H., Jiang, L. Q., Zhang, Y. F., Liu, Y. C., He, L. J., et al. (2023a). Axial compression behavior of strength-gradient composite stub columns encased CFST with small diameter: experimental and numerical investigation. Structures 47, 282–298. doi:10.1016/j.istruc.2022.11.069
Ji, J., Lin, Y., Jiang, L., Li, W., Yu, C., Wang, R., et al. (2022). Hysteretic behavior of h-shaped honeycombed steel web composite columns with rectangular concrete-filled steel tube flanges. Adv. Civ. Eng. 2022 (4), 1–24. doi:10.1155/2022/1546263
Ji, J. (2008). “Research on seismic performance and design method of jacketing steel reinforced concrete frame prestressed with bonded tendons,”. Doctoral dissertation (Harbin, China: Harbin Institute of Technology).
Ji, J., Yu, D. Y., Jiang, L. Q., Liu, Y. C., Yang, M. M., Song, H. Y., et al. (2020). Research on axial compression bearing capacity of different-strength concrete filled double steel tube short columns. Build. Struct. 50 (5), 120–129. doi:10.19701/j.Jzjg.2020.05.021
Ji, J., Zeng, W., Jiang, L., He, L., Ren, H., Chai, Q., et al. (2021b). Hysteretic behavior on asymmetrical composite joints with concrete-filled steel tube columns and unequal high steel beams. Symmetry 13, 2381. doi:10.3390/sym13122381
Ji, J., Zheng, W. Z., and Zhang, W. F. (2011). Parameter analysis on dynamic performance of prestressed H-steel reinforced concrete composite beams. Jianzhu Kexue Yu Gongcheng Xuebao(Journal Archit. Civ. Eng. 28 (1), 33–41. doi:10.19815/j.jace.2011.01.007
Jia, J. Q., Li, M. M., and Cai, J. (2013a). Experimental investigation on shear bearing capacity of prestressed steel reinforced ultra-high-strength concrete beams. Build. Struct.
Jia, J. Q., Yao, D. L., and Yu, F. (2013b). Experimental study on shear performance of prestressed steel ultra-high reinforced concrete beam under concentrated load. J. Build. Struct. 34 (12), 112–120. doi:10.6052/j.issn.1000-4750.2013.03.0155
Jiang, Q., Wang, H., Chong, X., Feng, Y., and Ye, X. (2021). Flexural behavior of high-strength, steel-reinforced, and prestressed concrete beams. Front. Struct. Civ. Eng. Engl. Version 15 (1), 227–243. doi:10.1007/s11709-020-0687-3
Kuntal, V. S., Chellapandian, M., and Prakash, S. S. (2017). Efficient near surface mounted cfrp shear strengthening of high strength prestressed concrete beams – An experimental study. Compos. Struct. 180, 16–28. doi:10.1016/j.compstruct.2017.07.095
Teng, L. L. G. (2003). Design-oriented stress–strain model for frp-confined concrete. Constr. Build. Mater. doi:10.1016/s0950-0618(03)00045-x
Lu, X. R., Meng, G., and Gao, J. C. (2021). Experimental study on fatigue performance of partially prestressed steel reinforced ultra-high strength concrete precast beams. Archit. Ski. 27 (1), 201–204. doi:10.19953/j.at.2021.s1.045
Li, F. (2007). “Experimental research on the carrying capacity of the prestressed steel reinforced concrete beam,”. Doctoral dissertation (Chongqing, China: ChongQing University).
Meng, G., Jinqing, J., Juncheng, Gao., and Hao, Y. (2014). Experiment and calculation of crack width of prestressed steel-reinforced ultra-high strength concrete beams. J. South China Univ. Technology:Science Ed. 42 (10), 9. doi:10.3969/j.issn.1000-565X.2014.10.017
Park, R. (1989). Evaluation of ductility of structures and structural assemblages from laboratory testing. Bull. N. Z. Natl. Soc. Earthq. Eng. 22, 155–166. doi:10.5459/bnzsee.22.3.155-166
Qian, J., Cheng, L., and Zhou, D. (2002). Behavior of axially loaded concrete columns confined with ordinary hoops. Qinghua Daxue Xuebao/journal Tsinghua Univ. 42 (10), 1369–1373. doi:10.1007/s11769-002-0073-1
Steinberg, E. (2010). Structural reliability of prestressed uhpc flexure models for bridge girders. J. Bridge Eng. 15 (1), 65–72. doi:10.1061/(ASCE)BE.1943-5592.0000039
Sun, J. Y., Li, G. P., and Fan, L. C. (2006). Experimental study on the tension and moment capacities of the prestressed steel reinforced concrete beams. J. Tongji Univ. Sci. 34 (1), 17–21. doi:10.1016/S1010-5182(06)60391-0
Taylor, C. W., Montoya, K. F., Jáuregui, David V., Newtson, C. M., and Weldon, B. D. (2011). Feasibility analysis of using UHPC in prestressed bridge girders. Struct. Congr., 203–214. doi:10.1061/41171(401)19
Wang, H., Marino, E. M., Pan, P., Liu, H., and Nie, X. (2018). Experimental study of a novel precast prestressed reinforced concrete beam-to-column joint. Eng. Struct. 156, 68–81. doi:10.1016/j.engstruct.2017.11.011
Wang, J. B., Jia, J. Q., and Meng, G. (2012). Non-linear analysis of prestressed steel-reinforced ultra-high-strength concrete beam subjected to bending. J. Water Resour. Archit. Eng.
Wang, J., Wu, D., Zheng, W. Z., Clarkson, W. A., and Ibsen, M. (2009). Single frequency Tm-doped fibre DBR laser at 1943 nm. J. Harbin Inst. Technol. 41 (6), 22–27. doi:10.1109/CLEOE-EQEC.2009.5194697
Wu, P., Guo, Y., Zhu, D., Jin, W., and Liang, R. (2019). Flexural performances of prestressed high strength concrete piles reinforced with hybrid gfrp and steel bars. Mar. Georesources Geotechnol. 38 (5), 518–526. doi:10.1080/1064119X.2019.1600081
Xue, W. C., Yang, F., Su, X. L., and Lu, P. (2007). Experimental studies on prestressed steel reinforced concrete beams under low reversed cyclic loading. J. Harbin Inst. Technol. 39 (8), 1185–1190. doi:10.1002/cem.1038
Yao, D., Jia, J., Wu, F., and Yu, F. (2014). Shear performance of prestressed ultra high strength concrete encased steel beams. Constr. Build. Mater. 52, 194–201. doi:10.1016/j.conbuildmat.2013.11.006
Yu, Z., and Ding, F. (2003). Unified calculation method of compressive mechanical properties of concrete. J. Build. Struct.
Zhao, J. D., Liu, L. X., Qiu, H. X., Zhu, A. P., Wang., X. F., and Ke, C. H. (2015). Design Code for concrete structure (gb 50010-2010). Constr. Technol. (10), 3.
Keywords: steel-reinforced high-strength concrete beams, prestressing tendons, finite element model, seismic behavior, restoring force model
Citation: He J, Jiang L, Ji J, Zhang Z, Chu X, Hong Y and Zhang H (2023) Seismic behavior of steel-reinforced high-strength concrete composite beams with bonded tendons. Front. Mater. 10:1267961. doi: 10.3389/fmats.2023.1267961
Received: 27 July 2023; Accepted: 22 August 2023;
Published: 07 September 2023.
Edited by:
Yu-Fei Wu, RMIT University, AustraliaReviewed by:
Angelo Aloisio, University of L'Aquila, ItalyCopyright © 2023 He, Jiang, Ji, Zhang, Chu, Hong and Zhang. This is an open-access article distributed under the terms of the Creative Commons Attribution License (CC BY). The use, distribution or reproduction in other forums is permitted, provided the original author(s) and the copyright owner(s) are credited and that the original publication in this journal is cited, in accordance with accepted academic practice. No use, distribution or reproduction is permitted which does not comply with these terms.
*Correspondence: Liangqin Jiang, amlhbmdsaWFuZ3FpbjE5NzhAMTYzLmNvbQ==; Jing Ji, amlqaW5nMTk3N0AxNjMuY29t
Disclaimer: All claims expressed in this article are solely those of the authors and do not necessarily represent those of their affiliated organizations, or those of the publisher, the editors and the reviewers. Any product that may be evaluated in this article or claim that may be made by its manufacturer is not guaranteed or endorsed by the publisher.
Research integrity at Frontiers
Learn more about the work of our research integrity team to safeguard the quality of each article we publish.