 Yanhui Xu
95% of researchers rate our articles as excellent or good
Learn more about the work of our research integrity team to safeguard the quality of each article we publish.
Find out more
ORIGINAL RESEARCH article
Front. Mater. , 15 September 2023
Sec. Energy Materials
Volume 10 - 2023 | https://doi.org/10.3389/fmats.2023.1247381
This article is part of the Research Topic Innovators in Energy Materials View all 4 articles
The quantitative characterization of coal spontaneous combustion and the accurate determination of the dangerous degree are hot and difficult in the field of coal mine safety. In the paper, the experimental test analysis of Huangling No. 2 coal was carried out by a self-designed and built kilogram-level coal spontaneous combustion experimental device, and the macro featured parameters were obtained and analyzed, such as temperature field, index gas, weight, oxygen consumption rate and exothermic intensity, and spontaneous combustion limit parameters. The results show that the experimental spontaneous combustion period of Huangling No.2 coal is 34 days. When the coal temperature was below the critical temperature of 74.59 °C, the oxidation of coal samples was relatively slow, and the oxygen consumption and the production rate of gas products did not change much. After the coal temperature exceeded the critical temperature, the oxygen consumption rate and exothermic intensity increased faster and the oxidation accelerated. After reaching the dry cracking temperature of 104.93 °C, the oxidation degree accelerated sharply. CO starts to appear at the beginning of the experiment, and the increase of CO gas concentration during the heating process is exponential and can be used as an index gas. Under the temperature condition of 40 °C, the floating coal of 0.7 m needs 25.83% oxygen concentration, and the maximum air leakage intensity of the coal is negative, and no spontaneous combustion will occur. The test data and calculation results of the experiment are important for the prediction and forecast of natural fires and the determination of the risk of spontaneous combustion on site.
Mine disasters are complex and varied, and fires caused by coal spontaneous combustion (CSC) are one of the most serious mine disasters (Liu et al., 2020; Onifade et al., 2020; Ren et al., 2022), which are highly susceptible to human casualties, environmental pollution and property damage (Deng et al., 2017; Wu et al., 2018; Li et al., 2019; Song et al., 2020). CSC is difficult to detect, locate, prevent and control the source of fire, and most coal mine fires in China are caused by CSC (Liu et al., 2022). Data show that fire accidents caused by CSC account for more than 90% of all mine fires (Wang et al., 2022), and the annual coal loss due to CSC amounts to 4.42 million tons. The process of CSC and oxidation is very complex and the exothermicity of oxidation is influenced by the intrinsic physicochemical properties, coal particle size, moisture in the coal, air humidity and oxygen concentration (Lei et al., 2023). Therefore, it is of great importance to understand the macro-featured parameters of CSC.
By studying the characteristics of CSC and accurately determining the exothermic intensity, reaction rate and other key parameters in the process of CSC, it can not only reflect the changes of coal in this period, but also accurately calculate the spontaneous combustion period of coal or the shortest experimental spontaneous combustion period (Ma et al., 2019; Zhai et al., 2020; Zhang et al., 2021a). Zhang et al. (2021b) established a large coal spontaneous combustion experimental bench to test the oxidative heating properties of Huangling coal, revealing the spatial and temporal evolution characteristics of the temperature field. Li et al. (2022) studied and experimentally verified the relationship between O2, CO and CO2 concentrations and temperature based on a mathematical model of the temperature field. Zuo et al. (2021) studied the temperature rise during the natural oxidation of coal using a self-built experimental platform and analyzed the variation of oxygen consumption and exothermic intensity with coal temperature by varying different air volumes and found that the exothermic intensity increased exponentially with the increase of temperature. Zeng et al. (2018) investigated the oxidative spontaneous combustion characteristics of ultra-thick coal seams in the Junggar coalfield using temperature programmed experiments and thermogravimetric analysis, and quantitatively studied many parameters, such as O2 consumption rate, CO and CO2 generation rate, and coal reaction activation energy. Deng et al. (2015) conducted a large-scale coal spontaneous combustion test based on a large 15t experimental furnace and studied the changes in temperature, gas ratio, oxygen consumption and exothermic intensity. Zhang et al. (2021) analyzed the oxidation properties of functional groups during CSC and their relationship with the macroscopic properties of CSC using the differential scanning thermal method.
The adiabatic oxidation method was first proposed by Davis for the study of low-temperature oxidation properties of coal (Davis et al., 2010). The adiabatic oxidation of coal is usually divided into large, medium and small samples according to the amount of experimental coal, with large samples usually requiring hundreds of kilograms or even tens of tons (Martini, 2008). Zhang et al. (2020) conducted adiabatic oxidation experiments with a small combustion furnace to analyze the changes of temperature, O2 and CO during CSC under pure oxygen adiabatic conditions. Chen et al. (2018) designed and built a small combustion furnace for CSC and studied macroscopic characteristic parameters such as temperature, gas ratio, oxygen consumption, exothermic intensity and limiting parameters. Xiao et al. (2017) constructed an experimental furnace for spontaneous combustion of 15t coal, Lei et al. (2018) built an experimental furnace for spontaneous combustion of 2t coal, Wen et al. (2017) based on an experimental furnace for spontaneous combustion of 1.5t coal, and they investigated the oxidation and self-heating characteristics of loose coal by combining various gas flow equations.
Although the adiabatic oxidation method with a small amount of coal samples cannot fully reflect the temperature field distribution in the process of CSC in real situations, it can simulate the temperature rise characteristics of the self-heating center of coal during CSC in a more realistic way, and also can truly reflect the essential properties of the difficulty of CSC. The determination of macro-featured parameters of CSC characteristics with kilogram-level coal volume natural oxidation adiabatic heating experimental system is rarely reported and needs further in-depth study. In this paper, an adiabatic oxidation loading experimental setup is designed based on a small coal volume experimental firing period test bench. The experimental system is loaded with small coal volume, small particle size, and the coal sample is dried and treated, and oxygen is introduced during the experiment, and the experimental data can better determine the propensity of coal to spontaneous combustion. The study is dedicated to solving the problem of rapid and accurate determination of the natural ignition period of coal in coal mines, and better serve coal mine safety production.
As in Figure 1, for the broken loose coal body (void ratio of n) micro-metasome, coal in the atmospheric pressure state, you can ignore the thermal resistance of contact between coal solid particles, and the low-temperature oxidation of coal can also ignore the radiation heat exchange of coal, micro-metasome particles and the gas in the void obey the law of energy conservation, the coal body exists the following relationship:
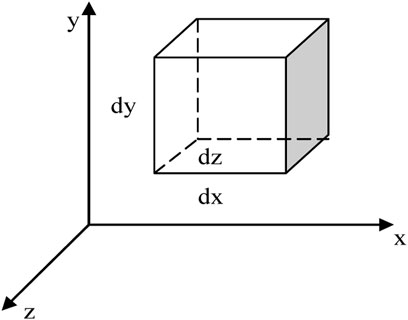
FIGURE 1. Schematic diagram of coal micro-metasome.
Where,
The gas in the pores within the micro-metasome obeys energy conservation:
Where,
The difference between the heat inflow and heat outflow from the coal particles on the surface of the micro-metasome per unit time can be expressed as:
Convective heat exchange between coal particles and pore gas per unit time is the result of the joint action of thermal conductivity and convection, and gas-solid heat exchange is known through Newton’s cooling theorem:
Where,
The standard exothermic intensity of the coal body per unit volume per unit time is expressed as
The rate of energy change of the exothermic coal body can be expressed as:
Where,
Substituting Equations 3–6 into Equation 1, the simplification gives:
In actual coal:
Therefore:
In Equation 2, the difference between the heat inflow and heat outflow of the pore gas per unit time is:
The difference between the inflow and outflow enthalpy of the pore gas per unit time is:
The rate of change of pore gas energy per unit time within the micro-metasome is:
Substituting Equation 4 and Equation 10–12 into Equation 2 gives:
Under normal conditions, the wind flow velocity inside the broken coal is small and the broken coal particles are isotropic. When the environment is determined, λ, ρ, C do not vary with time and space, and the temperature of solid coal, broken coal and pore gas is approximately considered the same, i.e.,
Where,
Therefore, the conditions that cause thermal heating of the coal body storage are:
At room temperature, the oxidation exothermic intensity of broken coal body is generally (1–100) × 10−6 J cm-3·s-1; the thermal conductivity of broken coal body is generally (8.6–13.4) × 10−4 J cm-1·°C−1·s-1; the heat dissipation by conduction of broken coal body is generally (25.8–40.2) × 10−4 ×
According to the coal samples used in the experiment and the experimental scheme, the experimental temperature starts from 30 °C, the starting air leakage intensity during the experiment is controlled at about
Calculated as:
Considering the experimental model of CSC by a spherical shape, the temperature difference between the center of the sphere and the boundary is kept below 2 °C. Then the minimum amount of coal that causes warming is estimated according to Equation 16, and converting Equation 16 into a difference equation and organizing it gives:
Where,
By calculation, when the temperature difference between the inside and outside of the experimental coal is less than 2 °C, the minimum radius of the sphere that causes heating is 39.40cm, and thus the minimum amount of coal that causes heat storage and heating is 137.12 kg. If the temperature difference between the inside and outside of the coal is controlled at 0.5 °C, the minimum radius of the sphere that causes heating is 19.08cm, and the minimum amount of coal that causes heat storage and heating is 15.57 kg When the temperature difference between the inside and outside of the coal is 0.2 °C, the minimum radius of the sphere that causes heating is 11.93cm, and the minimum amount of coal that causes heat storage and heating is 3.81 kg. If the temperature difference between the inside and outside is 0.1 °C, the minimum radius of the sphere that causes CSC is 8.38cm, and the minimum amount of coal that causes thermal heating is 1.32 kg.
At a certain time period, the experimental environment is usually determined, the broken coal is isotropic and the air supply conditions of the coal body (i.e., the leakage intensity) are relatively determined, and the wind flow will be uniform along the direction of the axis of the experimental coal body. The consumption of oxygen concentration in the coal body can be expressed as:
Where, V0(T) is the oxygen consumption rate generated by the coal body at standard oxygen concentration, mol·s-1·cm-3; A is the finger front factor, mol(1−n) ·cm-3(1−n) ·s-1; Ea is the activation energy, J·mol-1; R is the gas constant, J·mol-1·K−1; T is the temperature, K.
The exothermic intensity can be calculated using both the thermal equilibrium method and the bond energy estimation method.
The effect of oxygen concentration on the exothermic intensity of the broken coal in the experiment can be expressed as:
Where, C is the measured oxygen concentration at the measurement point, %; q(T) is the exothermic intensity, J·s-1·cm-3; q0(T) is the oxidative exothermic intensity at standard oxygen concentration, J·s-1·cm-3.
When natural oxidation of coal occurs, the oxygen consumed by coal adsorption is basically converted into CO and CO2 gas products, when the gas output rate and exothermic intensity are the highest, then the maximum exothermic intensity of oxidation corresponding to coal is expressed as:
Where, qmax(T) is the maximum oxidative heat liberation intensity;
If only part of the oxygen consumed by adsorption produces CO and CO2 gas, and part of it is in the intermediate state of chemisorption, when the gas yield and exothermic intensity are minimum, then the minimum oxidative exothermic intensity corresponding to coal is expressed as:
Where, qmin(T) is the minimum oxidative heat liberation intensity.
In this way, it can be considered that there is a maximum heat liberation intensity (upper exothermic intensity) and also a minimum heat liberation intensity (lower exothermic intensity) in the exothermic process of coal oxidation.
The actual exothermic intensity of coal is between the upper and lower limits, which is expressed as qmin < q0(T) < qmax. Therefore, the exothermic intensity of coal is in an interval of variation, by which the reasonableness of the exothermic intensity results can also be judged.
When the oxidation of coal occurs, high oxygen concentration causes the adsorption of oxygen by coal to increase and the amount of reaction and heat release also to increase, while the opposite is true when the oxygen concentration is low. Therefore, there exists a value of oxygen concentration at which the heat release of coal is equal to the heat dissipation, and this oxygen concentration is the minimum oxygen concentration Cmin for the oxidation and spontaneous combustion of coal. The expression for the minimum oxygen concentration when the temperature of the coal body does not increase is (Wang et al., 2023):
Where,
Under natural conditions, a certain thickness of coal accumulation is the material condition for coal oxidation heating. The premise for coal oxidization and self-heating is that the oxidation heat release is greater than the heat dissipation. The oxidation heat release and heat accumulation of coal is related to the coal volume. Under normal conditions, the temperature, air leakage intensity and heat dissipation conditions around the coal body are constant, so the thickness of coal volume is the main influencing factor of coal oxidation self-heating. The minimum coal thickness refers to the coal thickness when the heat release from the oxidation of floating coal is equal to the heat dissipation, which is the limit parameter to determine whether the rise of coal temperature occurs. Therefore, when the temperature of the coal body is maintained constant (that is, the heat release is equal to the heat dissipation), the minimum coal thickness expression relationship is (Wang et al., 2023):
Where,
The coal sample adiabatic natural oxidation experiment firing period test device mainly consists of adiabatic closed reactor, air supply system, temperature detection and control, gas chromatography analysis system, mass and moisture change detection system and control system. The experimental system composition and structure diagram are shown in Figure 2.
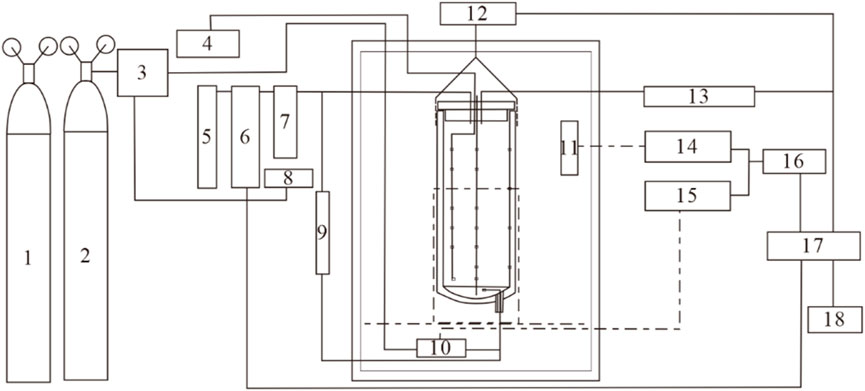
FIGURE 2. Schematic diagram of the control system of the experimental firing period test bench for small coal volume. 1- Nitrogen bottle; 2- Air Bottle; 3- Gas mass flow control; 4/5- Chromatographic analysis; 6- Gas Analysis; 7- Drying tube; 8/12- Electronic balance; 9- Differential pressure meter; 10- Auxiliary temperature control; 11- Main control temperature; 13-32-channel high precision temperature acquisition; 14/15- Solid state regulators; 16- Analog output; 17-485/232 to USB; 18- Computer.
In this experiment, high-pressure air and nitrogen cylinders were selected to eliminate the influence of water in the air, and then dry air oxidation experiments were carried out. Two gas mass flow controllers were combined to carry out gas distribution to realize oxidation temperature rise experiments with different oxygen concentrations.
About 40 kg of fresh lump coal without sprinkling, spraying and other fire prevention measures were collected from the coal wall of 410 working face of Huangling No.2 coal mine, wrapped with plastic film and then sent to the laboratory in plastic bags.
The experimental coal sample of Huangling No. 2 was formed in the Jurassic period, and the coal type is a weakly viscous coal with a relatively low degree of meta-morphism. Before conducting the spontaneous combustion characteristics test experiment, a small number of samples were taken for the industrial and elemental analysis to determine the coal quality characteristics of the experimental coal samples. The experimental results are shown in Table 1.
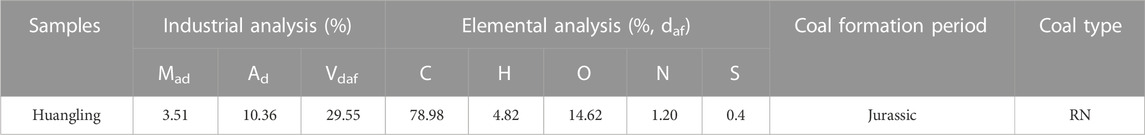
TABLE 1. Industrial and elemental analysis of experimental coal samples.
In this experiment, the broken coal samples were carried out in a nitrogen-filled inerting box. First, the coal samples were broken into small pieces, and then put into the nitrogen-filled crushing tank to be broken. The broken mixed coal samples were sampled and sieved. The particle size distribution of the broken coal samples is shown in Table 2, and the experimental conditions are shown in Table 3.

TABLE 2. Particle size distribution of Huangling No.2 coal.

TABLE 3. Experimental conditions.
The lump coal was broken under nitrogen protection and then loaded into an 8 L experimental furnace with 7.1 kg coal sample. The detection point, control system and gas circuit were connected, and the system was thoroughly checked, and the system was tested by passing nitrogen gas, mainly checking the operation of software and hardware. The heating, cooling and constant temperature tests were carried out, followed by the start of the experiment, which lasted 38 days in total.
During the natural temperature rise of the coal sample, the maximum temperature of the coal sample in the furnace was constantly changing, developing from 30.05 °C to 180.12 °C. In the experiment, the ambient temperature tracked the next highest point of temperature in the coal body, and 0.1–0.5 °C below the next highest point was used between 30 and 80 °C, and between 0.5 and 1 °C below the next highest point was used after 80 °C. Under the experimental conditions, removing the nitrogen protection and other influencing times, the experimental spontaneous combustion time of the natural oxidation temperature rise of Huangling No.2 coal was 34 days. Considering some influencing factors, the evaporated amount of water absorbed in the drying tube during the experiment was 328.04g, and the weight of coal was reduced by about 208 g com-pared with that before the experiment.
During the natural oxidation heating of experimental coal samples, the temperature of the experimental coal samples is related to the time, air leakage intensity, exothermic and heat dissipation conditions. The variation of the temperature of the high-temperature point in the experimental coal body with time is shown in Figure 3. Figure 4 and Figure 5 show the position of high-temperature point in the coal body and the rate of temperature change with time and coal temperature during the natural oxidation and warming process, respectively.
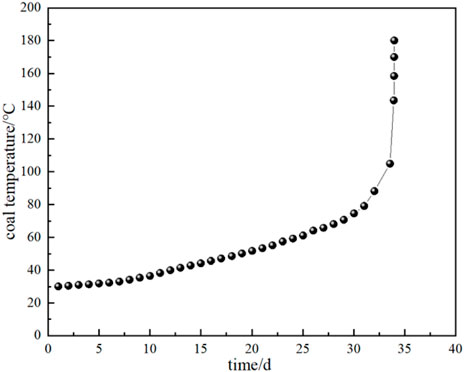
FIGURE 3. Experimental high-temperature point temperature versus experimental time.
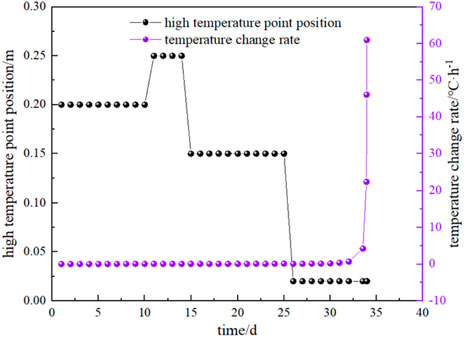
FIGURE 4. Experimental high-temperature point temperature and temperature change rate with experimental time.
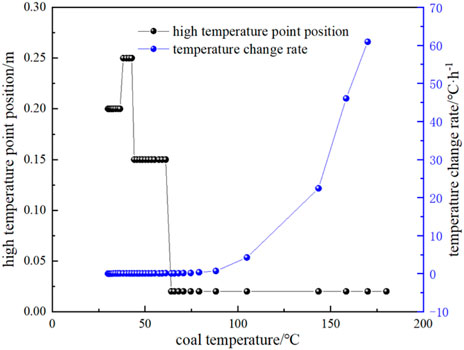
FIGURE 5. Experimental high-temperature point temperature and temperature change rate with coal temperature.
From Figure 3, Figure 4 and Figure 5, it can be seen that the temperature of coal rises very slowly during low-temperature oxidation, and the temperature of coal rises generally not more than 0.5 °C per day before 35 °C, and about 1.2 °C per day after 40 °C, and the daily heating rate is generally increased gradually compared with the previous day. When the experiment was carried out on the 30th day, the maximum temperature inside the coal sample reached 74.59 °C, and the heating rate of the coal sample was accelerated significantly, and this temperature was the critical temperature for the acceleration of the autothermal heating of coal oxidation. When the experiment reached 33 days, the maximum temperature of the coal sample reached 104.93 °C, and the heating rate of the coal sample began to increase rapidly again, at which time the coal sample entered the dry cracking temperature and C2H4 gas already appeared. At 33.9 days, the heating rate was dramatically accelerated, and the corresponding coal temperature is 143.5 °C, that is, the cracking temperature.
It can also be seen that the heating rate is 0.7 °C/h when the coal temperature exceeds 104.93 °C, and the heating rate is 4.2 °C/h and 46.08 °C/h at 143.48 °C and 169.96 °C, respectively, and reaches 60.96 °C/h when the coal temperature exceeds 180.12 °C. In addition, in the process of spontaneous combustion experiment, the temperature difference in the coal at the initial stage of air intake is very small, and the overall temperature of the coal rises slowly, gradually showing a slightly higher temperature in the middle. When the highest temperature of the coal sample reached about 64 °C, the high-temperature point began to move down from the middle to the bottom near the inlet air.
During the natural temperature rise, the various index gases and their corresponding maximum furnace temperatures at the top take-off point of the experimental furnace are shown in Figure 6 and Figure 7. Figure 6 is the relationship between the outlet gas (O2, CO, CO2) concentration and coal temperature, and Figure 7 shows the organic gas (C2H4, C2H6, CH4) concentration versus coal temperature. It can be seen that CO gas starts to appear at the beginning of the experiment, and the concentration of CO gas increases exponentially during the heating process, which can be used as an index gas. And CH4 and C2H6 start to appear in large quantities at the beginning of heating, accompanying the whole experiment. With the increase of coal temperature, the gas concentrations of CH4 and C2H6 begin to decline, and C2H6 drops faster than CH4, indicating that coal contains adsorbed CH4 and C2H6, and C2H6 is adsorbed more, so they are not recommended to use them as the indicator gas. C2H4 starts to appear after 88.16 °C, and it increases with the increase of coal temperature.
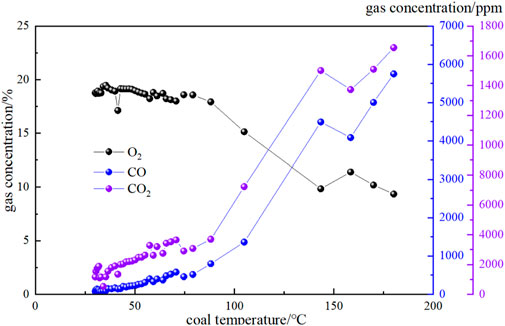
FIGURE 6. The relationship between outlet gas (O2, CO, CO2) concentration and coal temperature.
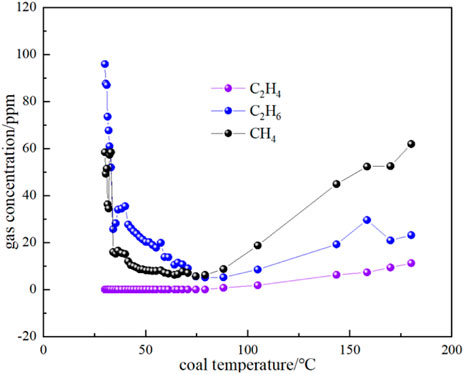
FIGURE 7. The relationship between organic gas concentration and coal temperature.
The relationship between various index gas ratios and coal temperature is shown in Figure 8. It can be seen that the CO2/CO value shows an overall decreasing trend with the increase of temperature, with a faster decrease in the early stage of the experiment and a slower change after the critical temperature point. Therefore, the CO2/CO value can be used to judge the trend of temperature change. C2H4/C2H6 shows an increasing trend with the increase of temperature after 88.16 °C. CH4/C2H6 changes more steadily in the early experimental period, increases faster after 60 °C, and changes fastest at the critical temperature point, and increases more slowly in the later period.
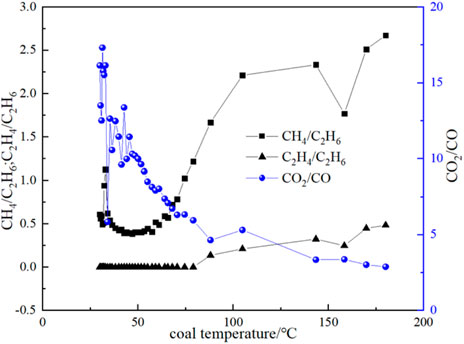
FIGURE 8. The relationship between index gas ratio and coal temperature.
The evaporation of water during the experiment was measured using a drying tube, and the heat taken away by the evaporation of water in the coal sample was:
Where, Q for the heat of vaporization of water, J, it with the increase in temperature decreasing; C for the specific heat capacity of water, J·g-1·°C−1;
Because the temperature difference is very small during the day, it can be neglected in the calculation. Therefore, heat removal by evaporation of water can be simplified as:
Figure 9 shows the relationship between water evaporation and the amount of heat taken away and the temperature. It can be seen that the water evaporation in the early stage of the experimental process is very little, and when the temperature is in the range of 74.59 °C–79.12 °C, the water evaporation starts to increase sharply, and the corresponding temperature is near the critical temperature. This indicates that: (1) The heat taken away by water evaporation near the critical temperature also increases sharply, and the heat taken away will also increase the temperature of the coal at other locations. (2) The evaporation of water increases the contact area between coal and oxygen, which promotes the oxidation of coal to warm up (Reich et al., 1992). On the other hand, as the temperature rises, the water produced by the intrinsic moisture and oxidation reaction of the coal also begins to precipitate. According to the industrial analysis, it is known that the water content of the Huangling coal sample is 3.51%, and the proportion of actual water evaporation is about 4.6%, which indicates that the proportion of crystallized water as well as water produced by oxidation reaction in the later coal is about 1.1%.
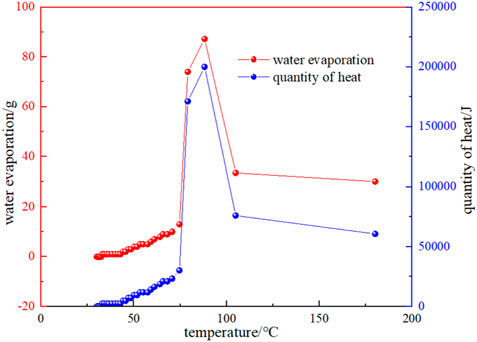
FIGURE 9. Relationship between the evaporation of water and the amount of heat taken away and temperature.
The variation of CO and CO2 production rates with coal temperature is shown in Figure 10. It can be seen that the CO and CO2 production rates do not change much when the coal temperature is below the critical temperature of 74.59 °C, while the gas production rate starts to increase gradually when the critical temperature is exceeded. It can be seen that the production rate of CO2 is higher than that of CO for the following reasons: (1) During coal combustion, carbon and hydrogen react with oxygen to form carbon dioxide and water vapor. However, at high temperatures, the reactive material in the coal may not burn completely, resulting in the formation of CO. Although CO is also one of the combustion products, it is easier to form than CO2. Therefore, at high temperatures, the carbon in coal can be more easily converted into CO2. (2) The rate of chemical reaction usually increases with the increase of temperature. When the coal temperature exceeds the critical temperature, the reaction rate increases, including the rate of CO2 generation. Higher temperatures can provide more activation energy, making the reaction rate increase. (3) The generation of CO depends on the availability of oxygen in the coal, when the coal temperature exceeds the critical temperature, oxygen can more fully react with the carbon in the coal to form CO2. At low temperatures, the availability of oxygen is low, so the rate of CO2 production is relatively high. By substituting the experimental test parameters of the kilogram-level coal spontaneous combustion experimental device, the oxygen concentration, and CO and CO2 production parameters during the natural temperature rise into Equations 19–22, the oxygen consumption rate and the exothermic intensity during the coal spontaneous combustion experiment can be calculated (Figure 11; Figure 12). Figure 11 shows the relationship between oxygen consumption rate and coal temperature, and Figure 12 shows the relationship between maximum, minimum and actual exothermic intensity with coal temperature. It can be seen that the actual exothermic intensity is between the maximum exothermic and minimum exothermic intensities. When the exothermic in-tensity of oxidative spontaneous combustion of Huangling No.2 coal was calculated by the bond energy estimation method, the actual exothermic intensity was similar to the minimum leakage intensity before the critical temperature. This indicates that the coal-oxygen composite is dominated by chemisorption at the early stage of oxidation, and the actual exothermic intensity starts to be similar to the maximum exothermic intensity after reaching near the dry cracking temperature, and the coal-oxygen chemical reaction dominates at the later stage.
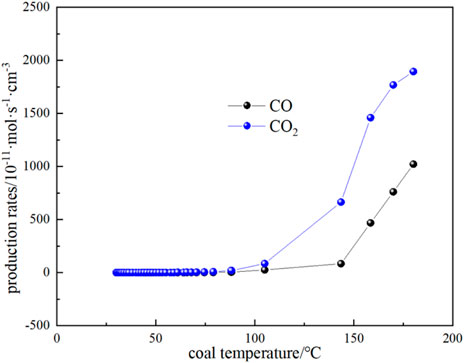
FIGURE 10. The relationship between CO and CO2 production rate and coal temperature in the process of coal natural heating.
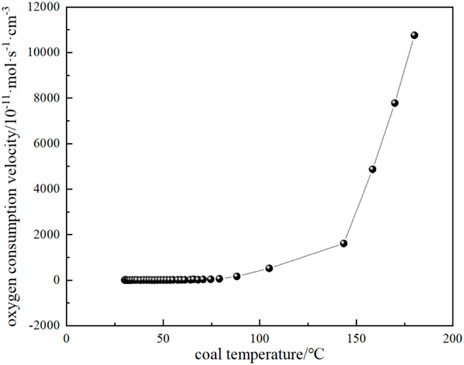
FIGURE 11. The relationship between oxygen consumption rate and coal temperature during coal natural heating.
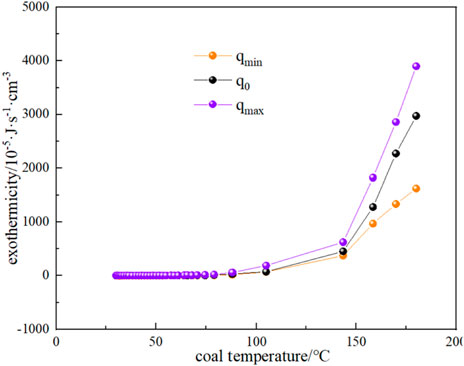
FIGURE 12. The relationship between the exothermic intensity of oxidative coal spontaneous combustion and coal temperature.
Substituting the oxygen consumption rate and exothermic intensity results of Figure 11 and Figure 12 into Eq. 23 and Eq. 24, the thermal conductivity of broken coal is taken as 0.85 × 10⁻³ J cm-1·s-1·K−1, and the ambient temperature of the coal seam is taken as 25 °C, the minimum oxygen concentration of each corresponding temperature and coal volume in the range of coal temperature from 30°C to 180 °C and coal volume thickness from 0.7 to 2 m can be obtained as shown in Figure 13, and the corresponding maximum air leakage intensity is shown in Figure 14. When the air leakage intensity is in the range of 4 × 10⁻⁴ to 0.02 cm3 cm-2·s-1, the limit coal thickness is obtained as shown in Figure 15.
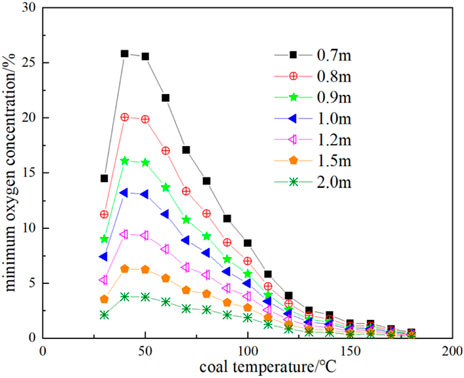
FIGURE 13. Minimum oxygen concentration at different coal thicknesses and corresponding coal temperatures.
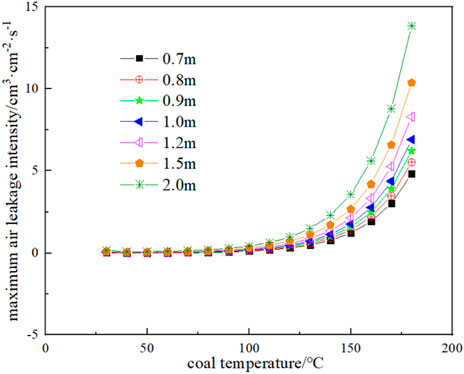
FIGURE 14. Maximum air leakage intensity at different coal thicknesses and corresponding coal temperature.
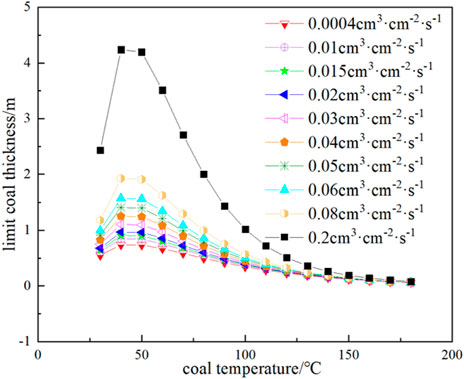
FIGURE 15. Ultimate coal thickness at the corresponding coal temperature and air leakage intensity.
It can be seen from Figure 13 that the greater the thickness of broken coal at the same temperature, the lower the minimum oxygen concentration necessary for CSC. In other words, a very low oxygen concentration can support the oxidative spontaneous combustion of coal. At a temperature of 30 °C and a floating coal thickness of 2m, a 3% oxygen concentration can still provide conditions for coal oxidation. Under the condition of 40 °C, 25.83% oxygen concentration is required for a 0.7 m floating coal, which is impossible to achieve under normal conditions, so it will not spontaneous combustion.
As can be seen from Figure 14, the greater the thickness of broken coal is, the greater the maximum air leakage intensity of CSC at a certain temperature is, that is, the thicker the floating coal is, the worse the heat dissipation of the coal body is, and the better the heat storage is. On the contrary, the smaller the thickness of floating coal, the lower the maximum air leakage intensity of CSC. The maximum air leakage intensity of the coal body at temperature 40 °C and 0.7 m is negative, which means that spontaneous combustion of the coal body is not possible under this condition.
It can be seen from Figure 15 that the greater the air leakage intensity within the coal body when the coal temperature is certain, the better the heat dissipation of the coal body, and the thickness of floating coal required for spontaneous combustion increases accordingly. On the one hand, it is due to the oxidation exothermic intensity of the coal body being large enough, and on the other hand, the heat storage of the coal body is ensured. 0.7 m floating coal thickness in the case of 40 °C is not likely to spontaneously combust, indicating that as long as the floating coal thickness is lower than 0.7m, spontaneous combustion will also not occur.
In this paper, the main macroscopic characterization parameters of coal spontaneous combustion were determined by testing Huangling No.2 coal using a self-designed kilogram-level coal spontaneous combustion experimental device, and the main conclusions were obtained as follows.
(1) The minimum amount of coal that causes thermal storage and warming is 1.32 kg, and the experimental system of natural oxidation and adiabatic heating of kilogram-level coal is designed, and the amount of coal required for the experiment is only 7–8 kg. Completed a small sample natural ignition test of Huangling No.2 coal, and measured the experimental natural ignition period of 34 days for this coal sample.
(2) On the 30th day of the experiment, the highest temperature in the coal sample reached 74.59 °C, which was the critical temperature for the acceleration of coal oxidation self-heating. When the experiment was carried out for 33 days, the maximum temperature of the coal sample was 104.93 °C. At this time, the coal sample entered the dry cracking temperature, and C2H4 gas had appeared. At 33.9 days, the heating rate accelerated sharply, and the corresponding coal temperature was 143.5 °C, which was the cracking temperature.
(3) The CO gas started to appear in the Huangling coal sample at the beginning of the experiment, and the increase of CO gas concentration was exponential during the heating process, which can be used as an index gas. The CO2/CO value showed an overall decreasing trend with the increase of temperature. It decreased rapidly in the early stage of the experiment and changed slowly after the critical temperature point. This ratio can be used to judge the trend of temperature change.
(4) In the early stage of oxidation, the coal-oxygen complex is dominated by chemical adsorption, and the actual exothermic intensity starts to be similar to the maximum exothermic intensity after near the dry cracking temperature, and the coal-oxygen chemical reaction dominates.
(5) Under the temperature condition of 40 °C, the floating coal of 0.7 m needs 25.83% oxygen concentration, and the maximum air leakage intensity of the coal body is negative, and no spontaneous combustion will occur.
The original contributions presented in the study are included in the article/supplementary material, further inquiries can be directed to the corresponding author.
The author confirms being the sole contributor of this work and has approved it for publication.
The author declares that the research was conducted in the absence of any commercial or financial relationships that could be construed as a potential conflict of interest.
All claims expressed in this article are solely those of the authors and do not necessarily represent those of their affiliated organizations, or those of the publisher, the editors and the reviewers. Any product that may be evaluated in this article, or claim that may be made by its manufacturer, is not guaranteed or endorsed by the publisher.
Chen, X. K., Li, H. T., Wang, Q. H., and Zhang, Y. N. (2018). Experimental investigation on the macroscopic characteristic parameters of coal spontaneous combustion under adiabatic oxidation conditions with a mini combustion furnace. Combust. Sci. Technol. 190 (4-6), 1075–1095. doi:10.1080/00102202.2018.1428570
Davis, J. D., and Byrne, J. F. (2010). An adiabatic method for studying spontaneous heating of coal. J. Am. Ceram. Soc. 7 (11), 809–816. doi:10.1111/j.1151-2916.1924.tb18175.x
Deng, J., Li, B., Xiao, Y., Ma, L., Wang, C. P., Bin, L. W., et al. (2017). Combustion properties of coal gangue using thermogravimetry- Fourier transform infrared spectroscopy. Appl. Therm. Eng. 116, 244–252. doi:10.1016/j.applthermaleng.2017.01.083
Deng, J., Xiao, Y., Li, Q. W., Lu, J. H., and Wen, H. (2015). Experimental studies of spontaneous combustion and anaerobic cooling of coal. Fuel 157, 261–269. doi:10.1016/j.fuel.2015.04.063
Lei, C. K., Deng, J., Cao, K., Ma, L., Xiao, Y., and Ren, L. F. (2018). A random forest approach for predicting coal spontaneous combustion. Fuel 223, 63–73. doi:10.1016/j.fuel.2018.03.005
Lei, C. K., Jiang, L. J., Bao, R. Y., Deng, C. B., and Wang, C. B. (2023). Study on multifield migration and evolution law of the oxidation heating process of coal spontaneous combustion in dynamic goaf. ACS Omega 8 (15), 14197–14207. doi:10.1021/acsomega.3c01107
Li, J. L., Lu, W., Cao, Y. J. Z., Kong, B., and Zhang, Q. S. (2019). Method of pre-oxidation treatment for spontaneous combustion inhibition and its application. Process Saf. Environ. Prot. 131, 169–177. doi:10.1016/j.psep.2019.08.013
Li, X., Sun, W. M., and Yang, Z. (2022). Numerical simulation of the dynamic change law of spontaneous combustion of coal gangue mountains. ACS Omega 7, 37201–37211. doi:10.1021/acsomega.2c03251
Liu, W. Y., Zhang, W. Z., Ma, S., and Zhang, Z. (2022). Reference test method for calculating the thermal effect of coal spontaneous combustion. Energies 15, 7707. doi:10.3390/en15207707
Liu, Y., Wen, H., Guo, J., Jin, Y. F., Wei, G. M., and Yang, Z. W. (2020). Coal spontaneous combustion and N2 suppression in triple goafs: A numerical simulation and experimental study. Fuel 271, 117625. doi:10.1016/j.fuel.2020.117625
Ma, T., Chen, X. K., Zhai, X. W., and Bai, Y. (2019). Thermogravimetric and infrared spectroscopic studies of the spontaneous combustion characteristics of different pre-oxidized lignites. RSC Adv. 9 (56), 32476–32489. doi:10.1039/C9RA05993H
Martini, D. D. (2008). Evaluating the risk in sample size determination. Commun. Statistics Simul. Comput. 37 (9), 1776–1784. doi:10.1080/03610910802296505
Onifade, M., and Genc, B. (2020). A review of research on spontaneous combustion of coal. Int. J. Min. Sci. Technol. 30 (3), 303–311. doi:10.1016/j.ijmst.2020.03.001
Reich, M. H., Snook, I. K., and Wagenfeld, H. K. (1992). A fractal interpretation of the effect of drying on the pore structure of Victorian brown coal. Fuel 71 (6), 669–672. doi:10.1016/0016-2361(92)90170-S
Ren, L. F., Li, Q. W., Xiao, Y., Hao, J. C., Yi, X., Zou, L., et al. (2022). Critical parameters and risk evaluation index for spontaneous combustion of coal powder in high-temperature environment. Case Stud. Therm. Eng. 38, 102331. doi:10.1016/J.CSITE.2022.102331
Song, Z. Y., Huang, X. Y., Jiang, J. C., and Pan, X. H. (2020). A laboratory approach to CO2 and CO emission factors from underground coal fires. Int. J. Coal Geol. 219, 103382. doi:10.1016/j.coal.2019.103382
Wang, J. F., Zhou, C. S., Ma, L. Y., Zhang, Y. L., and Wang, J. (2022). Fire-prevention characteristics of an active colloid prepared from stimulated fly ash component. ACS Omega 7, 1639–1647. doi:10.1021/acsomega.1c03299
Wang, Y. C., Zhong, K. Q., Xiao, Y., Lai, X. P., and Li, Q. W. (2023). Determining the spontaneous combustion period and limit parameters of coal: A large-scale furnace experiment. Combust. Sci. Technol. 195 (3), 494–507. doi:10.1080/00102202.2021.1963961
Wen, H., Yu, Z. J., Deng, J., and Zhai, X. W. (2017). Spontaneous ignition characteristics of coal in a large-scale furnace: an experimental and numerical investigation. Appl. Therm. Eng. 114, 583–592. doi:10.1016/j.applthermaleng.2016.12.022
Wu, Z. Y., Hu, S. S., Jiang, S. G., He, X. J., Shao, H., Wang, K., et al. (2018). Experimental study on prevention and control of coal spontaneous combustion with heat control inhibitor. J. Loss Prev. Process Industries 56, 272–277. doi:10.1016/j.jlp.2018.09.012
Xiao, Y., Li, Q. W., Deng, J., Shu, C. M., and Wang, W. (2017). Experimental study on the corresponding relationship between the index gases and critical temperature for coal spontaneous combustion. J. Therm. Analysis Calorim. 127, 1009–1017. doi:10.1007/s10973-016-5770-6
Zeng, Q., Pu, Y., and Cao, Z. M. (2018). Kinetics of oxidation and spontaneous combustion of major super-thick coal seam in Eastern Junggar Coalfield, Xinjiang, China. J. Loss Prev. Process Industries 56, 128–136. doi:10.1016/j.jlp.2018.08.013
Zhai, X. W., Ge, H., Shu, C. M., Obracaj, D., Wang, K., and Bin, L. W. (2020). Effect of the heating rate on the spontaneous combustion characteristics and exothermic phenomena of weakly caking coal at the low-temperature oxidation stage. Fuel 268, 117327. doi:10.1016/j.fuel.2020.117327
Zhang, D., Yang, X. S., Deng, J., Wen, H., Xiao, Y., and Jia, H. (2020). Research on coal spontaneous combustion period based on pure oxygen adiabatic oxidation experiment. Fuel 288, 119651. doi:10.1016/j.fuel.2020.119651
Zhang, Y. N., Shu, P., Li, H. T., Liu, C. H., and Zhang, F. (2021b). Numerical prediction and experimental validation of the low-temperature oxidation characteristics of coal in a large-scale furnace in an adiabatic environment. Combust. Sci. Technol. 194, 2539–2557. doi:10.1080/00102202.2021.1880396
Zhang, Y. N., Wang, A. P., Chen, L., and Liu, C. H. (2021a). Study of thermal characteristics and functional group changes of Yanghuopan Coal during spontaneous combustion. J. Therm. Analysis Calorim. 252, 3753–3761. doi:10.1007/s10973-021-10802-6
Zhang, Y. T., Zhang, J., Li, Y. Q., Gao, S., Yang, C. P., and Shi, X. Q. (2021). Oxidation characteristics of functional groups in relation to coal spontaneous combustion. ACS Omega 6, 7669–7679. doi:10.1021/acsomega.0c06322
Keywords: coal spontaneous combustion, macro-featured parameters, kilogram-level, oxygen consumption rate, exothermic intensity
Citation: Xu Y (2023) Determination and analysis of macro-featured parameters based on kilogram-level coal spontaneous combustion experiment. Front. Mater. 10:1247381. doi: 10.3389/fmats.2023.1247381
Received: 26 June 2023; Accepted: 04 September 2023;
Published: 15 September 2023.
Edited by:
Liming Dai, Case Western Reserve University, United StatesReviewed by:
Feng Du, Southeast University, ChinaCopyright © 2023 Xu. This is an open-access article distributed under the terms of the Creative Commons Attribution License (CC BY). The use, distribution or reproduction in other forums is permitted, provided the original author(s) and the copyright owner(s) are credited and that the original publication in this journal is cited, in accordance with accepted academic practice. No use, distribution or reproduction is permitted which does not comply with these terms.
*Correspondence: Yanhui Xu, eWFuaHVpX3gyQDE2My5jb20=
Disclaimer: All claims expressed in this article are solely those of the authors and do not necessarily represent those of their affiliated organizations, or those of the publisher, the editors and the reviewers. Any product that may be evaluated in this article or claim that may be made by its manufacturer is not guaranteed or endorsed by the publisher.
Research integrity at Frontiers
Learn more about the work of our research integrity team to safeguard the quality of each article we publish.