 Jian Wang
 Jianfeng He1,2
95% of researchers rate our articles as excellent or good
Learn more about the work of our research integrity team to safeguard the quality of each article we publish.
Find out more
ORIGINAL RESEARCH article
Front. Mater. , 16 October 2023
Sec. Polymeric and Composite Materials
Volume 10 - 2023 | https://doi.org/10.3389/fmats.2023.1242721
This article is part of the Research Topic Injection Molding of Polymeric and Composite Materials View all 6 articles
Transparent polymeric materials have gained significant popularity as replacements for glass in various industries due to their low cost, lightweight nature, and high processing efficiency. Injection molding is the primary method for producing transparent polymer parts. However, residual stress often poses a challenge, leading to various defects. Traditional approaches utilize photoelasticity and polarizers to determine stress in transparent parts, which costs time and cannot be easily used for online monitoring and real time quality inspection. The digital image processing (DIP), combined with photoelasticity, offers a promising solution for detecting residual stress and assessing product quality in real-time during manufacturing. In this study, we propose a photoelastic digital image processing (PDIP) approach that combines photoelasticity and DIP techniques to identify residual stress and evaluate part quality using a single digital polarized image without the need for a rotation process. By collecting and analyzing the gray values and variations from the photoelastic images through PDIP, we compared and correlated the gray values of the entire image, a specific area on one side lens, a warp line, and a weft line. Additionally, numerical simulations were performed to validate the proposed method. The results demonstrated the feasibility of this instant identification method. The PDIP technique should be applied to a specific area or line within the parts. By obtaining the average gray value, the instantaneous identification of residual stress can be achieved. The determination of the specific area or line can be tailored according to the quality requirements of the parts.
Transparent polymer materials, such as epoxy resin, phenolic resin, polyester, polyethylene terephthalate, and polycarbonate, have gradually replaced glass in various industries due to their lower cost, lighter weight, and higher efficiency (Zhang et al., 2021; Peixoto et al., 2022). These materials find applications in diverse fields such as electrical and electronics, automotive, agriculture, consumer goods, medical devices, and aerospace (Zhang et al., 2021; Peixoto et al., 2022). Injection molding is the predominant manufacturing process used for producing transparent polymer products. However, the injection molding process is complex and often leads to the generation of residual stress within the product, resulting in quality defects such as birefringence, warping, and deformation that can significantly impact optical performance (Guevara-Morales and Figueroa-López, 2014). Particularly for optical lenses and goggles used in precise devices or by humans, these defects have a substantial influence on their functional applications (Peixoto et al., 2022).
Extensive research has been conducted in recent years to investigate the residual stress and warpage deformation of polymer injection-molded products. Kim and Min (2017) examined the thermal deformation mechanism of injection-molded parts and established that residual stress generated during the injection molding process is a primary cause of permanent deformation. Peixoto et al. (2022) provided a comprehensive overview of the latest advancements in the field of residual stress analysis in polymer injection-molded products, highlighting the significant impact of heat and flow-induced residual stress on the final products. The influence of residual stress varies depending on factors such as material properties, processing methods, shape, and dimensions. Detecting residual stress in products and optimizing production processes are crucial tasks to identify defects and improve product quality (Pak et al., 2013; Akahori et al., 2018).
While destructive methods like the hole drilling method have been employed for residual stress measurement, they are expensive, limit the reusability of parts, and are not suitable for small and complex components. The indentation method, a commonly used non-destructive testing method, has shown effectiveness in measuring residual stress in small-sized and complex geometries (Pak et al., 2013; Akahori et al., 2018). In comparison, the photoelasticity technique offers significant advantages for measuring residual stress in transparent polymer parts for practical applications. This non-destructive testing method enables the analysis of transparent or translucent plastic materials without altering their properties (Macías et al., 2015; Prasath et al., 2018). The ASTM D4093-95 standard describes photoelasticity as a method to determine residual stress by utilizing the effect of double refraction and measuring the direction of principal strains using a compensator (Macías et al., 2015). Transparent polymer materials exhibit photoelastic behavior, wherein the refractive index changes under load, resulting in stress birefringence. By employing a polarizer and subjecting the product to polarized light, an optical path difference is generated at points where residual stress is present. The magnitude and distribution of stress can be calculated using the stress optical law (Ghali et al., 2003; Ramesh and Sasikumar, 2020). Photoelasticity allows for the visualization and quantification of full-field residual stress distribution in injection-molded samples, enabling process monitoring, stress reduction, and improvement of part quality. Lu and Khim (2001) conducted experimental research to explore the impact of molding conditions on the surface contours of injection molded PC lenses. They employed a specialized polarimeter for measuring birefringence to assess residual stress within the lenses. The research approach incorporated statistical methods to systematically investigate how various process parameters influenced errors in lens contour. These contour errors were then correlated to both mold shrinkage and the presence of residual stress within the molded lenses. Macías et al. (2015) analyzed the residual stresses in PC cover lenses used in automotive. Their analysis utilized both photoelasticity and chemical attack methods considering the multiple characteristics of the plastic cover lenses, such as complex geometry, size and wall thickness. The findings contributed to the development of a technique aimed at alleviating stress in these PC cover lenses. Vargas-Isaza et al. (2023) delved into a comprehensive assessment of residual stress distribution in PC components manufactured under different molding conditions. They harnessed digital photoelasticity along with sophisticated computational algorithms to attain quantitative results. This approach allowed for a detailed understanding of how various molding conditions influenced the overall distribution of residual stress in PC parts.
However, photoelasticity has certain limitations, such as the requirement for relatively simple and plate-like part geometries for accurate stress analysis (Ajovalasit et al., 2015), and its applicability in manufacturing processes is challenging due to the need for specialized equipment, including a polarimeter with a rotation analyzer, circular scale apparatus, and compensator (Ajovalasit et al., 2015). The imperative to enhance product quality has compelled manufacturers to elevate the control level applied to both finished and semi-finished components, encompassing both qualitative and quantitative aspects. The adoption of digital image processing (DIP) emerges as an efficacious technique, not only augmenting the consistency and dependability of inspections but also enabling the extraction of valuable insights through DIP algorithms (Sasso et al., 2011). Furthermore, the utilization of DIP technology has the potential to substantially reduce the overall duration required for quality control, while simultaneously expanding the scope of inspected components. In instances where image acquisition and post-processing occur in real time, it becomes conceivable to exercise comprehensive control over the entire production process. Additionally, to address the limitations of traditional photoelasticity, the digital image correlation (DIC) technique offers a real-time, online experimental analysis method for stress analysis of transparent products (Zuo et al., 2022). By combining traditional holographic photoelasticity methods with DIC technology and rotating the polarization direction of the reference light, a digital holographic photoelasticity non-destructive testing method has been proposed for measuring residual stress in transparent regions (Thomas et al., 2019). However, the rotational process for measurements still incurs time costs, and accurately determining the residual stress in transparent parts with complex geometries using digital photoelasticity remains challenging. If the focus is shifted from precise residual stress measurement to quality assessment, a quick DIP method can be employed to verify part quality using a single photo without rotation. In this case, the complex stress optical law can be ignored, and data such as gray values and their variations can be directly utilized to determine part quality. This technique, termed digital photoelastic image correlation (PDIP), enables real-time monitoring of transparent parts with complex geometries.
Based on the principles of photoelasticity, this work proposed the PDIP method, which combines photoelasticity with image recognition, for measuring and characterizing residual stress. Polycarbonate (PC) goggles were selected as the sample for demonstration purposes. Compared to optical lenses, PC goggles exhibit complex geometries, particularly in the mirror surface, which is irregularly shaped, leading to a complex distribution of residual stress. The PDIP technique was applied to elucidate the formation mechanism of residual stress. Additionally, design of experiment (DOE), numerical simulation, and correlation calculations were performed to validate the stress results and analyze the precise relationship between residual stress and warpage in the injection-molded PC goggles.
Polycarbonate (PC) pellets (model number: LEXANTM PC LS2-111, SABIC) with a density of 1.2 kg/m³ at room temperature and a melt flow index (MFI) of 11 g/10 min were selected for this study. The PC material exhibits a shrinkage of 0.5% in the machine direction (MD) and 0.7% in the transverse direction (TD). The PC material has a high transmittance of 88% and a refractive index of 1.581.
The mold used for manufacturing the goggles, along with the goggles themselves, are depicted in Figure 1. The goggles have dimensions of 218 mm × 161 mm × 38 mm. The cavity structure of the mold includes two lenses and two temple legs, corresponding to the composition of the goggles. The quality assessment of the bonded lenses is a particular focus of this research. Figure 1A illustrates the mold model. Figure 1B showcases the mold cavity and the cooling channels. The actual mold and the goggles part can be observed in Figures 1C, D, respectively.
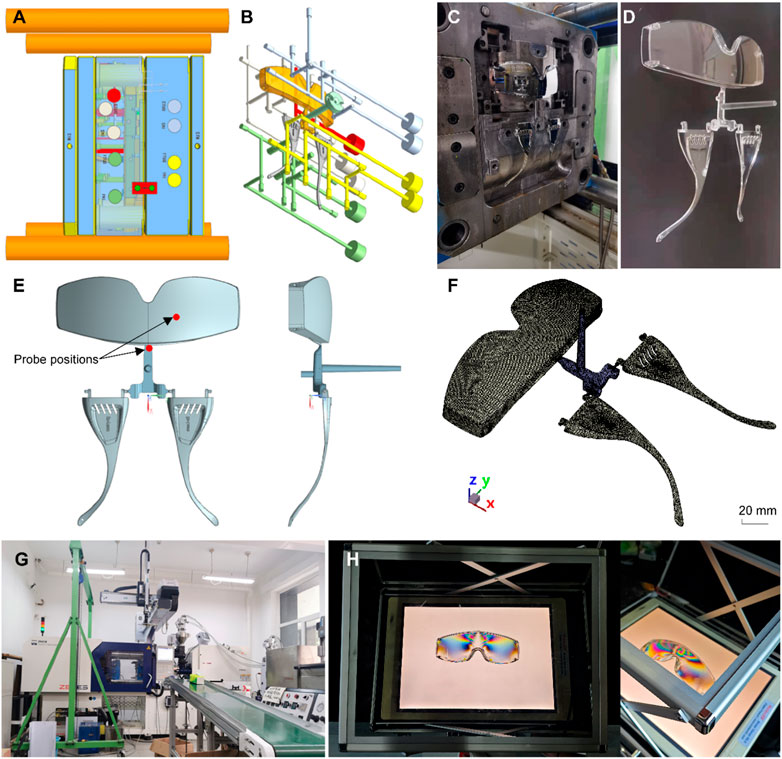
FIGURE 1. Mold model (A), the mold cavity and the cooling channels (B), the real mold (C), the goggles part (D), the CAD model of the cavity (E), the mesh model of the goggles (F), the injection molding machine (G), and the stress viewer (H).
An electrohydraulic hybrid injection molding machine (Model ZE1200, Ningbo Changfeiya Plastic Machinery Manufacturing Co., Ltd.) was utilized for the production of the PC goggles. Figure 1G shows the injection molding machine. To support the molding process, the following equipment was employed: a mold temperature controller (Model STM-910W) and a robot arm (Model ST3-700-1400-S) provided by Xinyi Electric Heating Machinery Co., Ltd., along with a dehumidifying dryer (Model SCD-40U/30H-OP).
The quality of the goggles is significantly influenced by five main and controllable process parameters: mold temperature, melt temperature, injection velocity, pressure packing time, and cooling time. In order to study the impact of these factors on residual stress and warpage deformation of the goggles, a design of experiments (DOE) approach was employed. Each factor was tested at four levels. The DOE utilized an orthogonal table L16 (45), as presented in Table 1, consisting of 16 groups.
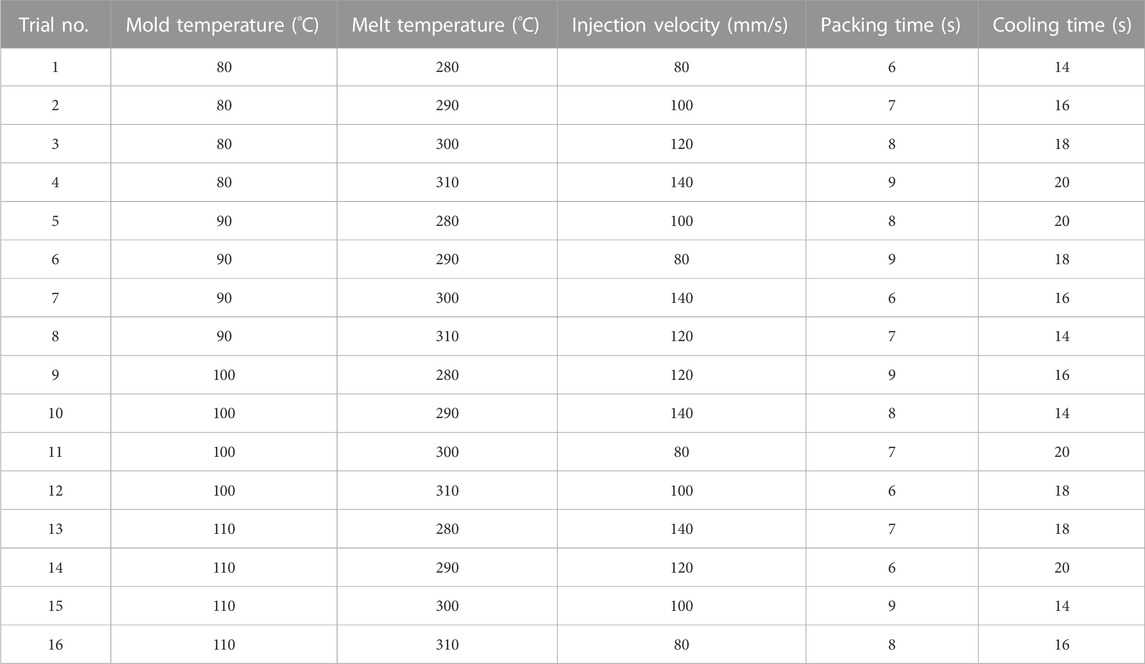
TABLE 1. Injection molding parameters of the orthogonal DOE for the production of goggles.
Based on practical production considerations, it was observed that mold temperatures below 70°C resulted in higher residual stress within the product. Conversely, excessively high mold temperatures prolonged the injection molding cycle. Hence, the mold temperature setting range was established as 80°C–110°C. In terms of melt temperature, temperatures below 270°C affected the melt’s fluidity, while temperatures exceeding 315°C led to casting issues in the injection molding machine head, thereby affecting production stability. Consequently, the melt temperature range was set at 280°C–310°C. Injection velocity and injection pressure are interconnected process parameters. During the actual molding process, if the injection pressure setting value does not exceed the required pressure, it functions as a pressure control system, resulting in poor injection velocity stability. On the other hand, if the injection pressure setting exceeds the required pressure, the actual pressure corresponds to the injection velocity, indicating an injection velocity control system. To ensure sufficient melt pressure for cavity filling, the process was set as a speed control system, with an injection pressure of 200 MPa and an injection velocity range of 80–140 mm/s. Inappropriate holding pressure or packing time can lead to flash formation due to overfilling or shrinkage and deformation of the product. Based on production experience, the holding pressure was set at 80% of the injection pressure, the packing time range was established as 6–9 s, and the cooling time was set to 14–20 s.
The injection molding process of the goggles was simulated using Moldex 3D software (CoreTech System Co., Ltd.). The software’s database provided the necessary material data for PC. The simulation encompassed the filling, packing, cooling, and warping stages. To facilitate comparison with the experimental results, the calculated maximum stress and warpage were considered as the two primary parameters of interest.
Figure 1E showcases the CAD model of the cavity. Two probe positions were selected for analysis: one at the surface of the lenses and another near the gate, as depicted in Figure 1E. The stress and warpage values at these two probe positions were utilized for further analysis and discussion. Figure 1F illustrates the mesh model of the goggles. The process conditions outlined in Table 1 were implemented in the simulation. Through the DOE analysis, an optimized condition was identified for subsequent simulations, ultimately leading to the achievement of the final optimized result.
The residual stress of the PC goggles was measured to validate the accuracy of the numerical simulation using the hole drilling method in accordance with ASTM E 837-13a standards. Two samples (labeled as No. 6 and No. 8 from the orthogonal DOE) were dispatched to the Beijing Qingxi Technology Research Institute for this measurement. A hole-drilling strain rosette of Type B was affixed to the center of one lens of the goggles, as depicted in Figure 2A. The process involved employing a typical hole-drilling apparatus and recording the associated relieved strains at specified hole depth increments of 0.1 mm using a strain-recording instrument. A drilling cutter with a diameter of 1.5 mm was utilized to create a hole at the center of the strain rosette. The residual stresses within the workpiece exhibited variation along the drilling depth. The entire drilling procedure lasted approximately 2 min. When the hole reached a depth of 1 mm, drilling was halted, and readings from each strain gauge (ε1, ε2, and ε3) were recorded, as illustrated in Figure 2B. Subsequently, the stress (σ) was computed using the equations specified in the ASTM E 837-13a standard.
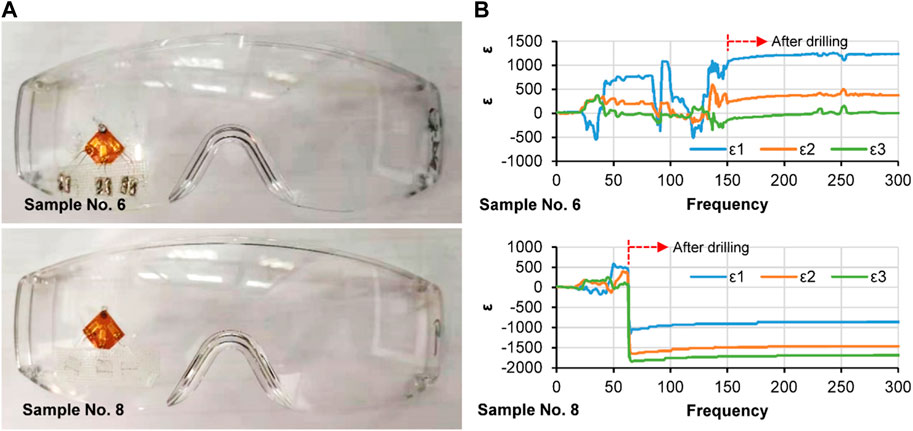
FIGURE 2. PC goggles samples for the measurement of residual stress by hole drilling method (A), and the strain curves of the rosettes on the samples No. 6 and No. 8 (B).
A polarized stress viewer (Model: Stress Viewer R5.0, Kesheng Technology Co., Ltd., as shown in Figure 1H) and a cellphone camera (Huawei P30Pro) were utilized to capture photoelastic pictures of the goggles for PDIP analysis. The camera shooting angle was aligned with the horizontally positioned goggles to maintain consistency. To eliminate external interference, the shooting process was conducted in the absence of ambient lighting. To ensure stability, the phone and the sample were consistently positioned on the polarizer.
For the PDIP technique, grayscale images of the conjoined lenses were generated, maintaining the same resolution size. The color in the images was represented by the grayscale value, corresponding to the brightness of each pixel. Following the conversion of the grayscale matrix, we employed the IMTOOL function to generate a more intricate RGB composition map that accurately represents each pixel within the image. The range of the analysis area was determined according to the color gamut value of the image, and each set of positioning color point coordinate images were used as positioning boundary coordinates. The resulting PDIP map is presented in Figure 3. Each point in the matrix obtained after grayscale processing of the lens acquisition area denoted the grayscale value for the corresponding position. An integer ranging from 0 to 255 was assigned to the 8-bit data type. Three different investigations were conducted using the grayscale values. Firstly, the correlation between the grayscale values of the entire image and the residual stress, as well as the effects of injection molding process parameters, were examined. Secondly, the grayscale values along the oblique line (red line in Figures 3A, B) were analyzed, and the number of valley peaks along this line was counted, corresponding to the fringe number. The yellow points in Figure 3B were selected for counting purposes. Thirdly, the grayscale values within a specific area were investigated. As the lenses represent the main areas where light passes through the human eyes, one side surface of the conjoined lenses (blue frame) was chosen as the specific area. For comparative analysis, data along a horizontal line and a vertical line were collected, related to the gray values along the warp line (orange line) and weft line (yellow line) inside the specific area. The boundary coordinates of the lens area were defined from (330, 300) to (830, 900), as depicted in Figure 3A. A total of 360,000 points were collected, and the expected values were calculated based on the grayscale values of each point. The collection area along the horizontal line (weft line) spanned from (580, 300) to (580, 900), while the collection area along the vertical line (warp line) extended from (330, 600) to (830, 600). A total of 600 and 500 points were collected along the weft line and warp line, respectively. A frequency distribution with 256 grayscale levels was generated to ensure diversity. The points in the acquisition area were sorted according to brightness, ranging from 0 to 255, and frequency statistics were performed for each brightness level. A frequency distribution graph was generated, displaying the frequency of gray values (ranging from 0 to 255) in the specific area (Figure 3C). The gray values along the warp line and weft line are shown in Figures 3D, E, respectively. The average and variance of the gray values across the entire acquisition area were calculated for the subsequent analysis. The average value reflects the overall situation of the lens photoelastic fringe and corresponds to the stress experienced. The variance of the values indicates the fluctuations in fringes throughout the lens area, reflecting the corresponding stress fluctuations.
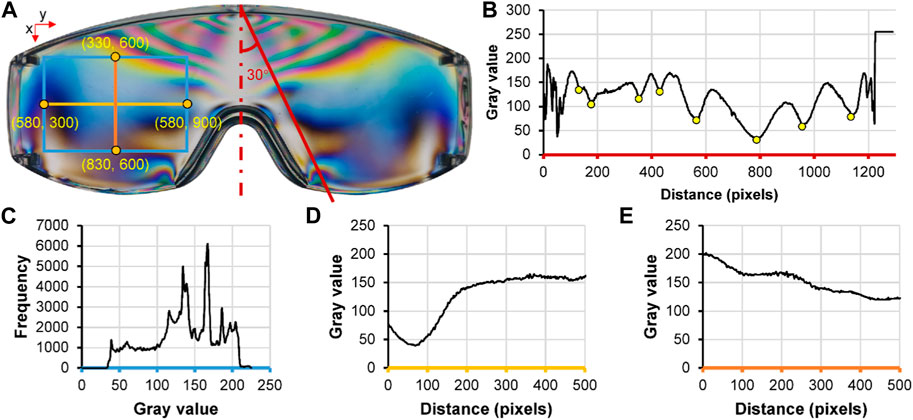
FIGURE 3. The photoelastic image of one sample with the lines and fram for data collection (A), the gray value changing along the oblique line (B), the frequency of the gray values from 0 to 255 in the specific area of the blue frame (C), the gray value changing along the weft line (D) and the warp line (E).
During the DOE experiments, a total of 16 groups of samples were prepared, with four samples per group to account for potential errors. For each group, four samples were selected for photoelastic image capture. Through PDIP, the expected gray values and variance data were collected. The average value of each group’s data was utilized for the DOE analysis.
Theoretically, the data collected from each set of process parameters designed for the experiment (1–16 sets) should be consistent. However, variations in overall brightness may occur due to lighting or focusing issues during stress fringe capture, leading to an overall increase or decrease in the average value. Additionally, there may be cropping defects during image processing, resulting in unconventional changes in data acquisition, which can lead to analysis errors. When the mean and variance values fall within a reasonable range, the sample data collection is considered acceptable. If the mean value experiences sudden jumps while the variance remains stable, it indicates an issue with the lighting during the capture process. In such cases, the capture can be repeated or replaced with data from a backup sample. When both the mean and variance fluctuate significantly, it suggests a problem with the specific sample, potentially caused by experimental equipment or other interference factors. In such instances, the problematic sample is discarded, and a backup sample is selected for data collection. Following the data acquisition, anti-interference measures, and data extraction, the mean and variance of the gray values are employed for analysis.
Figure 4A illustrates the injection filling process in the numerical simulation, with a remarkably short filling time of only 0.738 s. By employing orthogonal DOE optimization, an optimal set of process parameters was identified (mold temperature: 80°C, melt temperature: 280°C, injection velocity: 140 mm/s, packing time: 9 s, and cooling time: 20 s) to minimize warpage and residual stress. The simulation results revealed that the residual stress in the produced goggles decreased by 59.7% compared to the preliminary process parameters, reaching 4.874 MPa. Moreover, the warpage deformation decreased by 74.2%, measuring only 0.18 mm. Figure 4B visually demonstrates the significant reduction in warpage. A sample was manufactured using the optimal process parameters, and the photoelastic image illustrates an improved distribution of residual stress across the goggles.
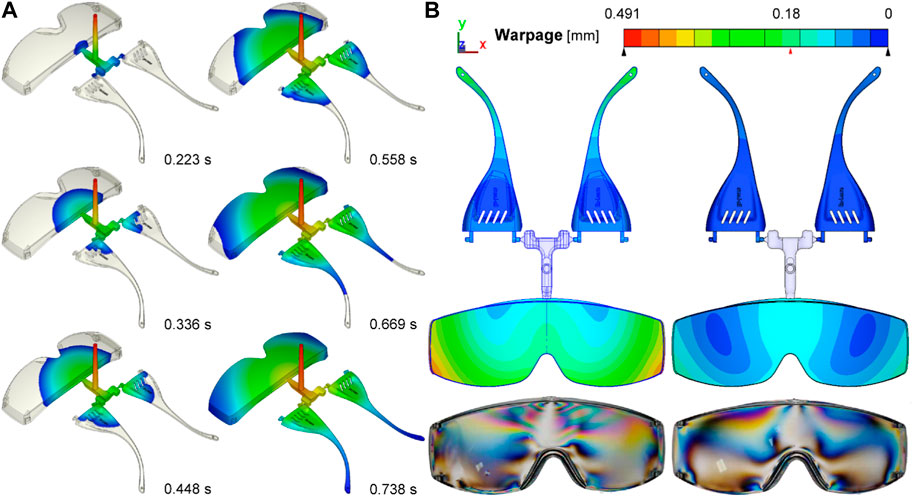
FIGURE 4. Injection filling process of the numerical simulation (A) and the comparison of warpage values, distributions, and the experimental parts prepared by the processing conditions without and with DOE optimization (B).
Table 2 displays the chosen outcomes from the numerical simulation for stress and warpage. The influence order of the five injection molding factors on the maximum residual stress of goggles was determined to be cooling time > melt temperature > packing time > injection velocity > mold temperature. Similarly, the order of influence on maximum warpage deformation of goggles was found to be melt temperature > injection velocity > cooling time > packing time > mold temperature. The order of influence of the factors on residual stress and warpage provides a valuable reference, but it is not an exact determinant due to variations in local residual stress and warpage, which are intricately linked to the cavity structure. Furthermore, the range of factor variations has a direct impact on the outcomes. The disparity in the influence order between residual stress and warpage suggests that the relationship between these two variables is non-linear. As the melt temperature increased, both residual stress and warpage deformation also increased. Conversely, increasing the injection velocity, packing time, and cooling time led to a decrease in residual stress and warpage deformation. The impact of mold temperature on these factors was not clearly discernible. This consistent trend in the influence of process parameter changes on residual stress and warpage deformation is attributed to the fact that warpage deformation is primarily caused by the release of internal residual stress within the product (Guevara-Morales and Figueroa-López, 2014).
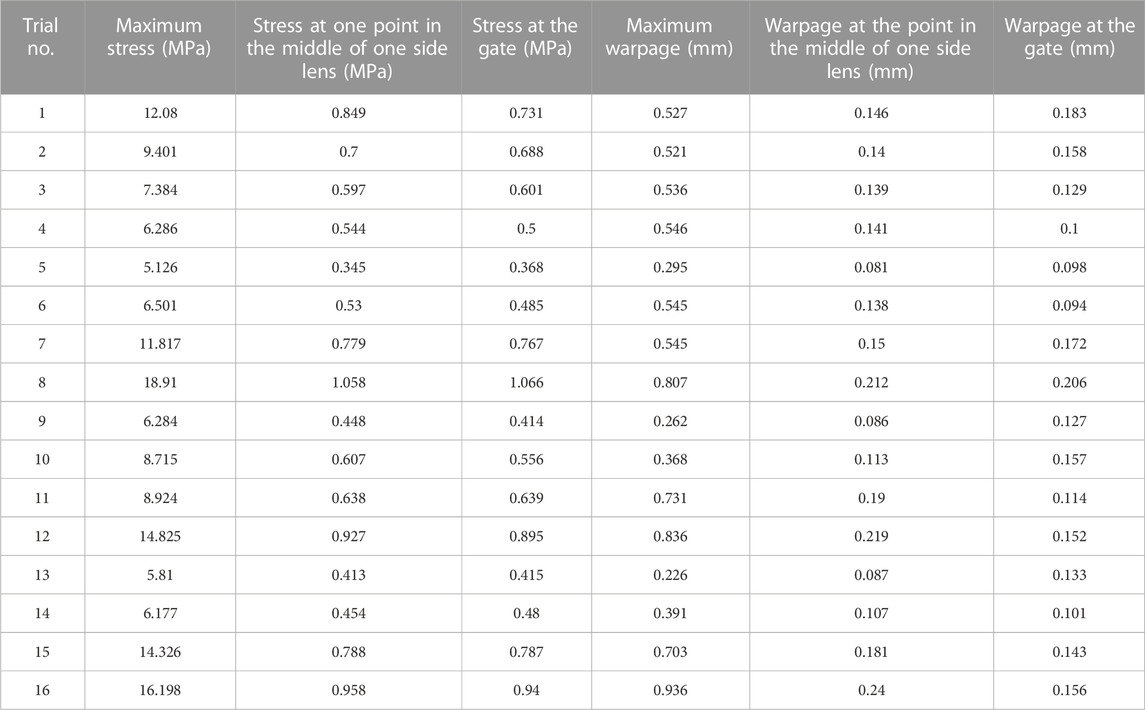
TABLE 2. Selected results of stress and warpage of the 16 groups as determined by numerical simulation.
The melt temperature plays a significant role in generating thermal stress in the plastic, making it the main contributor to warpage deformation in products (Kim and Min, 2017). Excessive melt temperature results in a large temperature difference within the plastic during the cooling process, leading to higher thermal stress in the product. The stress level remains relatively stable within the injection velocity range of 80–100 mm/s, but rapidly decreases within the range of 100–140 mm/s. At higher injection velocities, shear thinning occurs, reducing the melt viscosity under increased shear stress. This promotes a more uniform arrangement of molecular chains, thereby reducing residual stress. Longer packing time and cooling time contribute to reduced residual stress in the product. This phenomenon can be attributed to the natural recovery tendency of frozen and oriented molecular chains over time. The absence of mold release prevents the product from deviating from the mold cavity or the original shape of the plastic part, leading to a decrease in warpage deformation. Mold temperature, on the other hand, has minimal impact on the molecular chain structure of PC, an amorphous plastic, and therefore has limited influence on residual stress.
The DOE analysis of maximum stress and warpage of the injection molded PC goggles through simulation is shown in Figures 5A, D. The DOE analysis of stress and warpage at the two probe positions depicted in Figure 1E is presented in Figures 5B, C, E, F. The stress and warpage values at these points were considerably lower compared to the maximum stress and warpage observed in the overall sample. The effects of the five factors exhibited a similar trend, with the exception of the warpage at the gate, which displayed some variation due to the gate’s position coinciding with a singularity.
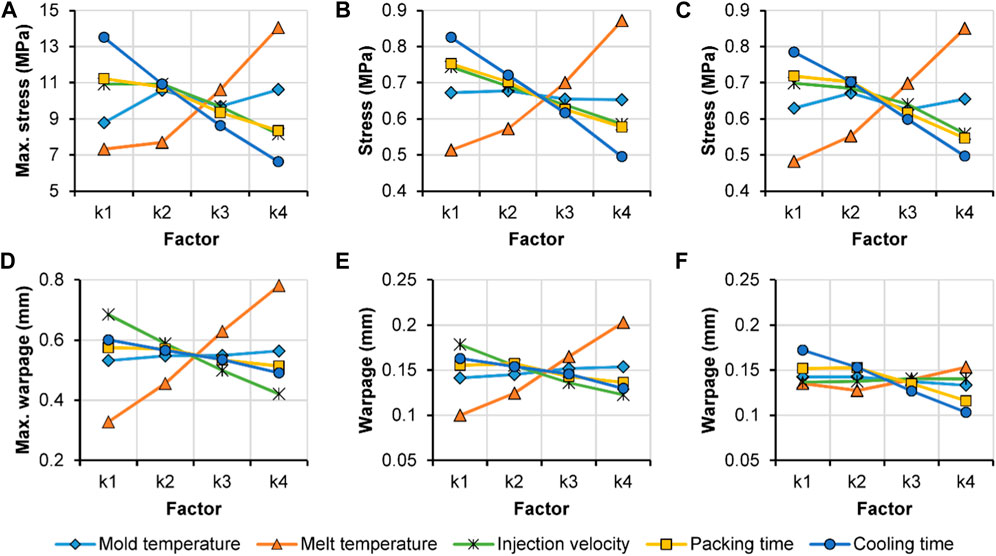
FIGURE 5. Maximum stress (A), stress at one point in the middle of one side lens (B), stress at the gate (C), maximum warpage (D), warpage at the point in the middle of one side lens (E), and warpage at the gate (F) of the injection molded PC goggles through simulation with DOE.
Table 3 presents the strains and stresses obtained from the hole drilling method for two samples, No. 6 and 8. The final residual stress for sample No. 6 was found to be 6.012 MPa, which closely aligns with the simulated value of 6.501 MPa. However, the residual stress measured for sample No. 8 was 7.059 MPa, which does not correlate with the maximum simulated residual stress value of 18.91 MPa. One contributing factor to this disparity is the inherent variability in sample quality resulting from the injection molding process, coupled with potential measurement errors. As pointed out by Magnier et al. (2018), applying the hole drilling method to polymer materials can be challenging. Particularly, the placement of the strain rosette on the goggles may not precisely correspond to the location of the maximum residual stress. Therefore, while the measured results may not precisely match the actual residual values, the fact that they are within the same order of magnitude as the simulation results underscores the reliability of the simulation outcomes.
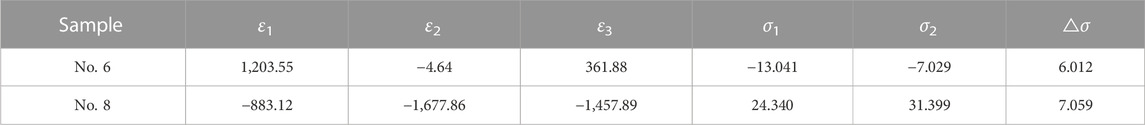
TABLE 3. Strains and stresses of the two samples measured by the hole drilling method.
Figure 6 presents images of the injection molded PC goggles. The retardation value related to the color is shown in the legend. Under the various DOE processing conditions, the products exhibit different photoelastic properties. Some of them exhibit noticeable defects such as bubbles, flow marks, and speckles. Although we can visually identify some good-quality products, for advanced industrial production, the PDIP technique is employed to confirm the absence of defects and ensure high quality. In terms of photoelasticity, the color distribution and fringe patterns directly reflect the residual stress within the goggles. Table 4 provides the chosen data extracted from the photoelastic images for the 16 sample groups. Figure 3 illustrates several methods to explore the relationship between grayscale values and residual stress. The DOE analysis results are shown in Figure 7A for the total gray value of the goggles manufactured using the 16 different processing conditions, and Figure 7B for the gray value along the oblique line (as shown in Figure 3B). Clearly, there is no discernible pattern in the effects of the five processing parameters. This may be attributed to the presence of black-colored areas, such as the frame of the goggles, corresponding to a gray value of 0, as well as white-colored areas associated with a gray value of 255. Therefore, the total gray value in the image and the gray value along the long oblique line are not suitable for analyzing the effects of processing conditions on residual stress. Figure 7C displays the DOE analysis result of the number of peaks along the oblique line, excluding the peaks near the starting and ending points. No apparent pattern can be observed. Higher mold temperature, injection velocity, and packing time result in a greater number of photoelastic fringes, while a higher melt temperature leads to a lesser number of fringes.
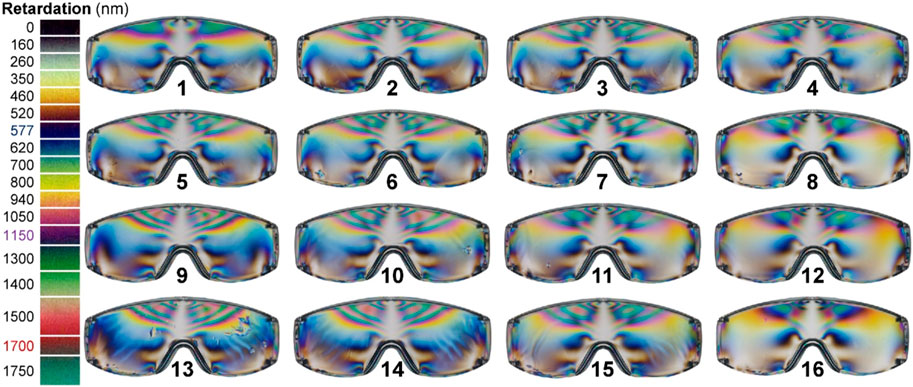
FIGURE 6. Photoelastic images of 16 samples prepared by DOE.
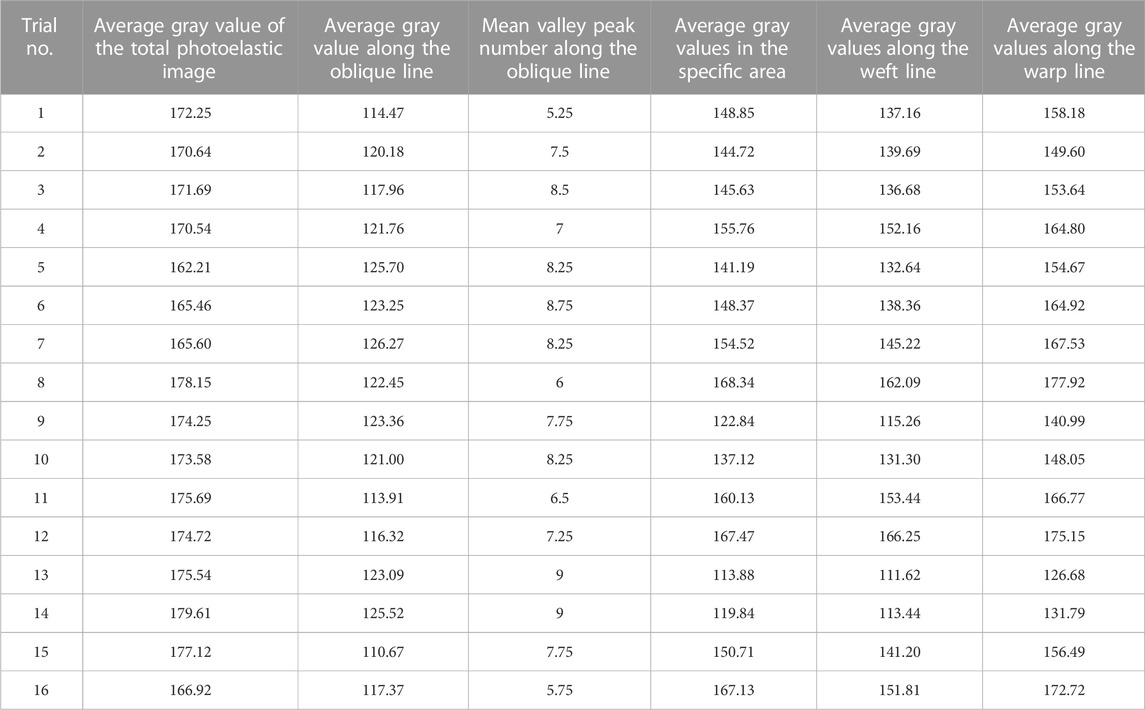
TABLE 4. Extracted data from the photoelastic images of the 16 groups of samples.
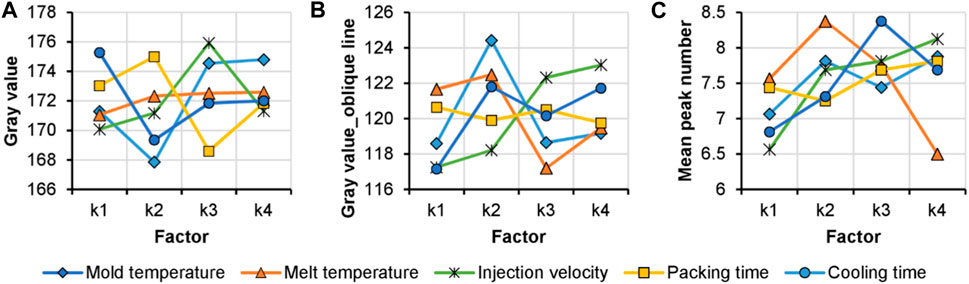
FIGURE 7. DOE results of the average gray value of the total photoelastic image (A) and the average gray value along the oblique line (B), and the DOE result of the mean valley peak number along the oblique line (C).
Figure 8 presents the data obtained along the oblique line. Each group of the DOE samples consisted of four products, and the results demonstrate excellent repeatability. The observed wave patterns are associated with the photoelastic fringes, and the number of fringes can be easily determined by counting the peaks within each wave. The average fringe number was utilized for the DOE analysis. However, since the peak numbers were similar across the samples, the resulting DOE analysis did not reveal a clear pattern.
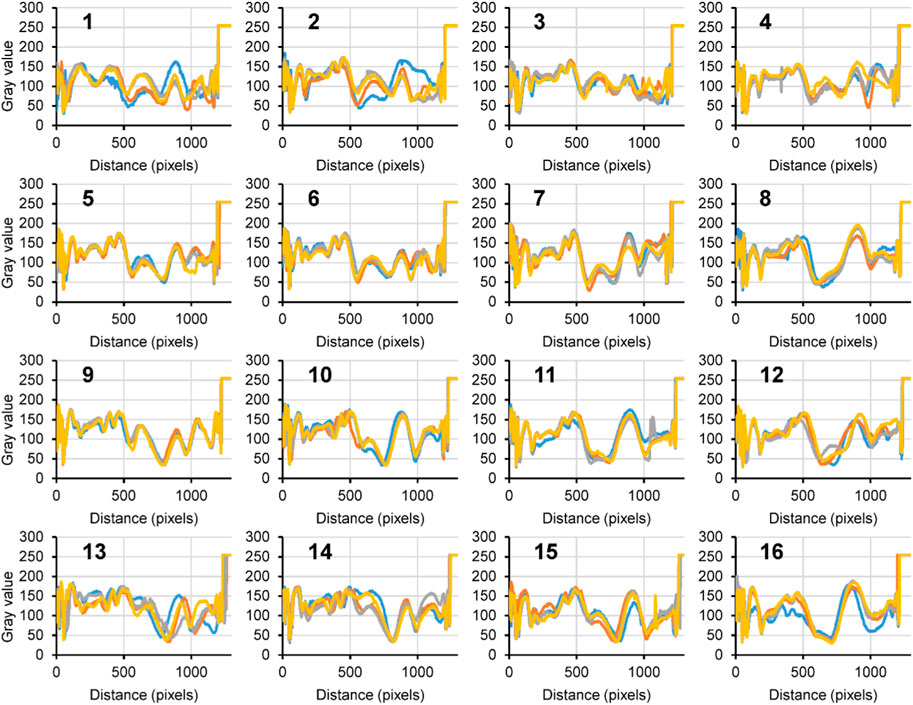
FIGURE 8. Gray value change along the oblique line of the 16 groups of samples.
The second method involves capturing the gray values within a specific area of the product (as shown in Figure 3C). Since the conjoined lenses are symmetrical and the melt flow in the goggles cavity during injection molding is balanced, the residual stress and warpage on the left and right sides of the goggles are consistent. Therefore, the limited area on one side of the lenses, as depicted in Figure 3A, was selected for analysis. Figure 9 illustrates the frequency distribution of gray values within this specific area. It highlights significant differences in the DOE results; however, the repeatability among the four samples in each group was not entirely consistent. Similar results can be observed in Figures 10, 11, which depict the gray values along the weft and warp lines, respectively. Figure 12A presents the average gray value within the area and along the weft and warp lines. Figures 12B, C exhibit a high level of agreement (R2 = 89.92% and 92.32%, respectively) with the gray value within the area. This indicates that the data collected along the lines within the area reflect the same trends observed within the limited area. The DOE results in Figures 12D–F also demonstrate a consistent pattern regarding the effects of the processing parameters. Range analysis reveals that among the five studied factors, the magnitude of their impact on the grayscale value within the limited area follows this order: melt temperature > injection velocity > mold temperature > cooling time > packing time. With an increase in melt temperature, the gray value also increases, while an increase in mold temperature, injection velocity, and cooling time results in a decrease in the gray value. The packing time has minimal effect on the gray value. Interestingly, the effects of these five parameters on the gray values within the limited area are opposite to their effects on the photoelastic fringe number in Figure 7C.
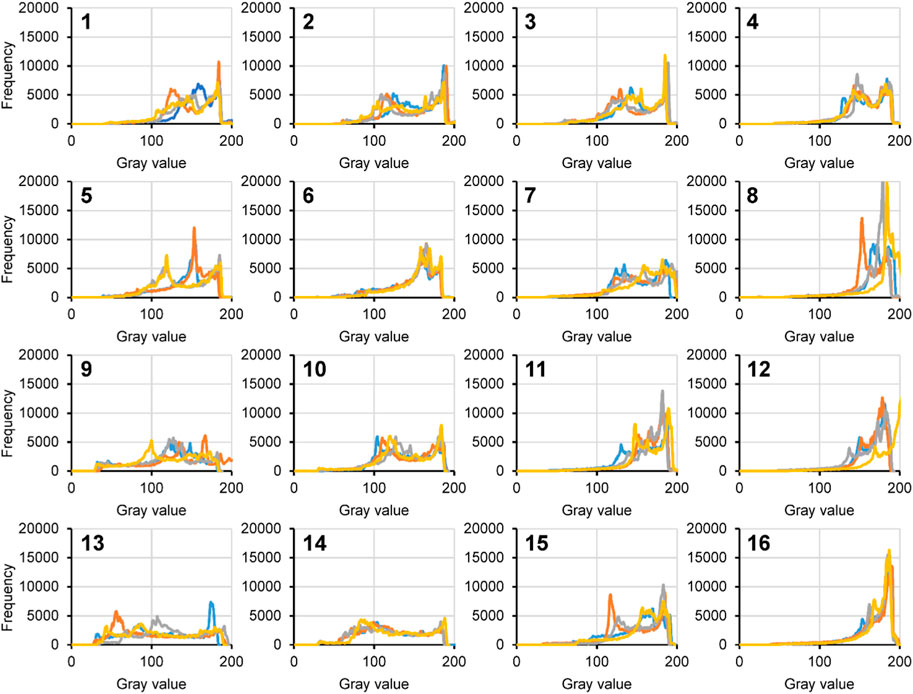
FIGURE 9. Frequency of the gray value from 0 to 200 within the specific area of the 16 groups of samples.
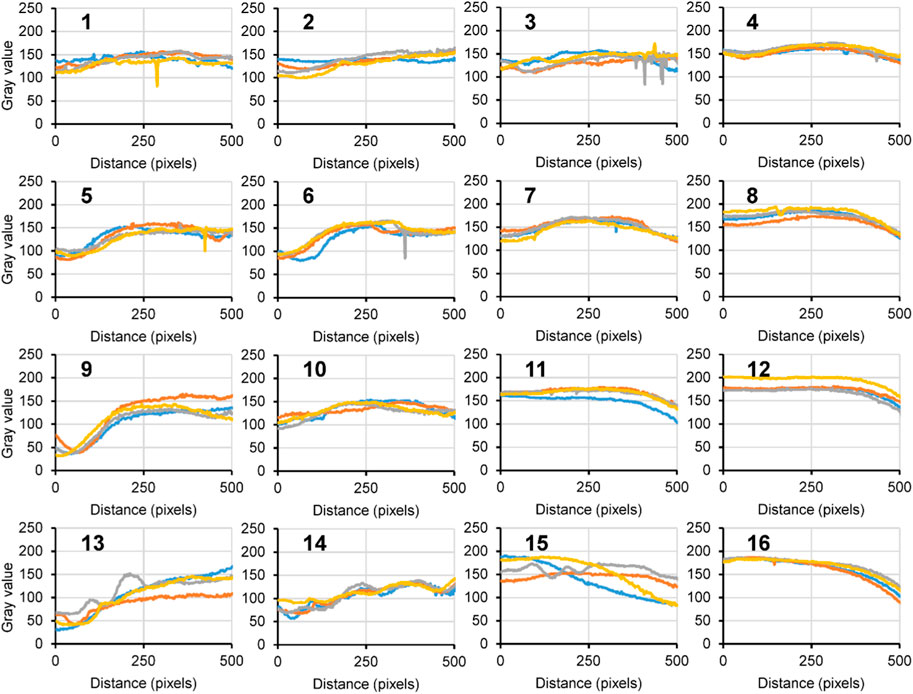
FIGURE 10. Gray value change along the weft line of the 16 groups of samples.
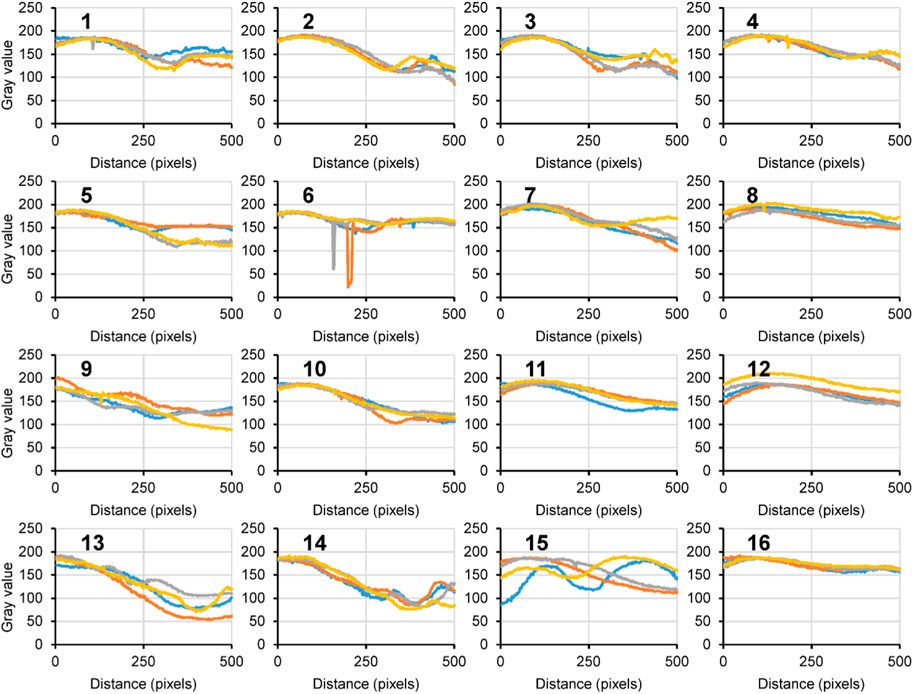
FIGURE 11. Gray value change along the warp line of the 16 groups of samples.
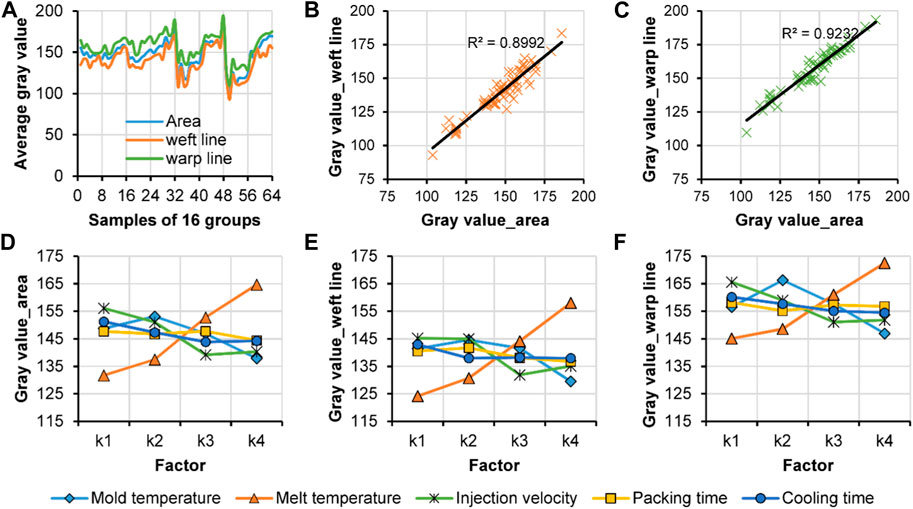
FIGURE 12. Average gray values of the 64 samples in the specific area and along the weft and warp lines (A), correlation between the average gray values in the specific area and the average values along the weft line (B), correlation between the average gray values in the specific area and the average values along the warp line (C), DOE result of the average gray values in the specific area (D), DOE result of the average gray values along the weft line (E), and DOE result of the average gray values along the warp line (F).
By comparing Figures 5, 12, it is evident that the change in residual stress follows a consistent pattern with the gray values observed within the specific area. Among the studied factors, melt temperature was found to have the most significant influence on both residual stress and the average gray value. To quantify the strength of the relationship between these variables, Pearson’s correlation coefficients were calculated and presented in Table 5. The correlation coefficient ranges from −1 to 1, indicating the strength and direction of the relationship between two variables. The correlation coefficients between the average gray value in the specific area and the average gray value along the weft and warp lines were consistently high. Similarly, the correlation coefficients between the maximum stress and the stress at the two probe positions were also significantly high. Moreover, the correlation coefficients between the photoelastic gray value and the simulated stress ranged from 0.676 to 0.785. These high correlation coefficients indicate a strong relationship between the photoelastic image analysis and the simulated residual stress of the samples. Furthermore, the experimental results align with the numerical simulation results, providing further validation. Consequently, this validates the use of instant shooting with a polarizer for real-time online monitoring of part quality. The gray value obtained within the specific area using the DIP technique can be employed to verify the residual stress of transparent parts. To simplify the process or reduce time, the gray value along a short line within the specific area can also be utilized for identification purposes.
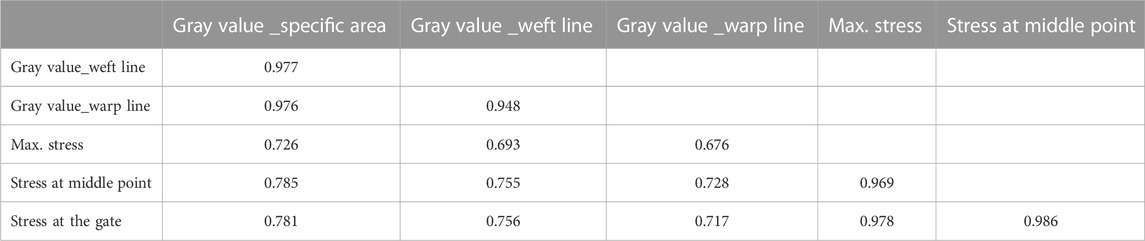
TABLE 5. Correlation coefficient between the variables.
Photoelastic materials have undergone significant industrial development and find wide applications. When subjected to stress, photoelastic polymer products exhibit stress fringes under a stress polarizer, and the density of these fringes reflects the magnitude of the stress. Leveraging photoelasticity has enabled the optimization of processing processes and reduction of residual stress in various optical polymer products. However, due to the high cost associated with residual stress testing, achieving comprehensive coverage of optical products during actual production is challenging. In this study, a novel method called PDIP was proposed, which integrates photoelasticity with DIP techniques to enable real-time identification of residual stress in transparent products during the injection molding process. The results demonstrate the feasibility of this method. By applying PDIP analysis, the gray value in a specific area or along a line can be used to identify the stress level of the product. However, the overall gray value of the entire image did not exhibit a strong relationship with stress, mainly due to the influence of complex geometries that led to multiple affected gray values. Through DOE experiments and numerical simulations, the effects of the five main injection molding parameters on residual stress were investigated, along with the correlation between PDIP results and simulation outcomes. Consistent patterns were observed regarding the effects of the five injection molding parameters on PDIP and simulated stress. Moreover, the correlation coefficient values between the photoelastic gray value and the simulated stress ranged from 0.676 to 0.785, indicating a high level of relationship strength between photoelastic image analysis and simulated residual stress. This technique holds promise as a valuable testing tool for the rapid detection of defects in transparent products on the industrial manufacturing line of injection molding, leading to improved production efficiency. In our future, the development of machine learning methods could further developed to enhance the instant identification of stress concentrations and directions.
The original contributions presented in the study are included in the article/supplementary material, further inquiries can be directed to the corresponding author.
JW and KF contributed to conception and design of the study. JW, KF, JH, and HL organized the database. JW, JH, and HL performed the statistical analysis. JW and KF wrote the first draft of the manuscript. JW and JH wrote sections of the manuscript. All authors contributed to the article and approved the submitted version.
This research was funded by the Fundamental Research Funds for the Central Universities, grant number buctrc 202005.
We acknowledge the software Moldex 3D 2022 support from CoreTech System Co., Ltd. The company was not involved in the study design, collection, analysis, interpretation of data, the writing of this article or the decision to submit it for publication.
The authors declare that the research was conducted in the absence of any commercial or financial relationships that could be construed as a potential conflict of interest.
All claims expressed in this article are solely those of the authors and do not necessarily represent those of their affiliated organizations, or those of the publisher, the editors and the reviewers. Any product that may be evaluated in this article, or claim that may be made by its manufacturer, is not guaranteed or endorsed by the publisher.
Ajovalasit, A., Petrucci, G., and Scafidi, M. (2015). Photoelastic analysis of edge residual stresses in glass by the automated tint plate method. Exp. Tech. 39, 11–18. doi:10.1111/ext.12017
Akahori, T., Nagakura, T., Fushimi, S., and Yonezu, A. (2018). An indentation method for evaluating the residual stress of polymeric materials: equi-biaxial and non-equi-biaxial residual stress states. Polym. Test. 70, 378–388. doi:10.1016/j.polymertesting.2018.07.024
Ghali, A., Pridmore, T. P., Jones, I. A., Wang, P., and Becker, A. A. (2003). “Boundary extraction and polarimetry in translucent specimens for photoelastic stress analysis,” in Computational imaging (SPIE), 5016, 115–122.
Guevara-Morales, A., and Figueroa-López, U. (2014). Residual stresses in injection molded products. J. Mater. Sci. 49 (13), 4399–4415. doi:10.1007/s10853-014-8170-y
Kim, B., and Min, J. (2017). Residual stress distributions and their influence on post-manufacturing deformation of injection-molded plastic parts. J. Mater. Process. Technol. 245, 215–226. doi:10.1016/j.jmatprotec.2017.02.015
Lu, X., and Khim, L. S. (2001). A statistical experimental study of the injection molding of optical lenses. J. Mater. Process. Technol. 113 (1-3), 189–195. doi:10.1016/s0924-0136(01)00606-9
Macías, C., Meza, O., and Pérez, E. (2015). Relaxation of residual stresses in plastic cover lenses with applications in the injection molding process. Eng. Fail. Anal. 57, 490–498. doi:10.1016/j.engfailanal.2015.07.026
Magnier, A., Scholtes, B., and Niendorf, T. (2018). On the reliability of residual stress measurements in polycarbonate samples by the hole drilling method. Polym. Test. 71, 329–334. doi:10.1016/j.polymertesting.2018.09.024
Pak, S. Y., Kim, S. Y., Kim, S. H., and Youn, J. R. (2013). Measurement of residual stresses in polymeric parts by indentation method. Polym. Test. 32 (5), 946–952. doi:10.1016/j.polymertesting.2013.04.011
Peixoto, C., Valentim, P. T., Sousa, P. C., Dias, D., Araújo, C., Pereira, D., et al. (2022). Injection molding of high-precision optical lenses: a review. Precis. Eng. 76, 29–51. doi:10.1016/j.precisioneng.2022.02.002
Prasath, R. G. R., Newton, T., and Danyluk, S. (2018). Stress monitoring of PET beverage bottles by Digital Photoelasticity. Manuf. Lett. 15, 9–13. doi:10.1016/j.mfglet.2017.12.010
Ramesh, K., and Sasikumar, S. (2020). Digital photoelasticity: recent developments and diverse applications. Opt. Lasers Eng. 135, 106186. doi:10.1016/j.optlaseng.2020.106186
Sasso, M., Natalini, M., and Amodio, D. (2011). “Digital image processing for quality control on injection molding products,” in Applications and experiences of quality control: prof. Editor I. Ognyan (InTech).
Thomas, B. P., Pillai, S. A., and Narayanamurthy, C. S. (2019). Photoelastic digital holographic polariscope. J. Mod. Opt. 66 (8), 817–828. doi:10.1080/09500340.2019.1575484
Vargas-Isaza, C., Posada-Correa, J., and Briñez-de León, J. (2023). Analysis of the stress field in photoelasticity used to evaluate the residual stresses of a plastic injection-molded part. Polymers 15 (16), 3377. doi:10.3390/polym15163377
Zhang, H., Zhang, N., Han, W., Gilchrist, M. D., and Fang, F. (2021). Precision replication of microlens arrays using variotherm-assisted microinjection moulding. Precis. Eng. 67, 248–261. doi:10.1016/j.precisioneng.2020.09.026
Keywords: photoelasticity, residual stress, injection molding, polycarbonate, digital image processing
Citation: Wang J, He J, Li H and Fang K (2023) Qualitative characterization of residual stress of injection molded polycarbonate goggles based on photoelasticity and digital image processing technique. Front. Mater. 10:1242721. doi: 10.3389/fmats.2023.1242721
Received: 19 June 2023; Accepted: 02 October 2023;
Published: 16 October 2023.
Edited by:
Christophe Binetruy, Ecole Centrale de Nantes, FranceReviewed by:
Yi Zhangyi, China University of Petroleum (East China), ChinaCopyright © 2023 Wang, He, Li and Fang. This is an open-access article distributed under the terms of the Creative Commons Attribution License (CC BY). The use, distribution or reproduction in other forums is permitted, provided the original author(s) and the copyright owner(s) are credited and that the original publication in this journal is cited, in accordance with accepted academic practice. No use, distribution or reproduction is permitted which does not comply with these terms.
*Correspondence: Jian Wang, d2pqXzAxMDdAMTYzLmNvbQ==, amlhbi53YW5nQG1haWwuYnVjdC5lZHUuY24=
Disclaimer: All claims expressed in this article are solely those of the authors and do not necessarily represent those of their affiliated organizations, or those of the publisher, the editors and the reviewers. Any product that may be evaluated in this article or claim that may be made by its manufacturer is not guaranteed or endorsed by the publisher.
Research integrity at Frontiers
Learn more about the work of our research integrity team to safeguard the quality of each article we publish.