 Maryam Kheirandish1
 Mohammad Reza Mohaddes Mojtahedi
94% of researchers rate our articles as excellent or good
Learn more about the work of our research integrity team to safeguard the quality of each article we publish.
Find out more
ORIGINAL RESEARCH article
Front. Mater., 12 October 2023
Sec. Polymeric and Composite Materials
Volume 10 - 2023 | https://doi.org/10.3389/fmats.2023.1225200
To recycle a blend of PET and PLA, understanding the challenging issues and crucial parameters that affect the properties and morphology of the blend is key to successful recycling. So, the main focus of this study was to investigate the parameters that influence the processability, compatibility, morphology, properties, and disintegration of PET/PLA blend fibers. Using surface tension measurements, acceptable adhesion between the two components was observed. SEM results showed that the PET/PLA blend fibers have a microfibrillar morphology. Based on 1H NMR analysis, the exchange reaction resulted in a block copolymer. The crystallization process in the fibers became more difficult as the PLA content increased due to the formation of copolymers through transesterification. The presence of oriented crystals in the melt-spun fiber blend was confirmed by X-ray diffraction patterns. As the PLA content increased, the tensile strength of the blends decreased gradually. Furthermore, the sample containing 20 wt% PLA exhibited the highest dimensional stability. The disintegration process in composting conditions for PET was improved by PLA.
Plastics are widely used in manufacturing and daily life due to their exceptional qualities, including durability, light weight, stability, and affordability. Plastics that originate from petroleum have a remarkable ability to resist biodegradation. The extensive repetition of monomers and covalent crosslinking in certain plastics makes them very stable and hard to degrade (Rana, 2019; Kabir et al., 2020a). This obstacle presents a significant issue in waste management, particularly for sustainable practices. The vast amount of plastic waste released globally has led to the pressing problems of white pollution (Kabir et al., 2020b; Shen et al., 2020; Xu et al., 2021). As a result of these challenges, the concepts of reducing, reusing, and recycling have gained increased emphasis; recycling in particular has attracted the greatest consideration for sustainable material management (Zhang et al., 2023). Also, during the last decade, biodegradable polymers have often been proposed as a solution to plastic pollution by replacing non-degradable plastics in certain applications (Kakroodi et al., 2015; Ramos et al., 2016; Taib et al., 2023).
Poly (lactic acid) (PLA) is one of the commercially available bioplastics that is remarkable due to its excellent properties. Compared to other bioplastics, it has better durability, transparency, and mechanical strength (Mehmood et al., 2023). However, it has poor toughness, weak impact strength, poor melt elasticity, undesirable gas barrier properties, and a low crystallization rate (Murariu and Dubois, 2016; Kakroodi et al., 2017; Qi et al., 2017). Although the characteristics of PLA can be modified by various methods, such as post-annealing that enhances PLA crystallinity by enlarging its already present crystals (Kakroodi et al., 2015), copolymerization of lactic acid with other monomers (Sriromreun et al., 2014), the addition of nanoparticles to PLA (Bang and Kim, 2012), and blending with thermoplastic polymers (Kakroodi et al., 2017), this eco-friendly polymer is used for various applications such as textile fiber, bottles, and packaging (Madhavan Nampoothiri et al., 2010; Murariu and Dubois, 2016).
Poly (ethylene terephthalate) (PET), a commercially engineered thermoplastic resin, is a widely used commodity polymer in food and beverage packaging, textiles, and automobiles due to its thermal properties, chemical resistance, lightweight, strength, and barrier properties. The exceptional qualities of this polymer are coupled with its significant ability to resist degradation (Buasri et al., 2018; Flores et al., 2019; Haque et al., 2023). Environmental researchers consider the effective utilization of PET waste to be a crucial topic due to its extensive consumption. Recycling this non-biodegradable polymer can create opportunities, such as using it as fiber and filler in construction materials as well as in the production of bottles and food packaging (Aldas et al., 2021; Afgan et al., 2022; Ferrara and De Feo, 2023; Heidari-Rarani et al., 2023).
Additionally, it is challenging and costly to separate unwittingly blended PET and PLA bottles in post-consumer plastic waste using conventional techniques. Manual sorting is not feasible because the bottles are typically transparent and look very similar (Gere and Czigany, 2020). So, recycling a mixture of PET and PLA blends is both necessary and inevitable. To achieve success in this endeavor, it is essential to consider the parameters that affect the morphology, development, and properties of the PET/PLA blends. This topic has long been of great interest to researchers (Torres-Huerta et al., 2014; Xia et al., 2014; Jafari et al., 2020; Aldas et al., 2021; Lekube and Burgstaller, 2022).
Nanofibril PLA/PET composite foams were prepared by Wang et al.; they observed that the inclusion of PET nanofibrils improved the viscoelasticity, crystallization, and melt strength of PLA, consequently improving its foaming ability (Wang et al., 2020). Non-isothermal crystallization of solution cast PET/PLA films was investigated by Chen et al. DSC results indicated that PET crystallized in all blends, regardless of whether the PLA was amorphous or crystalline. Additionally, the blends showed a homogeneous amorphous phase structure, and it was discovered that they were miscible in the melt over the entire composition range (Chen et al., 2009). Huerta et al. studied the effects of PLA in PET Matrix produced by single-screw extrusion on the morphological and mechanical properties of samples. Their results demonstrated the miscibility of blends in a glassy state, in addition to two different morphologies, matrix dispersed and co-continuous (Torres-Huerta et al., 2016). Further, PLA/PET fibers were electrospun from solution by electrospinning. The crystallinity degree of as-spun and cold-crystallized electrospun fibers was studied. Homopolymer fibers showed more crystallinity than blend fibers. Also, both PLA and PET were crystallized during cold crystallization (Li et al., 2014).
In this work, we investigated the challenging issues in PET/PLA blends such as the processability, thermal degradation of the two components (particularly PLA), compatibility for controlling and stabilizing morphology, and disintegration of PET/PLA blends by producing fibers on an industrial scale using a cost-effective and environmentally friendly method. For the first time, this study specifically focuses on the deep analysis of the transesterification and disintegration of PET/PLA blends in the form of fibers.
Commercial grades of PLA and PET were used for the fabrication of fibers. PLA Ingeo biopolymer 4043D, was supplied by NatureWorks (United States) with a weight-average molecular weight (Mw) of 110,000 g/mol, a melt temperature of 210°C, and 4.5-5 wt% of D-isomer units. PET with a melting point of 260 °C and an intrinsic viscosity of 0.65 dL/g was supplied by Tondgooyan (Iran). Dichloromethane (DCM) and Trifluoroacetic acid (TFA) were obtained from Merck (Germany).
Prior to mixing, PLA was dried at 80°C for 12 h in a vacuum oven. PET granules were also crystallized at 120 for 1 h in a laboratory dryer and then were dryer at 160°C for at least 7 h under a nitrogen atmosphere to avoid hydrolysis. Before processing, weighted PLA and PET were hand-mixed. PET/PLA fibers with 0, 5, 10, 15, 20, and 100 wt% of PLA were produced using a Fourne-Automatic melt-spinning single-screw unit (Barmag, Germany) with a screw diameter of 35 mm and an L/D ratio of 24 and a spinneret with 36 circular holes each with a diameter of 0.25 mm, as presented schematically in Supplementary Figure S1A. The temperature profile of the barrel in the extruder zones for fiber included 0, 5, 10, 15, and 20 wt%. The PLA 250°C, 255°C, 260°C, 265°C, and 265°C and the spinning pump was set at 8 RPM. The temperature zones for PLA fibers were set at 235°C, 240°C, 245°C, 250°C, and 250°C. Between the spinneret orifice and the winding roll, the extruded fibers were elongated and air-cooled simultaneously. Then the produced yarns were drawn with an industrial drawing machine (Zinster-502-2 Co., Germany);Supplementary Figure S1B shows a schematic representation of the process. The drawing process was done in two stages: first, pre-drawing (draw ratio 1.008), and then main drawing with a draw ratio of 2. The feeding godet and hot film temperature were set to 80 °C and 150°C, spindle and take up speed were kept at 4,000 rpm and 400 m/min, respectively.
For producing films of neat PLA, PET, and their blends (5 and 20 wt% PLA), dried PLA and PET were melt-mixed at 265°C for 10 min using a conventional melt-mixer (Mixsense, Iran) at a rotor speed of 60 RPM. The samples were then molded into 1 mm-thick films using a hot press running (Santam SPH-500, Iran) at 265°C and 50 bar for 10 min.
Using an electronic yarn length measurement instrument model YG086D, the linear density of PET/PLA blend fibers was measured. For each of the spun and drawn samples, 50 m of each specimen was weighed with an analytical balance and replicated five times. Then an average weight value was multiplied by 200 to calculate the dtex of the yarns.
Surface tension measurements were carried out to gain insight into the compatibility of PET and PLA. Contact angle measurements were performed with a contact angle goniometer (Jikan CAG-10, Iran) at 25°C on films of neat PET and PLA. Four probe solvents, including water, benzyl alcohol, ethylene glycol, and toluene, were employed to estimate the surface tension of solid samples. The total surface tension and corresponding components for the four liquids are shown in Supplementary Table S2. Using the recorded images and the circle approach, the contact angles were determined. Each sample was subjected to three repeats to establish an average and standard deviation. Surface tensions of the two polymers can be estimated through the fitting of the contact angles in the Owens−Wendt−Rabel−Kaelble (OWRK) method, according to Eq. 1.
Where
The geometric (Eq. 2) mean equation is used to calculate interfacial tension values for polymer–polymer interactions.
Where
Table 2c shows the estimated W12 values between the ingredients of the blends.
The FTIR of neat PLA, PET fiber, and PET/PLA blend fiber were measured using a Thermo Nicolet NEXUS 670 spectrometer. Spectra were collected at wavelengths in the 4,000-400 cm–1 range using fibers mixed with KBr salt and compressed into pellets.
For the 1H NMR investigation, a Bruker 400 MHz ultrashield NMR was used. Blend fiber and PLA polymer were dissolved in a 30/70 (wt%) mixture of deuterated TFA and chloroform (CDCl3). Tetramethylsilane (TMS) was used as the internal standard; all spectra were obtained at room temperature and were referenced to CDCl3.
The thermal properties of PET/PLA fibers were investigated using a differential scanning calorimeter instrument (TA Instruments Co., Inc., United States). The DSC analysis was carried out in a nitrogen atmosphere from room temperature to 300°C at a heating rate of 10°C/min, and the rate during cooling was 5°C/min. Finally, the samples were heated from room temperature to 300°C at a rate of 10°C/min. Prior to cooling and second heating, the samples were held at 300°C for 2 min. The melting (Tm) and crystallization temperatures (Tc) during the first and second heating and cooling processes were estimated from the DSC as the temperatures of the peaks of the endo- and exo-thermic curves, respectively. The degree of crystallinity of PET and PLA was calculated by using the DSC thermigrams using 140 J/g and 93 J/g for 100% crystalline PET and PLA, respectively (You et al., 2018). The crystallization degree is determined by the following equation:
Where
Scanning electron microscopy (SEM, XL30, Phillips Co., Netherlands) was performed to study the morphology of the film and the blend fibers. For more morphological investigation, blend fibers were immersed in dichloromethane for 1 h to etch away the disperse phase (PLA), following a procedure by Torres et al. (Torres-Huerta et al., 2014). So, first, neat and blend fibers were fractured in liquid nitrogen with a sharp blade. Then etching process was done. Afterward, it was stuck on a sample stage and coated with a layer of gold prior to observation. The surface and cross-section morphology of neat PET and PET/PLA fibers at room temperature were detected. Using Digimizer software, the mean diameter of the PET/PLA fibers was found to be about 12-13 µm.
XRD patterns of PET/PLA blend fibers were recorded via an X-ray diffractometer (Inel Equinox 3000, Thermo Fisher Scientific, Waltham, United States). The crystal structure and the crystal orientation of the blend fibers were assessed. Datum were afforded on a 2Ɵ scale from 5 to 40. The XRD patterns were analyzed using X’pert Highscore Plus (Malvern Panalytical, Malvern, United Kingdom).
The tensile properties of neat and blend fibers were evaluated according to ASTM 3822 using an Instron universal testing machine (Model 3050; Norwood, United States). The tests were carried out on samples at room temperature (25°C) and 65% relative humidity using a constant rate of extension (C.R.E) test machine. For as-spun and drowned fibers, a strain speed of 50 mm/min was used with gauge lengths of 100 mm and 200 mm, respectively. For every fiber sample, at least 10 replicates were done. Average modulus and maximum stress and elongation at break with standard deviation were reported.
To evaluate the dimensional change of the heated fibers, first, the fiber with the determined length was heated at 130 °C for 10 min; after 1 h, the secondary length of fiber was noted. Then, using the following formula, shrinkage was calculated (Wilson, 1974):
The evaluation of the disintegration of blend fibers in a laboratory scale composting environment was carried out based on the European ISO 20200 standard method. The composition of the solid synthetic waste was 1% urea, 4% corn oil, 5% sugar, 10% ripe compost, 10% ripe compost, 30% rabbit feed, and 40% Sawdust. The final water content was approximately 50%. The initial pH of the substrate was 6.15, and aerobic conditions were by mixing the compost periodically. Samples (0.6 g fibers) with different PLA contents were buried at a depth of 2 cm in perforated boxes and were incubated at 58 °C then were tested at different times (1, 10, 23, and 45 days). At the end of the test, the samples were rinsed with distilled water, dried in the oven at 38°C for 24 h, and weighed. The degree of disintegration (D%) was then obtained using Eq 6.
Where (m0) represents the beginning mass of the sample and (mt) represents the dry mass of the studied sample at various composting intervals.
The results of mass measurements and scanning electron microscopy were used to track the composting process.
The color properties of PLA fibers and PET/PLA fibers were analyzed using an X-rite (Grand Rapids, United States) Color-Eye 7000A colorimeter. The yellowness index (YI) and the CIELab color coordinates of the samples, which included L* (lightness), a* (red-green), b* (yellow-blue) were determined. The instrument was calibrated using a white standard tile. Five measurements were taken at random positions on the fiber surface, and the average values were calculated. These measurements were taken both before and after 45 days of incubation. Eq. 7 was used to calculate the total color differences (ΔE):
Where; Δ L*= L* fiber after composting - L* fiber before composting, Δ a*= a* fiber after composting - a* fiber before composting and, Δ b*= b* fiber after composting - b* fiber before composting.
The results obtained were reported as mean ± standard deviation (SD) using GraphPad Prism software, with a p-value ≤0.05 considered statistically significant. In addition, Student’s two-tailed t-test and one-way analysis of variance (ANOVA) were used to assess group differences.
The linear density of as-spun and drowned PET fibers and their blends with PLA (obtainable in Supplementary Table S1) was measured to detect any significant changes in the spinning path. As expected, there was no significant effect on the linear density parameter of the blend fibers which offers acceptable processing conditions for melt spinning. The desired fiber diameter for industrial scale can be observed easily at this spinning speed (1,500 m/min).
The results of the measured contact angle obtained from four probe solvents are shown in Table 1. The contact angle data were fitted by the OWRK model and shown in Supplementary Figure S2, and the surface energy values of both polymers at 25°C were calculated. Then the room temperature data was extrapolated to the melting temperature processing (270 °C) using the dγ/dT value (Anstey et al., 2018). The following equation was used to extrapolate the surface tension for the blend components. Related data are presented in Table 2a, b
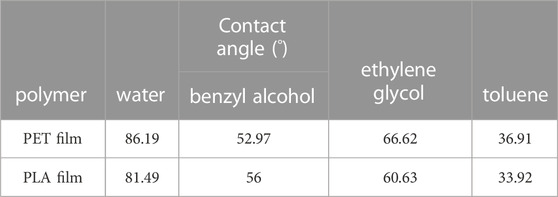
TABLE 1. The measured contact angles with PET and PLA film according to WORK.
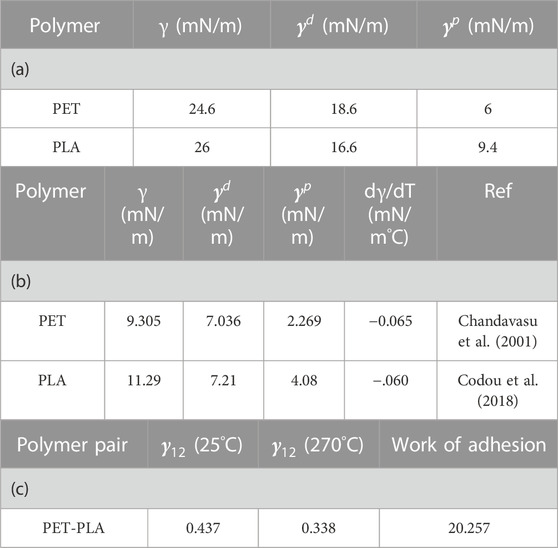
TABLE 2. (a) Surface tension of the component measured at 25°C, (b) Surface tension measured at 270°C (mNm−1), (c) Interfacial tension (at 25°C and 270°C) and work of adhesion of the blend.
Where γ and γ0 are the surface tension of components at the temperature of T and T0 (room temperatures), respectively.
As can be observed in Table 1, PLA is more hydrophilic than PET because it has a smaller contact angle when exposed to water. PLA shows more affinity than PET for ethylene glycol. Toluene with a low surface tension (28.4) results in a contact angle of 33.92°. The contact angle of benzyl alcohol, which has a higher proportion of polar and dispersion components, is 56. Via the OWRK model, the total surface tension, dispersive, and polar contribution values of PLA at 25 °C were calculated as 26, 16.6, and 9.4, respectively. According to Table 2a, the total surface tension of PET is lower than that of PLA.
Interfacial tension values for PET–PLA interactions were calculated based on geometric mean equations (Eq. 2) and shown in Table 2c. The interfacial tension between the different pairs of polymers is lowered at high temperatures, facilitating the mixing of the phases easier during the process (Anstey et al., 2018). As seen in Table 2c, the interfacial tension between PET and PLA is so low in this system, which highlights the high affinity between the PET and PLA phases. There may also be evidence of good interfacial bonding (Snowdon et al., 2017). Equation 3 shows that a high work of adhesion depends not only on the high surface tension of both components, but also on low interfacial tension. The interfacial tension can be used as an indicator of the compatibility between PET and PLA at the interface. A low interfacial tension indicates a high level of compatibility between PET and PLA at the interface, while a higher interfacial tension results in a weaker bond strength between two adjacent components (Tran et al., 2013; Esmaeilzadeh et al., 2021).
To study the evolution of PLA degradation via molecular weight (Mw) measurement, identify the end group, and the effect of TFA as a co-solvent on the reaction induced by it, a traditional 1H NMR technique was used. First, 1H NMR spectra were performed for samples including PLA in pellet form (TFA/CDCL3 was used as solvent for 1H NMR analysis) and PLA film (solved in CDCL3 and TFA/CDCL3). The full spectrum is shown in Figure 1A, whereas the correlated peaks of interest are enlarged in Figures 3B, C. Two strong signals at 5.34 ppm and 1.64 ppm correspond to CH units (Ha) and CH3 groups (Hb) located within the PLA chain, respectively. The weak peak at 4.71 ppm belongs to CH end group bonded to OH (Hz) (Espartero et al., 1996). Two triplet peaks at 2.85 and 3.7 correspond to the CH2 of the hydroxyl end group (x, y).
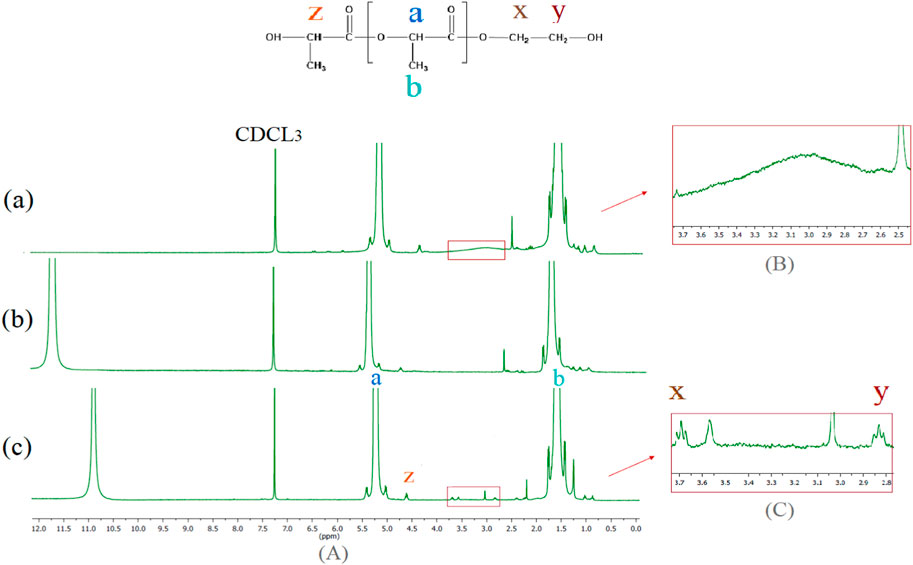
FIGURE 1. Full spectrum of PLA in the form of (A) film dissolution in CDCL3 (B) film dissolution in TFA/CDCL3 (C) pellet dissolution in TFA/CDCL3 with associated cross-peak of interest (square region).
For the determination of the polymer molecular weight, Eq. (9) was used to compare the relative proton resonance intensities arising from methine groups (z) located both at the end of the polymer chain and in the polymer backbone (a) (Sabbatier et al., 2012):
Where: MRU is the molar mass of repeating unit monomer in the main chain of PLA (g/mol), ME is the molar mass of monomer at the end group of PLA chain (g/mol), Ia is the integral of methine group in the polymer backbone, and Iz is the integral of methine end group.
According to the 1H NMR spectrum, the calculated Mw of PLA in the form of pellets in CDCL3/TFA, PLA film in CDCL3, and PLA film in CDCL3/TFA are 80,000 g/mol, 32,000 g/mol and 11,000 g/mol, respectively. Reaction with the solvent and degradation are responsible for this reduction.
In Figure 1B, a board peak related to the end group of alcoholic OH (2.5-3.7 ppm) that emerged as a result of the polymer process at high temperatures and shortens the length of the chains, is disappearing in Figure 1B. Furthermore, a downfield shift of 0.2 ppm of CH in PLA repeating unit (Ha) happens, which suggests a strong electron withdrawing group was linked to the hydroxyethyl group, which is possible due to the formation of trifluroacetate bonds (Supplementary Figure S3 path 1). This indicates TFA reacts with the end group of PLA and causes fast esterification (Kenwright et al., 1999).
The comparison diagram (b) with (c) in Figure 1 illustrates a clear shift to a higher field of 0.7 ppm for the TFA peak. This phenomenon is caused by hydrogen bonds. On the other hand, the shift upfield of the TFA peak strongly suggests that the PLA proton in the form of a pellet is more accessible to hydrogen bonding interaction with the hydroxyl group of TFA than the PLA proton of film (Asakura, 1981). Diagram (b) in Figure 1 had a higher concentration of acid, so the peaks representing Hx and Hy were not seen due to the possibility of more ester exchange by TFA.
These evaluations confirm that TFA is not a suitable solvent for PLA as an aliphatic polyester but is a common solvent for aromatic semicrystalline polyesters based on NMR estimation at ambient temperatures (Tu et al., 2021).
In polyester blends near or above their melting points interchange reactions are commonly possible (Porter and Wang, 1992). Figure 2 depicts three different exchange reactions between PET and PLA: alcoholysis, acidolysis, and transesterification. In this paper, transesterification is used as a general term to explain all exchange reactions, including PLA. The star structure in Figure 2 shows that when transesterification takes place between PLA and PET, two components are formed, which are represented by LT and TEL. LT is the structure in which the PLA is connected directly to the benzene ring, and TEL refers to structures in which PLA is attached to ethylene groups of ethylene terephthalate.
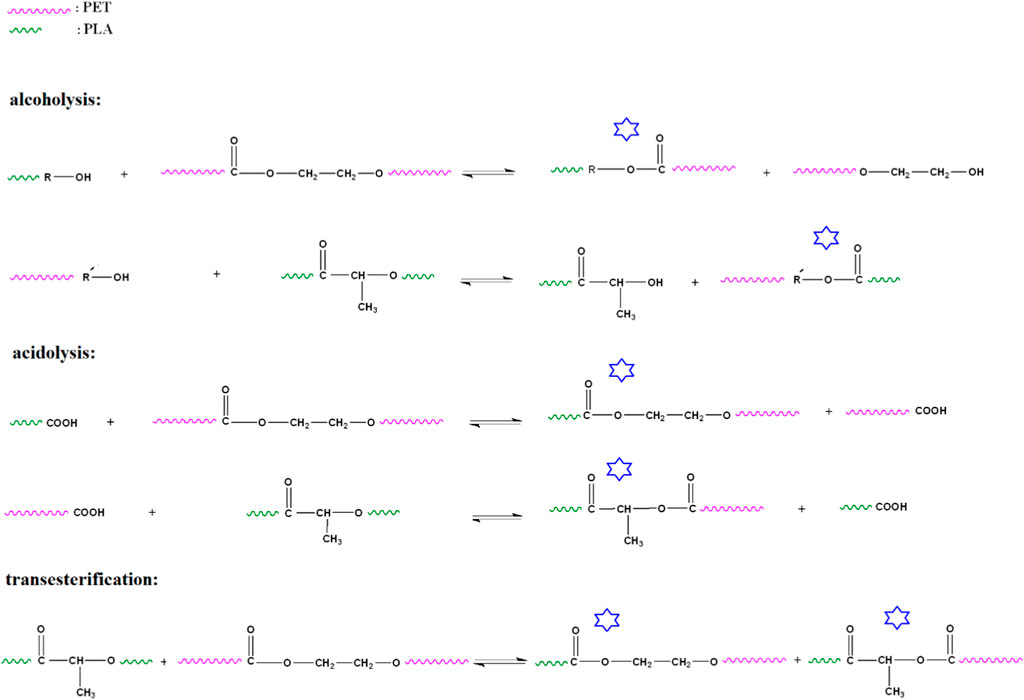
FIGURE 2. Different exchange reactions between PET and PLA.
According to Supplementary Figure S4, extra hydroxyl and carboxyl end groups are exposed by the decomposition of PLA during processing. These products could also participate in transesterification.
1H NMR investigations were performed to obtain information on the molecular structure of PET/PLA fibers. Assignment of proton signals in the 1H NMR spectra of fibers consisting of neat polymer and both PET and PLA. The corresponding structural assignments at the top of the figure are shown in Figure 3.
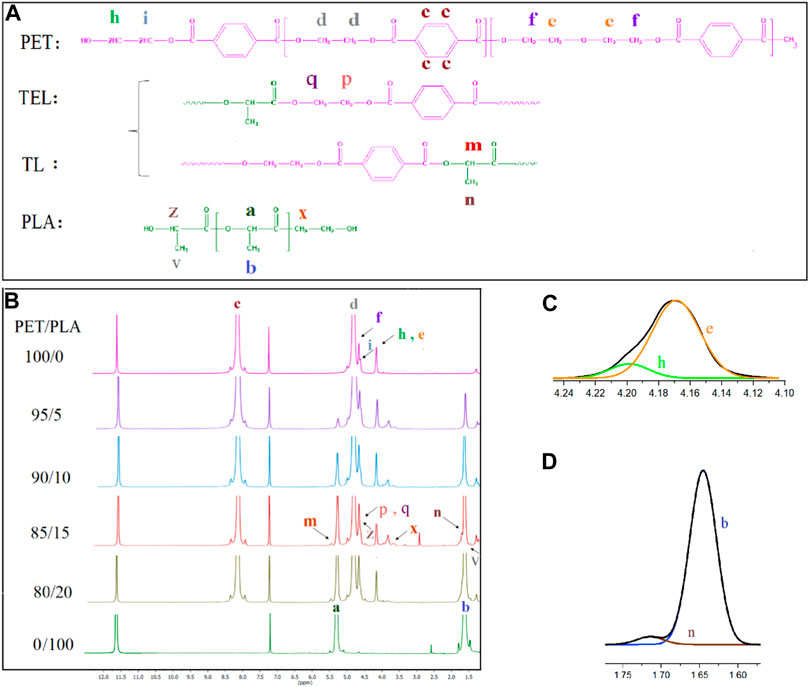
FIGURE 3. (A) Chain structures of PET, PLA, TEL and TL. (B) 1H NMR spectra of PET and PLA blend fibers (C) Enlargement and deconvolution chemical shifts of (C) e, h; (D) b, n.
The characteristic peaks associated with PET can be observed at 8.19 ppm (Hc) and 4.85 ppm (Hd), which are assigned to the hydrogen of aromatic group and the ethylene group between two terephthalate units in the PET main chain, respectively. Ethylene in β-position to ether oxygen (Hf) and to OH end groups (Hi) are represented at 4.63 and 4.67 ppm. Signals of hydroxyethyl terephthalate (Hh) Ethylene in α-position to ether oxygen (He) are superimposed at 4.11-4.24 ppm (Kenwright et al., 1999; Wu and Cuculo, 1999) and, the deconvolution diagram is seen in Figure 3C.
The resonance peak of PLA blocks has previously been explained. As the PLA level in the blend fiber increases, the intensity of the corresponding PLA peak in the blend changes significantly. The extent of the transesterification reaction in PET/PLA fibers can be identified by resonance peaks which representing the methine group between PLA and PET or the ethylene unit between them. (Hm and Hp were identified by the TL and TEL structures, respectively). The CH3 proton of the TL structure (Hn) overlaps with Hb, which corresponds to the CH3 proton of the PLA backbone. The deconvolution of b and n is shown in Figure 3D. Hp and Hq are superimposed with Hi, Hf, and Hz (Olewnik et al., 2007). The dayads fraction of LT (fLT) and TEL (fTEL) is obtained by dividing the integral intensity of each area (Im and I(p+q)/4 respectively) by the total area (Ia + Im + I(p+q)/4 +Id/4). Therefore the total value of fLT and f TEL is defined as the degree of transesterification (DT):
Due to Hp,q overlaps with Hi, Hf and Hz, I(p+q) is determined by the following equations:
Where I is the integration area of the Hn resonance. Evidence of transesterification is seen in all blend fibers. This reaction may have an impact on the crystallinity of the blend fibers. In order to learn more, DSC analysis was carried out (part 3.4).
As seen in Supplementary Table S3, with an increase in PLA content in the blend, the DT goes from 0.39% to 1.43%. Generally, in this work, the degree of transesterification, which refers to the conversion of one ester to another during the melt spinning process, is observed to be low. Several parameters can control the degree of transesterification, such as time of blending, and temperature as primary factors. Additionally, the PLA content and PET type also have an influence (Stewart et al., 1993).
According to Ref (Yamadera and Murano, 1967; Tessier and Fradet, 2003), the degree of randomness (B) can be estimated from the probability (PTL and PLT or PTEL) of finding an L (or T) unit next to a T (or L) unit and the integral intensities of the corresponding dyadic fractions (fLL, fTET, fTLand fTEL), as illustrated in Supplementary Table S3.
When B is equal to unity, PET and PLA tend to generate random distribution, and random copolyester is formed. For block copolymer B is less than unity, so PET and PLA repeating units tend to cluster in blocks of each unit; that is, the long sequence length of the repeating unit is seen. When B > 1 or B = 2, an alternating distribution of copolymer is formed. When the value of B becomes zero, it means that a mixture of homopolymers is in the system (Mallakpour et al., 2001). According to the results, all blend fibers show B < 1, which characterizes that block copolymer is formed in all structures.
The actual PET/PLA molar ratio in the produced fibers was calculated using 1H NMR and compared with the initial PET/PLA molar ratio. The results are shown in Supplementary Table S3. All of the resulting blend fibers have PET/PLA molar ratios almost similar to those of the relevant feeds. However some decrease in PLA molar mass after melt spinning could be due to both some PLA decomposition and transesterification. When transesterification and decomposition happen the value of methine in the main chain (Ha) decreases, and their resonance peak will have a different position in the 1H NMR Figure.
DSC diagrams of the semicrystalline PET/PLA blend fibers during first heating, cooling, and second heating are presented in Figure 4A, B, respectively. An additive rule was used to describe the experimental results for the enthalpy of the blends (Chen et al., 2014) (Eq. 15).
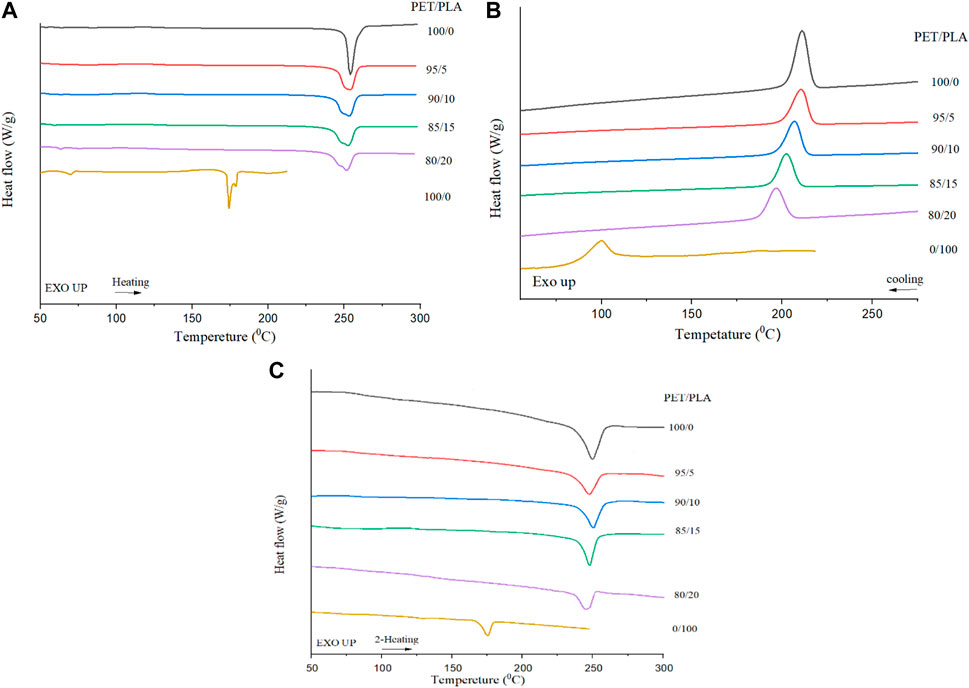
FIGURE 4. (A) First heating scans in DSC of various blend fibers. (B) Cooling scans of PET/PLA blend fibers from the melt at 5°C/min (C) Second heating scans in DSC of various blend fibers.
The results in Table 3 show the crystallinity of PET and PLA during first heating, cooling and second heating of the blend fibers after non-isothermal crystallization. For drawn PET fiber, a well-known heating sweep is seen in Figure 4A with an endothermic melting peak at 252 °C with a crystallinity of 43.7%. A peak near 82 °C is attributed to the glass transition of PET, even though it is somewhat difficult to diagnose in this Figure. The absence of the cold crystallization peak indicates that the PET fiber was already crystallized during drawing. The thermal behavior of the PET/PLA fibers was affected by the weight ratio of the blends, as anticipated.
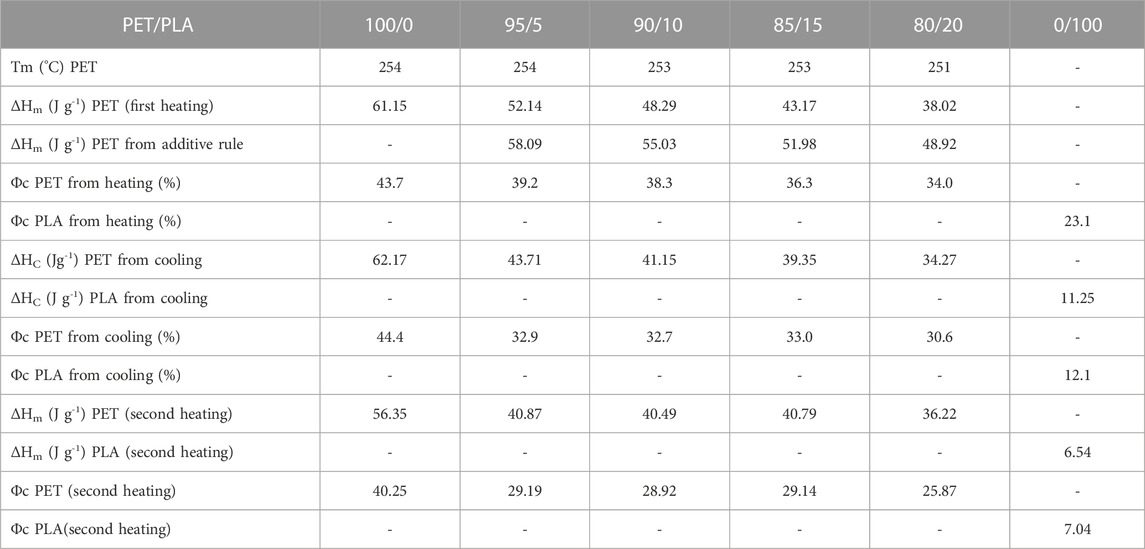
TABLE 3. DSC parameters (first and second heating and cooling) of PET/PLA blend fibers.
As the amount of PLA component increased, the Tm value of PET slightly decreased, and the area under the endothermic peak of melting PET ((ΔHm) PET) was reduced. When semicrystalline polymers are blended with other polymers, a decrease in Tm indicates some degree of miscibility between the blend of components. This is due to the favorable thermodynamic interaction between PET and PLA. It demonstrates that PLA repeating units frequently interrupt the linear crystallizable sequences of PET chains (Park and Im, 2002; Torres-Huerta et al., 2014; Flores et al., 2019). Crystallinity values of 43.7, 39.2, 38.3, 36.3, and 34.0% were calculated for blends including 0, 5, 10, 15, and 20 wt% PLA content, respectively. This shows that crystallization becomes more difficult in the presence of PLA. According to Table 3, measured crystallinity for these blends demonstrated a negative deviation from the simple additive rule and suggested that the PET and PLA phases may interact chemically. It is consistent with the interfacial tension results (part 3.2), which show that these two polymers may have a strong interaction. Furthermore, the structure of the PET-PLA copolymer that results from transesterification is difficult to incorporate into the PET crystal, which results in a reduction in the crystallinity of PET in blends (You et al., 2018). The 1H NMR results back up these findings.
According to Figure 4B, PET melt crystallization happens in all samples, but the addition of PLA units alters PET’s crystallization behavior. No crystallization of PLA during the cooling process in Figure 4B indicates that PET segment strongly influences the mobility of PLA fraction, and crystallization of PLA in the blend is difficult (Padee et al., 2013).
With increasing PLA content, the melt crystallization peak of PET shifts to a lower temperature, and a lower crystallization initiation exothermal peak is seen. The cooling peak (Tc) of PET in the blend fibers containing 0, 5, 10, 15, and 20% PLA, is clearly seen at 211.04, 210.41, 206.08, 202.31, and 196.68°C, respectively. According to some studies, the action of PLA as a PET retarder is the cause of this event. On the other hand, PLA creates a significant interface with PET chains. This surface with suitable interactions decreases both the dynamics of PET chains at the interface and the energy barrier for crystallization (Jompang et al., 2013; Padee et al., 2013; Shahnooshi et al., 2020).
Furthermore, it is possible that the formation of the PET-PLA copolymer is caused by a transesterification reaction at the melt processing temperatures of polyesters. The copolymer is primarily found at the interface, and its role in reducing interfacial tension and increasing miscibility has been widely recognized in reactive processes (Xia et al., 2014). On the other hand, PLA units enter the crystal lattice as a result of transesterification interactions between PET and PLA units, which result in the production of an AAA-BB-AAA type segmented block copolymer (Acar et al., 2007). As the amount of PLA in the sample increases, the number of PLA units in the [PET]-[PLA]-[PET] structure increases. PLA units, on the other hand, are soft segments in a copolymer structure. Because of PLA’s low Tg value, these PLA blocks must have greater mobility than PET blocks at crystallization temperatures. So, lower crystallization initiation and peak temperatures are due to the increased mobility of soft PLA segments (Acar et al., 2007).
Figure 4C illustrates the second heat sweep of PET/PLA fibers during heating at a rate of 10°C/min following cooling from the molten state at a rate of 5°C/min. As previously observed in Figure 4B, the blends were confirmed to comprise crystalline PET and amorphous PLA. In the case of the PLA homopolymer, an exothermic peak corresponding to the crystallization of PLA was detected. However, as the PET content reached to 80, 85, 90, and 95%, and the PET was already crystallized, the crystallization of PLA was entirely hindered. Furthermore, a small amount of PLA chains is incapable of forming crystal structure during the cooling processing. Consequently, the second heating scan did not exhibit an endothermic peak corresponding to PLA at approximately 160°C. Furthermore, this absence of crystallization may potentially be attributed to transesterification or ester exchange reactions (Xia et al., 2014). Cold crystallization of PET easily takes place despite the presence of PLA, but PET crystallyzation was not well compatible well with increasing PLA value.
Multiple melting endotherms were observed in the first heating sweep at samples that included 10%, 15%, 20%, and 100% PLA. There are differing opinions in the literature regarding the DSC multiple melting behavior of PET and other polymers (Gupta et al., 1993; Wang et al., 2000; Di Lorenzo et al., 2010; Santonja-Blasco et al., 2010; Badia et al., 2012), with two schools of thought. One suggests the presence of separate lamellae populations, while the other proposes a complex combination of melting and recrystallization that can only be detected as a net sum. PET can exhibit multiple endotherms based on factors such as crystallization time, temperature, and DSC scan rate. To accurately explain the observed melting behavior, a combination of both explanations and experimental methods is necessary.
In this work, it is important to note that PLA can inhibit the formation of complete PET crystals and can impact the multiple melting behaviors of PET. Additionally, the role of transesterification should not be overlooked.
The micromorphology of fractured film samples containing neat PET and PLA, blended with 5 and 20 wt% PLA (before and after etching) is depicted in Figure 5. The fractured surface of PLA film clearly demonstrates the brittle nature of this sample (Figure 5B). The immiscibility of two components by the existence of PLA spherical domains in the PET matrix is seen in Figures 5C, D. The average diameter of the PLA agglomerates ranges from 0.42 μm to 2.19 μm. Comparing the solubility parameters of two or more polymers can predict their miscibility. On thermodynamic grounds (Aldas et al., 2021), the Hansen solubility parameters for PET and PLA are fairly close to predicting that they should be miscible (22.6 Mpa 0.5 and 21.5 Mpa 0.5 for PET and PLA, respectively) (Auras et al., 2006; McLauchlin and Ghita, 2016). Andrew et al. believed the molar volume and size of the repeating unit were the important factors causing immiscibility in the blend of PET and PLA. PET has a structure dominated by big aromatic rings, as evidenced by its higher molar volume than PLA, which could explain the two phases of these polymers (McLauchlin and Ghita, 2016). Our results appear to be closer to their findings, and the differing molar volumes of the two phases cause immiscibility between PET and PLA in forms of film with 5 and 20 wt% PLA.
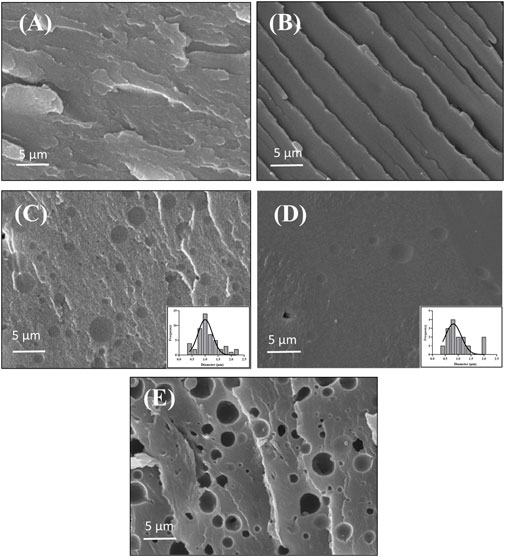
FIGURE 5. Film morphologies of (A) neat PET, (B) neat PLA, (C) PET/PLA blend with 20 wt% PLA, (D) 5 wt% PLA (E) 20 wt% PLA after etching.
The SEM micrographs of the PET/PLA blend in Figures 5C, D, show that on the cryofractured surface, all particles bonded to the matrix are not loose, and a fine dispersion of PLA domains in the PET was achieved during the melt mixing process due to the sufficient compatibility between the PLA phase and the PET matrix (Mehrabi Mazidi and Razavi Aghjeh, 2015). On the other hand, as seen in Figures 5C,D, the interface regions between phases are not sharp, indicating a low interfacial tension between components, resulting in the attachment of PLA particles from the matrix material, which is followed by good adhesion between phases. This finding is in accordance with the interfacial tension and work of adhesion between PET and PLA that were calculated in Part 3.2. In Figure 5E the PLA phase was selectively extracted by dichloromethane to visualize the dispersion state of the PLA phase in the PET matrix. The dispersed PLA phase domains in the PET matrix can be observed in the empty dark cavities visible on the fractured surface.
Furthermore, SEM characterization of the surface morphology of neat and blend fibers was used to investigate the effect of melt flow on PLA orientation (Figure 6). This finding has been reported in references that in the molten blend of PET/PLA, PLA droplets elongated in the direction of flow, implying that the flow of polymer melt affected the alignment of the PLA inclusions (McLauchlin and Ghita, 2016). In this work, the fibers were first produced using a convectional industrial extruder melt extrusion process. Melt extrusion blend was then stretched, resulting in fibers with significantly reduced diameters. This process also causes the PLA phase to be stretched from spherical droplets into an oriented structure within the matrix. Following that, these blends can be stretched in a molten state of PLA in a hot stretching process, leading to highly oriented PLA microfibrils along the fiber axis. So, there is microfibrillar structure in fiber blend systems in all samples, as indicated by hollow continuous spaces with another phase in Figure 6.
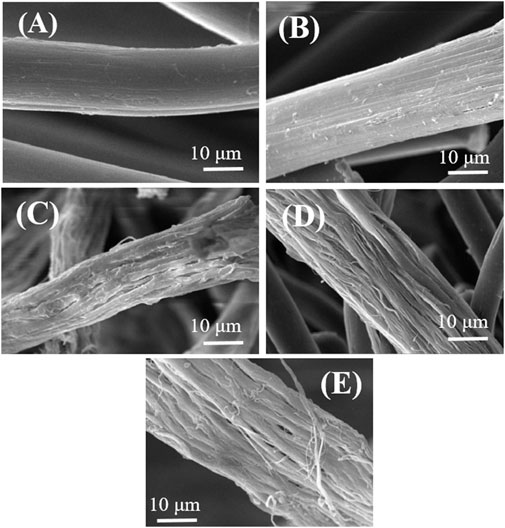
FIGURE 6. SEM photograph of various blend fibers at different post-etching stages (A) neat PET, (B) 5 wt% PLA, (C) 10 wt% PLA, (D) 15 wt% PLA, (E) 20 wt% PLA.
The presence of other compounds can have a significant impact on the crystalline structure of a substance. As a result, it will be interesting to see how the individual and combined presence of semicrystalline PLA affects the crystalline structure of PET in blends. So X-ray diffraction patterns from six different PET/PLA fiber samples were performed and the results are displayed in Figure 7. In the down curve, neat PET fiber shows three broad crystal peaks at 17.51°, 22.80°, and 25.58°. Which correspond to the planes of (010), (
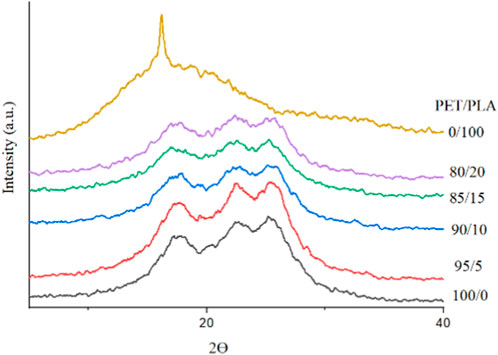
FIGURE 7. XRD patterns of PLA film and PET/PLA fibers.
The PLA fiber diffraction pattern is characterized by a peak reflection at 2Ɵ = 16.38 with a Miller index that corresponds to (110/200) plane (Wang et al., 2015).
The developed crystalline structure in blend fibers, of course, is considered to be PET triclinic crystals because the three Bragg angles mentioned only correspond to the (010), (
Degree of crystallinity was determined from these diffractograms using the method reported in the literature for PET (Chung and Scott, 1973). Using the percent crystallinities measured by X’Pert software, samples with 0, 5, 10, 15, 20, and 100 wt% PLA were 41.37%, 39.38%, 37.06%, 35.44%, 32.78%, and 21.52% crystalline. Total crystallinity can be reduced by increasing the degree of entanglement between the PET and PLA chains. The degree of entanglement between PET and PLA chains is highest in the 80/20 sample. That is, the presence of two components in the blends prevents both parts from crystallizing. The interpenetration and entanglement of the two kinds of polymer chains during the crystallization process of PET/PLA blends reduces the segmental mobility. Hence, it prevents the PET and PLA polymer chains from forming their own crystals (Liang et al., 2008).
Another factor that may limit the development of crystalline structures in blends is the formation of block copolymers due to transesterification (Wu and Cuculo, 1999). Evidence of this reaction has been found in the 1H NMR of PET/PLA melt blend fibers in Figure 3. Transesterification is very likely to occur in this study because an extrusion temperature of 270 °C was chosen. This is because the polymer would remain in the molten state for more than 5 min.
Modulus (cN/Tex) and tenacity (cN/Tex) of as-spun and drawn blend fibers are listed in Supplementary Table S4. As it is seen, the drawing process of the fiber resulted in a significant improvement in both modulus and tenacity. The molecular alignment of PET and PLA phases in the fiber direction is mainly responsible for this enhancement. The enhancement of mechanical performance could potentially be due to the stretching of the PLA dispersion phase into a fibrous shape (Liang et al., 2008).
Modulus, tenacity, and elongation at the beak of drawn fibers are displayed in Figure 8. In Figure 8A the modulus with the addition of PLA to the blend remains in a similar range in samples containing 5, 10, 15, and 20% PLA. There is no significant difference between them. The compatibility between PET and PLA assists in the production of blends with stable mechanical properties (Aldas et al., 2021), as observed by SEM.
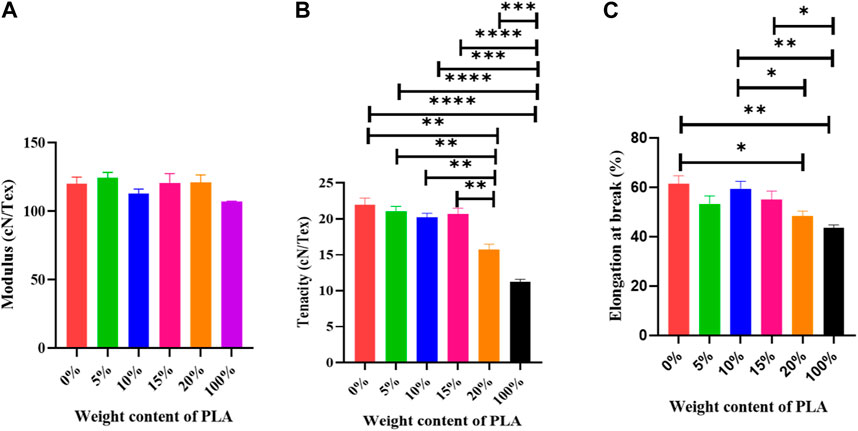
FIGURE 8. Mechanical properties of drawn blend fibers, (A). Modulus, (B) Tenacity (**p < 0.01), (C) Elongation at break (*p < 0.05).
In Figure 8B, the neat PET-drawn fiber shows a tenacity of 21.37 cN/Tex, which is more than all other fibers investigated. The addition of PLA to the process caused a decrease in tenacity. The blend, including 20 wt% PLA, has the lowest tenacity compared to blend fibers. All the samples have significant differences in tenacity PET/PLA: 80/20 and 0/100. Because of the high temperatures used in processing, the schism and emancipation chain of PLA, as well as the decreasing molecular weight of PLA after degradation, caused poor stress transfer after tensile loading. Consequently, the tenacity of PET/PLA blend fibers did not improve (Jompang et al., 2013; Torres-Huerta et al., 2016; You et al., 2018). It is reasonable to believe that during processing, hetero macromolecules or oligomers (PET and PLA) can pair to generate copolymers. Chain scission caused by low-molecular-weight products, on the other hand, is possible. As a result, there is competition between polymer degradation and copolymer formation, which explains the mechanical results (La Mantia et al., 2012).
Furthermore, the addition of PLA to PET alters the aggregation structure and causes crystallization to be disrupted. Mechanical properties also suffer when incomplete crystallization occurs (Xia et al., 2014). As previously stated, DSC and XRD findings show a decrease in crystallinity in blend fibers; hence this factor can also affect the tenacity of the fibers. According to Figure 8C, for compositions up to 10%, elongation is similar to that of neat PET. A significant decrease is seen between neat PLA fiber and PET/PLA with 0, 10 and 15 wt% PLA, demonstrating the brittle structure of PET/PLA blend fibers. This suggests that incorporation of PLA at these concentrations can cause significant sample embrittlement (McLauchlin and Ghita, 2016; You et al., 2018). This could be due to the much more brittle characteristic of the PLA dispersing phase, as seen in Figure 5B.
Supplementary Table S5 shows the shrinkage values of the as-spun and drawn samples. No significant difference is observed between as-spun samples containing 0, 5, or 10 wt% PLA, but shrinkage is reduced significantly in fibers containing 15 and 20 wt% PLA. Significant shrinkage reduction was observed in drawn samples including 20 and 100 wt% PLA. According to the DSC diagram (Figure 4), the crystallization of PET is strongly influenced by increasing PLA value. This means that in this binary blend, the two phases affect each other’s crystallinity. A blend of fibers with a greater PLA content may crystallize harder than fibers with a lower PLA content. This is because when the copolymer is formed, and the transesterification occurs, the PLA chains act as an impediment to PET crystallization and prevent the PET from crystallizing, resulting in a final product with better dimensional stability and less shrinkage (Nofar et al., 2020).
The laboratory composting experiment was carried out to determine the fiber’s sensitivity to disintegration in a laboratory composting experiment. It should be mentioned that this study cannot be taken as an evaluation of the biodegradability of bioplastics (Haryńska et al., 2021).
Our visual data showed that blend fibers containing 10, 20 and 100 wt. %PLA changed their color after 10 days. Clear signs of disintegration, such as a decrease in brightness and an increase in surface roughness after 25 days of disintegration were seen in the blend fibers. The color properties of the samples before and after being placed under composting conditions for 45 days, is shown in Table 10. After 45 days of composting, the lightness value (L*) of the PLA fiber decreased, indicating a reduction in its brightness. Likewise, blend fibers containing PLA exhibited a similar trend (Supplementary Table S6). The YI value is significantly affected by being in the compost environment, and increases after 45 days in compost conditions. Furthermore, positive values for b* suggest a shift towards yellow, which was observed in the blend fiber samples. An increase in the amount of PLA in the PET structure leads to an increase in the total color difference (ΔE) and more yellowing in the sample. Conversely, a slower disintegration rate can be expected for samples that undergo less color change (Arrieta et al., 2014a).
The difference in color or YI observed in the samples is caused by hydrolytic degradation, which changes the refractive index of the fiber through water absorption and low molecular weight hydrolysis products. In addition, PLA hydrolysis leads to changes in polymer crystallinity, resulting in a difference in color (Arrieta et al., 2014a; Aldas et al., 2021).
Examination of four samples over different time periods revealed differences with evident deformation in the SEM results (Figure 9). After 10 days of testing, SEM micrographs revealed the beginning of fractures on the surface of blend fibers with 10 wt% PLA, while fibers containing more than 20% PLA showed some signs of disintegration. Neat PLA fibers, became more breakable after 10 days of compost incubation. As reported by other researchers (Arrieta et al., 2014b; Ramos et al., 2016), these data indicated the start of hydrolytic degradation. The development of low molar mass degradation during hydrolysis and the increase in crystallinity can be ascribed to the hydrolytic breakdown process in PLA blend fibers. Blend fibers containing 10, 20, and 100 wt% PLA after 25 days in composting conditions revealed surface erosion with significant fissures. In contrast, PET fibers revealed a more regular surface. Water absorption and diffusion through the polymer bulk was faster in PLA and blend fibers than in PET fibers, resulting in increased hydrolysis in the polymer chain and the formation of small molecules (monomers and short-chain oligomers) suitable for microorganism attack (Arrieta et al., 2014a; Arrieta et al., 2015).
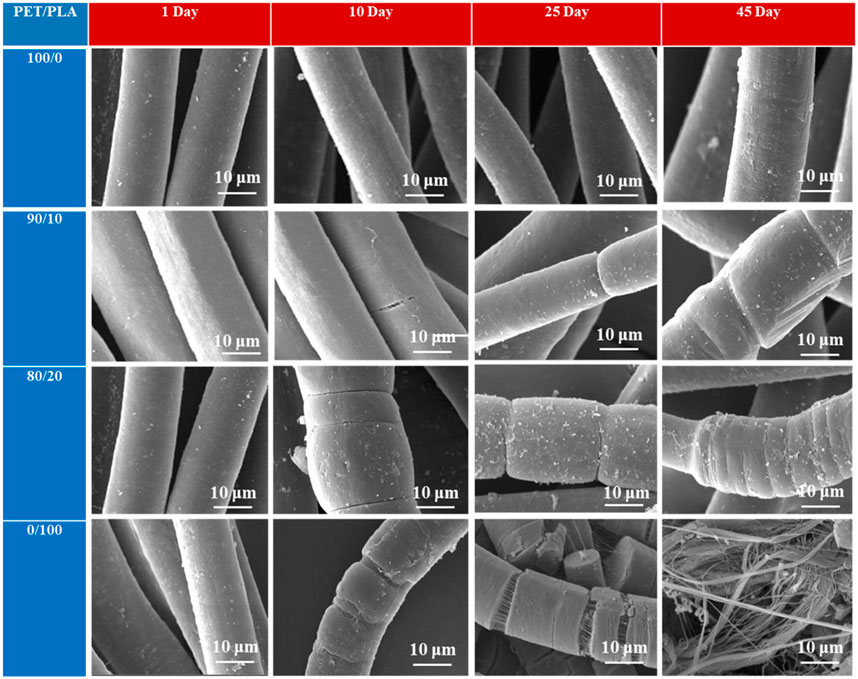
FIGURE 9. Degree of disintegration of: PLA fibers, PET fibers, and their blend under composting conditions as a function of time.
In Figure 10, the evolution of the disintegration values (%) of the fibers over time can be seen. According to Figure 10, After 10 days, there were no significant variations in weight loss of samples with 0, 10, and 20 wt% PLA, but after 25 days, the disintegration rate for all formulations definitely increased. PET/PLA blend fibers with 20% PLA showed a higher disintegration rate (up to 13.6%) after 25 days of composting than PET fibers with almost no Weight loss. For neat PET samples just a slight weight loss was detected after 45 days (0.9%). On the other hand, the blend fibers showed a weight loss of up to 18.5% after 45 days and the disintegration of neat PLA samples was significant (up to 83%). Thus, the observed difference in behavior between neat PET fibers and blend fibers could be attributed to the more hydrophobic character of PET, which protects the polymer matrix from water attack. Furthermore, these findings correspond well with the decreased water contact angle values (Table 1) demonstrated by PLA films. This suggests that because of water absorption, the high molecular polyester chains hydrolyzed, resulting in smaller molecules that are more sensitive to enzymatic reactions by microorganisms, and consequently, the disintegration process is accelerated.
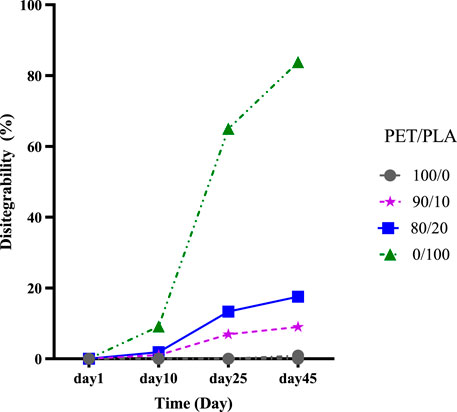
FIGURE 10. Degree of disintegration of PLA and PET fibers, and of blend PET/PLA fibers under composting conditions as a function of time.
It has been suggested that under composting conditions, the disintegration process begins with hydrolysis in the amorphous area of the polymer structure. All of these actions would result in changes in the crystallinity of the polymer (Arrieta et al., 2014a; Arrieta et al., 2015). The denser and more ordered structure in the crystalline regions of the polymer is less accessible to water molecules. It also has higher cohesive forces between chain segments than amorphous domains, which could retain the action of microorganisms and slow their degradation rates (Arrieta et al., 2014a; Markl and Zeitler, 2017). As a result, PET/PLA with 20% PLA showed a higher rate of disintegration than PET/PLA with 10% PLA when PET/PLA (ϕc = 32.7%) is more crystalline than PET/PLA 20 % (ϕc = 30.6%).
As shown in Figure 10, the presence of PLA significantly increased the weight loss and/or disintegration of the PET phase in the blend fibers. For example, the blend sample containing 10% PLA experienced a weight loss of 12.98% after 45 days of testing, while, after the same time period, neat PLA and PET fibers experienced weight losses of 83.79% and 0.9%, respectively. Therefore, we would expect a 9.19% weight loss for this blend fiber sample. This suggests that the intensified effect of PLA on the weight loss and/or disintegration of the PET phase in the blend fibers may be caused either by some interactions involved with the biological degradation of PLA taking place in the composting media or by a mutual effect of the blend components in promoting microplastics that was difficult to identify.
Figure 11 illustrates a close-up of the measured FTIR data of (a) PLA fibers and (b) PET/PLA blend fibers with 10% and 20% PLA, after 10 and 45 days of compost exposure. In terms of crystalline structure, the real contribution of crystallinity changes occurring during the disintegration of PLA samples to their IR profile could be investigated (using the peak at 1,456 cm-1 related to the CH3 group to normalize the results). According to Figure 11A, after exposure to compost treatment for 45 days, the C=O stretching band of the amorphous part of PLA appears at a higher wavenumber (1753 cm-1). The C=O peaks in carbonyl-containing compounds are known to shift to higher wavenumbers as the electron withdrawing effect of α-substituent increases. This may explain why crystalline structures have shorter bond lengths than amorphous structures (Torres-Huerta et al., 2014). As a result of hydrolytic degradation, the intensity of the stretching of the crystalline carbonyl groups, centered at 1753 cm-1, increased for PLA fibers with composting time, resulting in an increase in the number of carboxylic end groups in the polymer chains (Arrieta et al., 2016). Furthermore, during degradation, the corresponding spectra revealed peak shifts and an increase in intensity for bands at 1,129 cm-1 and 1,184 cm-1. These bands are related to asymmetric CH3 and asymmetric C-O-C stretching and rocking vibrations, respectively. Such changes in aliphatic polyesters could be explained by a change in polymer crystallinity (Leroy et al., 2017).
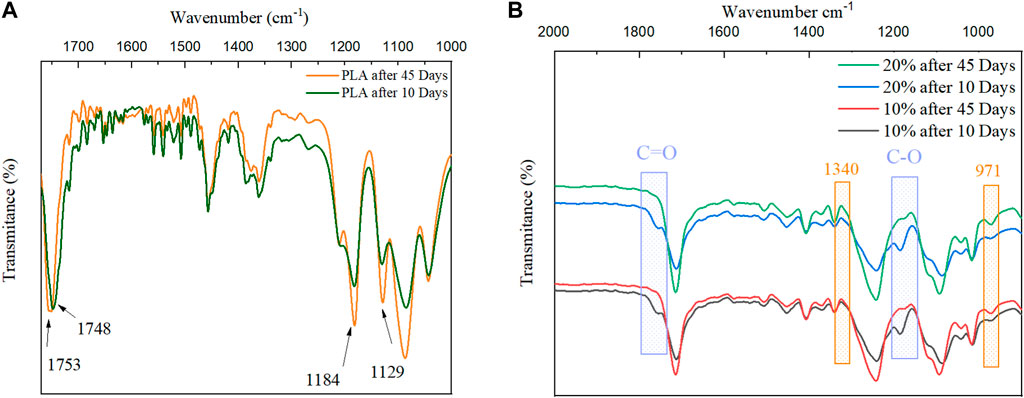
FIGURE 11. FTIR spectra of: (A) PLA fiber, (B) PET/PLA fiber with 10 and 20 wt% PLA after 10 and 45 days of disintegration.
After 45 days, the absence of the PLA band at 1,187 cm -1 and 1753 cm -1, which is related to the C-O stretching vibration aliphatic ester and C=O stretching of aliphatic units, respectively, in Figure 11B indicates that this polymer was degraded during the composting process.
The transmittance peak of PET at 1,340 cm-1 (wagging vibrations of the CH2 trans of the ethylene glycol segment) and the peak at 971 cm-1 (related to the trans of the O–C–C–O–group) are useful for investigating crystallinity in PET (Kitano et al., 1995; Chen et al., 2014). An increase in the intensity of these peaks in both fibers containing 10% and 20% PLA after 45 days, indicates that the disintegration of PLA in the blend fibers also affects PET disintegration, and an increase in the degree of cystallization of PET in the blend was observed after 45 days.
The structural changes in some samples were tracked by analyzing the region of absorption bands (between 2000 cm-1 and 650 cm-1) containing bonds susceptible to degradation. It can be seen that the percentage of trans conformation increases during the process while the amount of gauche conformation decreases.
Considering the environmental issues caused by the non-biodegradable PET polymer and the cost and difficulty of separating PET/PLA blends, it is preferable to explore recycling options for these blends. To this end, we chose to investigate the properties of PET/PLA blends in the form of fibers. In this research, virgin polymers were used due to the challenges of accurately determining the amount of PLA in recycled polymers. Although the results differ from those obtained using recycled polymers, they can help predict the properties of fibers produced from PET/PLA blends.
Extrusion processing produced fiber structures in which even minor phase thin strands can be continuous in the longitudinal direction. PLA particles and PET matrix had good interfacial adhesion in PET/PLA blends. The blend composition had a significant influence on the structure and properties of the blend fibers over the range investigated. The results of the experiments indicated that transesterification occurs during the melt extrusion process, and PET/PLA copolymers are formed. Transesterification lowers the melting point, crystallization temperature, and crystallinity of the samples. The XRD and DSC results of the fiber samples indicated separate crystals of PET rather than cocrystallization, and it was discovered that a small amount of PLA showed a hindrance effect on the crystallization of PET during the melt spinning process. Moreover, the disintegration under composting of the blend fibers was investigated to obtain information about their post-use. It was discovered that disintegration in composting begins in the amorphous phase of the polymer.
The original contributions presented in the study are included in the article/Supplementary Material, further inquiries can be directed to the corresponding author.
MK: Investigation, data curation, Formal analysis, writing-original draft, MM: Project administration, Supervision, Methodology, Conceptualization, HN: Supervision, Methodology, Conceptualization, review and editing. All authors contributed to the article and approved the submitted version.
The authors declare that the research was conducted in the absence of any commercial or financial relationships that could be construed as a potential conflict of interest.
All claims expressed in this article are solely those of the authors and do not necessarily represent those of their affiliated organizations, or those of the publisher, the editors and the reviewers. Any product that may be evaluated in this article, or claim that may be made by its manufacturer, is not guaranteed or endorsed by the publisher.
The Supplementary Material for this article can be found online at: https://www.frontiersin.org/articles/10.3389/fmats.2023.1225200/full#supplementary-material
Acar, I., Durmuş, A., and Özgümüş, S. (2007). Nonisothermal crystallization kinetics and morphology of poly(ethylene terephthalate) modified with poly(lactic acid). J. Appl. Polym. Sci. 106 (6), 4180–4191. doi:10.1002/app.26982
Afgan, S., Ullah, N., Sulaiman, M., Ali, I., Iqbal, T., Younas, M., et al. (2022). High strength insulating polymeric composite based on recycled/virgin polyethylene terephthalate (PET) reinforced with hydrous magnesium silicate (talc). J. Mater. Res. Technol. 21, 3579–3593. doi:10.1016/J.JMRT.2022.10.126
Aldas, M., Pavon, C., De La Rosa-Ramírez, H., Ferri, J. M., Bertomeu, D., Samper, M. D., et al. (2021). The impact of biodegradable plastics in the properties of recycled polyethylene terephthalate. J. Polym. Environ. 29 (8), 2686–2700. doi:10.1007/S10924-021-02073-X
Anstey, A., Codou, A., Misra, M., and Mohanty, A. K. (2018). Novel compatibilized nylon-based ternary blends with polypropylene and poly(lactic acid): fractionated crystallization phenomena and mechanical performance. ACS Omega 3 (3), 2845–2854. doi:10.1021/acsomega.7b01569
Arrieta, M. P., Fortunati, E., Dominici, F., Rayón, E., López, J., and Kenny, J. (2014b). PLA-PHB/cellulose based films: mechanical, barrier and disintegration properties. Polym. Degrad. Stab. 107, 139–149. doi:10.1016/j.polymdegradstab.2014.05.010
Arrieta, M. P., López, J., López, D., Kenny, J., and Peponi, L. (2015). Development of flexible materials based on plasticized electrospun PLA-PHB blends: structural, thermal, mechanical and disintegration properties. Eur. Polym. J. 73, 433–446. doi:10.1016/j.eurpolymj.2015.10.036
Arrieta, M. P., López, J., López, D., Kenny, J., and Peponi, L. (2016). Effect of chitosan and catechin addition on the structural, thermal, mechanical and disintegration properties of plasticized electrospun PLA-PHB biocomposites. Polym. Degrad. Stab. 132, 145–156. doi:10.1016/j.polymdegradstab.2016.02.027
Arrieta, M. P., López, J., Rayón, E., and Jiménez, A. (2014a). Disintegrability under composting conditions of plasticized PLA–PHB blends. Polym. Degrad. Stab. 108, 307–318. doi:10.1016/j.polymdegradstab.2014.01.034
Asakura, T. (1981). 1H and 13C NMR studies on the interaction between N-acetyl-L-alanine methylamide and trifluoroacetic acid. Die Makromol. Chem. 182 (4), 1135–1145. doi:10.1002/macp.1981.021820414
Auras, R., Harte, B., and Selke, S. (2006). Sorption of ethyl acetate and d-limonene in poly(lactide) polymers. J. Sci. Food Agric. 86 (4), 648–656. doi:10.1002/jsfa.2391
Badia, J. D., Strömberg, E., Karlsson, S., and Ribes-Greus, A. (2012). The role of crystalline, mobile amorphous and rigid amorphous fractions in the performance of recycled poly (ethylene terephthalate) (PET). Polym. Degrad. Stab. 97 (1), 98–107. doi:10.1016/j.polymdegradstab.2011.10.008
Bang, G., and Kim, S. W. (2012). Biodegradable poly(lactic acid)-based hybrid coating materials for food packaging films with gas barrier properties. J. Industrial Eng. Chem. 18 (3), 1063–1068. doi:10.1016/j.jiec.2011.12.004
Buasri, A., Ongmali, D., Sriboonpeng, P., Prompanut, S., and Loryuenyong, V. (2018). Synthesis of PET-PLA copolymer from recycle plastic bottle and study of its applications in the electrochromic devices with graphene conductive ink. Mater. Today Proc. 5 (5), 11060–11067. doi:10.1016/j.matpr.2018.01.022
Chandavasu, C., Xanthos, M., and Sirkar, K. K. (2001). Polypropylene blends with potential as materials for microporous membranes formed by melt processing. Polymer 43 (3), 781–795. doi:10.1016/S0032-3861(01)00654-1
Chen, H., Pyda, M., and Cebe, P. (2009). Non-isothermal crystallization of PET/PLA blends. Thermochim. Acta 492 (1–2), 61–66. doi:10.1016/j.tca.2009.04.023
Chen, Y., Zou, H., Liang, M., and Cao, Y. (2014). Melting and crystallization behavior of partially miscible high density polyethylene/ethylene vinyl acetate copolymer (HDPE/EVA) blends. Thermochim. Acta 586, 1–8. doi:10.1016/j.tca.2014.04.007
Chung, F. H., and Scott, R. W. (1973). A new approach to the determination of crystallinity of polymers by X-ray diffraction. J. Appl. Crystallogr. 27, 225–230. doi:10.1107/s0021889873008514
Codou, A., Anstey, A., Misra, M., and Mohanty, A. K. (2018). Novel compatibilized nylon-based ternary blends with polypropylene and poly(lactic acid): morphology evolution and rheological behaviour. RSC Adv. 8 (28), 15709–15724. doi:10.1039/c8ra01707g
Di Lorenzo, M. L., Righetti, M. C., Cocca, M., and Wunderlich, B. (2010). Coupling between crystal melting and rigid amorphous fraction mobilization in poly(ethylene terephthalate). Macromolecules 43 (18), 7689–7694. doi:10.1021/MA101035H
Esmaeilzadeh, Z., Karimi, M., Shoushtari, A. M., and Javanbakht, M. (2021). Linking interfacial energies with proton conductivity in sulfonated poly (ether ether ketone) nanocomposite. Polymer 230, 124067. doi:10.1016/j.polymer.2021.124067
Espartero, J. L., Rashkov, I., Li, S. M., Manolova, N., and Vert, M. (1996). NMR analysis of low molecular weight poly(lactic acid)s. Macromolecules 29 (10), 3535–3539. doi:10.1021/ma950529u
Ferrara, C., and De Feo, G. (2023). Comparative life cycle assessment of two different packaging systems for extra-virgin olive oil: glass bottle vs. 100% recycled polyethylene terephthalate (PET) bottle. Sustainability 15 (4), 3665. doi:10.3390/SU15043665
Flores, I., Etxeberria, A., Irusta, L., Calafel, I., Vega, J. F., Martínez-Salazar, J., et al. (2019). PET-ran-PLA partially degradable random copolymers prepared by organocatalysis: effect of poly(l -lactic acid) incorporation on crystallization and morphology. ACS Sustain. Chem. Eng. 7 (9), 8647–8659. doi:10.1021/acssuschemeng.9b00443
Gere, D., and Czigany, T. (2020). Future trends of plastic bottle recycling: compatibilization of PET and PLA. Polym. Test. 81, 106160. doi:10.1016/j.polymertesting.2019.106160
Gupta, V. B., Radhakrishnan, J., and Sett, S. K. (1993). Interaction between thermal shrinkage and crystallization in axially oriented poly(ethylene terephthalate) fibres and films. Polymer 34 (18), 3814–3822. doi:10.1016/0032-3861(93)90505-5
Haque, M. A., Candlen, K., Peterson, A. M., Ratto, J. A., and Chen, W. T. (2023). Degradation behavior of multilayer packaging films in the presence of a highly acidic sauce. J. Food Eng. 340, 111318. doi:10.1016/j.jfoodeng.2022.111318
Haryńska, A., Janik, H., Sienkiewicz, M., Mikolaszek, B., and Kucińska-Lipka, J. (2021). PLA-potato thermoplastic starch filament as a sustainable alternative to the conventional PLA filament: processing, characterization, and FFF 3D printing. ACS Sustain. Chem. Eng. 9 (20), 6923–6938. doi:10.1021/acssuschemeng.0c09413
Heidari-Rarani, M., Asdollah-Tabar, M., and Mirkhalaf, M. (2023). Experimental investigation and micromechanics-based damage modeling of tensile failure of polymer concrete reinforced with recycled PET bottles. Eng. Fail. Anal. 148, 107197. doi:10.1016/j.engfailanal.2023.107197
Jafari, S. M. A., Khajavi, R., Goodarzi, V., Kalaee, M. R., and Khonakdar, H. A. (2020). Development of degradable poly(ethylene terephthalate)-based nanocomposites with the aid of polylactic acid and graphenic materials: thermal, thermo-oxidative and hydrolytic degradation characteristics. J. Appl. Polym. Sci. 137 (11). doi:10.1002/app.48466
Jompang, L., Thumsorn, S., On, J. W., Surin, P., Apawet, C., Chaichalermwong, T., et al. (2013). Poly (lactic acid) and poly (butylene succinate) blend fibers prepared by melt spinning technique. Energy Procedia 34, 493–499. doi:10.1016/j.egypro.2013.06.777
Kabir, E., Kaur, R., Lee, J., Kim, K. H., and Kwon, E. E. (2020a). Prospects of biopolymer technology as an alternative option for non-degradable plastics and sustainable management of plastic wastes. J. Clean. Prod. 258, 120536. doi:10.1016/j.jclepro.2020.120536
Kakroodi, A. R., Kazemi, Y., Ding, W., Ameli, A., and Park, C. B. (2015). Poly(lactic acid)-based in situ microfibrillar composites with enhanced crystallization kinetics, mechanical properties, rheological behavior, and foaming ability. Biomacromolecules 16 (12), 3925–3935. doi:10.1021/acs.biomac.5b01253
Kakroodi, A. R., Kazemi, Y., Nofar, M., and Park, C. B. (2017). Tailoring poly(lactic acid) for packaging applications via the production of fully bio-based in situ microfibrillar composite films. Chem. Eng. J. 308, 772–782. doi:10.1016/j.cej.2016.09.130
Kenwright, A. M., Peace, S., Richards, R., Bunn, A., and MacDonald, W. (1999). End group modification in poly(ethylene terephthalate). Polymer 40, 2035–2040. doi:10.1016/S0032-3861(98)00433-9
Kitano, Y., Kinoshita, Y., and Ashida, T. (1995). Morphology and crystal structure of an a axis oriented, highly crystalline poly(ethylene terephthalate). Polymer 30 (10), 1947–1955. doi:10.1016/0032-3861(95)91437-C
La Mantia, F. P., Botta, L., Morreale, M., and Scaffaro, R. (2012). Effect of small amounts of poly(lactic acid) on the recycling of poly(ethylene terephthalate) bottles. Polym. Degrad. Stab. 97 (1), 21–24. doi:10.1016/j.polymdegradstab.2011.10.017
Lekube, B. M., and Burgstaller, C. (2022). Study of mechanical and rheological properties, morphology, and miscibility in polylactid acid blends with thermoplastic polymers. J. Appl. Polym. Sci. 139 (8). doi:10.1002/app.51662
Leroy, A., Ribeiro, S., Grossiord, C., Alves, A., Vestberg, R. H., Salles, V., et al. (2017). FTIR microscopy contribution for comprehension of degradation mechanisms in PLA-based implantable medical devices. J. Mater. Sci. Mater. Med. 28 (6), 87. doi:10.1007/s10856-017-5894-7
Li, K., Mao, B., and Cebe, P. (2014). Electrospun fibers of poly(ethylene terephthalate) blended with poly(lactic acid). J. Therm. Analysis Calorim. 116 (3), 1351–1359. doi:10.1007/s10973-013-3583-4
Liang, H., Xie, F., Guo, F., Chen, B., Luo, F., and Jin, Z. (2008). Non-isothermal crystallization behavior of poly(ethylene terephthalate)/poly(trimethylene terephthalate) blends. Polym. Bull. 60 (1), 115–127. doi:10.1007/s00289-007-0832-3
Madhavan Nampoothiri, K., Nair, N. R., and John, R. P. (2010). An overview of the recent developments in polylactide (PLA) research. Bioresour. Technol. 101 (22), 8493–8501. doi:10.1016/j.biortech.2010.05.092
Mallakpour, S. E., and Jabarin, S. A. (2001). Transesterification reaction kinetics of poly(ethylene terephthalate/poly(ethylene 2,6-naphthalate) blends. J. Appl. Polym. Sci. 80 (13), 2422–2436. doi:10.1002/app.1349
Markl, D., and Zeitler, J. A. (2017). A review of disintegration mechanisms and measurement techniques. Pharm. Res. 34, 890–917. doi:10.1007/s11095-017-2129-z
McLauchlin, A. R., and Ghita, O. R. (2016). Studies on the thermal and mechanical behavior of PLA-PET blends. J. Appl. Polym. Sci. 133 (43). doi:10.1002/app.44147
Mehmood, A., Raina, N., Phakeenuya, V., Wonganu, B., and Cheenkachorn, K. (2023). The current status and market trend of polylactic acid as biopolymer: awareness and needs for sustainable development. Mater. Today Proc. 72, 3049–3055. doi:10.1016/j.matpr.2022.08.387
Mehrabi Mazidi, M., and Razavi Aghjeh, M. K. (2015). Effects of blend composition and compatibilization on the melt rheology and phase morphology of binary and ternary PP/PA6/EPDM blends. Polym. Bull. 72 (8), 1975–2000. doi:10.1007/s00289-015-1384-6
Murariu, M., and Dubois, P. (2016). PLA composites: from production to properties. Adv. Drug Deliv. Rev. 107, 17–46. doi:10.1016/j.addr.2016.04.003
Nofar, M., Salehiyan, R., Ciftci, U., Jalali, A., and Durmuş, A. (2020). Ductility improvements of PLA-based binary and ternary blends with controlled morphology using PBAT, PBSA, and nanoclay. Compos. Part B Eng. 182, 107661. doi:10.1016/j.compositesb.2019.107661
Olewnik, E., Czerwiński, W., Nowaczyk, J., Sepulchre, M. O., Tessier, M., Salhi, S., et al. (2007). Synthesis and structural study of copolymers of l-lactic acid and bis(2-hydroxyethyl terephthalate). Eur. Polym. J. 43 (3), 1009–1019. doi:10.1016/j.eurpolymj.2006.11.025
Padee, S., Thumsorn, S., On, J. W., Surin, P., Apawet, C., Chaichalermwong, T., et al. (2013). Preparation of poly (lactic acid) and poly (trimethylene terephthalate) blend fibers for textile application. Energy procedia. 34, 534–541. doi:10.1016/j.egypro.2013.06.782
Park, J. W., and Im, S. S. (2002). Phase behavior and morphology in blends of poly(L-lactic acid) and poly(butylene succinate). J. Appl. Polym. Sci. 86 (3), 647–655. doi:10.1002/app.10923
Porter, R. S., and Wang, L. H. (1992). Compatibility and transesterification in binary polymer blends. Polymer 33, 2019–2030. doi:10.1016/0032-3861(92)90866-U
Qi, X., Ren, Y., and Wang, X. (2017). New advances in the biodegradation of Poly(lactic) acid. Int. Biodeterior. Biodegrad. 117, 215–223. doi:10.1016/j.ibiod.2017.01.010
Ramos, M., Fortunati, E., Peltzer, M., Jimenez, A., Kenny, J. M., and Garrigós, M. C. (2016). Characterization and disintegrability under composting conditions of PLA-based nanocomposite films with thymol and silver nanoparticles. Polym. Degrad. Stab. 132, 2–10. doi:10.1016/j.polymdegradstab.2016.05.015
Rana, K. I. (2019). Usage of potential micro-organisms for degradation of plastics. Open J. Environ. Biol. 4, 007–015. doi:10.17352/ojeb.000010
Sabbatier, G., Le Nouën, D., Chevallier, P., Durand, B., Laroche, G., and Dieval, F. (2012). Air spun poly(lactic acid) nanofiber scaffold degradation for vascular tissue engineering: A 1H NMR study. Polym. Degrad. Stab. 97 (8), 1520–1526. doi:10.1016/j.polymdegradstab.2012.04.017
Santonja-Blasco, L., Moriana, R., Badía, J., and Ribes-Greus, A. (2010). Thermal analysis applied to the characterization of degradation in soil of polylactide: I. Calorimetric and viscoelastic analyses. Polym. Degrad. Stab. 95 (11), 2185–2191. doi:10.1016/j.polymdegradstab.2010.08.005
Shahnooshi, M., Javadi, A., Nazockdast, H., and Altstädt, V. (2020). Development of in situ nanofibrillar poly (lactic acid)/poly (butylene terephthalate) composites: non-isothermal crystallization and crystal morphology. Eur. Polym. J. 125, 109489. doi:10.1016/j.eurpolymj.2020.109489
Shen, M., Song, B., Zeng, G., Zhang, Y., Huang, W., Wen, X., et al. (2020). Are biodegradable plastics a promising solution to solve the global plastic pollution? Environ. Pollut. 263, 114469. doi:10.1016/J.ENVPOL.2020.114469
Snowdon, M. R., Mohanty, A. K., and Misra, M. (2017). Miscibility and performance evaluation of biocomposites made from polypropylene/poly(lactic acid)/Poly(hydroxybutyrate-cohydroxyvalerate) with a sustainable biocarbon filler. ACS Omega 2 (10), 6446–6454. doi:10.1021/acsomega.7b00983
Sriromreun, P., Petchsuk, A., and Opaprakasit, P. (2014). Miscibility and hydrolytic degradability of polylactic acid/poly (ethylene terephthalate-co-lactic acid) blends. Chiang Mai J. Sci. 41 (3), 691–703.
Stewart, M. E., Cox, A. J., and Naylor, D. M. (1993). Reactive processing of poly(ethylene 2,6-naphthalene dicarboxylate)/poly(ethylene terephthalate) blends. Polymer 34 (19), 4060–4067. doi:10.1016/0032-3861(93)90667-Y
Taib, N. A. A. B., Rahman, M. R., Huda, D., Kuok, K. K., Hamdan, S., Bakri, M. K. B., et al. (2023). A review on poly lactic acid (PLA) as a biodegradable polymer. Polym. Bull. 80 (2), 1179–1213. doi:10.1007/S00289-022-04160-Y
Tessier, M., and Fradet, A. (2003). Determination of the degree of randomness in condensation copolymers containing both symmetrical and unsymmetrical monomer units: A theoretical study. E-Polymers. 3 (1). doi:10.1515/epoly.2003.3.1.391
Torres-Huerta, A. M., Del Angel-López, D., Domínguez-Crespo, M. A., Palma-Ramírez, D., Perales-Castro, M. E., and Flores-Vela, A. (2016). Morphological and mechanical properties dependence of PLA amount in PET matrix processed by single-screw extrusion. Polym. - Plastics Technol. Eng. 55 (7), 672–683. doi:10.1080/03602559.2015.1132433
Torres-Huerta, A. M., Palma-Ramírez, D., Domínguez-Crespo, M., Del Angel-López, D., and de la Fuente, D. (2014). Comparative assessment of miscibility and degradability on PET/PLA and PET/chitosan blends. Eur. Polym. J. 61, 285–299. doi:10.1016/j.eurpolymj.2014.10.016
Tran, L. Q. N., Fuentes, C., Dupont-Gillain, C., Van Vuure, A., and Verpoest, I. (2013). Understanding the interfacial compatibility and adhesion of natural coir fibre thermoplastic composites. Compos. Sci. Technol. 80, 23–30. doi:10.1016/j.compscitech.2013.03.004
Tu, Y. Y., Wan, X. T., Huan, J., Zhu, X., and Li, X. H. (2021). The effect of trifluoroacetic acid on molecular weight determination of polyesters: an in situ NMR investigation. Chin. J. Polym. Sci. Engl. Ed. 39 (12), 1590–1596. doi:10.1007/s10118-021-2605-0
Wang, G., Zhao, J., Zhao, H., Lin, J., and Zhao, G., (2020). Strong and super thermally insulating in-situ nanofibrillar PLA/PET composite foam fabricated by high-pressure microcellular injection molding. Chem. Eng. J. 390, 124520. doi:10.1016/j.cej.2020.124520
Wang, Y., Lu, J., and Shen, D. (2000). Calorimetric and infrared spectroscopic analysis of multiple melting endotherms of poly (ethylene terephthalate). nature 32 (7), 560–566. doi:10.1295/polymj.32.560
Wang, Y., Zhang, H., Li, M., Cao, W., Liu, C., and Shen, C. (2015). Orientation and structural development of semicrystalline poly(lactic acid) under uniaxial drawing assessed by infrared spectroscopy and X-ray diffraction. Polym. Test. 41, 163–171. doi:10.1016/j.polymertesting.2014.11.010
Wilson, M. P. W. (1974). Shrinkage and chain folding in drawn poly(ethylene terephthalate) fibres. Polymer 15 (5), 277–282. doi:10.1016/0032-3861(74)90124-4
Wu, G., and Cuculo, J. A. (1999). Structure and property studies of poly(ethylene terephthalate)/poly(ethylene-2,6-naphthalate) melt-blended fibres. Polymer 40, 1011–1018. doi:10.1016/s0032-3861(98)00317-6
Xia, X. L., Liu, W. t., Tang, X. y., Shi, X. y., Wang, L. n., He, S. q., et al. (2014). Degradation behaviors, thermostability and mechanical properties of poly (ethylene terephthalate)/polylactic acid blends. J. Central South Univ. 21 (5), 1725–1732. doi:10.1007/s11771-014-2116-z
Xu, X.-Q., Liao, S., and Wang, Y. (2021). Recycling of thermosetting plastics. Singapore: Springer, 95–119. doi:10.1007/978-981-16-3627-1_5
Yamadera, R., and Murano, M. (1967). The determination of randomness in copolyesters by high resolution nuclear magnetic resonance. J. Polym. Sci. Part A-1 Polym. Chem. 5 (9), 2259–2268. doi:10.1002/pol.1967.150050905
You, X., Snowdon, M. R., Misra, M., and Mohanty, A. K. (2018). Biobased poly(ethylene terephthalate)/Poly(lactic acid) blends tailored with epoxide compatibilizers. ACS Omega 3 (9), 11759–11769. doi:10.1021/acsomega.8b01353
Keywords: poly (ethylene terephthalate), poly (lactic acid), melt-spinning, blend fiber, transesterification, disintegration
Citation: Kheirandish M, Mohaddes Mojtahedi MR and Nazockdast H (2023) Assessing compatibility, tansesterification, and disintegration of PET/PLA fiber blend in composting conditions. Front. Mater. 10:1225200. doi: 10.3389/fmats.2023.1225200
Received: 18 May 2023; Accepted: 18 September 2023;
Published: 12 October 2023.
Edited by:
Mazeyar Parvinzadeh Gashti, GTI Chemical Solutions, United StatesReviewed by:
Joanna Rydz, Polish Academy of Sciences, PolandCopyright © 2023 Kheirandish, Mohaddes Mojtahedi and Nazockdast. This is an open-access article distributed under the terms of the Creative Commons Attribution License (CC BY). The use, distribution or reproduction in other forums is permitted, provided the original author(s) and the copyright owner(s) are credited and that the original publication in this journal is cited, in accordance with accepted academic practice. No use, distribution or reproduction is permitted which does not comply with these terms.
*Correspondence: Mohammad Reza Mohaddes Mojtahedi, bW9qdGFoZWRAYXV0LmFjLmly
Disclaimer: All claims expressed in this article are solely those of the authors and do not necessarily represent those of their affiliated organizations, or those of the publisher, the editors and the reviewers. Any product that may be evaluated in this article or claim that may be made by its manufacturer is not guaranteed or endorsed by the publisher.
Research integrity at Frontiers
Learn more about the work of our research integrity team to safeguard the quality of each article we publish.