 Xin Wang
 Linlin liu1
 Taojin Xu
95% of researchers rate our articles as excellent or good
Learn more about the work of our research integrity team to safeguard the quality of each article we publish.
Find out more
ORIGINAL RESEARCH article
Front. Mater. , 28 July 2023
Sec. Structural Materials
Volume 10 - 2023 | https://doi.org/10.3389/fmats.2023.1220202
This article is part of the Research Topic Recent Advances of Metal Additive Manufacturing in Aerospace View all 4 articles
The stability of the forming layer shape is a critical factor that impacts the final quality of sample morphology in wire and arc additive manufacturing (WAAM). This paper investigates the forming process and control methods to identify ways to optimize the process and improve the quality of the final product. The study aims to enhance the quality and precision of samples produced by the WAAM process by establishing a morphology control method based on image feedback. The focus is on real-time image acquisition using a CCD and simultaneous extraction of forming process parameter characteristics. Using a central composite experimental design, a prediction model is developed to estimate key process parameters and feature sizes of deposits, including deposition height and width. To further analyze the dynamic characteristics of feature sizes of deposited layers, step response identification is conducted using three process parameters as the system input: forming speed, arc current, and wire feeding speed. The experiments are designed to determine the weight of each process parameter and achieve a high level of response speed and precision. The findings indicate that the feature size of the deposited layer is most sensitive to changes in forming speed, followed by wire feeding speed, while arc current has the least impact on feature size. After verification, the monitoring of the deposition height and width was found to be in good agreement with the prediction model, with an accuracy of over 90%. The results of this study can be used for size measurement and optimization of large aviation aluminum alloy components using WAAM technology and to improve the quality of products produced using these processes.
Metal additive manufacturing technology has become a crucial area of manufacturing technology due to its rapid advancement in recent years (Tian et al., 2022). High-performance metal additive manufacturing technology mainly includes synchronous powder feeding (wire feeding), high-energy beam (laser/electron beam) cladding technology, and powder selective laser melting technology (Klocke, 2020). Among them, metal additive manufacturing technology using laser and electron beam as heat sourceshas the problem of low heat source efficiency and high cost, which restricts its application in large-scale component forming. Metal additive manufacturing technology using arc as a heat source has the advantages of high efficiency and low cost, which has been widely concerned in recent years (Ding et al., 2022). The welding heat sources used mainly include gas metal arc welding (GMAW), tungsten inert gas (TIG), and plasma arc welding (PAW).
During the wire and arc additive manufacturing (WAAM) process of large-sized aluminum alloy components, the accumulation of internal heat in the formed parts increases with the number of layers, leading to poor heat dissipation and longer solidification time of the molten pool. This makes it difficult to control the shape of the molten pool, especially at the edges of the parts (Shen et al., 2021). The presence of a liquid molten pool further complicates the control of edge morphology and forming size, as the thermal boundary environment of the molten pool system is non-linear and time-varying due to heat accumulation. Xia et al. (2020) proposed a sensor-based monitoring and control system for the GMAW-based WAAM process, which uses information fusion technology to identify and reduce defects in the manufacturing process. Regarding the the matching of process parameters and component quality, Oliveira et al. (2020) obtained the corresponding relationship between component quality and material properties by optimizing process parameters in the field of direct energy deposition additive manufacturing. Lopes et al. (2020) used milling as the post-processing method for WAAM parts and weighed the relationship between the microstructure, local mechanical properties, high surface quality, and production of the parts. Ke et al. (2022) proposed an improved free surface tracing method using the volume of fluid (VOF) technique, analyzed the changes in transient heat and melt flow, and refined the microstructure of WAAM parts. Rodrigues et al. (2021) optimized the microstructure evolution of 316 L stainless steel parts manufactured by WAAM through advanced material characterization and thermodynamic calculation, combined with several heat treatment methods. This method can be used for field detection of large as-built components. To achieve an automated WAAM system, it is crucial to monitor and control the surface morphology quality and dimensional accuracy of each deposition layer in real-time, in addition to having the necessary hardware equipment (Ribeiro et al., 2019).
In order to realize the real-time control of the morphology of the deposited layer in the WAAM, the U.S. Navy SBIR project proposed a method that combines machine vision technology to measure the molten pool size and temperature field online, resulting in improved surface quality and dimensional accuracy of the component (National Academies of Sciences et al., 2020). Wang et al. (2018) proposed a closed-loop control system based on visual and neural network technology in the process of metal droplet spraying and automatically adjusted the applied driving voltage based on visual detection results to compensate for the influence of uncertainty (droplet volume, velocity, and historical position). Huang et al. (2018a) studied the free surface oscillation of the molten pool using a detection and sensing method based on laser vision when the current changes from peak to base and the molten pool is fully penetrated. Professor Suárez from the University of Basque proposed a mesh matrix efficient control strategy that increases the productivity of wire arc additive manufacturing by approximately 25% and establishes a traceability mapping of process variables for medium-sized aviation components. However, this method has fewer controllable parameters, while other variables act as noise or additional parameters (Suárez et al., 2021). Koli et al. (2022) utilized uni-directional and bi-directional path planning strategies to avoid material waste and humping defects in manufacturing samples, but non-uniform size components still resulted in some material waste. Huang et al. (2018b) developed a laser vision-based sensing system, which uses a low-power laser point pattern to project to the whole molten pool surface, and the projection of its reflected light is captured by the camera. Then, the molten pool surface information of gas tungsten arc welding (GTAW) is successfully observed. Francis and Bian (2019) of Mississippi State University designed a geometric error compensation framework using a convolutional neural network (CNN) model and significantly improved the geometric accuracy of components through a reverse compensation CAD model. Ramalho et al. (2022) analyzed the acoustic signal by analyzing the time-domain and frequency-domain technology, obtained the location of component flaw formation, and ensured the flaw-free production of WAAM. Xiong et al. (2020) used a biprism and camera to form a virtual binocular vision sensing system. The detection error of the molten pool width of the extracted wire arc additive manufacturing was less than 3%, and a fuzzy intelligent controller was designed to adjust the current in real-time to compensate for the deviation of the molten pool width, which improved the consistency of the width of thin-walled components.
While there are numerous studies on the online monitoring of molten pool morphology in traditional welding processes, there are few reports on the dynamic response characteristics and size prediction of process parameters and deposition morphology in the WAAM process. This study utilizes machine vision sensing technology to establish a real-time image acquisition system for the morphology of deposits in aluminum alloy Variable Polarity TIG WAAM. Through response surface central composite experiments, the prediction model of key process parameters and deposition height and width was established. Through step response identification and dynamic characteristic analysis, the weight of process parameters is determined.
A tungsten inert gas welding-based additive manufacturing system is mainly composed of an arc heat source, a wire feeding system, a motion control system, and an image acquisition system, as shown in Figure 1. The welding heat source used in the experiment is the Fronius MW3000 welding machine, which can output variable polarity pulse square wave. Its cathode cleaning function can remove the oxide film (Al2O3) on the surface of aluminum alloy and effectively avoid oxide inclusions in the deposition process. The wire feeding system includes a wire feeding machine and a wire feeding position adjusting mechanism, in which the height angle and the left/right position of the wire feeding can be adjusted, respectively. The motion control system adopts the Googol GTS-400 motion control card and servo driver to realize high-precision motion control of the servo motor. The forming substrate is fixed on the three-dimensional moving platform by the mica heat insulation plate. The three-dimensional moving platform moves at a certain speed according to the layered deposition path of the component under the control of the motion controller. The layer-by-layer formation is realized by continuous metal droplet transfer, deposition, and rapid solidification.
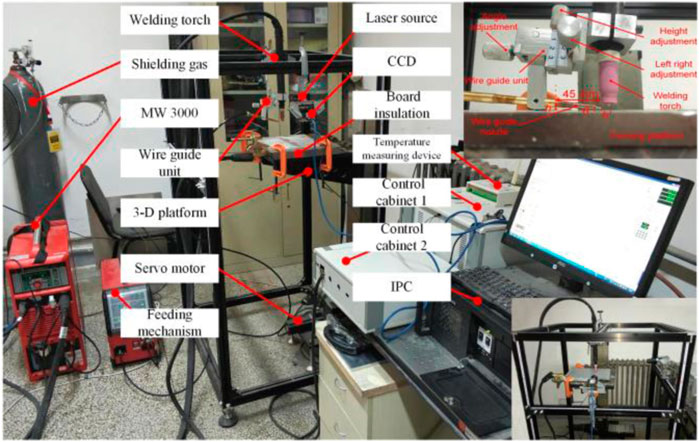
FIGURE 1. Variable polarity TIG WAAM—schematic.
In the process of TIG welding-based additive manufacturing of aluminum alloy, the physical metallurgical phenomena are complex, the parameters are numerous, and the forming time is longer. In the process of layer-by-layer formation, the components have long experienced the effects of periodic non-steady cycle heating and cooling of high-energy beam heat sources and short-term non-equilibrium cycle solid-state phase transformation, which makes it difficult to guarantee the stability of the deposited layer, and the stability of the deposited layer is the premise to ensure the sustainability of the TIG welding-based additive manufacturing process. This research is based on the coordinated control of motion and arc; the German Basler area array camera aca1300-200 UC was selected, and two Ricoh lenses with focal length of 12.0 mm and 8.0 mm were used. A dynamic control system of deposition layer morphology based on machine vision is built to monitor the geometric feature data of components in the forming process. The purpose is to select the forming process parameters based on the data monitoring technology to ensure forming accuracy. First, the calibration plate is sampled, and the polynomial model is selected for distortion correction. The captured images were processed by Gaussian filtering, binarization, Laplacian enhancement, and region of interest (ROI) setting. The weighting factor is determined according to the specific shape, random noise and positive distribution noise are removed, and then the Sobel operator is used for edge extraction. The sample surface quality image detection flowchart and image processing flowchart are shown as follows Figure 2.
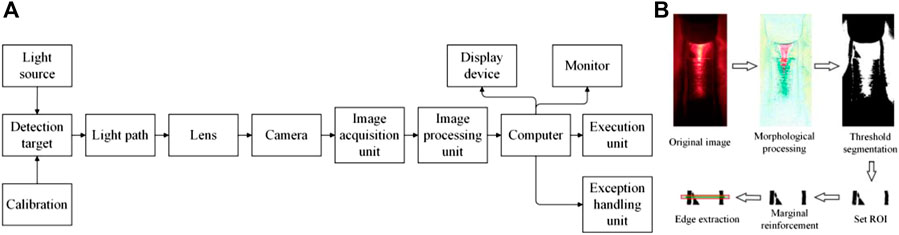
FIGURE 2. Visual inspection flowchart and actual images. (A) Sample surface quality image detection flowchart. (B) Image processing flowchart.
To enhance the contrast of the captured image depicting the morphology of the deposited layer under intense arc conditions, we employ a neutral dimmer with a transmittance of 5% in conjunction with an NP 650 filter. The NP 650 filter has a center wavelength of 650 nm and a half-wavelength width of 30 nm. In order to improve the clarity of the collected image of the deposited layer during the forming process, a laser beam with 250 mW power and 650 nm wavelength was selected to irradiate the deposited area. The coherence of the laser itself is good, and the narrow band filter can enable more light from this band enter the camera, improve the clarity of the collected image, and make the details more accurate. The surface morphology of the formed part can be described by layer width and layer height, where the layer height is the total height from the substrate surface to the upper surface of the formed layer. The deposited layer morphology and measured feature size are shown in Figure 3.
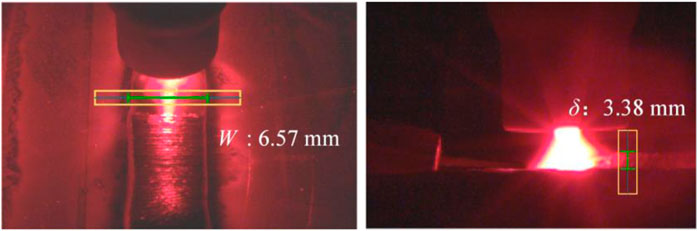
FIGURE 3. Deposited layer morphology and measured feature size.
For this aluminum alloy forming experiment, a vision system was utilized. The first step involved sampling the calibration plate, for which an efficient calibration method based on lines was proposed by Thormählen T and Broszio H. The selected calibration plate was an acrylic plate with a thickness of 3 mm, featuring 7*7 marking points with a center distance of 4 mm and a dot diameter of 2.0 mm. A black frame with a line width of 0.75 mm was also included. The polynomial model was used for calibration, and 16 pictures were collected for this purpose. It is important to note that the images used for industrial camera calibration should be appropriate, with a preferred selection range of 10–20 images. If the spatial position of the industrial camera changes or the camera’s aperture changes during the calibration process, it needs to be re-calibrated under the current working conditions. Once the images are captured, they are processed using Gaussian filtering, binarization, Laplacian enhancement, and ROI setting. The weighting factor is determined based on the specific shape, and randomly and positively distributed noises are removed. Finally, the Sobel operator is used for edge extraction to obtain information about the width of the deposited layer. Figure 3 illustrates the process of obtaining this information.
In the process of layer-by-layer formation, the main input variables that significantly affect the feature size of the deposited layer are forming speed, arc heat input, wire feeding speed, and droplet entry angle. Combined with the experimental conditions and operability of the process parameters, the effects of three process parameters—forming speed, arc current, and wire feeding speed—on the feature size of the deposition layer were studied. The experimental process parameters are shown in Table 1.

TABLE 1. Process parameters of 7A09 aluminum single-layer, single-pass additive manufacturing.
In order to reduce the number of experiments, obtain effective experimental data, and determine the relationship between key process parameters and the feature size of the deposited layer, a central composite experiment design of response surface is selected. First, the level coding interval of process parameters is set, and the functional relationship between factors and response values is fitted by a multiple regression equation. Finally, the optimization and prediction of the process parameter interval are realized. The level coding of the three process parameters is shown in Table 2.
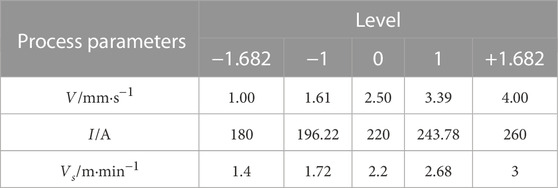
TABLE 2. Corresponding values of three factors at each coding level.
The forming speed V, arc current I, and wire feeding speed Vs are selected as independent variables through the experimental design of three factors and five level centers. The width W and height δ of cross section of the layer for response value. The cross-sectional width W and cross-sectional height of single-layer deposition δ The figure is shown in Figure 4. When the height and width are measured, the forming length of each single pass is about 160 mm. Due to the limited responsiveness of liquid flow at the beginning and end of the deposition layer, a small accumulation of liquid flow occurs. To address this, we have selected a stable forming section of 150 mm in the middle. Within this section, we have chosen one measuring point every 10 mm. Three measurements were conducted at each point, and the average value was calculated. The experimental matrix and corresponding results were then determined using Design-Expert software, as presented in Table 3. Here, the data are measured with the Vernier scale, and each measurement error is ±0.05 mm.
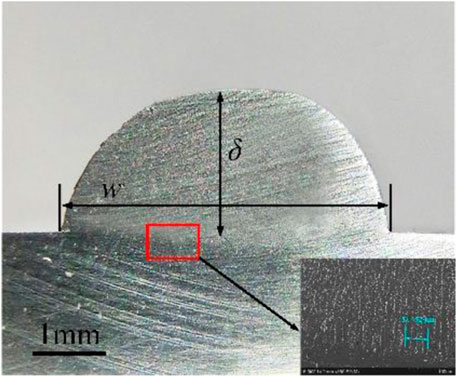
FIGURE 4. Cross-section profile of single-layer deposition.
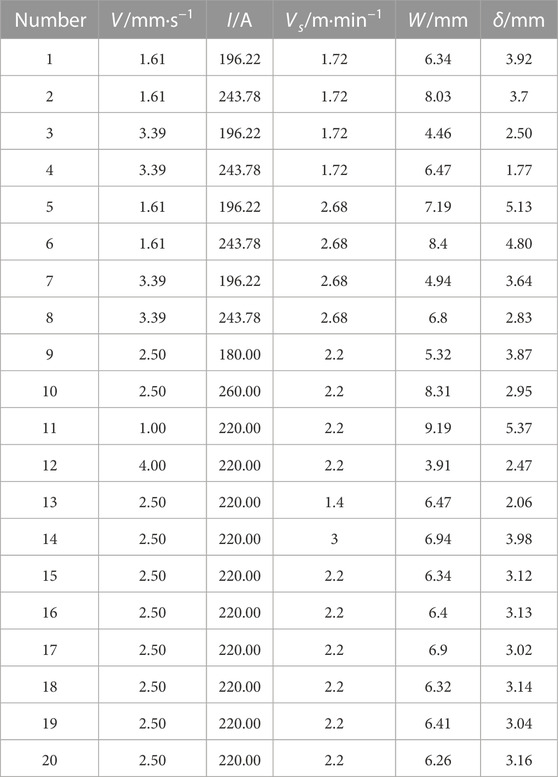
TABLE 3. Central composite experiment results of single-layer single pass.
Using the commonly used linear mathematical model and quadratic mathematical model, the multivariate equation of the process parameters corresponding to the layer height δ and width W in the actual space is calculated. Then, the following verification is carried out for polynomials: the significance verification of the polynomial equation, the fitting degree check of the polynomial equation, and the coefficient test of the polynomial equation. The final equation in terms of actual factors can be obtained as follows:
In this group experiment, the actual measured value and predicted values of the deposit size are shown in Figure 5. The diagonal line in the figure is the line with the same actual value and predicted value. It can be seen from the figure that the real value is randomly and closely arranged on both sides of the line, which shows that the established model equation has good fitting degree and high prediction accuracy.
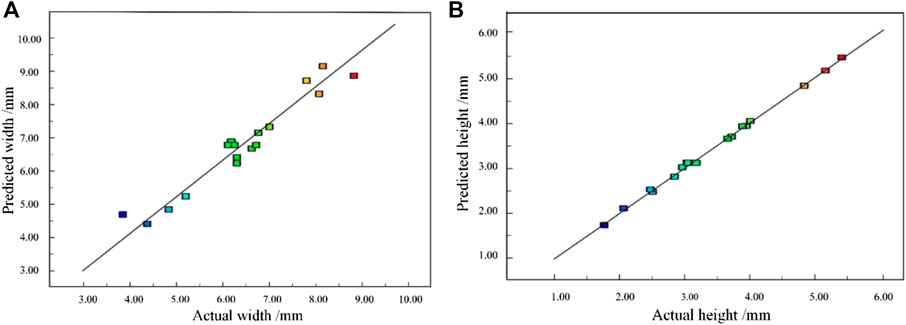
FIGURE 5. Actual measured value and predicted values of the deposit size. (A) Layer width. (B) Layer height.
In order to further verify the applicability of the model, another three groups of parameters were selected to verify the experiment. Under the same experimental conditions, the error analysis between the experimental results and the predicted values of the model was carried out, as shown in Table 4. The results show that there is a certain error between the predicted value and the actual value; the maximum error in the deposition layer height is 9.88%, the maximum error in the deposition layer width is 7.6%, and the error is within 10%. It shows that the model has a good effect within the range of experimental design parameters and has practical significance.
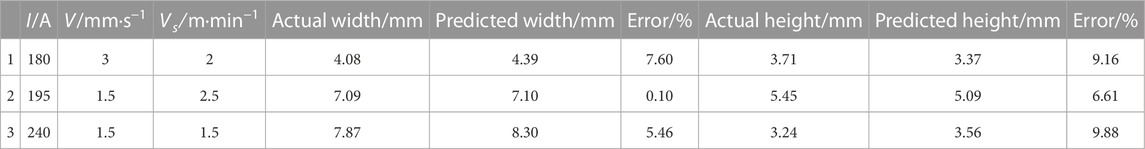
TABLE 4. Verification of experimental results.
The step response can reflect the dynamic characteristics of the system, and the obtained parameters can be used as input signals for system identification. Through the basic experiment of the TIG welding-based additive manufacturing process, the effect of the main process parameters on the feature size of the formed layer has been preliminarily obtained, but the dynamic response of the process parameters in the forming process is not clear. Therefore, it is necessary to analyze the variation characteristics of actual process parameters (time constant, gain coefficient, and time lag coefficient). The step-response experiment of TIG arc additive manufacturing process parameters was carried out. The classical identification method was used to compare the dynamic response characteristics. The variation characteristics of single process parameters in the actual forming process were analyzed. The online size control variables were determined, and the transfer function in the single-variable system was obtained. Through the built dual vision monitoring system, after calibration, it can capture the single-layer, single-pass image macro-morphology feature size information changes in the forming process. The sampling period is 0.2 s, and the process parameters of the step-repsonse experiment are shown in Table 1.
The step change in single-layer, single-pass feature size can be approximately considered a first-order system. When using the MATLAB system identification toolbox to identify the step response, the step process parameters are taken as the input, and the feature size change is taken as the output. The corresponding gain coefficient K, time constant Ts, and time lag coefficient τ are identified.
The positive step value of forming speed is ΔV = 1.5 mm s−1, the positive step change in forming speed is 2.5–4 mm s−1, the negative step change of forming speed is ΔV =−1.5 mm s−1, and the negative step change in forming speed is 2.5–1.0 mm s−1. The other process parameters remain unchanged. The change in forming speed will lead to a total change in forming time, that is, a change in the number of sampling points. Data processing was performed on data collected before and after the issuance of the step signal, with a sampling period of 0.2 s.
The single-variable control method is also used in the forming process experiment of the step response of arc current, and the digital control of Fronius MW3000 is carried out by the host computer. The positive step change value of arc current is ΔI = 40 A, the positive step change range of arc current is 220–260 A, the negative step change value of arc current is ΔI =−40 A, and the negative step change range of arc current is 220–180 A.
The wire feeding speed Vs can directly change the effect of droplet feeding into the molten pool and has a significant influence on the formed layer or substrate of the formed layer. This parameter change can obviously affect the macro-morphology of the formed deposition layer. The step response of wire feeding speed is realized by adjusting the wire feeding control system; the positive step change value of wire feeding speed is ΔVs = 0.8 m min−1, and the step change range is 2.2–3.0 m min−1. The negative step change value of wire feeding speed is ΔVs =−0.8 m min−1, and the step change range is 2.2–1.4 m min−1. The aforementioned experimental parameters are identified by the first-order system, and the gain coefficient, time constant, and time lag coefficient are also determined.
The identification results of the system are shown in Table 5. In the table, the relevant data given are not the variations of experimental parameters, but the values of the system dynamic response parameters, which are calculated according to the first-order system transfer function Formula 1 and system input (forming speed, arc current, and wire feeding speed) and system output (layer height and width) according to the MATLAB system identification toolbox. In the case of step-forming speed, the time lag coefficient of layer width is smaller than that of layer height. According to the step of the arc current, the gain coefficient of layer width change caused by arc current change is larger than that of layer height change. The time lag coefficient of arc current response to layer height and width is almost real-time. From the gain coefficient of the wire feeding speed step, the negative step is found to be greater than the positive step. The negative step of wire feeding speed has more effect on the width than on the height of the deposit layer.
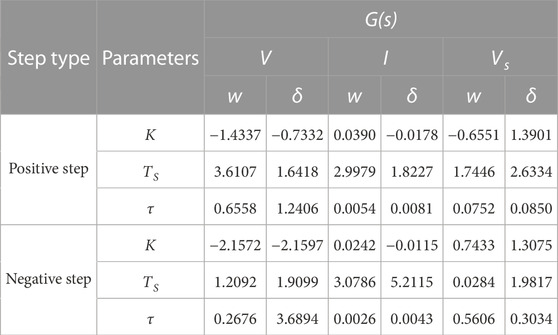
TABLE 5. Relationship between forming speed steps and deposited feature size analysis under response factors.
The step of forming speed has the greatest influence on the feature size of the deposited layer, and the gain coefficient and time lag coefficient are 2.15 and 0.26, respectively. The response of deposition layer feature size to arc current is the fastest, followed by that of forming speed and wire feeding speed. The gain coefficient of the deposition layer feature size was found to be the highest for the step of forming speed, followed by wire feeding speed, and the smallest for arc current. Additionally, there was a time lag in the response of the deposition layer feature size to the process parameters. Based on the response speed and gain coefficient of the deposition layer size, it is recommended to select forming speed as the control variable for deposition layer size in dynamic control.
Figures 6A–L represent the experimental results for the following steps: a: the width of the positive step layer of forming speed, b: the height of the positive step layer of forming speed, c: the width of the negative step layer of forming speed, d: the height of the negative step layer of forming speed; e: the width of the positive step layer of arc current, f: the height of the positive step layer of arc current, g: the width of the negative step layer of arc current, h: the width of the negative step layer of arc current; i: the width of the positive step layer of wire feeding speed, j: the height of the positive step layer of wire feeding speed, k: the width of the negative step layer of wire feeding speed, and l: the height of the negative step layer of wire feeding speed. An analysis was conducted on the width and height of the positive and negative step layers of wire feeding speed, revealing that deposition layer morphology was primarily influenced by the negative step-forming speed. The positive step of wire feeding speed had a negligible effect on the width of the layer, whereas the positive step of arc current had a minimal impact on the height of the layer.
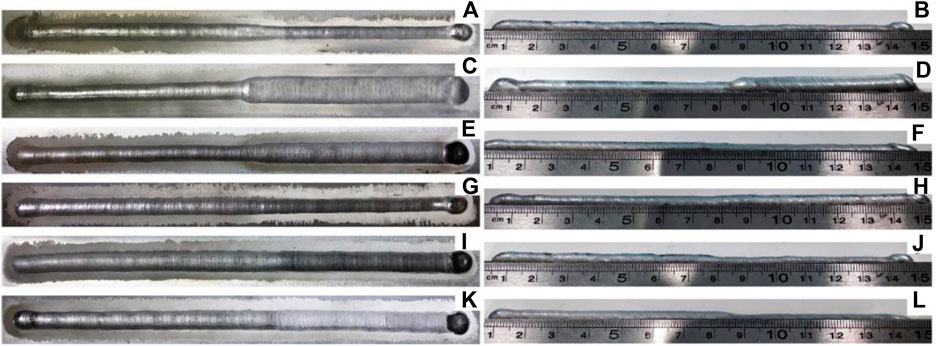
FIGURE 6. Sample morphology of the step experiment.
Taking the forming speed step as an example, the local magnification near the step point is shown in Figures 7, 8. Combined with the deposition layer feature size and process parameter model established in the previously mentioned section, the theoretical layer height and layer width of the prediction model can be obtained from the deposition layer prediction formula of Eqs. 1, 2.
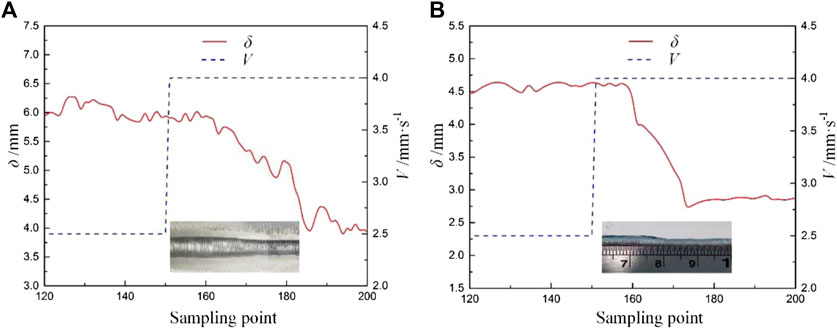
FIGURE 7. Near the step point when the forming speed changes in a positive step. (A) Width. (B) Height.
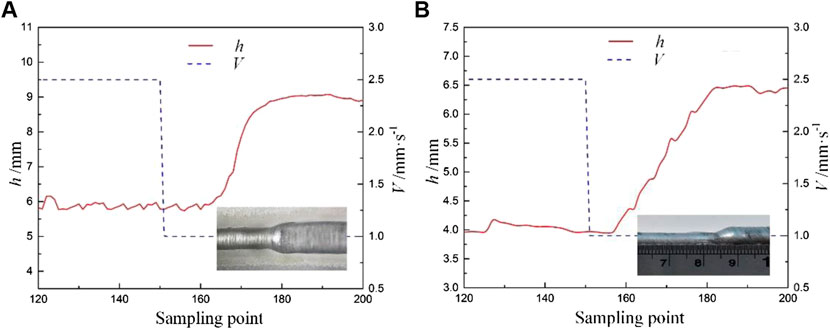
FIGURE 8. Near the step point when the forming speed changes in a negative step. (A) Width. (B) Height.
Finally, the error between the dynamic monitoring and prediction models is obtained through calculation. During the actual measurement with the vernier caliper, we remove the starting position of the head and the ending position of the tail, set a measurement point every 10 mm, measure each point three times, the error of each point is within ±0.1 mm, and then take the average value for recording, as shown in Table 4 in the paper. The statistical results are shown in Table 6. According to the comprehensive analysis given in the table, the average relative error of the layer width is 8.21%, the average relative error of the layer height is 9.29%, and the comprehensive accuracy can reach more than 90%. The results show that the prediction model based on a vision sensor can meet the requirements of submillimeter measurement accuracy and repeatability of the deposition layer in the TIG arc additive manufacturing process.
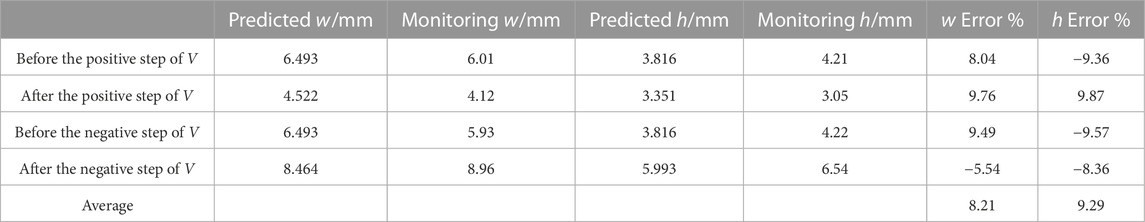
TABLE 6. Comparison of height/width dynamics monitoring and prediction models under step experiment.
In this paper, we developed a morphology control method for the aluminum alloy WAAM deposition layer based on machine vision. This method allows for real-time monitoring of the deposition process, which can help improve the stability and quality of the forming layer. The researchers conducted experiments to verify the effectiveness of this method and found that it was successful in controlling the morphology of the aluminum alloy WAAM deposition layer. The main conclusions are as follows.
• A prediction model for the characteristic size of a deposited layer in WAAM was established. This model takes the forming speed, arc current, and wire feeding speed as inputs and was developed using a central composite experiment. Dynamic experiments were conducted, and it was found that the results of monitoring the layer height and width were consistent with the predictions made by the model. In fact, the maximum error of the deposition layer height is 9.88%, the maximum error of the deposition layer width is 7.6%, and the error is within 10%.
• Step-response identification and dynamic characteristic analysis were used to determine the weight of process parameters in WAAM. Forming speed has the greatest influence on the feature size of the deposited layer, and the gain coefficient and time lag coefficient are 2.15 and 0.26, respectively. Based on the analysis, the forming speed should be selected as the main control variable for deposit characteristic size in dynamic control. This decision was made based on considerations of the response speed and gain coefficient of deposit size.
• In this study, we focused on analyzing the effect of three main process parameters on the morphology of the aluminum alloy WAAM deposition layer. However, there are many other process parameters that could also affect the morphology of the deposited layer. Therefore, in subsequent work, we plan to analyze the angle of welding wire entering the molten pool and the interlayer temperature distribution, and the feedback control system of the forming process will be improved in combination with visual monitoring. Technical support for the production and manufacturing of large-sized aerospace components will be provided.
The original contributions presented in the study are included in the article/supplementary material; further inquiries can be directed to the corresponding authors.
XW and Ll proposed experimental methods and wrote manuscripts; CZ and TX performed platform construction, experimental operation, and data acquisition; ML and XH analyzed the data and carried out software development. All authors contributed to the article and approved the submitted version.
This work was financially supported by the Scientific and Technological Research Program of Chongqing Municipal Education Commission (No. KJQN202100601) and Chongqing Research Program of Basic Research and Frontier Technology (cstc2021jcyj-bsh0178).
Author XH was employed by Chongqing Industrial Big Data Innovation Center Co., Ltd.
The remaining authors declare that the research was conducted in the absence of any commercial or financial relationships that could be construed as a potential conflict of interest.
All claims expressed in this article are solely those of the authors and do not necessarily represent those of their affiliated organizations, or those of the publisher, the editors, and the reviewers. Any product that may be evaluated in this article, or claim that may be made by its manufacturer, is not guaranteed or endorsed by the publisher.
Ding, D., Huang, R., Zhang, X., Yuan, L., Wang, K., and He, K. (2022). Research progress of wire arc additive manufacturing: multi-source information sensing. Weld. Technol. 51 (10), 21. doi:10.13846/j.cnki.cn12-1070/tg.2022.10.024
Francis, J., and Bian, L. (2019). Deep learning for distortion prediction in laser-based additive manufacturing using big data. Manuf. Lett. 20, 10–14. doi:10.1016/j.mfglet.2019.02.001
Huang, J. K., Yang, M. H., Chen, J. S., Yang, F., Zhang, Y., and Fan, D. (2018a). The oscillation of stationary weld pool surface in the GTA welding. J. Mater. Process. Technol. 256, 57–68. doi:10.1016/j.jmatprotec.2018.01.018
Huang, J., He, J., He, X., Shi, Y., and Fan, D. (2018b). Study on dynamic development of three-dimensional weld pool surface in stationary GTAW. High Temp. Mater. Process. 37 (5), 455–462. doi:10.1515/htmp-2016-0224
Ke, W. C., Oliveira, J. P., Cong, B. Q., Ao, S., Qi, Z., Peng, B., et al. (2022). Multi-layer deposition mechanism in ultra high-frequency pulsed wire arc additive manufacturing (WAAM) of NiTi shape memory alloys. Addit. Manuf. 50, 102513. doi:10.1016/j.addma.2021.102513
Klocke, F. (2020). Rapid prototyping and rapid tooling [R/OL]. Available at: http://www.ipt.fraunhofer.de.
Koli, Y., Yuvaraj, N., Sivanandam, A., and Vipin, (2022). Control of humping phenomenon and analyzing mechanical properties of Al–Si wire-arc additive manufacturing fabricated samples using cold metal transfer process. Proc. Institution Mech. Eng. Part C J. Mech. Eng. Sci. 236 (2), 984–996. doi:10.1177/0954406221998402
Lopes, J. G., Machado, C. M., Duarte, V. R., Rodrigues, T. A., Santos, T. G., and Oliveira, J. (2020). Effect of milling parameters on HSLA steel parts produced by Wire and Arc Additive Manufacturing (WAAM). J. Manuf. Process. 59, 739–749. doi:10.1016/j.jmapro.2020.10.007
National Academies of Sciences, Engineering, and Medicine (2020). Review of the SBIR and STTR programs at the department of energy. Washington, DC: Natl Academies Press.
Oliveira, J. P., LaLonde, A. D., and Ma, J. (2020). Processing parameters in laser powder bed fusion metal additive manufacturing. Mater. Des. 193, 108762. doi:10.1016/j.matdes.2020.108762
Ramalho, A., Santos, T. G., Bevans, B., Smoqi, Z., Rao, P., and Oliveira, J. (2022). Effect of contaminations on the acoustic emissions during wire and arc additive manufacturing of 316L stainless steel. Addit. Manuf. 51, 102585. doi:10.1016/j.addma.2021.102585
Ribeiro, R. A., Dos Santos, E. B. F., Assunção, P. D. C., Braga, E. M., and Gerlich, A. P. (2019). Cold wire gas metal arc welding: Droplet transfer and geometry. Weld. J. 98 (5), 135S–149S. doi:10.29391/2019.98.011
Rodrigues, T. A., Escobar, J. D., Shen, J., Duarte, V. R., Ribamar, G., Avila, J. A., et al. (2021). Effect of heat treatments on 316 stainless steel parts fabricated by wire and arc additive manufacturing: Microstructure and synchrotron X-ray diffraction analysis. Addit. Manuf. 48, 102428. doi:10.1016/j.addma.2021.102428
Shen, J., Zeng, Z., Nematollahi, M., Schell, N., Maawad, E., Vasin, R., et al. (2021). In-situ synchrotron x-ray diffraction analysis of the elastic behaviour of martensite and H-phase in a NiTiHf high temperature shape memory alloy fabricated by laser powder bed fusion. Addit. Manuf. Lett. 1, 100003. doi:10.1016/j.addlet.2021.100003
Suárez, A., Aldalur, E., Veiga, F., Artaza, T., Tabernero, I., and Lamikiz, A. (2021). Wire arc additive manufacturing of an aeronautic fitting with different metal alloys: From the design to the part. J. Manuf. Process. 64, 188–197. doi:10.1016/j.jmapro.2021.01.012
Tian, X., Wu, L., Gu, D., Yuan, S., Zhao, Y., Li, X., et al. (2022). Roadmap for additive manufacturing: Toward intellectualization and industrialization. Chin. J. Mech. Eng. Addit. Manuf. Front. 1, 100014. doi:10.1016/j.cjmeam.2022.100014
Wang, T., Kwok, T. H., Zhou, C., and Vader, S. (2018). In-situ droplet inspection and closed-loop control system using machine learning for liquid metal jet printing. J. Manuf. Syst. 47, 83–92. doi:10.1016/j.jmsy.2018.04.003
Xia, C., Pan, Z., Polden, J., Li, H., Xu, Y., Chen, S., et al. (2020). A review on wire arc additive manufacturing: Monitoring, control and a framework of automated system. J. Manuf. Syst. 57, 31–45. doi:10.1016/j.jmsy.2020.08.008
Keywords: wire and arc additive manufacturing, aluminum alloy, feature size of deposited layers, prediction model, step response
Citation: Wang X, liu L, Zhou C, Xu T, Luo M and Hu X (2023) Dynamic control of aluminum morphology by wire and arc additive manufacturing based on image feedback. Front. Mater. 10:1220202. doi: 10.3389/fmats.2023.1220202
Received: 10 May 2023; Accepted: 07 July 2023;
Published: 28 July 2023.
Edited by:
Xuewei Fang, Xi’an Jiaotong University, ChinaReviewed by:
Manidipto Mukherjee, Central Mechanical Engineering Research Institute (CSIR), IndiaCopyright © 2023 Wang, liu, Zhou, Xu, Luo and Hu. This is an open-access article distributed under the terms of the Creative Commons Attribution License (CC BY). The use, distribution or reproduction in other forums is permitted, provided the original author(s) and the copyright owner(s) are credited and that the original publication in this journal is cited, in accordance with accepted academic practice. No use, distribution or reproduction is permitted which does not comply with these terms.
*Correspondence: Xin Wang, d2FuZ3hAY3F1cHQuZWR1LmNu; Taojin Xu, MTU2NjcwODMzMDhAMTYzLmNvbQ==
Disclaimer: All claims expressed in this article are solely those of the authors and do not necessarily represent those of their affiliated organizations, or those of the publisher, the editors and the reviewers. Any product that may be evaluated in this article or claim that may be made by its manufacturer is not guaranteed or endorsed by the publisher.
Research integrity at Frontiers
Learn more about the work of our research integrity team to safeguard the quality of each article we publish.