 Hegang Du
 Haoran Sun1
 Minghui Cai
 Xiurong Zuo
95% of researchers rate our articles as excellent or good
Learn more about the work of our research integrity team to safeguard the quality of each article we publish.
Find out more
ORIGINAL RESEARCH article
Front. Mater. , 23 August 2023
Sec. Environmental Degradation of Materials
Volume 10 - 2023 | https://doi.org/10.3389/fmats.2023.1218875
The oxidation behavior of the Ni-rich layer in the internal oxide layer (IOL) in 9% Ni cryogenic steel is investigated at 1,150°C for 0–240 min in the air atmosphere. The morphology and phase composition of the Ni—rich layer are analyzed with energy dispersive spectroscopy, scanning electron microscopy, metallographic microscopy, and X—ray diffraction. The results show that the Ni—rich layer mainly consists of gray Fe3O4/FeO and white Ni–Fe particles, with a small amount of black Fe2SiO4. The morphologies of Ni–Fe particles undergo the following changes with isothermal oxidation time: dot—like → strip—like → net-like; at the same time, layered Ni–Fe particles were formed at about 1/3 of the thickness of the Ni—rich layer. Compared with the dot-like Ni–Fe particle, the net-like and layered Ni–Fe particles provide a fast path for the diffusion of O in the Ni—rich layer. However, the experimental steel still has a much lower oxidation rate because of the hindrance of Ni–Fe particles on the out-diffusion of Fe. During the oxidation process, the Kirkendall effect induces pores/cavities in the IOL, which weakens the stability of the IOL. In the end, the spalling phenomenon of the layered Ni–Fe particle occurs at 1,150°C for 180 min.
As an environmentally friendly and convenient energy source, demand for natural gas is quickly increasing, recently. However, considering the storage and transportation conditions of low temperature and high pressure for liquefied natural gas, excellent cryogenic materials are required. A total of 9% Ni steels have high mechanical strength and toughness at cryogenic temperatures, due to 9% Ni addition, which can stabilize the γ-Fe microstructure (Frear and Morris, 1986; Shin et al., 2000). Therefore, 9% Ni steels have been selected for the storage and transportation of liquefied natural gas.
As an inevitable phenomenon of high—temperature oxidation for steels during the heating process, oxide scales formed on the surface of steel result in material waste and surface defects. The thermal growth and deformation of the oxide scales during heat treatments in a slab reheating furnace and rolling processes could significantly reduce the properties of products (Utsunomiya et al., 2009; Niu et al., 2022). In addition, due to Ni addition, a complex high—temperature oxide scale on the surface of steel during hot working is formed, which includes an external oxide layer (EOL) and an additional internal oxide layer (IOL). In addition, oxide scale becomes difficult to be removed due to the existence of the inner oxide layer including the FeO matrix and Ni–Fe particles (Beloshapko and Karmazina, 1985). The Ni—rich IOL containing Ni–Fe particles will delay oxidation by limiting the accessibility of oxygen and iron to each other (Vedaei-Sabegh et al., 2020). The morphology and amount of Ni–Fe particles in the inner oxide layer depend strongly on temperature–time of heat treatment and composition including Ni and Si (Melfo et al., 2013; Harashima et al., 2020). In addition, the Kirkendall voids are usually present in the IOL, and with the increase in oxidation time and oxygen partial pressure, more voids are formed, which are the fast diffusion paths of gas, accelerating the oxidation process and improving the susceptibility of being detached from the steel substrate (Kim et al., 2017; Shen et al., 2020). The morphology and constituents of the EOL have been researched extensively, but the characteristics of the IOL, especially Ni–Fe particles, have not been understood sufficiently. Furthermore, the influence of Ni–Fe particles in the IOL on element diffusion is not clear, even though it is the most important to understand the role of the IOL in inhibiting oxidation. Hence, a better understanding of the IOL with different morphologies of Ni–Fe particles and the underlying mechanisms are needed in 9% Ni steel.
In this paper, 9% Ni cryogenic steel is taken as the research object. The isothermal oxidation experiment is carried out at 1,150° C in the air atmosphere, with a lengthy pre—heating process, which simulated the actual heating in the reheat furnace prior to the hot-rolling process. The high—temperature oxidation behavior of the Ni-rich layer in the IOL is systematically studied, and the growth mechanism of the Ni-rich layer is explained.
The chemical composition of the 9% Ni cryogenic steel employed in this investigation was as follows (wt.%): C: 0.05; Ni: 9.0; Mn: 0.65; Si: 0.21; P: 0.006; S: 0.0004; Fe: Bal, which was analyzed by an optical emission spectrometer (OES; ARL4460, Thermo Scientific, United States). Tested steels were provided by Nanjing Iron & Steel Co., Ltd. The experimental samples were cut from the surface of the continuous casting billet, with the dimension of 15 mm × 15 mm×25 mm for oxidation testing. Prior to oxidation testing, the surfaces were polished, followed by surface observation to avoid the existence of cracks and scratches under the optical microscopy (OM; Axio-lab, ZEISS, Germany).
The oxidation experiment simulated the actual heating in the reheat furnace in the air atmosphere, with the preheating process for 147 min and the isothermal heating process for 0–240 min at 1,150° C, followed by air cooling, according to Figure 1. The entire heat treatment process was conducted in a tubular heating furnace (SG-GL1400, SIOM, China). Two samples were tested under the same conditions to avoid accidental errors. After the oxidation experiment, all samples were cut from the middle of the top surface along the cross-sectional direction and polished to measure the thickness and observe the morphologies of the oxide layer by OM and scanning electron microscopy (SEM; Quanta 250 FEG, FEI, Utah, UT, United States). The oxide layer thickness of each sample was the average values of more than five positions, measured by the Image—Pro Plus software. The X—ray diffraction was carried out by a PANalytical 9 kW X—ray diffractometer (XRD; PANalytical, Almelo, Holland) using a Cu–Kα radiation source with a scanning speed of 1.5 deg/min, ranging from 20° to 120°, and the acquisition time of 67 min. The identification of corresponding peaks was performed by the diffraction database PDF (Powder Diffraction File) of the ICDD (the International Centre for Diffraction Data). We conducted the XRD analysis by removing the top layers to the tested position and then polishing the tested surface. The tested position in the Ni—rich layer was near the EOL, which can eliminate the interference from the matrix of steel. Energy dispersive spectroscopy (EDS; INCA-ENERGY, Oxford, United Kingdom) was employed to identify the element content and distribution of oxidation scale.
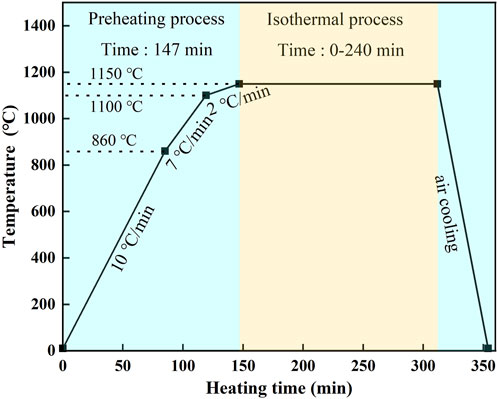
FIGURE 1. Heating and cooling process of 9% Ni steel.
Figure 2 shows the microstructure of the cross-section of the specimen surface oxidized at 1,150° C. The oxide scales on the specimen surfaces all had a duplex structure, including the EOL and IOL. Figure 2A describes the constructure and morphologies of the EOL and IOL. The IOL can be divided into two parts: the Ni-rich layer and the oxide dot layer. The upper interface of the EOL/Ni-rich layer and the lower interface of the Ni-rich layer/oxide dot layer were marked by red and yellow dash–dot lines, respectively. In the Ni-rich layer, there were white Ni–Fe particles with dense distribution (analyzed by EDS later). The typical shapes of dot-like, strip-like, net-like, and layered Ni–Fe particles in specimens oxidized at 1,150°C for 90 min are shown in Figure 2B.
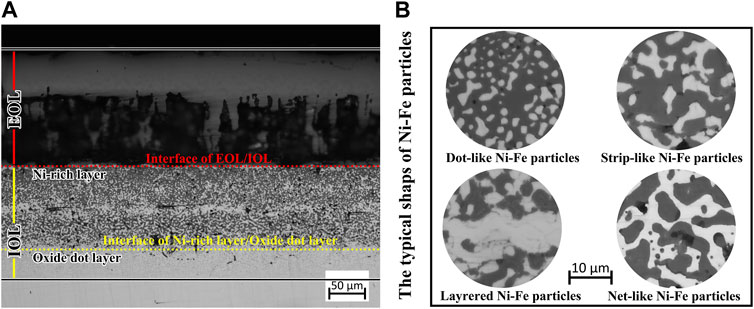
FIGURE 2. OM images of the cross-section of the oxidation layer: (A) low magnification of the oxide layer at 1,150°C for 10 min; (B) local amplification of Ni–Fe particles at 1,150°C for 90 min.
The thickness of the Ni—rich layer and oxide dot layer with varying isothermal oxidation time at 1,150°C is shown in Figure 3. The thickness curve of the EOL was not drawn, due to the spallation of the EOL during cooling, when the isothermal time exceeded 10 min at 1,150°C. In all the tested samples, the thickness of the Ni-rich layer accounted for more than 70%, and the thickness of the oxide dot layer was lower than 30% in the IOL.
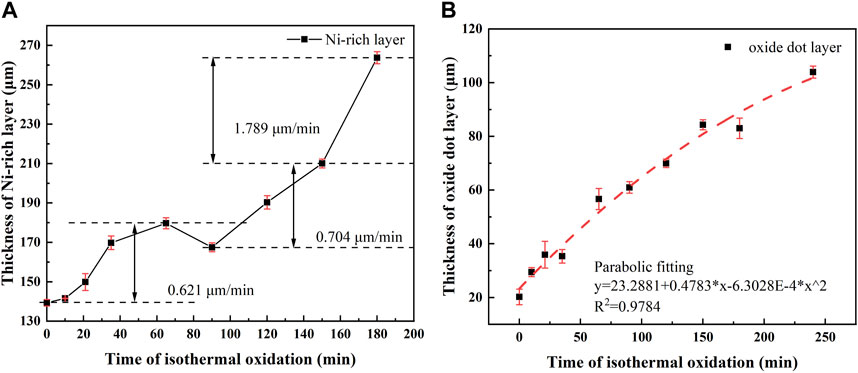
FIGURE 3. Thickness of the Ni-rich layer (A) and oxide dot layer (B) in different isothermal oxidation times of experiment steel.
As shown in Figure 3A, the thickness of the Ni-rich layer kept increasing in the isothermal time range of 0–65 min, followed by an apparent reduction in 90 min. For isothermal time longer than 90 min, the thickness of the Ni-rich layer continued to increase rapidly. Therefore, it was recommended that the isothermal oxidation time at 1,150°C should be less than 90 min to avoid excessive growth of the IOL. The thickness growth rate changed from slow → fast → slow in 0–65 min, while the thickness growth rate remained nearly constant in 90–150 min. In addition, an evident increase in the thickness growth rate appeared after 150 min (1.789 μm/min) for the Ni-rich layer, which was higher than that in 0–65 min (0.621 μm/min) and 90–150 min (0.704 μm/min). There may be a dynamic oxidation mechanism in the Ni-rich layer, in which the change in composition and structure in the Ni-rich layer has an effect on the element transportation rate (Fukagawa and Fujikawa, 1999).
From Figure 3B, the thickness growth of the oxide dot layer followed a well-defined parabolic law with isothermal oxidation time, which meant the rate controlling factor in the oxide dot layer was the element diffusion distance (thickness of oxide dot layer), and the thickness growth rate decreased gradually with the increase in the oxide dot layer thickness (Liu et al., 2020).
The XRD diffraction patterns of the oxidation scale of 9% Ni steel oxidized at 1,150°C for 120 min are shown in Figure 4. From Figure 4, the outer surface of the EOL at location “a” of experimental steel consisted of Fe2O3, Fe3O4, and NiFe2O4 spinel phases. The oxides of the Ni-rich layer in the IOL at location “b” were identified as FeO, Fe3O4, and Fe2SiO4.
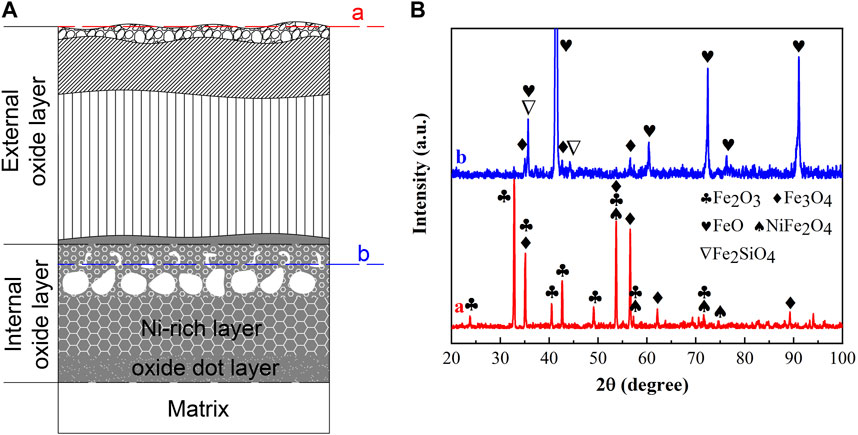
FIGURE 4. XRD diffraction patterns of the oxidation scale of 9% Ni steel oxidized at 1,150°C for 120 min: (A) location of XRD analysis, and (B) XRD patterns of the EOL and Ni-rich layer. a: the EOL; b: the Ni-rich layer.
The oxides of the EOL were consistent with the typical external oxide scale of steel containing Fe2O3 and Fe3O4 (Guo et al., 2002), with additional inclusion of the NiFe2O4 spinel phase, which made the oxide scale of the EOL non-adherent and fragile (Douglass and Rizzo-Assuncao, 1988), resulting in the spallation of the EOL during the cooling process. In the EOL, in the case of sufficient O, Fe was oxidized completely forming Fe2O3 without remaining, and Ni began to oxidize into NiO. The following solid-state reaction formed NiFe2O4, which was expressed in Eq. 1, making it impossible for the stable existence of NiO in the EOL. Thus, NiO existed only as an intermediate product in the EOL during the oxidation process.
FeO, Fe3O4, and olivine Fe2SiO4 existed at location “b” in the Ni-rich layer in the IOL, according to XRD analysis, attributed to the preferential oxidation and the low standard Gibbs free energy of SiO2 and FeO, as shown in Table 1. Despite the high Ni content of experimental steel, there was no NiO found in the IOL, according to Figure 4B. Figure 5 presents the Fe–Ni–O ternary system at 1,200°C. As shown in Figure 5, with the increase in the oxygen partial pressure (PO2) and Ni content in the oxide layer, the oxidation products transformed from alloy to (Fe, Ni)O/spinel/Fe2O3. There were two explanations on the absence of NiO in the IOL. First, when the PO2 and Ni concentrations were relatively low, according to Figure 5, Ni would not be oxidized to NiO in the oxide layer. Second, if the PO2 and Ni concentrations were relatively high, which would be those observed in the present study, according to the standard Gibbs free energy shown in Table 1, Ni would be oxidized to NiO after the formation of Fe2O3, Fe3O4, and FeO. However, there were reduction reactions between NiO and Fe, which were expressed in Eqs. 2 and 3 (Matsuyama et al., 1991):
It indicated that when Fe existed, NiO and Fe2O3 would not be produced in the IOL, only FeO, Fe3O4, and olivine Fe2SiO4 existed at location “b” in the IOL.
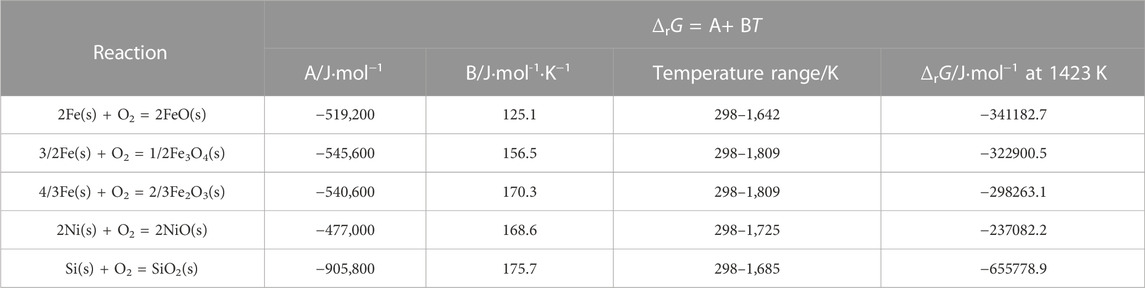
TABLE 1. Standard Gibbs free energy of different oxides (RAO, 1985).
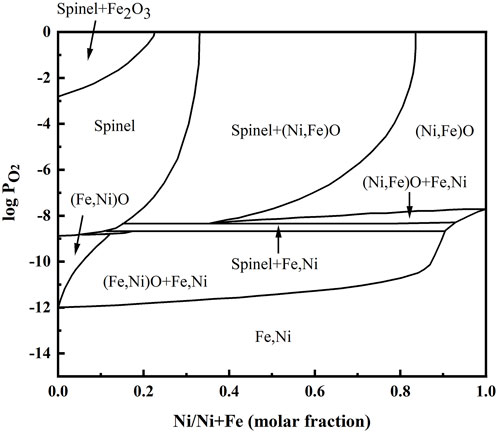
FIGURE 5. Fe–Ni–O ternary system at 1,200°C (Rhamdhani et al., 2008).
Figure 6 shows the distribution of Ni, Fe, O, and Si in the Ni-rich layer by the EDS elemental map. Elemental mappings showed the same segregated site of Fe/Ni and inconsistent segregated site of Ni/O in the IOL, which proved the ability of antioxidation of white Ni–Fe particles. In the isothermal oxidation stage, oxidation reactions mainly occur in Fe and O because of the inertness of Ni with the high standard Gibbs free energy. Naturally, Fe and Ni in the matrix diffused outward to the interface of the EOL/IOL, and O diffused inward to the steel matrix. Considering the low-diffusion rate of O in FeO, lack of O occurred and lots of Fe accumulated in the Ni-rich layer. As discussed in Section 3.2, Ni would remain only in the metallic state. Therefore, the consistent distribution site of Fe/Ni appeared and then formed Ni–Fe particles.
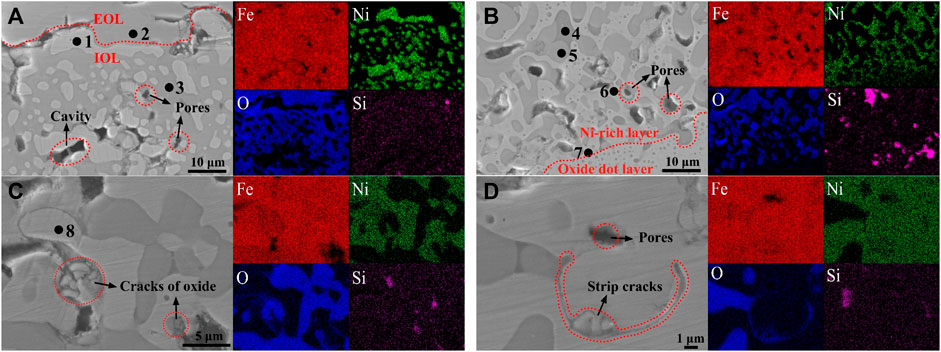
FIGURE 6. SEM and EDS elemental maps obtained on samples oxidized at 1,150°C in the air atmosphere in three zones of the Ni-rich layer: (A) zone near the EOL/IOL interface at 65 min, (B) zone near the IOL/oxide dot layer at 65 min, (C) and (D) the Ni-rich layer formed by aggregation of the Ni–Fe particles at 240 min.
Combining with the EDS analysis of region 1 (Fe: 66.33%; Ni: 33.67%), region 6 (Fe: 76.33%; Ni: 23.67%), and region 7 (Fe: 86.38%; Ni: 11.96%) in Ni–Fe particles in Table 2, it was found that the Ni concentration increased from the lower interface to the upper interface of the Ni-rich layer. As the oxidation reaction proceeded, the Ni-rich layer grew inward to the matrix, resulting in the accumulation of Ni occurred (Shen et al., 2020). In the Ni-rich layer, by comparing region 3 (Fe:45.27%, O: 54.20%) near the EOL with region 5 (Fe: 50.37%, O: 48.78%) near the steel matrix in Table 2, it was found that iron oxide changed from the mixture of FeO/Fe3O4 to FeO. Combined with the results of XRD, it was proved that, from the upper interface near the EOL to the lower interface near the oxide dot layer in the Ni-rich layer, the oxidation degree of Fe decreased, verifying the surplus of Fe and lack of O in the Ni-rich layer, especially in the lower half of the Ni-rich layer.
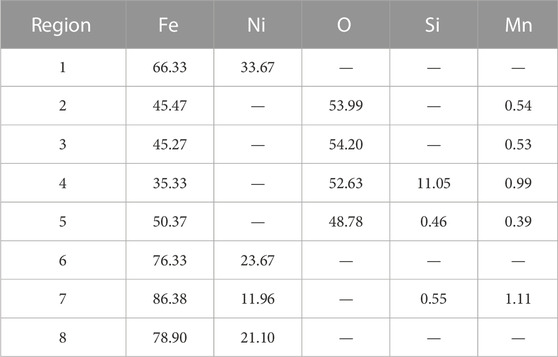
TABLE 2. Chemical compositions of different regions in the Ni-rich layer (at.%).
By SEM observation and EDS analysis in Figure 6 and Table 2, combined with XRD analysis in Figure 4, which was verified by each other, there were the following three types of phases in the Ni-rich layer. (I) The white Ni–Fe particles in region 1 near the EOL had the Ni content of 33.67%, while in region 7 near the oxide dot layer, Ni content decreased to 11.96%; (II) the gray iron oxide phase in region 3 near the EOL contained FeO/Fe3O4, and region 5 near the oxide dot layer was FeO; (III) the black Fe2SiO4 olivine phase (region 4) had been observed by SEM. In general, EDS elemental mapping confirmed that the Ni-rich layer consisted of Ni–Fe particles in an iron oxide matrix. It was noticed that there were the blank regions without elements in Figure 6, which were the pores and cavities around the bulk Ni–Fe particles.
The cross-sections of the Ni-rich layer in 9% Ni steel oxidized at 1,100°C and 1,150°C in the air atmosphere are presented in Figure 7. The 1,100°C sample was presented as a comparison with the subsequent oxidation at 1,150°C. As shown in Figure 7A, at 1,100°C, discrete dot-like Ni–Fe particles are uniformly distributed in the gray iron oxide matrix without aggregation tendency (Liu et al., 2014). However, Ni–Fe particles in the Ni-rich layer showed an evident aggregation tendency at 1,150°C, according to Figures 7B–I.
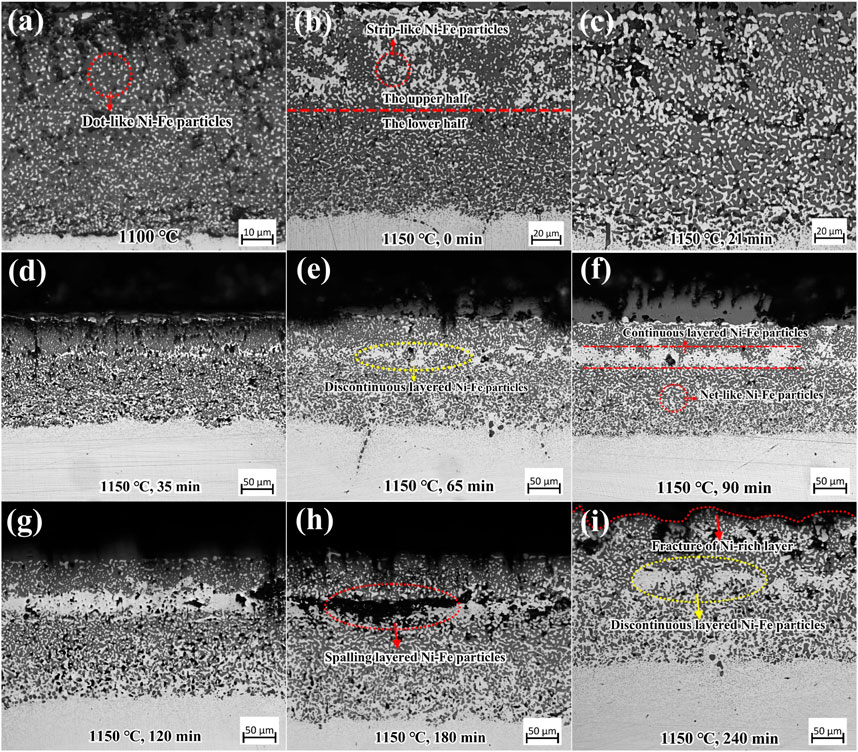
FIGURE 7. OM images of cross-section of the Ni-rich layer in the oxide scale of 9% Ni steel after (A) oxidation at 1,100°C and after isothermal oxidation at 1,150°C for (B) 0 min, (C) 21 min, (D) 35 min, (E) 65 min, (F) 90 min, (G) 120 min, (H) 180 min, and (I) 240 min.
Observing at 1,150°C for 0–240 min (Figures 7B–I), Ni–Fe particles increased evidently and tended to aggregate with isothermal oxidation time, which varied from dot-like, strip-like to net-like shape in the upper and in the lower halves of the Ni-rich layer. For isothermal time longer than 35 min, layered Ni–Fe particles were formed, which were thin and discontinuous, and after 90 min, they became continuous layered Ni–Fe particles with irregular thickness (Figure 7F). These kinds of layered Ni–Fe were located at approximately 1/3 of the thickness of the Ni-rich layer, close to the EOL/IOL interface. Between 90 and 120 min, the layered Ni–Fe particles continued to thicken (Figures 7F, G), and, at the same time, numerous voids formed, which would make gaseous oxygen rapidly diffuse into the IOL, accelerating the oxidation and making the Ni-rich layer thickness continue to increase, as shown in Figure 3A. By prolonging the isothermal time, the number and size of voids and cavities increased furtherly, aligning parallel to the surface (Figure 7H). This induced the fragmentation and spallation of layered Ni–Fe particles, resulting in the decrease of thickness of the Ni-rich layer for isothermal time of 240 min, compared with that of 180 min. New layered Ni–Fe particles began to form below the previously cracked particles, as shown in the yellow circle in Figure 7I. It was also noted that when the layered Ni–Fe particles began to form, the amount of Ni–Fe particles in the lower half became much more than that in the upper half. Thus, from the cross-sectional morphologies of the Ni-rich layer, it can be concluded that the growth process of Ni–Fe particles in the Ni-rich layer was as follows: 1) in the upper and lower halves: dot-like → strip-like → net-like; 2) layer-like Ni–Fe particles occurred at approximately 1/3 from the top of the Ni-rich layer when isothermal time was higher than 35 min.
In order to clarify the oxidation mechanism of the Ni-rich layer, the area fraction of Ni–Fe particles for varying isothermal time was counted by software Image-Pro Plus, which referred to the percentage of the Ni–Fe particle area in the Ni-rich layer area. Figure 8A shows that the area fraction of Ni–Fe particles increases gradually with the increase in isothermal time in the range of 0–150 min at 1,150°C, which meant that the Ni enrichment in the Ni-rich layer became more serious with the oxidation process. However, the area fraction of Ni–Fe particles in the upper half of the Ni-rich layer varied gradually from higher to lower than that in the lower half. Figure 8B gives the area fraction of Ni–Fe particles with different morphologies, and Figure 8C shows the specific details of Ni–Fe particles. Dot-like, strip-like, and net-like Ni–Fe particles were divided by the area (0–5, 5–350, and more than 350 μm2, respectively) and covered with red, blue, and yellow colors, respectively. It was evident that Ni–Fe particles exhibited a growth pattern and transformed from dot-like to strip-like to net-like shapes with isothermal time.
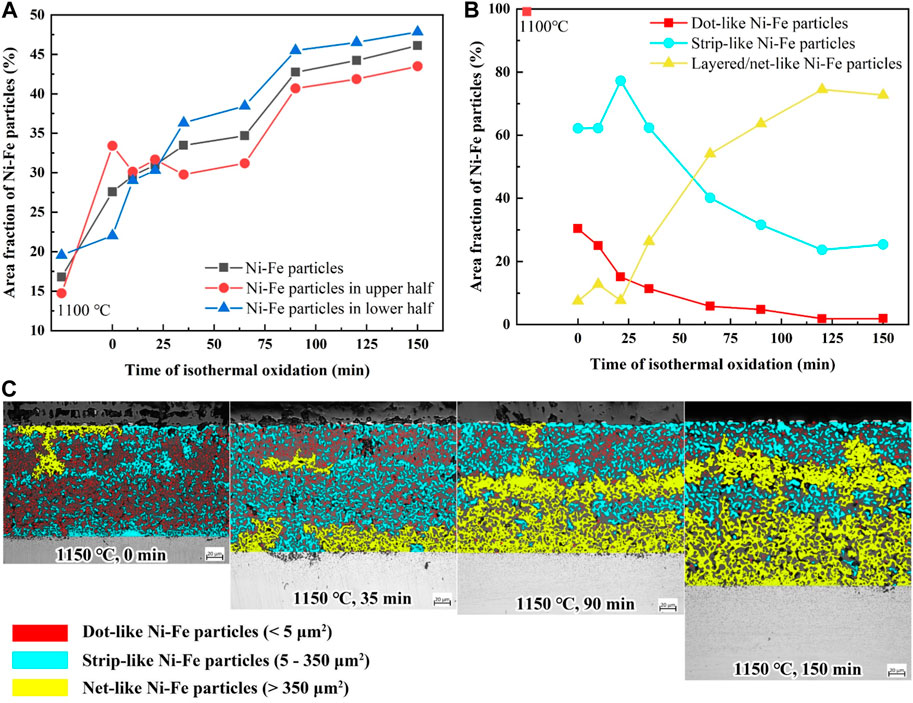
FIGURE 8. (A) Area fraction of Ni–Fe particles in the Ni-rich layer; (B) area fraction of Ni–Fe particles with different shapes; (C) typical cross-sectional morphologies (0/35/90/150 min).
The thickness of the Ni-rich layer exhibited an apparent reduction when isothermal time is in the range of 65–90 min (Figure 3A), due to the sharp increase in the area fraction of Ni–Fe particles from 65 to 90 min. This can be explained by the reasons as follows: volume expansion was inevitable during the oxidation process. Fe3O4 and FeO were mainly oxides in the Ni-rich layer, as stated in Section 3.2, which had large oxidation volume expansion with 110% expansion from Fe to Fe3O4 and 74% expansion from Fe to FeO, leading to the significant compressive stress during the oxidation process (Wilke and Dunand, 2020). However, the area fraction of Ni–Fe particles increased sharply from 65 to 90 min (Figure 8A), taking the place of the iron oxide matrix and decreasing the amount of iron oxide. In general, the decrease in the transformation amount of Fe to iron oxide contributed to a reduction in oxidation volume expansion, causing a thickness decrease in the Ni-rich layer at 90 min, as shown in Figure 3A.
In order to make the variation in the oxidation rate more intuitionistic, the oxidation rate was replaced by the mean diffusion coefficient reported by Abe et al. (1987), which can be described in Eq. 4:
where Dm is the mean diffusion coefficient of reaction elements (Fe and O), cm2/s; t is the diffusion time, s; △X is the difference in the diffusion distance in different heating times, cm. Here, △X is considered the thickness difference of Ni-rich layers between the latter sample and the first sample (1,150°C for 0 min), cm, except the △X of the sample at 1,150°C for 0 min which is based on the Ni-rich layer thickness at 1,100°C for 0 min.
Figure 9 gives the Dm values of elements in the Ni-rich layer. Due to the fracture and spallation of layered Ni–Fe particles (as shown in Figures 7H, I), Dm was not calculated after 150 min. According to Figure 9, Dm decreased sharply from 300.07 × 10⁻¹⁰ cm2/s at 1,150°C for 0 min to 0.81 × 10⁻¹⁰ cm2/s at 1,150°C for 10 min and then increased from 0.81 × 10⁻¹⁰ to 44.17 × 10⁻¹⁰ cm2/s in 10–35 min; finally, Dm remained in a certain range from 44.17 × 10⁻¹⁰ to 55.56 × 10⁻¹⁰ cm2/s in 35–150 min, except for the value of 14.69 × 10⁻¹⁰ cm2/s in 90 min.
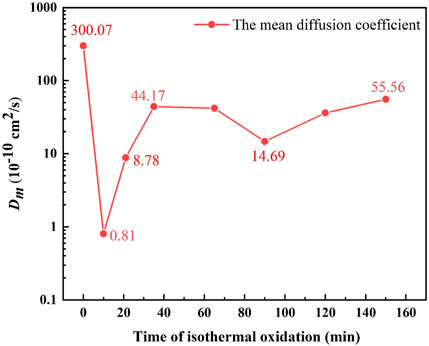
FIGURE 9. Simulation of the variation in the mean diffusion coefficient (Dm) with isothermal oxidation time.
Hayden et al. (1972) pointed out that, at temperatures higher than 65% of the absolute melting point, the volume diffusion should be the dominant diffusion path. Therefore, the dominant diffusion path is volume diffusion at 1,100°C and 1,150°C. Figure 10 gives the volume diffusion coefficient of Fe and O in different materials. For the steel without Ni, the Ni-rich layer could be simplified to a single structure of the FeO layer, and the diffusion coefficient of Fe and O in the FeO layer was 2.86 × 10⁻⁷ cm2/s and 5.79 × 10⁻¹¹ cm2/s, respectively, according to Figure 10. Evidently, the diffusion coefficient of Fe was large enough to dominate the oxidation rate. However, the value of Dm (0.81 × 10⁻¹⁰–55.56 × 10⁻¹⁰ cm2/s) was apparently lower than the diffusion coefficient of Fe in the FeO layer (2.86 × 10⁻⁷ cm2/s). This can be explained by taking into account the diffusivity of Fe and O in Ni–Fe particles.
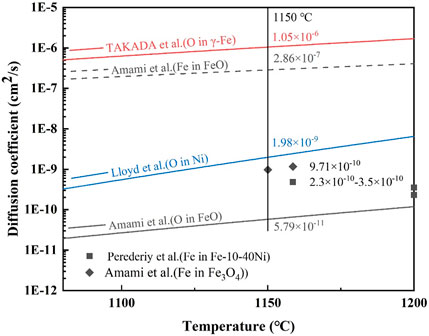
FIGURE 10. Diffusion coefficient of Fe and O in different materials (Lloyd and Martin, 1972; Takada et al., 1986; Amami et al., 2001; Perederiy et al., 2016).
As shown in Figure 10, the diffusion coefficient of Fe in Ni–Fe particles (2.3–3.5 × 10⁻¹⁰ cm2/s, similar to Fe-(10–40) Ni alloy at 1,200°C) decreased largely, compared with that of the Fe in FeO (2.86 × 10⁻⁷ cm2/s), which resulted in the decrease of Dm in the Ni-rich layer. Due to the decrease in the diffusion coefficient of Fe, Ni-contained steel has a better oxidation resistance than steel without Ni. From Figure 10, the diffusion coefficient of O in Ni was 1.98 × 10⁻⁹ cm2/s, which was at least 34 times larger than the diffusion coefficient of O in FeO (5.79 × 10⁻¹¹ cm2/s) at 1,150°C. It can be inferred that the diffusion coefficient of O in Ni–Fe particles might be close to but bigger than the diffusion coefficient of O in Ni (about in the order of magnitude of 10−9 cm2/s). Ni–Fe particles provided a faster diffusion path for O than FeO, which increased the oxidation rate. Subsequently, the diffusion coefficient of O in the Ni-rich layer gradually increased from the order of magnitude of 10−11 cm2/s in FeO to 10−9 cm2/s in Ni–Fe particles, which was consistent with the Dm from 8.06 × 10⁻¹¹ to 5.56 × 10⁻⁹ cm2/s (Figure 9).
From the aforementioned analysis, it was inferred that Dm of Ni-contained steel might vary with amount and morphology of Ni–Fe particles. According to Figure 9, the sharp decrease in Dm from 300.07 × 10⁻¹⁰ cm2/s at 1,150°C for 0 min to 0.81 × 10⁻¹⁰ cm2/s at 1,150°C for 10 min was caused by the rapid accumulation of Ni–Fe particles, where the diffusion coefficient of Fe was low. With the increase in area fraction of Ni–Fe particles, diffusion path of O kept enlarging. As for the quick increase in Dm from 10 min to 35 min during the isothermal stage, it could be attributed to the growth of Ni–Fe particles from dot-like to strip-like or net-like. When isothermal time was higher than 35 min, more than 90% area fraction of strip-like and net-like Ni–Fe particles was achieved, which would connect with each other to form a complete path for O diffusion in the Ni-rich layer, accelerating the oxidation.
Therefore, with the further increase in the area fraction of strip/net-like Ni–Fe particles during isothermal time for 35–150 min, Dm had only a slight fluctuation (Figure 8). In a word, the net-like and layered Ni–Fe particles provided a fast diffusion path for O in the Ni–rich layer, compared with the dot-like Ni–Fe particles.
As shown in Figures 6 and 7, pores/cavities always existed during the isothermal oxidation process. Kirkendall pores form when one metal diffuses more rapidly into another metal, and vice versa (Springer et al., 2011). The pores/cavities are formed due to the Kirkendall effect, leaving a fragile and porous Ni-rich layer. Therefore, the generation of pores/cavities in the IOL reduced the mechanical properties of the Ni-rich layer.
Beygelzimer and Beygelzimer (2022) reported the coefficient of linear thermal expansion (CTE) of FeO and Fe3O4, and Hausch (2007) reported the CTE of Fe–Ni alloys at different temperatures. Figure 11 gives the CTE of different materials with temperature. The difference in CTE between Ni–Fe particles (similar to Fe-(14–22) Ni-X alloy) and iron oxides increased quickly with the decrease in temperature and reached the maximum differences (approximately 13 × 10−6°C−1) at approximately 200°C (Figure 11). The residual internal stress was caused by the difference between CTE of iron oxides and Ni–Fe particles during the cooling process, resulting in the formation of cracks at the boundary of the Ni–Fe particles and iron oxides, as displayed in Figures 6C, D.
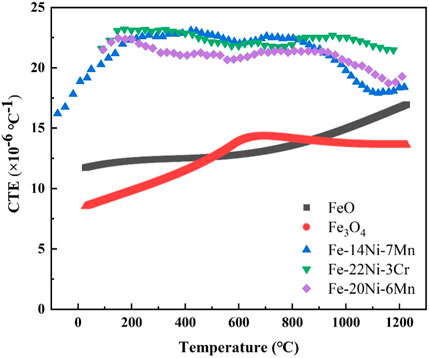
FIGURE 11. Thermal expansion coefficient (CTE) of different materials with temperature (Hausch, 2007; Beygelzimer and Beygelzimer, 2022).
When isothermal oxidation time is in the range of 0–65 min, numerous pores/cavities occurred around dot-like/strip-like/net-like Ni–Fe particles and discontinuous layered Ni–Fe particles (Figures 7A–E). However, the IOL still kept stability, attributed to the high proportion of iron oxide with a small shrinkage amount (Figures 8, 11). When isothermal time was higher than 90 min, continuous layered Ni–Fe particles had been formed (Figures 7F, G). In addition, the Ni–Fe particles with a high shrinkage amount increased evidently, accompanied by the significant increase in pores/cavities around the layered Ni–Fe particles, resulting in the weakening of the connectivity. Once the internal stress exceeded the interfacial binding force, the spalling behavior of layered Ni–Fe particles occurred, as presented in Figures 7H, I, making the thickness of the oxide layer at 1,150°C for 240 min less than that for 180 min.
In this paper, the oxidation behavior of the 9% Ni cryogenic steel is investigated by employing isothermal oxidation tests at 1,150°C for different exposure times in the air atmosphere. Based on the analysis and discussion previously, the main conclusions could be summarized as follows:
1. The Ni-rich layer of 9% Ni steel mainly consists of gray Fe3O4/FeO and white Ni–Fe particles, with a minor amount of black Fe2SiO4. The thickness of the Ni-rich layer keeps increasing, but an apparent reduction appears when heating time is in the range of 65–90 min at 1,150°C, due to the sharp increase in the area fraction of Ni–Fe particles from 65 to 90 min. Therefore, it is recommended that the isothermal oxidation time at 1,150°C should be less than 90 min to avoid excessive growth of the IOL.
2. The shape of Ni–Fe particles in the Ni-rich layer undergoes the following changes with isothermal oxidation time: dot-like → strip-like →net-like; at the same time, layered Ni–Fe particles are formed at about 1/3 from the top of the Ni-rich layer when isothermal oxidation time was longer than 35 min at 1,150°C. The net-like and layered Ni–Fe particles provide a fast path for the diffusion of O in the Ni-rich layer, compared with the dot-like Ni–Fe particles. However, the diffusion coefficient of Fe in Ni–Fe particles (2.3–3.5 × 10⁻¹⁰ cm2/s) decreases largely, compared with the Fe in FeO (2.86 × 10⁻⁷ cm2/s), which makes the Ni-contained steel have better oxidation resistance.
3. During the oxidation process, the Kirkendall effect induces pores/cavities in the IOL, which weakens the stability of the IOL. In the cooling process, due to the discrepancy of CTE between Ni–Fe particles and iron oxides, the cracks initiate from pores/cavities along the interface of Ni–Fe particle/iron oxide. In the end, the spalling phenomenon of layered Ni–Fe particles occurs at 1,150°C for 180 min.
The original contributions presented in the study are included in the article/Supplementary Material; further inquiries can be directed to the corresponding authors.
HD: conceptualization, methodology, software and experimental validation, formal analysis and investigation, data curation, writing—original draft preparation, and writing—review and editing. HS: methodology, data curation, and software and experimental validation. MC: conceptualization, formal analysis and investigation, resources, writing—review and editing, supervision, project administration, and funding acquisition. XZ: conceptualization, formal analysis and investigation, resources, writing—review and editing, supervision, project administration, and funding acquisition. All authors contributed to the article and approved the submitted version.
The authors declare that this study received funding from Nanjing Iron & Steel Co., Ltd. The funder was not involved in the study design, collection, analysis, interpretation of data, the writing of this article, or the decision to submit it for publication.
The authors gratefully acknowledge the financial support provided by Henan Provincial Science and Technology Cooperation Project China (no. 182106000016) and the Key R&D and Promotion Special Project of Henan Province (no. 212102210444) and Nanjing Iron & Steel Co., Ltd.
The authors declare that the research was conducted in the absence of any commercial or financial relationships that could be construed as a potential conflict of interest.
All claims expressed in this article are solely those of the authors and do not necessarily represent those of their affiliated organizations, or those of the publisher, the editors, and the reviewers. Any product that may be evaluated in this article, or claim that may be made by its manufacturer, is not guaranteed or endorsed by the publisher.
Abe, F., Araki, H., Yoshida, H., and Okada, M. (1987). The role of aluminum and titanium on the oxidation process of a nickel-base superalloy in steam at 800 °C. Oxid. Metals 27, 21–36. doi:10.1007/Bf00656727
Amami, B., Addou, M., and Monty, C. (2001). Selfdiffusion and point defects in iron oxides: feO, Fe3O4, α-Fe2O3. Defect Diffusion Forum 194, 1051–1056. doi:10.4028/www.scientific.net/DDF.194-199.1051
Beloshapko, M. V., and Karmazina, T. G. (1985). Oxidation of Ni-containing steels during heat-treatment processes. Metal Sci. Heat Treat. 27, 313–316. doi:10.1007/Bf00652104
Beygelzimer, E. B., and Beygelzimer, Y. (2022). Validation of the cooling model for TMCP processing of steel sheets with oxide scale using industrial experiment data. J. Manuf. Mater. Process. 6, 78. doi:10.3390/jmmp6040078
Douglass, D. L., and Rizzo-Assuncao, F. (1988). The oxidation of Fe-19.6Cr-15.1Mn stainless steel. Oxid. Metals 29, 271–287. doi:10.1007/BF00751800
Frear, D., and Morris, J. W. (1986). A study of the effect of precipitated austenite on the fracture of a ferritic cryogenic steel. Metall. Trans. A 17, 243–252. doi:10.1007/Bf02643900
Fukagawa, T., and Fujikawa, H. (1999). Effect of small amounts of Ni on liquid-Cu embrittlement in hot-rolled mild steel after high-temperature oxidation. Oxid. Metals 52, 177–194. doi:10.1023/a:1018883326123
Guo, X., Kusabiraki, K., and Saji, S. (2002). High-temperature scale formation of Fe–36% Ni bicrystals in air. Oxid. Metals 58, 589–605. doi:10.1023/a:1020581208035
Harashima, A., Kondo, Y., and Hayashi, S. (2020). Time change in scale microstructure of Fe-5 mass%Ni alloy at 1200 °C. ISIJ Int. 60, 352–358. doi:10.2355/isijinternational.ISIJINT-2019-252
Hausch, G. (2007). Thermal expansion of anti-invar alloys up to high temperatures. J. Magnetism Magnetic Mater. 310, 1859–1860. doi:10.1016/j.jmmm.2006.10.651
Hayden, H. W., Floreen, S., and Goodell, P. D. (1972). The deformation mechanisms of superplasticity. Metallurgical Mater. Trans. B 3, 833–842. doi:10.1007/BF02647657
Kim, S.-H., Huh, J.-Y., Kim, M.-S., and Kim, J.-S. (2017). Effects of oxygen partial pressure on oxidation behavior of CMnSi TRIP steel in an oxidation-reduction scheme. Corros. Sci. Technol. 16, 15–22. doi:10.14773/cst.2017.16.1.15
Liu, Y., Wang, Y., Li, G. Q., Cai, H., Wang, H. H., and Wan, X. L. (2020). Oxidation behavior and subsurface phase transformation of novel high Mn cryogenic steel during heat treatment. Steel Res. Int. 91, 1900555–1900556. doi:10.1002/srin.201900555
Liu, Y. Z., Yang, C. F., Chai, F., Pan, T., and Su, H. (2014). High temperature oxidation resistance of 9Ni steel. J. Iron Steel Res. Int. 21, 956–963. doi:10.1016/S1006-706x(14)60168-0
Lloyd, G. J., and Martin, J. W. (1972). The diffusivity of oxygen in nickel determined by internal oxidation of dilute Ni-Be alloys. Metal Sci. J. 6, 7–11. doi:10.1179/030634572790446208
Matsuyama, M., Ashida, K., and Takeuchi, T. (1991). Application of 63Ni to the reduction mechanism of Fe-Ni oxides. Int. J. Radiat. Appl. Instrum. Part 42, 1153–1158. doi:10.1016/0883-2889(91)90189-8
Melfo, W., Bolt, H., Rijnders, M., Staalman, D., Castro, C. B., Crowther, D., et al. (2013). Experimental study on primary scale formation and descalability on steels containing Ni and Ni+Si. ISIJ Int. 53, 866–873. doi:10.2355/isijinternational.53.866
Niu, F. Y., He, J. S., Liu, D. H., Zuo, X. R., and Cai, M. H. (2022). Effect of bending process on microstructure, mechanical properties and crack formation of 5% Ni steel. Metals 12, 1188. doi:10.3390/met12071188
Perederiy, V. G., Gasanov, B. G., and Sirotin, P. V. (2016). Determination features of the component diffusion coefficients of the Fe-Cr-Ni-Gr powder systems sintering. Mater. Sci. Forum 870, 286–292. doi:10.4028/www.scientific.net/MSF.870.286
Rao, Y. K. (1985). Stoichiometry and thermodynamics of metallurgical processes. Cambridge: Cambridge University Press.
Rhamdhani, M. A., Hayes, P. C., and Jak, E. (2008). Subsolidus phase equilibria of the Fe-Ni-O system. Metallurgical Mater. Trans. B 39, 690–701. doi:10.1007/s11663-008-9174-2
Shen, Z., Tweddle, D., Yu, H., He, G., Varambhia, A., Karamched, P., et al. (2020). Microstructural understanding of the oxidation of an austenitic stainless steel in high-temperature steam through advanced characterization. Acta Mater. 194, 321–336. doi:10.1016/j.actamat.2020.05.010
Shin, H.-S., Lee, H.-M., and Kim, M.-S. (2000). Impact tensile behaviors of 9% nickel steel at low temperature. Int. J. Impact Eng. 24, 571–581. doi:10.1016/S0734-743X(99)00181-5
Springer, H., Kostka, A., Dos Santos, J. F., and Raabe, D. (2011). Influence of intermetallic phases and Kirkendall-porosity on the mechanical properties of joints between steel and aluminium alloys. Mater. Sci. Eng. A 528, 4630–4642. doi:10.1016/j.msea.2011.02.057
Takada, J., Yamamoto, S., Kikuchi, S., and Adachi, M. (1986). Determination of diffusion coefficient of oxygen in γ-iron from measurements of internal oxidation in Fe-Al alloys. Metallurgical Mater. Trans. A 17A, 221–229. doi:10.1007/BF02643898
Utsunomiya, H., Doi, S., Hara, K., Sakai, T., and Yanagi, S. (2009). Deformation of oxide scale on steel surface during hot rolling. Cirp Annals-Manufacturing Technol. 58, 271–274. doi:10.1016/j.cirp.2009.03.050
Vedaei-Sabegh, A., Morin, J.-B., and Jahazi, M. (2020). Influence of nickel on high-temperature oxidation and characteristics of oxide layers in two high-strength steels. Steel Res. Int. 91, 1900536–1900613. doi:10.1002/srin.201900536
Keywords: 9% Ni steel, high temperature oxidation, internal oxide layer, Ni—rich layer, Ni–Fe particle, elemental diffusion
Citation: Du H, Sun H, Cai M and Zuo X (2023) Study on the growth mechanism of the internal oxide layer in 9% Ni cryogenic steel. Front. Mater. 10:1218875. doi: 10.3389/fmats.2023.1218875
Received: 08 May 2023; Accepted: 08 August 2023;
Published: 23 August 2023.
Edited by:
Ahmed Abdel Nazeer, National Research Centre, EgyptReviewed by:
Idalina Vieira Aoki, University of São Paulo, BrazilCopyright © 2023 Du, Sun, Cai and Zuo. This is an open-access article distributed under the terms of the Creative Commons Attribution License (CC BY). The use, distribution or reproduction in other forums is permitted, provided the original author(s) and the copyright owner(s) are credited and that the original publication in this journal is cited, in accordance with accepted academic practice. No use, distribution or reproduction is permitted which does not comply with these terms.
*Correspondence: Minghui Cai, Y2FpbWhAc21tLm5ldS5lZHUuY24=; Xiurong Zuo, enVveGl1cm9uZ0B6enUuZWR1LmNu
Disclaimer: All claims expressed in this article are solely those of the authors and do not necessarily represent those of their affiliated organizations, or those of the publisher, the editors and the reviewers. Any product that may be evaluated in this article or claim that may be made by its manufacturer is not guaranteed or endorsed by the publisher.
Research integrity at Frontiers
Learn more about the work of our research integrity team to safeguard the quality of each article we publish.