 Jinghong Xue
 Andun Cheng2
95% of researchers rate our articles as excellent or good
Learn more about the work of our research integrity team to safeguard the quality of each article we publish.
Find out more
ORIGINAL RESEARCH article
Front. Mater. , 03 August 2023
Sec. Structural Materials
Volume 10 - 2023 | https://doi.org/10.3389/fmats.2023.1215843
This article is part of the Research Topic Damage and Mechanical Behavior of Hydrogen Equipment and Fuel Cell Materials View all 5 articles
Hydrogen enrichment induced by pipeline welding residual stress is a key issue affecting the safe service of hydrogen pipelines. In order to explore the influence of welding residual stress on hydrogen diffusion and the effect of heat treatment, an X80 pipeline model with a six-layer girth weld was established using ABAQUS software, and coupling analysis of temperature field, stress field, and hydrogen diffusion was carried out. The distribution of residual stress in the welding area and local inclusion area was analyzed, the relationship between the hydrostatic stress and hydrogen diffusion of the pipeline, and the influence of the direction and shape of the inclusion on hydrogen diffusion were explored, and the effect of post-weld heat treatment on the residual stress and hydrogen diffusion in the welding area and local inclusion area was studied. The hydrostatic stress curve is similar to the hydrogen concentration distribution curve, and hydrostatic stress can be considered the main driving force for hydrogen diffusion in the pipeline. As the angle between the inclusions and the hydrogen diffusion direction increases, the hydrogen diffusion flux will gradually decrease. The more slender the inclusions, the stronger the diffusion ability of parallel or 45° inclusions, and the weaker the diffusion ability of perpendicular inclusions. Hydrogen enrichment occurs in inclusions or inclusion boundaries before and after post-weld heat treatment of the pipeline, and the internal hydrogen concentration of hard inclusions is higher than that of soft inclusions. Post-weld heat treatment can significantly reduce welding residual stress and hydrostatic stress, thereby reducing hydrogen enrichment concentration.
Hydrogen energy is considered the cleanest potential energy, and the development of hydrogen energy has become urgent for energy transformation in the world (Li, 2003; Bi., 2007). When hydrogen is transported by a long-distance pipeline, H2 is decomposed into hydrogen atoms through the processes of adsorption, dissociation, and other processes to penetrate into the materials of pipelines. When the hydrogen concentration in the metal material is too high, it will cause hydrogen embrittlement, resulting in plastic damage or even cracking of the pipeline material. The residual stress caused by pipeline welding causes hydrogen concentration enrichment in metal material, as well as stress corrosion of the pipeline. Therefore, it is of great importance that residual stress and stress-induced hydrogen enrichment law generated by pipeline welding for the safety of hydrogen pipelines are studied.
Gery et al. (2005) established two-dimensional and three-dimensional models of flat butt welds to predict the transient temperature distribution during welding and found that the temperature predicted by the two-dimensional model was higher. Yaghi et al. (2005) established a two-dimensional butt weld model of P91 steel pipe and analyzed eight pipe models with different diameter-thickness ratios. It was found that for thick-walled pipes, circumferential and axial welding residual stresses were usually independent of the size of the outer diameter. Thiessen et al. (2006) introduced the phase field method into the welding simulation, simulated the welding temperature field and stress field, and gave the microstructure distribution of the material. Deng and Murakawa. (2005) established a three-dimensional welding finite element model of SUS304 pipe. When the heat source moved along the circumferential direction of the pipe, the temperature field was very stable, and the welding residual stress was considered to be uniformly distributed along the circumferential direction of the pipe. Arif et al. (2012) used finite element software to establish a three-dimensional pipeline spiral weld and found that the temperature gradient on the spiral path was very high. In the cooling cycle after solidification in the melting zone, the von Mises stress reached a higher value. In addition, it was concluded that increasing the welding speed at constant power would lead to a decrease in the range of the high stress zone. Yan et al. (2014) established a three-dimensional model of hydrogen distribution in X80 pipeline steel welded joints. It was found that increasing preheating temperature and welding heat input reduced the hydrogen concentration in the welded joint. Han et al. (2012) studied the hydrogen permeation law of X80 under different welding heat inputs. The results showed that the hydrogen diffusion rate of the fine grain heat-affected zone and the base metal zone was equivalent, and the hydrogen diffusion rate of the weld zone was lower than that of the coarse grain heat-affected zone. With the increase in welding heat input, the hydrogen diffusion rate of each region would decrease accordingly. Moro et al. (2010) studied the hydrogen embrittlement sensitivity of X80 steel. The results showed that the initiation of microcracks on the outer surface of the sample and the subsequent fracture were responsible for the premature failure of the material under high hydrogen pressure. The decrease in the strain rate of the sample under high hydrogen pressure would lead to the probability of hydrogen embrittlement. Jin et al. (2010) characterized the composition, type, and distribution of inclusions in X100 steel by electron microscopy. The results showed that hydrogen-induced cracking was mainly related to Al and Si inclusions, rather than MnS inclusions. The critical hydrogen content of hydrogen-induced cracking was 3.24 ppm. Gong et al. (2007a) and Gong et al. (2007b) measured the hydrogen diffusion coefficient of the weld zone, heat-affected zone, and base metal zone near the welding of 16MnR steel by experiments. A two-dimensional symmetric welding model was established using the finite element ABAQUS software, and the law of hydrogen concentration changing with time at the point near the weld was obtained. Due to the existence of residual stress in the weld, hydrogen atoms were enriched and caused material cracking.
In order to clarify the relationship between residual stress and hydrogen enrichment and the influence of post-weld heat treatment on welding hydrogen enrichment, a model of a pipeline with six-layer girth welds was established and verified using the finite element software ABAQUS. The three-field coupling analysis of the temperature field, stress field, and hydrogen diffusion was carried out through the sequential coupling method to obtain the distribution law of the temperature field, the welding residual stress field, and the hydrogen concentration of the pipeline. The relationship between residual stress and hydrogen enrichment was studied, and the effect of post-weld heat treatment on welding hydrogen enrichment was found.
This paper studies an X80 pipeline with a six-layer girth weld, and the welding residual stress and hydrogen diffusion are analyzed. The length of the three-dimensional model pipe is 1,000 mm, the central angle is 90°, the outer diameter of the pipe is 1,219 mm, and the wall thickness is 18.4 mm. The left-end face of the model is the center surface of the weld. The meshes are fine at the weld and the heat-affected zone, and the other areas are coarse. The finite element model and the main area meshes division are shown in Figure 1.
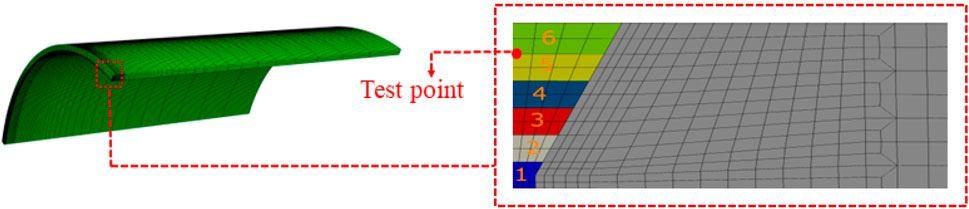
FIGURE 1. Three-dimensional finite element model and main mesh near welds.
In order to simulate the welding process, this study gradually activates the unit sets through “MODEL CHANGE.” Specifically, all units in the weld zone are first killed in step-0, and then the unit sets of the weld zone are gradually activated by a script written in the Python language.
The thermal physical and mechanical properties of X80 pipeline steel are shown in Table 1 (Yan et al., 2014; Zhao et al., 2018). The physical parameters at specific temperatures are listed in Table 1, and the specific parameters at other temperatures can be obtained by interpolation and extrapolation.

TABLE 1. Thermal physical parameters of X80 pipeline steel.
In the thermal analysis, the initial temperature of the pipeline is 20°C. Convective heat dissipation and radiation heat dissipation on the inner and outer surfaces of the pipeline should be considered during welding. The heat radiation rate can be taken as 0.8, and the convective heat transfer coefficient is 25 W/(m2·°C). The ambient temperature is 20°C, and the relative thermal efficiency during welding is η = 0.9 (Sui, 2008). In the mechanical analysis, the center plane of the weld at the left end of the three-dimensional model and the two planes parallel to the model axis are set as symmetrical boundaries.
The double-ellipsoid heat source model has higher accuracy than other heat source models (Liu, 2008) and can more accurately simulate the welding process of three-dimensional pipes. The first half of the heat flux curve is steep, and the second half is relatively gentle, which is in line with the actual shape of the molten pool of the pipeline (Dong et al., 2004). Therefore, this study uses the Goldak double-ellipsoid heat source model to simulate pipeline welding. The double ellipsoid heat source model is shown in Figure 2A. In Figure 2A, a1 and a2 are the length parameters of the front and rear semi-ellipsoids of the weld pool, and b and c represent the width and depth of the weld pool, respectively. In this study, Fortran 90 format is used to write the Dflux subroutine to realize the loading of the heat source of the pipe girth weld. The double ellipsoid heat source model parameters were determined by referring to experiments in the literature. The initial values of the double ellipsoid heat source model parameters were selected according to the molten pool shape size in the literature, and modifications of the obtained molten pool shape were repeated and compared with the experiment after simulation until they were consistent.
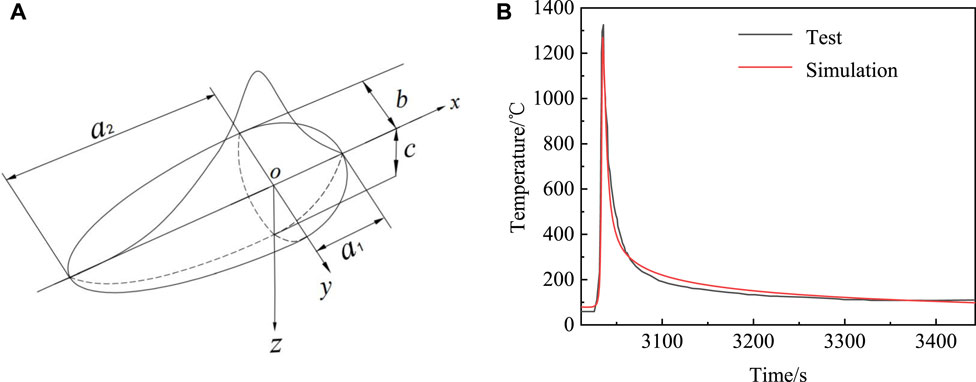
FIGURE 2. Heat source model and temperature field verification. (A) Double-ellipsoid heat source model; (B) comparison of the simulation value and experimental value of the thermal cycle curve.
In order to verify the accuracy of the temperature field simulation, the finite element simulation value of the test point temperature in Figure 1 is compared with the experimental value in Sui (2008), as shown in Figure 2B. The main parameters determining the characteristics of the welding thermal cycle are peak temperature, high-temperature residence time, and cooling time in a certain temperature range. The peak value of the test thermal cycle curve is 1,330°C, and the peak value of the finite element simulation is 1,270°C, which is an error of only 4.5%. In the welding temperature field, the cooling time of 800–500°C (t8/5) is often used to reflect the cooling rate of the molten pool. The t8/5 of the test is 8 s, and the t8/5 of the finite element simulation is 6.73 s; the error is 15.9%. The residence time above 1,100°C measured in the experiment was 3 s, compared to 2.68 s in the finite element simulation, and the error was 10.7%. The residence time above 1,100°C and t8/5 in the finite element simulation is smaller than the experimental value due to the thermal emissivity and convective heat transfer coefficient in the thermal boundary condition being too large. The thermal emissivity and convective heat transfer coefficient used in this paper are based on the reference. The finite element simulation value is in good agreement with the experimental value, so the welding temperature field simulation is reliable.
Deng and Murakawa (2005) used gas tungsten arc welding to weld the SUS304 pipe and measured the welding residual stress with a strain gauge. In order to verify the accuracy of the finite element model and analysis method, the model was established according to Deng’s test (Deng and Murukawa, 2005). The outer diameter of the SUS304 pipe is 114.3 mm, the wall thickness of the pipe is 6 mm, and the length of the pipe is 800 mm. The 1/4 pipe model is shown in Figure 3A. The specific welding process parameters are shown in Table 2.
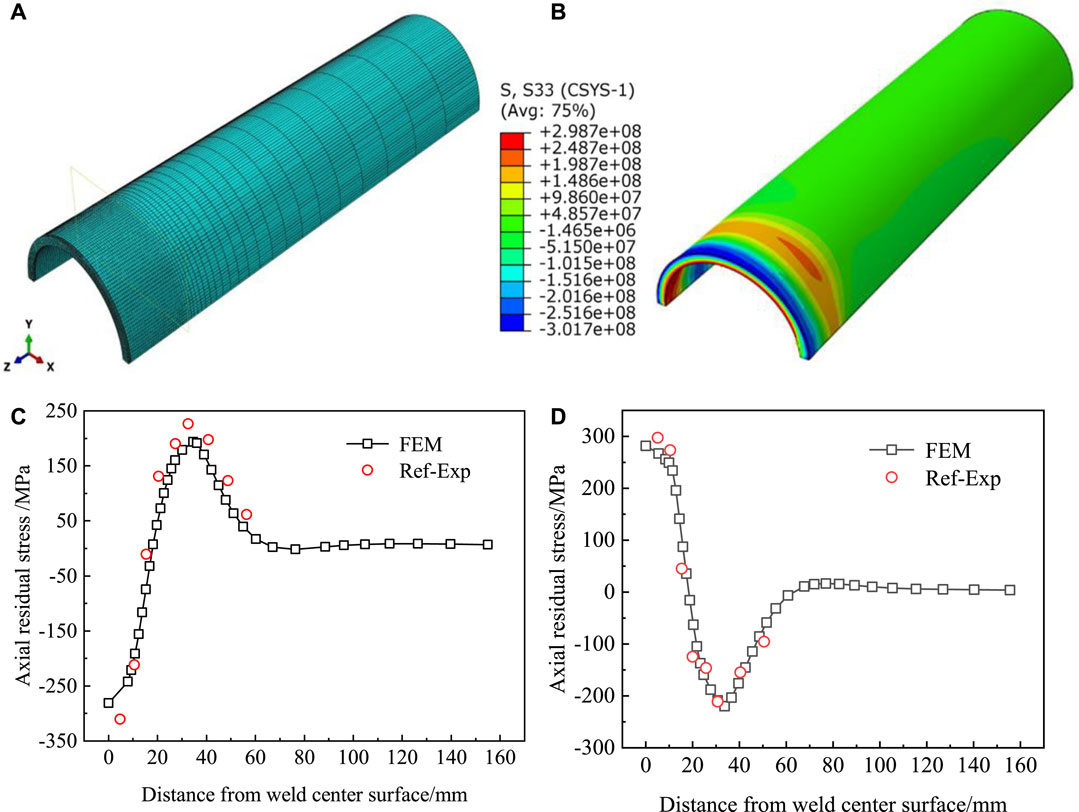
FIGURE 3. Finite element pipe model and stress field verification. (A) Finite element pipe model; (B) axial residual stress cloud diagram; (C) comparison of simulation and experimental values of axial residual stress on the outer surface; (D) comparison of simulation and experimental values of axial residual stress on the inner surface.
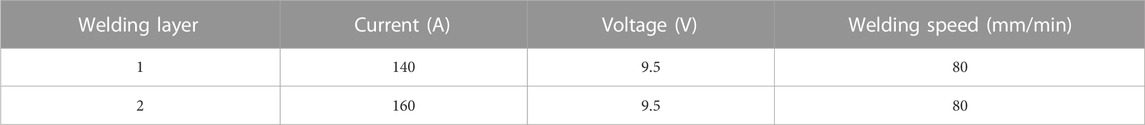
TABLE 2. SUS304 pipe welding process parameters.
The finite element ABAQUS software is used for welding simulation, and the axial residual stress cloud diagram is shown in Figure 3B. From the middle point (90° from the starting point of welding) of the left end surface of the model (weld center plane), the axial residual stress data of the inner and outer surfaces of the pipe are extracted along the direction parallel to the pipe axis. The comparative analysis is shown in Figures 3C, D. It can be seen that the residual stress value obtained by finite element simulation has a high degree of fit with the experimental measurement value; thus, the reliability of the welding finite element mechanical simulation modeling is verified.
In the finite element simulation of steel with inclusions, the three-dimensional model is simplified into a two-dimensional model, as shown in Figure 4. The length of the two-dimensional model is 2000 mm, and the width is 18.4 mm, which is equivalent to the wall thickness of the pipeline. Mesh refinement was performed in the weld and heat-affected zone, and mesh transition and coarsening are performed in other regions. The thickness of each layer of the model is about 3 mm because the weld reinforcement has little effect on the mechanical properties of the welded joint (Li, 2003), so the weld reinforcement is ignored in this paper.
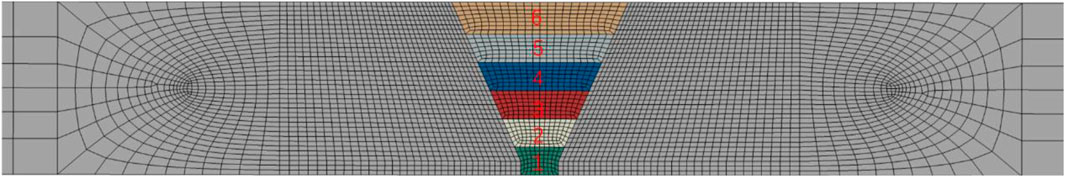
FIGURE 4. Two-dimensional finite element model and its mesh division near welds.
Figures 5A, B show the hydrogen concentration distribution near the weld obtained by the two-dimensional axisymmetric model and the three-dimensional model under the condition of residual stress and with no inclusions. The hydrogen concentration distributions obtained by two-dimensional and three-dimensional modeling are similar. The hydrogen concentration distribution curves along the weld center plane obtained by two-dimensional and three-dimensional models are in good agreement in Figure 5C.
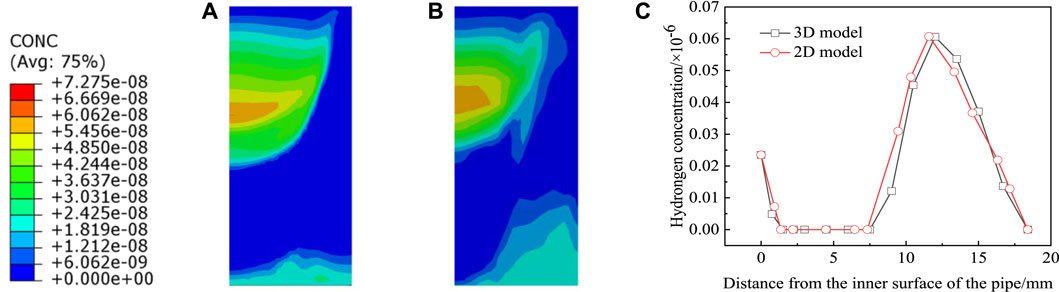
FIGURE 5. Hydrogen concentration distribution and comparison. (A) Two-dimensional axisymmetric model; (B) three-dimensional model; (C) comparison of the hydrogen concentration curves of the two-dimensional and three-dimensional models.
The uneven stress field is caused by the uneven temperature field after welding. The temperature field during the welding process of the fourth layer is shown in Figure 6A. Figure 6B plots the residual stress of the pipeline after 10,800 s natural air cooling to room temperature after welding. It can be seen that the von Mises stress mainly concentrates in the weld zone and the adjacent heat-affected zone, and the von Mises stress on the outer surface is higher than that on the inner surface. The peak value of the equivalent stress on the outer surface reaches 579 MPa, that of the inner surface is 394 MPa, and the peak value of the outer surface is close to the yield strength of the pipe.
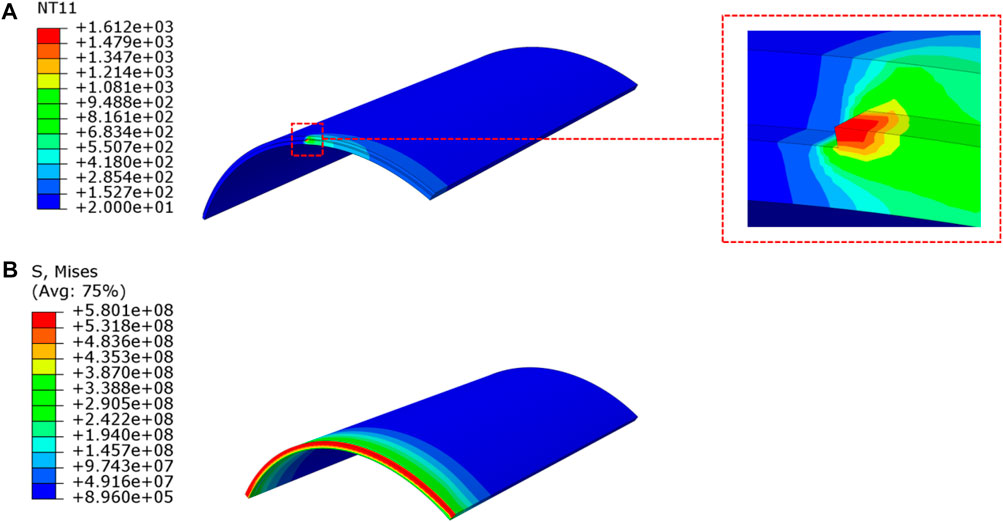
FIGURE 6. Temperature field and stress field. (A) Temperature field during welding; (B) von Mises stress after cooling to room temperature.
Figures 7A–C plot the hoop, axial, and radial residual stress of pipeline welding, respectively. The distribution of residual stress in the weld zone is extremely non-uniform. The radial residual stress is smaller than the circumferential and axial residual stress, and the maximum radial value is reduced by almost an order of magnitude. Compared with the pipeline damage caused by hoop stress and axial stress, the damage caused by radial stress is much smaller, so the radial stress caused by pipeline welding is generally not discussed.
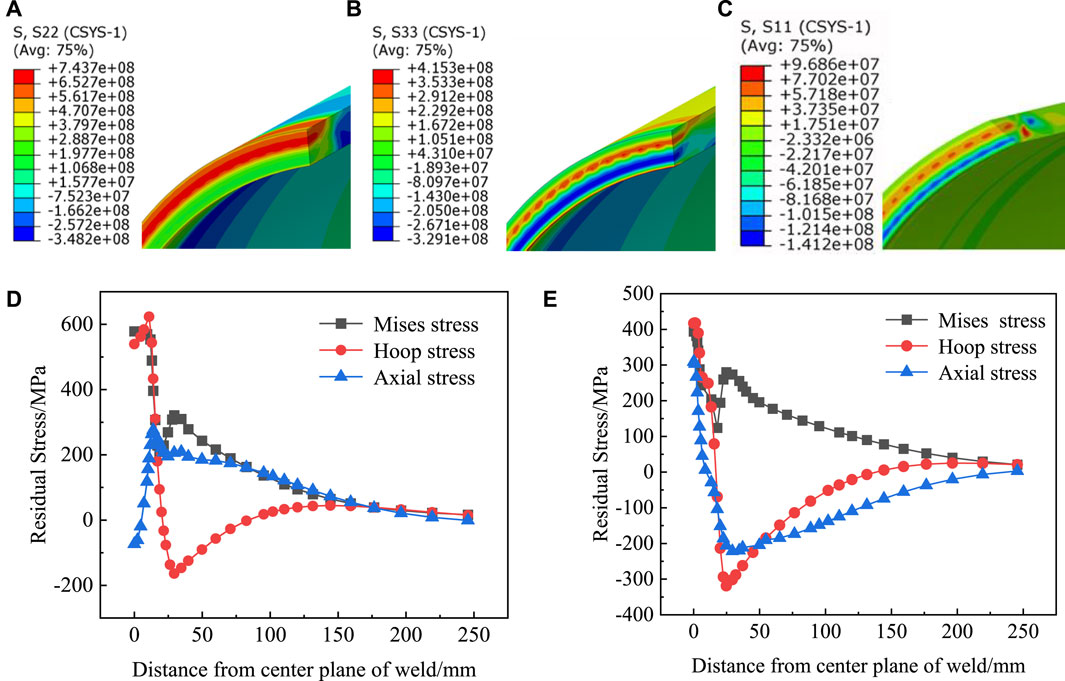
FIGURE 7. Residual stress distribution and curves. (A) Hoop residual stress of pipeline; (B) axial residual stress of pipeline; (C) radial residual stress of pipeline; (D) residual stress distribution on the outer surface; (E) residual stress distribution on the inner surface.
The inner and outer surfaces of the pipeline are in direct contact with the conveying medium and air, respectively; the dangerous sites of pipeline stress corrosion are on the inner and outer surfaces near the weld. Therefore, the residual stress distribution of the inner and outer surfaces of the pipeline after welding must be studied.
From the middle point (45° from the starting point of welding) of the left end plane (weld center plane) of the model, the residual stress data of the outer surface are extracted along the direction parallel to the pipe axis. Figure 7D plots the von Mises, hoop, and axial residual stress distribution curves of the outer surface of the pipeline. As the distance from the center plane of the weld increases, the von Mises stress on the outer surface of the pipe is relatively stable at the weld, drops rapidly after passing the weld junction, and, finally, slowly decreases to 0 MPa after a small peak value; the maximum value of the von Mises stress is 579 MPa. As the distance from the center plane of the weld increases, the hoop tensile stress on the outer surface first increases slightly and reaches the maximum value at the weld junction. After passing the weld, the hoop tensile stress rapidly changes into compressive stress and gradually rises to 0 MPa. The hoop tensile stress and compressive stress peaks are 624 MPa and 164 MPa, respectively. The axial stress is expressed as compressive stress at the center of the weld on the outer surface. As the distance from the center plane of the weld increases, the axial compressive stress rises rapidly to axial tensile stress, and then the axial tensile stress slowly decreases to 0 MPa. The peak stress and compressive stress are 276 MPa and 73 MPa, respectively.
Figure 7E plots the von Mises, hoop, and axial residual stress distribution curves of the inner surface of the pipeline. As the distance from the center plane of the weld increases, the von Mises equivalent stress on the inner surface of the pipe shows a downward trend, then rises to a small peak, and finally slowly drops to 0 MPa. The maximum value of von Mises stress is 394 MPa. Meanwhile, the hoop tensile stress on the inner surface rapidly changes into compressive stress and then gradually rises to 0 MPa. The peak values of circumferential tensile stress and compressive stress are 418 MPa and 319 MPa, respectively. Due to the increased distance from the center plane of the weld, the axial residual stress of the inner surface changes from tensile stress to compressive stress and then gradually rises to 0 MPa. The peak values of tensile stress and compressive stress are 309 MPa and 222 MPa, respectively.
Inclusions such as sulfide and oxides will be introduced in the steel welding process. Compared with the base material, the elastic modulus of the sulfide inclusions is very low, categorizing them as soft inclusions, while the elastic modulus of oxide inclusions is higher than the base material, categorizing them as hard inclusions. The distribution of residual stress in the inclusion zone will be influenced by inclusions. In order to study the local stress caused by inclusion, the position of the inclusions is set in the hydrogen concentration enriched area (the junction of the fourth and fifth welding layers), as shown in Figure 8A. For the three cases where the elastic modulus ratios of inclusions and base material are 2, 1, and 0.5, respectively, the corresponding local stress distributions are shown in Figure 8B, where Ei is the elastic modulus of inclusions and Em is the elastic modulus of steel.
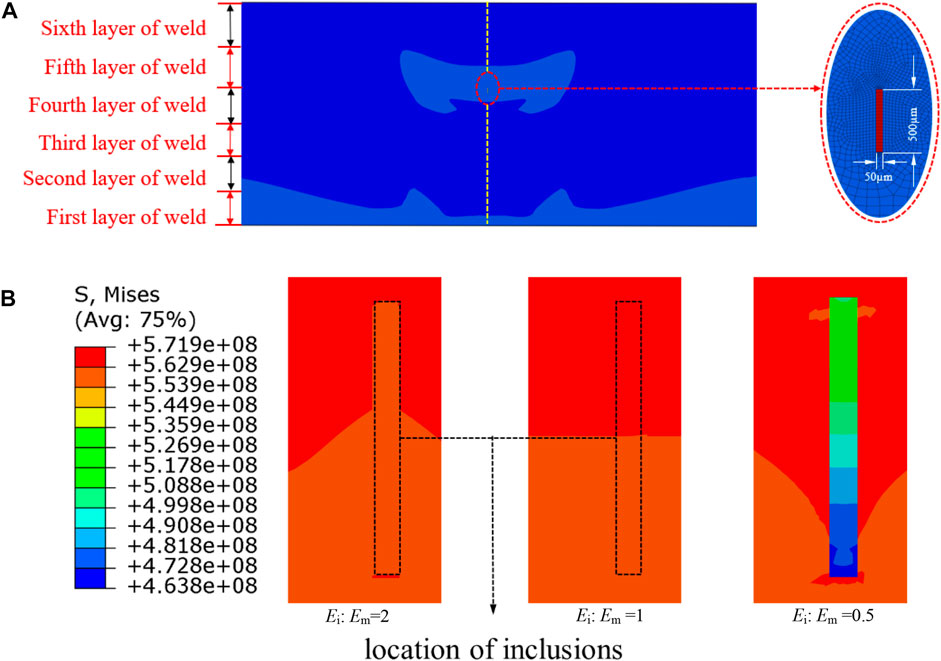
FIGURE 8. Inclusion location and stress distribution. (A) Inclusion location; (B) von Mises stress distribution in the inclusion region.
As shown in Figure 8B, when Ei: Em = 2 or 1, the von Mises stress distribution around the inclusions is uniform, there is no von Mises stress mutation, and the residual stress is approximately 5.6 × 10⁸ Pa. When Ei: Em = 0.5, the von Mises stress distribution around the inclusion is not uniform, and the stress mutation occurs. The maximum residual stress of the inclusion is 5.3 × 10⁸ Pa; the minimum is 4.6 × 10⁸ Pa, which is less than the von Mises stress of the hard inclusion, and the von Mises stress of the base welding material is still approximately 5.6 × 10⁸ Pa.
Simulating hydrogen diffusion in pipelines is mainly based on the governing and constitutive equations (Zhang et al., 2019). The governing equation for hydrogen diffusion can be expressed as
where C represents the hydrogen concentration, X represents the direction of hydrogen diffusion, J represents diffusion flux, φ denotes the hydrogen activity, and S denotes the solubility and can be computed as follows:
The general chemical potential gradient is the driving force of hydrogen diffusion, which is related to the diffusion flux J by Chu, 2019:
where D represents the diffusion coefficient, R represents the gas constant, T denotes temperature, TZ represents absolute zero, μ denotes the chemical potential, μ0 represents the chemical potential in the standard state without stress, σh represents hydrostatic stress, and VH represents the partial molar volume of hydrogen.
Substituting Eqs 2, 4 into Eq. 3, we obtain:
Introducing Eq. 5 into Eq. 1, the constitutive equation of hydrogen diffusion can be obtained:
where q represents the concentration flux of hydrogen, ks denotes the coefficient driven by the temperature gradient, and kp denotes the coefficient driven by the stress gradient. Ks and kp can be computed as follows:
In this study, the hydrogen diffusion simulation is carried out after the welding is completed, and the pipe temperature is cooled to room temperature. The influence of the temperature gradient on the hydrogen diffusion is not considered, so the constitutive equation of the hydrogen diffusion can be simplified as:
The finite element simulation is mainly based on the following assumptions: 1) Hydrogen only diffuses in pipeline steel in the form of hydrogen atoms. When hydrogen atoms diffuse to the outer surface of the pipeline, they will combine into hydrogen molecules, so the hydrogen concentration on the outer surface of the pipeline is 0. 2) Ignoring the hydrogen introduced during the smelting of pipeline steel, it is considered that the hydrogen concentration inside the pipeline steel is 0 in the initial state. 3) The diffusion coefficient of hydrogen in pipeline steel is isotropic. 4) This study is of the hydrogen diffusion analysis after pipeline welding and cooling; only the influence of residual stress on hydrogen diffusion is considered, and the influence of temperature is ignored.
The influence of welding residual stress on hydrogen diffusion is considered mainly, so it is assumed that the hydrogen diffusion parameters of the weld material and the base metal are the same. Referring to Zhang et al. (2019), the adsorbing hydrogen concentration on the inner surface of the pipeline is 0.0235 × 10⁻⁶, and the solubility and hydrogen diffusion coefficient of the pipe are 4.797 × 10⁻¹¹ Pa−1/2 and 3.302 × 10⁻⁶ cm2/s, respectively. In the simulation of pipeline hydrogen diffusion, the parameter characterizing the boundary condition is “normalized hydrogen concentration,” which is usually referred to as hydrogen activity φ and calculated by Eq. 2, and the hydrogen concentration applied on the outer boundary is 0.
Figure 9 shows the pressure distribution near the weld, and its value is the negative value of hydrostatic stress. It can be seen indirectly that the higher hydrostatic stress area at the weld is mainly concentrated at the junction of the fourth and fifth welding layers. Two paths, P1 and P2, are taken at the welded joint to better observe the distribution of hydrostatic stress and subsequent hydrogen concentration in the pipe. P1 is located on the central plane of the weld, pointing from the inner surface to the outer surface of the pipe, and P2 is parallel to the axis of the pipe and from left to right, with a starting point that is 12 mm away from the inner surface of the pipe (the junction of the fourth and fifth welding layers).
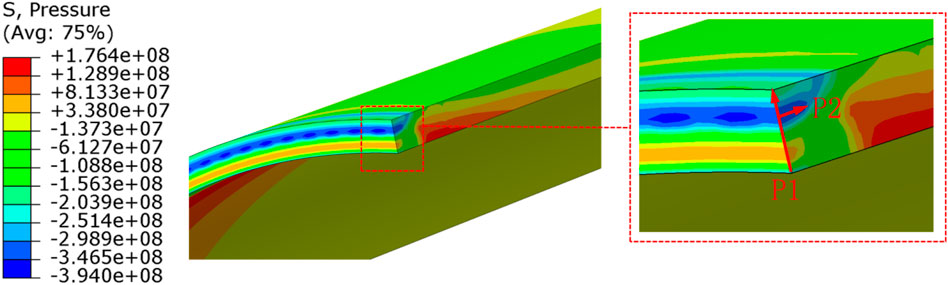
FIGURE 9. Pressure distribution near the weld and paths of P1 and P2.
Figures 10A, B show the hydrogen concentration distribution near the pipeline weld, considering the presence and absence of residual stress. Figures 10C, D plot the distribution of hydrostatic stress and hydrogen concentration together along P1 and P2 when welding residual stress is considered. Hydrogen atoms are affected by the hydrostatic stress gradient and are enriched toward the junction of the fourth and fifth welding layers with high hydrostatic stress, as shown in Figures 10C, D. The hydrostatic stress generated by welding is the main driving force for hydrogen atom enrichment in the pipeline, which is consistent with the research results (Jin et al., 2010; Moro et al., 2010). In Figure 10C, with the presence of residual stress, the hydrogen concentration first decreases and then increases, reaching a maximum value of 0.0606 × 10⁻⁶ at 12 mm from the inner surface of the pipeline along the P1 direction. It can be seen from Figure 10D that with the presence of residual stress, the hydrogen concentration value gradually decreases with the increase of the distance from the center plane of the weld along P2.
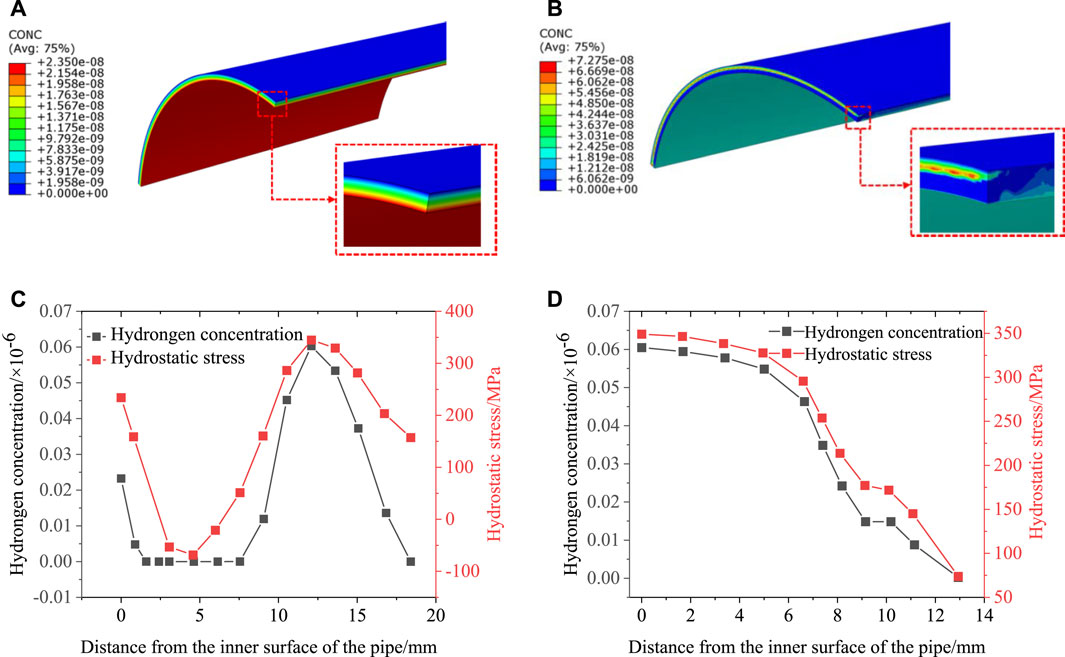
FIGURE 10. Hydrogen concentration distribution and curves. (A) Without residual stress; (B) with residual stress; (C) hydrogen concentration and hydrostatic stress curves along P1; (D) hydrogen concentration and hydrostatic stress curves along P2.
The previous content mainly discussed the distribution of hydrogen concentration in pipeline steel without considering inclusions. Inclusions are the main initiation position of hydrogen-induced cracking in steel (Gong et al., 2007a; Gong et al., 2007b; Yan et al., 2014). Most calcium oxide and alumina oxide inclusions are spherical, and most manganese sulfide inclusions are strips (Hejazi et al., 2012). The size of large inclusions observed by scholars in X80 pipeline steel exceeds 100 μm (Li et al., 2012; Wang et al., 2013; Chen et al., 2015).
The concentration of adsorbed hydrogen on the inner surface of the pipe, the solubility of the pipe, and the hydrogen diffusion coefficient are the same as those mentioned in Section 3.1. Neither the hydrogen solubility nor the diffusion coefficient of inclusions has definite values at present. Some scholars (Pumphrey, 1980) believe that the hydrogen permeability in inclusions is increased by 5–20 times. In this study, both the solubility and hydrogen diffusion coefficient of inclusions are 10 times that of X80 pipeline steel (Ren et al., 2017; Zhong et al., 2016; Zhou et al., 2022). In the finite element simulation, it is assumed that the coherent phase boundary condition is satisfied between the inclusion and the metal base material. The aspect ratio of the strip-like inclusions is proposed to be 10 (Zhou et al., 2022), and the short and long sides are 50 μm and 500 μm, respectively.
The elastic modulus ratios of inclusions to base material are 2, 1, and 0.5, respectively. The length-width ratio of the studied inclusion is 10:1. The corresponding local hydrogen concentration distribution is shown in Figure 11. The peak hydrogen concentration is located on the inclusions, and the hydrogen concentration around the inclusions is approximately 0.07 × 10⁻⁶. When Ei: Em = 2, Ei: Em = 1, and Ei: Em = 0.5, the hydrogen concentration of the inclusion is approximately 0.88 × 10⁻⁶, 0.7 × 10⁻⁶, and 0.55 × 10⁻⁶, respectively, as shown in Figure 11. Inclusions act as hydrogen traps to capture hydrogen atoms, resulting in a much higher hydrogen concentration in the inclusions than in the weld material. Inclusions with high elastic modulus are more likely to capture hydrogen atoms, and mutation occurs around soft inclusions.
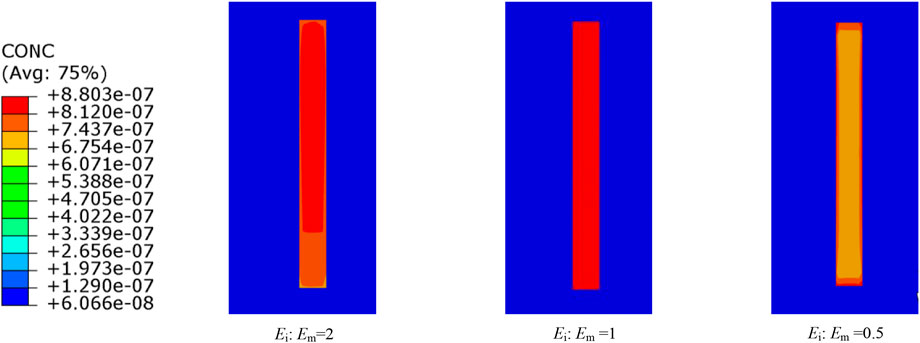
FIGURE 11. Hydrogen concentration distribution in the inclusion area.
The angle between the strip inclusions and the hydrogen diffusion direction is defined as θ. Figures 12A, B show the hydrogen concentration distribution of striped inclusions with the angle θ equal to 0° in the absence and presence of residual stress. When the angle is 0, the hydrogen concentration peaks are located at the inclusions with or without welding residual stress, which are 0.6960 × 10⁻⁶ and 0.9179 × 10⁻⁷, respectively, which is a difference of 6.6 times. Comparing Figures 12B–D, it can be seen that the angle θ between the orientation of the striped inclusions and the direction of hydrogen diffusion do not affect the hydrogen concentration in the inclusions.

FIGURE 12. Hydrogen concentration distribution when Ei: Em = 1. (A) Without residual stress and θ = 0°; (B) with residual stress and θ = 0°; (C) with residual stress and θ = 45°; (D) with residual stress and θ = 90°.
Figure 13 shows the curves of hydrogen diffusion flux over time with different θ, considering the situation under the presence and absence of welding residual stress. When θ is 0°, 45°, and 90°, the steady-state hydrogen diffusion fluxes with inclusions are 0.0046 × 10⁻⁶ m/s, 0.0025 × 10⁻⁶ m/s, and 0.00045 × 10⁻⁶ m/s, respectively, and the steady-state hydrogen diffusion flux without inclusions is 0.00042 × 10⁻⁶ m/s, without considering the welding residual stress. The steady-state hydrogen diffusion fluxes with inclusions at θ of 0°, 45°, and 90° are 11.0 times, 6.0 times, and 1.1 times those without inclusions, respectively. When θ is 0°, 45°, and 90°, the steady-state hydrogen diffusion fluxes with inclusions are 0.0576 × 10⁻⁶ m/s, 0.0459 × 10⁻⁶ m/s, and 0.0322 × 10⁻⁶ m/s, respectively, considering the welding residual stress. The steady-state hydrogen diffusion flux without inclusions is 0.0033 × 10⁻⁶ m/s, and the steady-state hydrogen diffusion fluxes with θ of 0°, 45°, and 90° are 17.5 times, 13.9 times, and 9.8 times that without inclusions, respectively. It can be seen that inclusions in steel can be used as channels to accelerate the diffusion of hydrogen atoms. The angle between strip inclusions and hydrogen diffusion direction is closely related to diffusion capacity. The hydrogen diffusion flux decreases gradually with the increase of θ. When the orientation of the strip inclusion is perpendicular to the hydrogen diffusion direction (θ = 90°), the diffusion channel effect disappears.
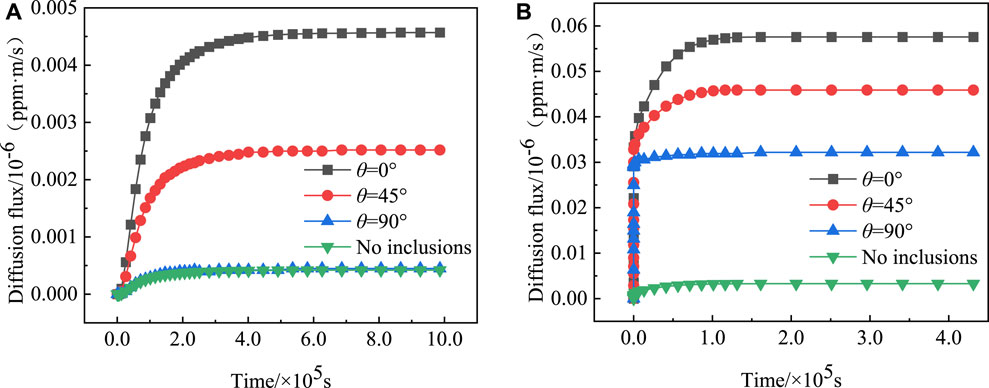
FIGURE 13. Time evolution of diffusion flux under different θ values. (A) Without residual stress; (B) with residual stress.
Comparing the hydrogen diffusion flux under the presence and absence of residual stress, the steady-state hydrogen diffusion flux of θ = 0°, 45°, and 90° with residual stress is 12.5 times, 18.4 times, and 71.6 times that without residual stress, respectively. The steady-state hydrogen diffusion flux with residual stress is 7.9 times that without residual stress when there is no inclusion. It can be found that when there is residual stress, the hydrogen diffusion flux in the inclusion is much larger than when there is no residual stress. The time for the hydrogen diffusion flux to reach the steady state with residual stress is significantly faster than that without residual stress, as shown in Figure 13.
The influence of inclusion shape on hydrogen diffusion flux is analyzed by fixing the area of inclusion (50 μm × 500 μm). The hydrogen diffusion flux changes with time are studied, considering that the angle θ is equal to 0°, 45°, and 90°, the length–width ratio is 5:1, 10:1, and 20:1, and the spherical inclusion has the same area. Figures 14A–F show the curves of the hydrogen diffusion flux with time under the condition without and with residual stress. Without residual stress, when θ is equal to 0° and 45°, the aspect ratio of strip inclusions increases from 5:1 to 20:1, the steady-state hydrogen diffusion flux increases from 0.0027 × 10⁻⁶ m/s to 0.0078 × 10⁻⁶ m/s and from 0.0016 × 10⁻⁶ m/s to 0.0041 × 10⁻⁶ m/s, respectively, which is a growth rate of 188.9% and 156.3%. With residual stress, when θ is equal to 0° and 45°, the aspect ratio of strip inclusions increases from 5:1 to 20:1, and the steady-state hydrogen diffusion flux increases from 0.0474 × 10⁻⁶ m/s to 0.0728 × 10⁻⁶ m/s and from 0.0389 × 10⁻⁶ m/s to 0.0557 × 10⁻⁶ m/s, which is a growth rate of 53.6% and 43.2%. It can be seen that when θ is equal to 0° or 45°, the steady-state hydrogen diffusion flux increases with the increase of the aspect ratio of strip inclusions; at the same time, the steady-state hydrogen diffusion flux of spherical inclusions with the same area is smaller than that of other inclusions. When θ is equal to 90°, the steady-state hydrogen diffusion flux decreases with the increase of the aspect ratio of strip inclusions, and the steady-state hydrogen diffusion flux of the spherical inclusions with the same area is greater than that of other strip inclusions. Therefore, the more slender the inclusions are, the stronger the diffusion abilities of 0° or 45° inclusions are, and the weaker the diffusion abilities of vertical inclusions are.
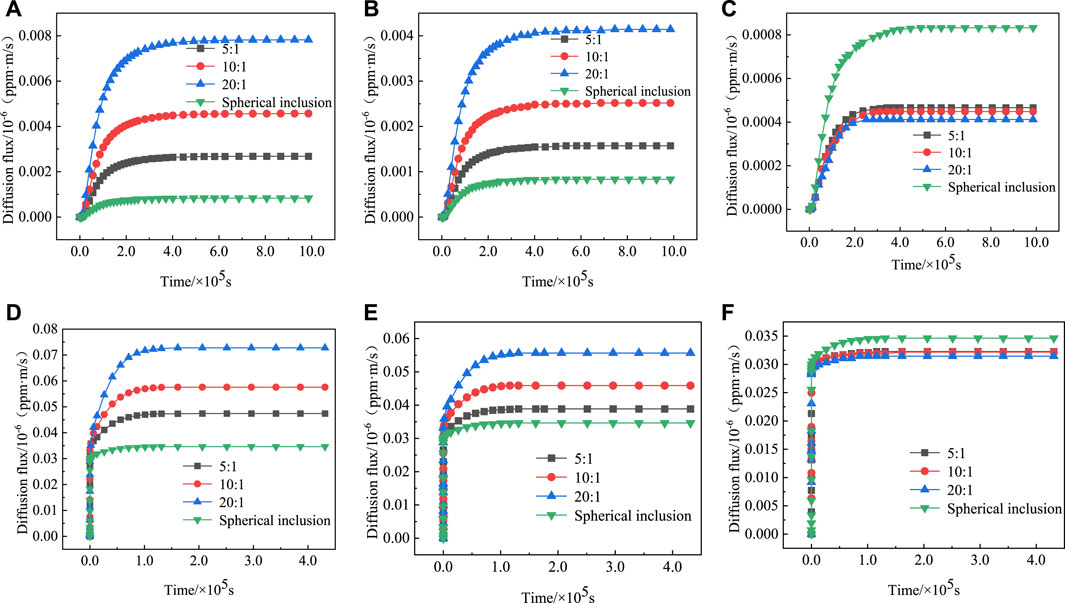
FIGURE 14. Diffusion flux curves. (A) θ = 0°, without residual stress; (B) θ = 45°, without residual stress; (C) θ = 90°, without residual stress; (D) θ = 0°, with residual stress; (E) θ = 45°, with residual stress; (F) θ = 90°, with residual stress.
The post-weld heat treatment of pipelines mainly refers to the relevant regulations in GB 50236-2011 “Field Equipment, Industrial Pipeline Welding Engineering Construction Specification,” NB/T 47015-2011 “Pressure Vessel Welding Procedure,” and the relevant studies in Liu (2017), Ge et al. (2021), and Chen et al. (2022).
Heat treatment is carried out in the whole model by raising the temperature to 600°C at a constant speed, keeping the temperature constant for 6 h, and then cooling the temperature to 20°C at a constant speed. During the heating and cooling process, the heating rate should not exceed 205°C/h, and the cooling rate should not exceed 260°C/h. The heat treatment temperature curve is shown in Figure 15.
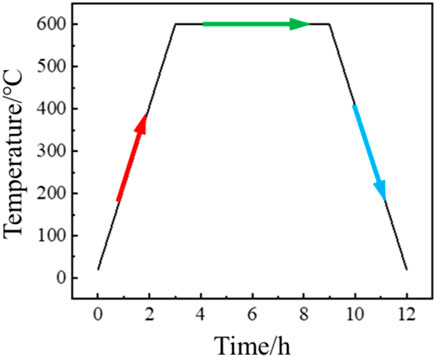
FIGURE 15. Post-weld heat treatment temperature curve.
Figures 16A–C show the von Mises, hoop, and axial residual stress of the pipeline after heat treatment. Figures 16D, E show the three-dimensional distribution surface diagrams of von Mises stress near the pipeline weld before and after heat treatment. The von Mises, hoop, and axial stresses of the pipeline after heat treatment are greatly reduced. The distribution of hoop and axial stress is similar to that before heat treatment, but the difference is that the axial stress on the outer surface of the pipeline changes from compressive stress into tensile stress. The welding von Mises stress mutation in the weld zone before heat treatment is substantial; the maximum and minimum values are 579 MPa and 124 MPa, respectively, mainly in the weld zone near the outer surface of the pipeline. After heat treatment, the von Mises equivalent stress becomes more uniform; the maximum value is 165 MPa, which is 71.5% lower than that before heat treatment, and the minimum equivalent residual stress is 98 MPa.
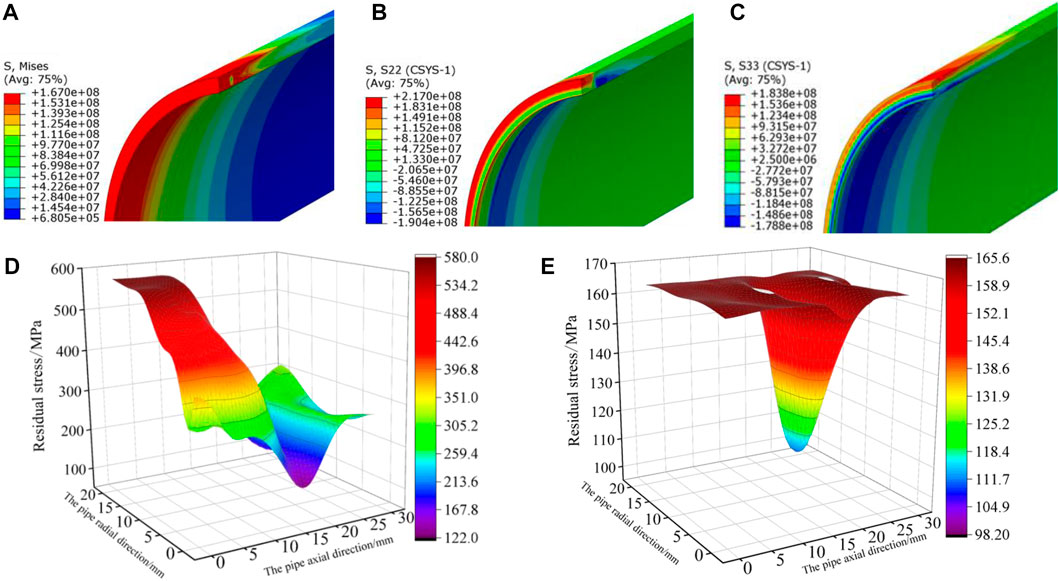
FIGURE 16. Residual stress distribution after heat treatment and surface map of the von Mises stress near the weld. (A) von Mises stress; (B) hoop residual stress; (C) axial residual stress; (D) surface diagram before heat treatment; (E) surface diagram after heat treatment.
Figure 17 shows the curves of von Mises equivalent stress at nodes 1 to 4 during the post-weld heat treatment process. The equivalent stress at points 1 to 4 at 0 h is 579 MPa, 566 MPa, 453 MPa, and 394 MPa, respectively, which are the stress values when the pipe has been welded and cooled to room temperature by natural air. The heating stage of heat treatment occurs from 0∼3 h, and the equivalent stress of the four nodes decreases, which is due to the yield strength of X80 pipeline steel decreasing with the increasing temperature. When the temperature is 600°C, the yield strength of X80 steel is approximately 108 MPa. The heat preservation stage of heat treatment occurs from 3∼9 h; yielding occurs at all four nodes, and the von Mises equivalent stress is 108 MPa. The cooling stage of heat treatment occurs from 9–12 h, and the stress at each point rises slowly, for the yield strength of X80 steel rises gradually, and the final stress value rises to 165 MPa. The additional residual stress of the pipeline after heat treatment is generated in the cooling stage of heat treatment and the effect of post-weld heat treatment on the reduction of welding residual stress are very significant.
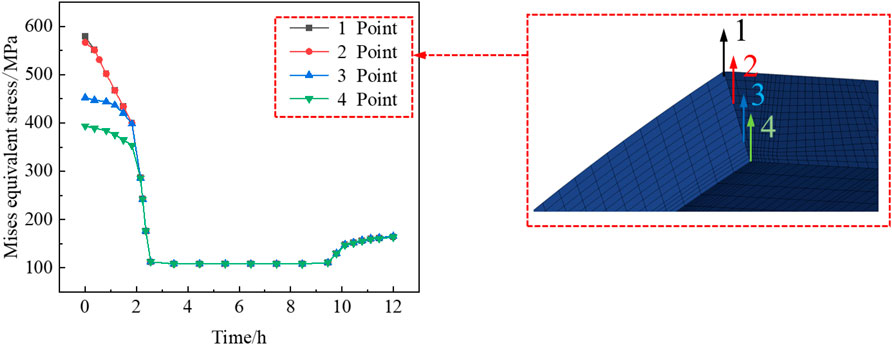
FIGURE 17. von Mises stress curves of the four nodes.
Figure 18A shows the von Mises, hoop, and axial residual stress distribution curves on the outer surface of the pipe after heat treatment. As the distance from the center plane of the weld increases, the von Mises equivalent stress on the outer surface of the pipe is relatively stable within 60 mm from the center plane of the weld and then slowly decreases to 0 MPa. At the same time, the hoop stress of the pipeline begins to decrease rapidly to the minimum value, then increases slowly and finally declines to approximately 0 MPa. The peak values of the von Mises equivalent stress, hoop tensile stress, and compressive stress are 165 MPa, 190 MPa, and 30 MPa which are 71.5%, 69.6%, and 81.7% lower than those before heat treatment, respectively. The axial stress of the pipeline increases first and then decreases, and the peak value of the axial tensile stress is 184 MPa, which is a decrease of 33.3%.
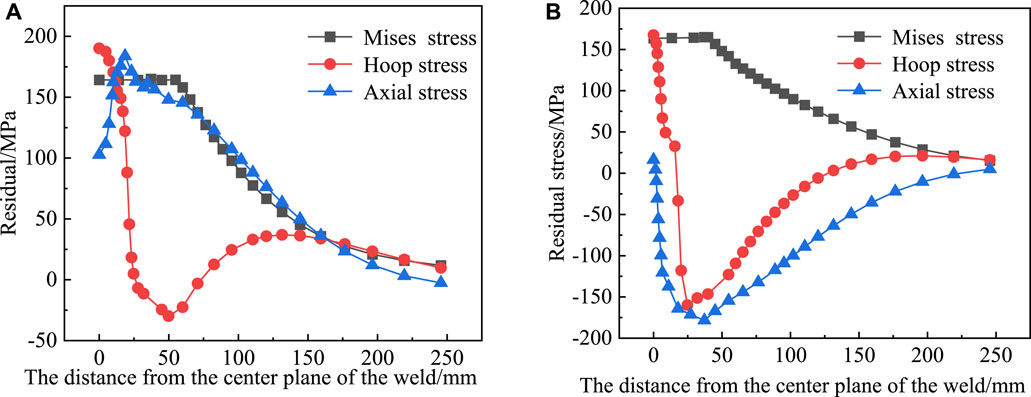
FIGURE 18. Residual stress curves of the pipe after heat treatment. (A) Outer surface; (B) inner surface.
In Figure 18B, the von Mises, hoop, and axial residual stress distribution curves on the inner surface of the pipe after heat treatment are shown. It can be seen that with the increase of the distance from the center plane of the weld, the von Mises equivalent stress on the inner surface of the pipe is relatively stable within 50 mm of the center plane of the weld and then slowly decreases to 0 MPa, with a peak value of 165 MPa, which is 58.1% lower than that before heat treatment. At the same time, the hoop tensile stress decreases rapidly, becomes compressive stress, and then gradually rises to 0 MPa. The peak values of hoop tensile stress and compressive stress are 168 MPa and 160 MPa, which are decreases of 59.8% and 49.8%, respectively. The axial residual stress changes from tensile stress to compressive stress with the increase of the distance from the center plane of the weld and then gradually rises to 0 MPa. The peak value of axial compressive stress is 178 MPa, which is a decrease of 19.8%.
It can be seen that the welding residual stress on the inner and outer surfaces of the pipe is greatly reduced after post-weld heat treatment, and the stress relaxation effect is obvious with the release of the welding residual stress.
The elastic modulus ratio of the inclusion to the base metal is 2, 1, and 0.5, respectively, and the corresponding local residual stress distribution is shown in Figure 19, and the von Mises stress of the welding material around the inclusion is 165 MPa. When Ei: Em = 2 and 1, the von Mises stress of inclusions is approximately equal to the welding material stress, and the stress mutation does not occur. When Ei: Em = 0.5, the von Mises stress peak of the inclusion is 86 MPa, which is approximately 52% of the von Mises stress of the welding material, and the stress mutation occurs.
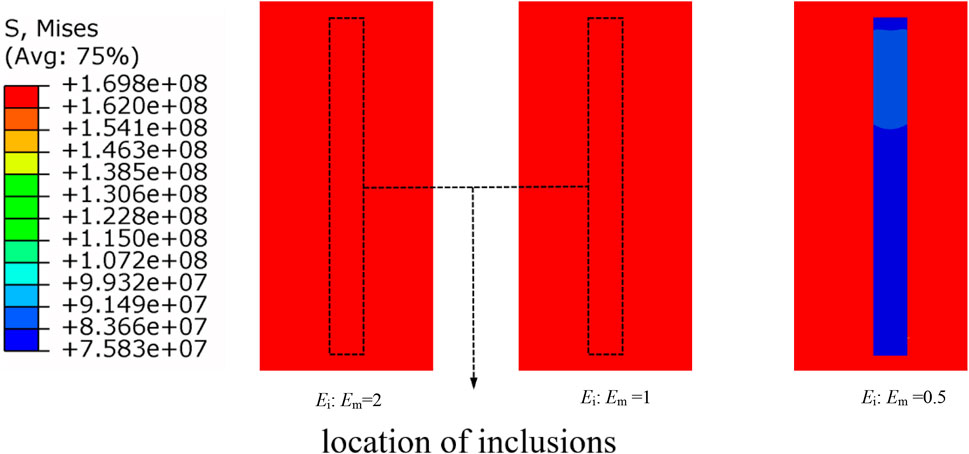
FIGURE 19. Stress distribution in the inclusion region after heat treatment.
Figures 20A, B show the hydrogen concentration distribution cloud diagram and the three-dimensional surface diagram of hydrogen concentration after post-weld heat treatment. Compared with Figure 10B, the post-weld heat treatment significantly reduces the hydrogen concentration because the post-weld heat treatment reduces the hydrostatic stress and the driving diffusion ability of hydrogen atoms. The enrichment area of hydrogen atoms is consistent with the hydrostatic stress, which is concentrated near the junction of the fourth and fifth welding layers.
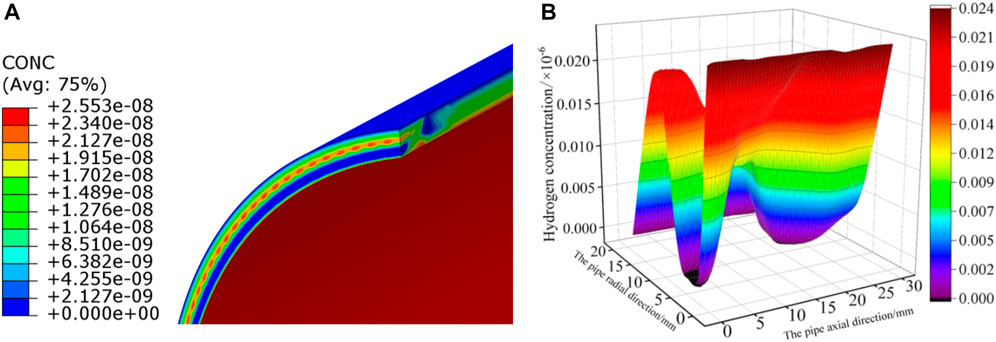
FIGURE 20. Hydrogen concentration distribution and surface diagram after heat treatment. (A) Hydrogen concentration distribution; (B) surface diagram near the weld.
Figure 21 shows the comparison of the distribution of hydrogen concentration on paths P1 and P2 before and after heat treatment. It can be seen from Figure 21A that along the P1 direction, the peak value of hydrogen concentration after heat treatment is at the inner surface of the pipe. At a distance of 12 mm from the inner surface of the pipe, the hydrogen concentration value is 0.0202 × 10⁻⁶, which is 66.7% lower than that before heat treatment. Figure 21B shows that along P2, after heat treatment, the hydrogen concentration within 5 mm of the center plane of the weld is close to a linear distribution, with a value of approximately 0.0202 × 10⁻⁶, and there are some fluctuations thereafter. After heat treatment, the hydrogen concentration in the weld and its adjacent area is significantly reduced (66.7%), and the distribution is more balanced, especially along the axial direction.
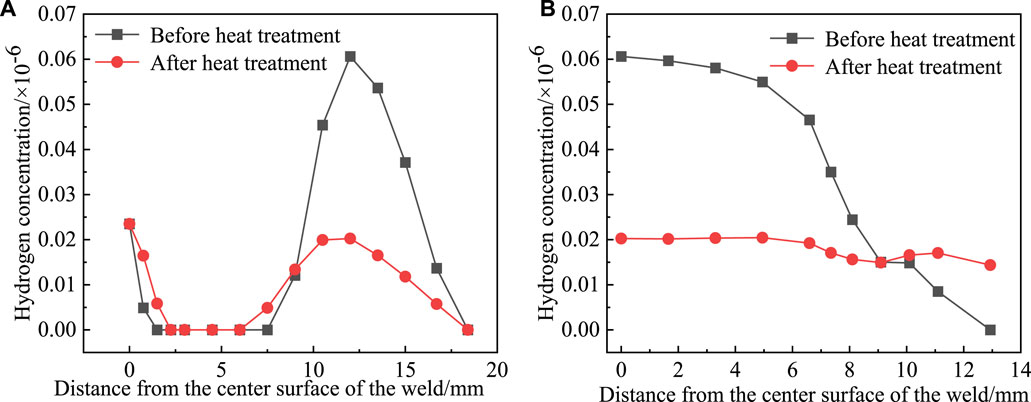
FIGURE 21. Comparison of hydrogen concentration before and after heat treatment. (A) Along P1; (B) along P2.
The ratio of the elastic modulus of the inclusion to the matrix is 2, 1, and 0.5, respectively, the length-width ratio of the studied inclusion is 10:1. and the corresponding local hydrogen concentration distribution is shown in Figure 22. The hydrogen concentration of the welding material around the inclusion is 0.02 × 10⁻⁶. Hydrogen enrichment occurs at the boundary of inclusions or inclusions. In particular, when Ei: Em = 2 and 0.5, the aggregation of hydrogen atoms at both ends of inclusions is more substantial, and the hydrogen concentration at the boundary of inclusions is 0.2 × 10⁻⁶, which is higher than that inside inclusions. When Ei: Em = 2, the minimum hydrogen concentration in the inclusion region is approximately 0.16 × 10⁻⁶. When Ei: Em = 1, the hydrogen concentration in the inclusion region is about 0.2 × 10⁻⁶. When Ei: Em = 0.5, the minimum hydrogen concentration inside the inclusion is about 0.15 × 10⁻⁶. The hydrogen concentration in a hard inclusion is higher than that in a soft inclusion.
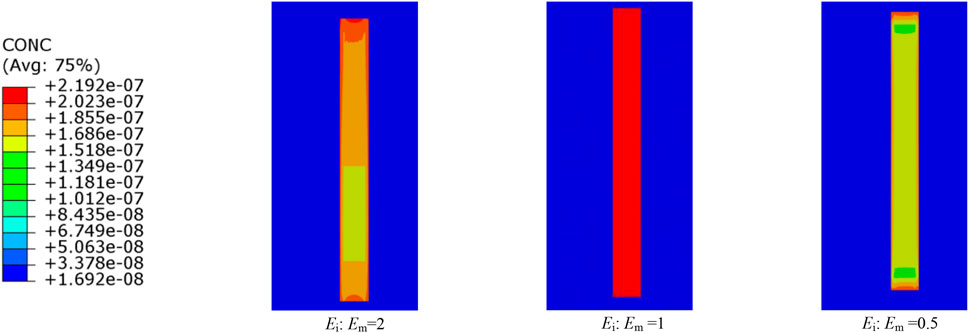
FIGURE 22. Hydrogen concentration distribution in the inclusion area after heat treatment.
Under the action of high-temperature welding and the asynchronous heating caused by the movement of the welding heat source, the organization structure and strain of the weld zone and the heat-affected zone change unevenly, resulting in residual stress. This paper simulates the spatial characteristics of the temperature field and stress distribution by a three-dimensional model, as was carried out in previous work (Deng et al., 2006; Zhao et al., 2021). When the upper weld seam is welded, it is equivalent to heat treatment for the lower weld seam, so the residual stress of the outermost weld seam is relatively large, as was pointed out in Ge et al. (2021). In this paper, after the weld cooled, the von Mises residual stress on the outer surface is 579 MPa, and the result in the literature (Guo et al., 2018) is 566 MPa, which is a difference of 2.3%; the hoop stress on the inner surface is 471 MPa, and the result in the literature (Guo et al., 2018) is 479.5 MPa, which is a difference of 1.8%.
The non-metallic inclusions in the steel and the matrix interface are prone to separating due to the increase of hydrogen pressure and even lead to hydrogen-induced cracks, as described in previous work (Jiang et al., 2006). Inclusions are unavoidable in the welding process. Most studies of the inclusion use non-welded steel as the matrix. In this work, the welding zone material is used as the inclusion embedded matrix, and the characteristics of the inclusion residual stress and hydrogen diffusion are analyzed considering the uneven temperature field and the uneven stress field. The general chemical potential gradient is the driving force of hydrogen diffusion; it is related to hydrostatic stress from Eqs 3, 4. The simulation analysis shows that the law of hydrogen diffusion in the welding zone is the same as the law of hydrostatic stress distribution, as pointed out in Shuai et al. (2022),Zhang et al. (2019), and Jiang et al. (2006). Based on the main characteristics of inclusions, such as elastic modulus, angle, and shape, the law of hydrogen concentration and hydrogen diffusion in the inclusion area are analyzed. While the inclusion region serves as a hydrogen trap to capture hydrogen, it can also act as a channel to accelerate the diffusion of hydrogen. It can be considered that the effect of inclusions on hydrogen diffusion is the result of combining the diffusion channel and the hydrogen trap.
Under the action of residual stress, atoms have a tendency to move along the direction of that stress. If the temperature is low, their movement ability is limited or even poor. At high temperatures, the movement ability of atoms is enhanced, and the atoms will continue to move along the direction of the residual stress they are subjected to, which will release part of the residual stress and make the welding residual stress reach a state of uniform distribution. Current research is mainly focused on increasing welding heat input to reduce hydrogen concentration and heat treatment to eliminate residual stress, as demonstrated in Shuai et al. (2022) and Yan et al. (2015). In this work, the heat treatment temperature was set with reference to relevant specifications, the effect of heat treatment on hydrogen diffusion was studied, and two cases with and without inclusions were considered. In particular, the characteristics of the residual stress and hydrogen concentration after heat treatment are analyzed, and the residual stress and hydrogen concentration distribution are significantly reduced, which can reduce the possibility of hydrogen embrittlement.
(1) The residual von Mises stress at the center plane of the weld is the largest and gradually decreases from the outer surface to the inner surface. Along the pipe shaft, the circumferential residual stress on the inner and outer surfaces of the pipe and the axial residual stress on the inner surface of the pipe rapidly change from tensile stress to compressive stress and then gradually increase. The axial residual stress on the outer surface of the pipe rapidly changes from compressive stress to tensile stress and then gradually decreases. When Ei: Em = 0.5, the stress mutation occurs. The maximum residual stress of the inclusion is 5.3 × 10⁸ Pa, and the minimum is 4.6 × 10⁸ Pa, which is less than the von Mises stress of the hard inclusion, and the von Mises stress of base welding material is still approximately 5.6 × 10⁸ Pa.
(2) The hydrostatic stress and hydrogen concentration distribution curves of pipelines are similar, and it can be considered that hydrostatic stress is the main driving force for hydrogen diffusion in pipelines. As the angle θ between strip inclusions and the hydrogen diffusion direction increases, the hydrogen diffusion flux will gradually decrease. The more slender the inclusions, the stronger the diffusion ability of parallel or 45° inclusions and the weaker the diffusion ability of vertical inclusions. The hydrogen diffusion flux at the inclusions with residual stress is much larger than that without residual stress, and the hydrogen concentration increases 6.6 times.
(3) After post-weld heat treatment, the peak von Mises stresses on the inner and outer surfaces of the pipe were reduced by 71.5% and 58.1%, respectively. The peak values of hoop and axial tensile stress on the outer surface of the pipe were reduced by 69.6% and 33.3%, respectively, and the peak value of hoop compressive stress was reduced by 81.8%. There is no axial compressive stress. The hoop and axial peak tensile stresses on the inner surface of the pipe were reduced by 59.8% and 94.7%, respectively, and the hoop and axial compressive stress peaks were reduced by 49.9% and 19.6%, respectively. Post-weld heat treatment makes the stress distribution near the weld more uniform. When Ei: Em = 0.5, the von Mises stress peak of the inclusion is 86 MPa, which is approximately 52% of the von Mises stress of the welding material, and the stress mutation occurs.
(4) The effect of post-weld heat treatment on reducing the hydrogen concentration is obvious. Along P1, the peak value of hydrogen concentration on the inner surface of the pipeline is reduced by 66.7%. Along path P2, the distribution of hydrogen concentration is close to a straight line with slight fluctuations. From the three-dimensional distribution surface diagram, it can be found that post-weld heat treatment makes the hydrogen concentration distribution near the weld more uniform. Hydrogen enrichment still occurs at the boundary of inclusions or inclusions, especially when Ei: Em = 2 and 0.5, the aggregation of hydrogen atoms at both ends of inclusions is more substantial, and the hydrogen concentration at the boundary of inclusions is higher than that inside inclusions. The internal hydrogen concentration of hard inclusions is higher than that of soft inclusions.
The original contributions presented in the study are included in the article/Supplementary material; further inquiries can be directed to the corresponding authors.
JX: conceptualization, finite element simulation, and writing; AC: finite element simulation and writing; CB: finite element simulation and writing; LJ: writing and translation. All authors contributed to the article and approved the submitted version.
The research described in this paper was financially supported by the Scientific Research Fund of the Institute of Engineering Mechanics, China Earthquake Administration (Grant No. 2020 EEEVL 2020 D25).
The authors declare that the research was conducted in the absence of any commercial or financial relationships that could be construed as a potential conflict of interest.
All claims expressed in this article are solely those of the authors and do not necessarily represent those of their affiliated organizations, or those of the publisher, the editors, and the reviewers. Any product that may be evaluated in this article, or claim that may be made by its manufacturer, is not guaranteed or endorsed by the publisher.
Arif, A. F. M., Al-Omari, A. S., and Al-Nassar, Y. (2012). Development of residual stress during manufacturing of spiral welded pipes. Mat. Manuf. process. 27 (7), 738–745. doi:10.1080/10426914.2011.647939
Bi, Y. X. (2007). Numerical simulation of welding temperature field and stress field of T-joint. China: Zhejiang University.
Chen, D., Xiao, H., Li, M., et al. (2015). Numerical simulation of ultrasonic testing of non-metallic inclusions in metal materials. Chin. J. Eng. 37 (07), 942–949. doi:10.13374/j.issn2095—9389.2015.07.017
Chen, Y., Xu, Y. L., Li, Q. T., et al. (2022). Finite element simulation of post-weld heat treatment to eliminate residual stress in pipeline girth welding. Welded pipe 45 (05), 41–47. doi:10.19291/j.cnki.1001-3938.2022.05.006
Deng, D., and Murakawa, H. (2005). Numerical simulation of temperature field and residual stress in multi-pass welds in stainless steel pipe and comparison with experimental measurements. Comp. Mat. Sci. 37 (3), 269–277. doi:10.1016/j.commatsci.2005.07.007
Dong, Z. B., Wei, Y. H., Liu, R. P., et al. (2004). Three-dimensional numerical simulation of stainless steel welding temperature field. Trans. China Weld. Institution 25 (2), 9–14. + 129.
Ge, H., Huang, H. B., Jiang, Y., et al. (2021). Numerical simulation of residual stress in girth welding of X80 pipeline. Welding 12, 17–23. + 64.
Gery, D., Long, H., and Maropoulos, P. (2005). Effects of welding speed, energy input and heat source distribution on temperature variations in butt joint welding. J. Mat. Process. Tech. 167 (2-3), 393–401. doi:10.1016/j.jmatprotec.2005.06.018
Gong, J. M., Jiang, W. C., Tang, J. Q., et al. (2007b). 3D finite element simulation of hydrogen diffusion in 16MnR steel weldment. Chin. J. Mech. Eng. 9, 113–118. doi:10.3901/jme.2007.09.113
Gong, J. M., Jiang, W. C., Tang, J. Q., et al. (2007a). Numerical simulation of hydrogen diffusion in welded joints of low alloy steel in wet H2S environment. Trans. China Weld. Institution 32 (04), 5–8+113.
Guo, Y. L., Ma, T. X., Liu, W. Y., et al. (2018). Numerical simulation of welding residual stress of X80 pipeline steel based on ABAQUS. Heat Treat. Metals 43 (09), 218–222. doi:10.13251/j.issn.0254-6051.2018.09.04
Han, Y. D., Jing, H. Y., and Xu, L. Y. (2012). Welding heat input effect on the hydrogen permeation in the X80 steel welded joints. Mat. Chem. Phys. 132 (1), 216–222. doi:10.1016/j.matchemphys.2011.11.036
Hejazi, D., Haq, A. J., Yazdipour, N., Dunne, D., Calka, A., Barbaro, F., et al. (2012). Effect of manganese content and microstructure on the susceptibility of X70 pipeline steel to hydrogen cracking. Mat. Sci. Eng. A-Struct. 551, 40–49. doi:10.1016/j.msea.2012.04.076
Jiang, W. C., Jiang, J. M., Tang, J. Q., et al. (2006). Numerical simulation of hydrogen diffusion under welding residual stress. Trans. China Weld. Institution 27 (11), 57–60.
Jin, T. Y., Liu, Z. Y., and Cheng, Y. F. (2010). Effect of non-metallic inclusions on hydrogen-induced cracking of API5L X100 steel. Int. J. Hydrogen. Energy. 35 (15), 8014–8021. doi:10.1016/j.ijhydene.2010.05.089
Li, D. L. (2003). Numerical simulation of welding stress and deformation. Hubai: Wuhan University of Technology.
Li, S. H., Zeng, Y. P., and Tong, K. (2012). Microscopic behavior of inclusions in X80 pipeline steel under fatigue load. Acta Pet. Sin. 33 (03), 506–512.
Liu, W. Y. (2017). Research on crack propagation in heat affected zone of pressure pipeline welding. China: Southwest Petroleum University.
Liu, Z. Y. (2008). Numerical simulation of welding residual stress of X80 pipeline steel girth weld. China: Tianjin University.
Moro, I., Briottet, L., Lemoine, P., Andrieu, E., Blanc, C., and Odemer, G. (2010). Hydrogen embrittlement susceptibility of a high strength steel X80. Mat. Sci. Eng. A-Struct. 527 (27-28), 7252–7260. doi:10.1016/j.msea.2010.07.027
Pumphrey, P. H. (1980). The role of sulfide inclusions in hydrogen entry during the exposure of steels to acids. Corrosion 36 (10), 537–543. doi:10.5006/0010-9312-36.10.537
Shuai, J., Xie, D., Wang, W., et al. (2022). Simulation study on residual stress and hydrogen diffusion of pipeline girth welded joint. J. Saf. Sci. Technol. 18 (03), 26–31. doi:10.11731/j.issn.1673-193x.202203004
Sui, Y. L. (2008). Research on welding technology of domestic X80 pipeline steel. China: Tianjin University.
Thiessen, R. G., Richardson, I. M., and Sietsma, J. (2006). Physically based modelling of phase transformations during welding of low-carbon steel. Mat. Sci. Eng. A-Struct. 427 (1-2), 223–231. doi:10.1016/j.msea.2006.04.076
Wang, X. H., Li, X. G., Li, Q., Huang, F., and Yang, J. (2013). Control of CaO-Al2O3 non-metallic inclusions in X80 pipeline steel plate. Acta. Metall. Sin. 49 (05), 553–561. doi:10.3724/SP.J.1037.2012.00505
Yaghi, A. H., Hyde, T. H., Becker, A. A., Williams, J., and Sun, W. (2005). Residual stress simulation in welded sections of P91 pipes. J. Mat. Process. Tech. 167 (2-3), 480–487. doi:10.1016/j.jmatprotec.2005.05.036
Yan, C. Y., Liu, C. Y., and Yan, B. (2014). 3D modeling of the hydrogen distribution in X80 pipeline steel welded joints. Comp. Mat. Sci. 83 (2), 158–163. doi:10.1016/j.commatsci.2013.11.007
Yan, C. Y., Zhang, G. Y., and Liu, C. Y. (2015). Numerical simulation of hydrogen distribution in welded joint of X80 pipeline steel. Trans. China Weld. Institution 36 (09), 103–107+118.
Zhang, T. M., Zhao, W. M., Jiang, W., et al. (2019). Numerical simulation of hydrogen diffusion in X80 welded joint under the combined effect of residual stress and microstructure inhomogeneity. Acta Metall. Sin. 55 (02), 258–266. doi:10.11900/0412.1961.2018.00060
Zhang, T. M., Zhao, W. M., Jiang, W., et al. (2019). Numerical simulation of hydrogen diffusion under non-uniform microstructure of X80 steel welding residual stress coupling joint. Acta. Metall. Sin. 55 (02), 258–266. doi:10.11900/0412.1961.2018.00060
Zhao, W., Jiang, W., Zhang, H., Han, B., Jin, H., and Gao, Q. (2021). 3D finite element analysis and optimization of welding residual stress in the girth joints of X80 steel pipeline. J. Manuf. Process 66 (66), 166–178. doi:10.1016/J.JMAPRO.2021.04.009
Zhao, W. M., Yang, M., Zhang, T. M., Deng, Q., Jiang, W., and Jiang, W. (2018). Study on hydrogen enrichment in X80 steel spiral welded pipe. Corros. Sci. 133, 251–260. doi:10.1016/j.corsci.2018.01.011
Zhong, Z. Q., Tian, Z. L., and Tang, S. P. (2016). Effects of strip inclusions on hydrogen diffusion process in 0Cr16Ni5Mo steel. Trans. Mater. Heat Treat. 37 (02), 84–89. doi:10.13289/j.issn.1009-6264.2016.02.015
Keywords: girth weld, inclusion, welding residual stress, heat treatment, hydrogen diffusion
Citation: Xue J, Cheng A, Bai C and Ji L (2023) Research on residual stress and hydrogen diffusion of X80 pipeline welded joint. Front. Mater. 10:1215843. doi: 10.3389/fmats.2023.1215843
Received: 02 May 2023; Accepted: 01 June 2023;
Published: 03 August 2023.
Edited by:
Liang-Yu Chen, Jiangsu University of Science and Technology, ChinaReviewed by:
Linjiang Chai, Chongqing University of Technology, ChinaCopyright © 2023 Xue, Cheng, Bai and Ji. This is an open-access article distributed under the terms of the Creative Commons Attribution License (CC BY). The use, distribution or reproduction in other forums is permitted, provided the original author(s) and the copyright owner(s) are credited and that the original publication in this journal is cited, in accordance with accepted academic practice. No use, distribution or reproduction is permitted which does not comply with these terms.
*Correspondence: Jinghong Xue, eGpoMDQ1OUAxMjYuY29t; Chenxu Bai, MjI3NjgwNDAzM0BxcS5jb20=
Disclaimer: All claims expressed in this article are solely those of the authors and do not necessarily represent those of their affiliated organizations, or those of the publisher, the editors and the reviewers. Any product that may be evaluated in this article or claim that may be made by its manufacturer is not guaranteed or endorsed by the publisher.
Research integrity at Frontiers
Learn more about the work of our research integrity team to safeguard the quality of each article we publish.