
95% of researchers rate our articles as excellent or good
Learn more about the work of our research integrity team to safeguard the quality of each article we publish.
Find out more
ORIGINAL RESEARCH article
Front. Mater. , 15 June 2023
Sec. Structural Materials
Volume 10 - 2023 | https://doi.org/10.3389/fmats.2023.1212177
This paper discusses the design of hybrid alkali-activated binders at ambient temperature, specifically the development of mixes based on ground granulated blast-furnace slag (GGBFS) with calcium aluminate cement (CAC) as an additive, aiming to obtain high early strength binders with optimised Al incorporation, increased crosslinking and degree of polymerisation. The effects of 10 wt% CAC replacement of GGBFS, activated with sodium silicate with varying modulus (SiO2/Na2O molar ratio) or with sodium hydroxide, on fresh and hardened properties are investigated. The inclusion of CAC in GGBFS mixtures activated using sodium silicate results in an unexpected retardation of the polycondensation reactions required to form the main calcium aluminosilicate hydrate gel phase. This is due to incomplete dissolution of the GGBFS precursor, inhibited by the rapid formation of additional reaction products (especially cubic aluminate hydrates, C3AH6) resulting in lowered reaction kinetics, and thus delayed setting and hardening times. For sodium silicate activators, this retarding effect appears to be only slightly dependent on the activator solution modulus. When activating with 4 M NaOH, the retarding effect is reduced, along with the incorporation of CAC in the C-A-S-H gel, increasing the amount of reactive aluminium present in the binder to form a more compact gel product. Increasing the molarity of NaOH solutions results in a similar delay in reaction kinetics. The results suggest the existence of only a limited pH range in which the addition of CAC can promote the formation of a binding gel with enhanced mechanical properties, whilst other factors including the effect of sodium silicate inclusion in CAC systems are still unclear. The typical hydration products of CAC were not detected in this study.
Alkali-activated cements may offer many advantages over conventional cements, mainly replacing the need for clinkerisation and opening up the possibility of valorising various waste materials. Alkali-activation technology is based on the reaction between aluminosilicate precursors and an alkaline activator solution, commonly sodium hydroxide and/or sodium silicate, to generate a binder (Provis et al., 2015). The function of the activator is to introduce the driving force required for the dissolution of the Si, Al, and any Ca contained within the solid precursor, and to promote their subsequent polycondensation through the alkaline liquid medium (Provis and Bernal, 2014). The reaction products obtained from the polycondensation are hardened binders, known as C-A-S-H and N-A-S-H type gels (Garcia-Lodeiro et al., 2015; Walkley et al., 2016), in which aluminium tetrahedra become bound between silicon tetrahedra, playing a fundamental role in the initial stages of gel formation by increasing the crosslinking of the binding phase (Fernández-Jiménez et al., 2006; Myers et al., 2015). The presence of reactive aluminium in precursor materials is a requirement to obtain a well-behaving and water-insoluble alkali-activated binder, driving further investigation into a wide range of reactive aluminium sources (Fernández-Jiménez et al., 2006; Myers et al., 2015). The need for certain proportions of reactive silica and alumina, essential in designing binders with optimised properties (Khale and Chaudhary, 2007; Abdelrahman and Garg, 2022), is why calcium aluminate cement (CAC) appears to offer potential as a reactive aluminium rich component for improving alkali-activated formulations by enhancing the reactivity of the mixtures.
CACs are hydraulic materials containing high amounts of alumina, usually between 40 wt% and 85 wt% (Ideker, 2019). CACs are known for their rapid strength development (up to 90% of final strength in 24 h), thermal resistance, and resistance to chemical attack, making them desirable for specialist concrete applications such as refractory materials. CAC manufacture involves fusing or sintering a measured mixture of limestone and bauxite, and accounts for lower CO2 emissions with respect to Portland cement production, but is considerably more expensive (Ding et al., 2021). CAC has been studied extensively as a cement in its own right, with known hydration products that exhibit rapid setting times and exceptionally early strength development (Juenger et al., 2011). Monocalcium aluminate (CaOAl2O3, or CA in cement shorthand notation) is the main phase of CAC which quickly reacts with water at ambient temperatures to form metastable hexagonal calcium aluminate hydrates (CAH10 and CA2H8). These phases are associated with initial strength development but their chemical stability is strongly dependent on temperature, time, and the water/cement ratio. The main limitation on the use of CAC in structural construction applications is due to a process known as conversion, whereby the metastable hexagonal aluminate hydrates convert to stable cubic aluminate hydrate (C3AH6) accompanied by the formation of AH3 gel and the expulsion of water. This consequently results in a volume change that increases the porosity of the binder and causes a dramatic loss of strength (Bushnell-Watson and Sharp, 1990; Ideker, 2019).
The addition of reactive silica in various forms, such as fly ash (López et al., 2008; Mostafa et al., 2012), GGBFS (Yang et al., 2019), micro-silica (Ding et al., 1995), and sodium silicate (Ding et al., 1996), can lead to the formation of strätlingite (C2ASH8), reducing or inhibiting the formation of cubic aluminate hydrate. Strätlingite is a stable crystalline compound which is recognised to give better mechanical properties than cubic aluminate hydrate (Midgley and Bhaskara Rao, 1978).
The behaviour of CAC in moderately and highly alkaline environments has been investigated in some studies (Pastor et al., 2009; Fernández-Jiménez et al., 2011), as has its effect on the alkali-activation of precursors including GGBFS (Arbi et al., 2013), metakaolin (Fernández-Jiménez et al., 2008), natural pozzolans (Carrasco et al., 2007; Vafaei and Allahverdi, 2016), red clay brick wastes (Reig et al., 2016), and fly ash (Cao et al., 2018), for the formation of hybrid binders. Most of these studies did not observe the typical hydration products of CAC (CAH10, C2AH8, and AH3); highly alkaline conditions and high temperatures favour instead the formation of cubic aluminate hydrate from the outset, and if sources of silica are present, katoite type phases are preferentially formed over strätlingite, which is not favoured in highly alkaline environments.
Hybrid cements have been shown to enhance binding systems (Palomo et al., 2019), especially providing improved early age properties (Garcia-Lodeiro et al., 2013). Portland cement (Alahrache et al., 2016), portlandite (Ca(OH)2), and CaO can be successfully used as additives in alkali-activation to improve binder properties, including compressive and flexural strength and early age behaviour, whilst allowing a reduction of the liquid activator concentration as their dissolution increases the pH of the system (García-Lodeiro et al., 2013; Bocullo, 2017).
For all these reasons, the focus of the present work is on the development of hybrid systems based on GGBFS and CAC, using sodium silicate activating solutions with varying SiO2/Na2O molar ratio, and NaOH as activating solutions. The mechanical properties of the binders are tested with respect to criteria including setting time, workability, and compressive strength, along with microstructural analysis carried out using XRD, FTIR, and SEM-EDS. The results are used to formulate a hypothesis on the underlying reaction mechanisms occurring during the alkali-activation of these blended systems and to evaluate the contribution of CAC as source of additional reactive aluminium during alkali-activation.
Commercial CAC, Secar 51 (containing 51 wt% alumina) from Imerys (France) and GGBFS from Ecocem (Belgium) were utilised in this work. The physical properties including measured densities and d90, d50, and d10 values for the precursor materials are shown in Table 1, and the particle distribution curves are illustrated in Figure 1. The densities were measured using a Micromeritics AccuPyc II 1340 pycnometer and the particle size distributions using a Malvern Mastersizer 3000 instrument.
The chemical compositions of both CAC and GGBFS, represented as wt% of oxides, determined from X-ray fluorescence are presented in Table 2.
The X-ray diffraction (XRD) patterns of the raw materials are illustrated in Figure 2. The GGBFS pattern contains no distinct crystalline features and is determined to be predominantly amorphous, exhibiting a very broad peak centred at ∼ 29° 2θ. The crystalline phases identified in CAC are monocalcium aluminate (CaOAl2O3 or CA, PDF#04-013-0779), gehlenite (2CaOAl2O3·SiO2 or C2AS, PDF#01-073-2041), and monocalcium dialuminate (CaO·2Al2O3 or CA2, PDF#00-007-0082).
Alkali-activated pastes were prepared by mixing GGBFS with 10 wt% CAC. The activator solution was prepared by mixing NaOH pellets (99% purity) with water, and subsequently adding sodium silicate solution (supplied by PQ corporation with a starting modulus of 2.07 and concentration of 44.1%) on cooling of the aqueous NaOH solution. Two activator concentrations were formulated by varying the modulus (molar ratio of SiO2/Na2O) from 0.56 to 0.91 and the alkali dose from 4 to 4.7 (expressed as Na2O wt% relative to the precursors, GGBFS and CAC) for activator “a” and activator “b”, respectively. Solutions of NaOH were also prepared with a target concentration of 4 M (activator “c”). Table 3 shows the mix proportions and the respective sample nomenclature used henceforth. The water-to-binder ratio of 0.38 was maintained the same for all mixes.
The reaction kinetics of pastes were investigated using an isothermal calorimeter TAM Air (TA Instruments, United States) collecting measurements at 20°C. 10 g of solid precursors were weighed and dry blended into a glass ampoule and the alkaline solution was added with a pipette. A spatula was used to rapidly mix the materials together for about 30 s and then the ampoule was sealed and immediately transferred into the calorimeter along with a reference, which was measured following the procedure described by Wadsö, (2010). The duration of measurement spanned 2 weeks. All values of heat release rate were normalised according to the total weight of solid binder.
The Vicat method was used to measure the initial and final setting time of the fresh pastes, following the procedure described in EN 196-3 (British Standards Institution, 2016). The initial setting time is determined as the elapsed time measured from the time of mixing to the moment when the distance between the needle and the base plate is (6 ± 3) mm. The final setting time is recorded as the elapsed time measured from the time of mixing to the time at which the needle first reaches only 0.5 mm into the specimen. The Vicat mould is made from stiff foam in the shape of a conical frustum having an internal diameter of 60 ± 0.5 mm at the top, 70 ± 0.5 mm at the bottom and height 40 ± 0.5 mm.
The workability of the pastes is evaluated by the mini-slump test. The test is carried out in a poly (tetrafluoroethene) cone with scaled-down Abrams geometry: 19 mm top diameter, 38 mm bottom diameter, 57 mm height. The cone is positioned on a flat sheet of poly (methyl methacrylate) marked with grid squares of 20 × 20 mm. The fresh mixed samples were poured into the cone, with the paste free to flow by lifting the cone as slowly as possible at a rate of less than 1 cm/s (Tan et al., 2017). Two sets of diameters, perpendicular to each other, were determined and the mean value was recorded as the mini-slump flow. Mini slump tests were carried out after 10 and 30 min from the start of mixing, to investigate the slump loss over time.
XRD analysis was performed using a PANalytical X’Pert3 (PANalytical, United States) diffractometer operating in Bragg-Brentano geometry with a Cu Kα radiation source at 45 kV and 40 mA, fitted with a PIXcel-Medipix3 detector. Samples are analysed between the 2θ range of 5°–60°, using a step size of 0.02°. Phase identification is carried out using ICDD PDF-4+ (ICDD, United States) and HighScore plus (Malvern Panalytical, United Kingdom).
Fourier-transform infrared (FTIR) analysis is carried out using a PerkinElmer Frontier FTIR spectrometer (PerkinElmer, United States); 2 mg of sample are mixed and ground together with 200 mg of KBr. The mixed powder is transferred to a 13 mm pellet die and pressed up to 10 tonnes to a form a transparent pellet which is subsequently tested in the spectrometer. FTIR spectra are collected between 4,000 and 400 cm−1, with a resolution of 0.25 cm−1 and scanned 32 times.
Solid state single pulse 27Al and 29Si magic angle spinning (MAS) NMR spectra were acquired on a Bruker Avance III HD 500 spectrometer at 11.7 T (B0) using a 4.0 mm dual resonance CP/MAS probe, yielding a Larmor frequency of 130.32 MHz for 27Al and 99.35 MHz for 29Si. 27Al MAS NMR spectra for qualitative interpretation were collected using 1.7 μs nonselective (π/2) excitation pulse, a spinning speed of 12.5 kHz, 5 s relaxation delay, and a total of 512 scans. 29Si MAS NMR spectra were acquired using a 5.5 μs nonselective (π/2) excitation pulse, a spinning speed of 12.5 kHz, 60 s relaxation delay, on a total of 256 scans. Gaussian curves were used to deconvolute the 29Si MAS NMR spectra. Spectra were simulated using the minimum number of Gaussian functions required to give a satisfactory fit, with each Gaussian function attributed to a connectivity state of Si as described in previous studies (Richardson et al., 1993; Myers et al., 2013; Walkley and Provis, 2019). Peaks were constrained so as to not exceed 10 ppm full width at half max (FWHM). This type of deconvolution of 29Si MAS NMR spectra has proven to be suitable for quantification of extent of reaction of alkali-activated materials (Le Saoût et al., 2011). The chemical shifts are compared to an external standard of 1.0 M Al(NO3)3 for all 27Al spectra and to pure tetramethylsilane (TMS) for 29Si spectra All analysis has been performed using Bruker Top Spin 4.0.
Scanning electron microscopy (SEM) was conducted using Hitachi TM3030 instrument coupled with the EDS (Energy-dispersive X-ray spectroscopy) software Bruker QUANTAX 70. Hardened paste fragments were mounted in epoxy resin, left to cure overnight, and demoulded ready for polishing. Samples were polished using SiC paper in ascending grits, and carbon coated prior to SEM analysis.
Compressive strength tests were carried out using a Shimadzu 300 kN compression testing machine applying 1200 N/s. The specimens tested were prepared according to the relevant sections of the ASTM C109 (ASTM Standard, 2020) standard adapted for application to alkali-activated materials, consisting of 50 mm cubes, demoulded after 1 day, and then sealed and cured in an environmental chamber at 20°C ± 1°C and relative humidity of 45% ± 1% until the specified testing ages (7 and 28 days). Each strength value for individual mixes was calculated from the average of three specimens.
The heat flow profiles of the alkali-activated and hybrid samples are shown in Figure 3A. An initial exothermic peak, designated as the pre-induction peak, appears immediately for all samples representing the wetting and dissolution of precursor materials. When GGBFS is activated with a sodium silicate solution of modulus of 0.56 (0C-a) the dissolution peak is followed by a dormant period which ends after ∼8 h with the beginning of the acceleration period. In contrast, GGBFS activated with 4M NaOH (0C-c) exhibits a very short dormant period with a subsequent acceleration period commencing after 1.5 h. The dormant period dependence on the activator solution is consistent with previous studies (Haha et al., 2011; Zuo and Ye, 2020). The large second exothermic peak is centred at ∼15 and ∼7 h for 0C-a and 0C-c, respectively, with the acceleration/deceleration stages concluded within the initial 24 h for both mixtures. This exotherm is associated with the precipitation, nucleation, and growth of reaction products, such as C-A-S-H type gels during polycondensation (Brough and Atkinson, 2002).
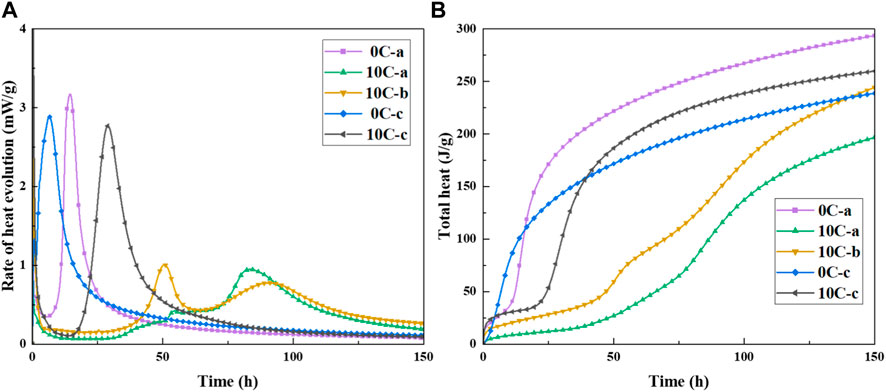
FIGURE 3. (A) Heat evolution and (B) cumulative heat of alkali-activated and hybrid samples at 20°C.
Hybrid samples activated with sodium silicate and sodium hydroxide, 10C-a and 10C-b, exhibit a markedly different response. Regardless of the activator dosage, the dormant period is prolonged up to ∼40 h. The 10C-a sample shows several overlapping heat evolution peaks between 35-50 h, resolving into a small narrow peak at ∼55 h. The appearance of these secondary exothermic peaks may indicate initial gel formation, i.e., progression of the polycondensation reaction. The subsequent induction-like period spans from 55 to 70 h, after which a visibly suppressed second exothermic peak is apparent with a maximum at ∼85 h. The induction period in the 10C-b sample also exceeds 35 h, followed by two more distinct exothermic peaks: a sharp narrow peak at ∼50 h and a broader peak at ∼ 80 h. As seen in the case of 10C-a, the slope of the last peak diminishes after 150 h. The exact designation of individual heat evolution peaks to describe the progress of several concurrent and competing reactions sequences in this multi-component system is difficult, however, it is clear from the data that both the 10C-a and 10C-b systems with the addition of CAC experience a serious retarding effect on the formation kinetics associated with polycondensation, similarly to what is observed for alkali-activated CAC (Pastor et al., 2009).
The 10C-c system also exhibits a prolonged dormant period compared with 0C-c. Only after ∼17 h does the acceleration stage begin and reaction products such as primary C-A-S-H gels form. The acceleration/deceleration period is seen to conclude within 50 h. Figure 3B shows the cumulative heat profiles of all samples, confirming the appearance of two distinct trends, with 10C-a and 10C-b showing a strong delay in the initial heat evolution, whilst 0C-a, 0C-c, and 10C-c present conventional heat profiles.
Table 4 presents mini-slump and setting time test results for all samples. The water/binder mass ratio used in the formulation of the binders was kept constant in order to compare the effects of individual binder components on workability. The addition of CAC results in a decrease in slump flow even though the CAC used in this work has a slightly larger particle size than the GGBFS (see Table 1), and literature on the effect of CAC additions on paste flow reports CAC particles having a low tendency to form agglomerates, and thus high mobility in aqueous solutions (Vafaei and Allahverdi, 2016). The reason behind the reduction in slump flow is due to the high early reactivity of CAC and the prompt formation of aluminate hydrates from the onset of reaction in the alkaline environment. Workability is found to be dependent on the nature of the activator solution, as clearly seen from the comparison between NaOH-activated and sodium silicate-activated pastes (Dai et al., 2022). The activator type is a significant factor affecting workability; in particular, the presence of dissolved silicates results in a direct increase in flow by acting as a plasticiser for alkali-activated mixtures (Collins and Sanjayan, 1999). The activator modulus and alkali content can be seen to reduce fresh-state flow, when comparing 10C-a and 10C-b.
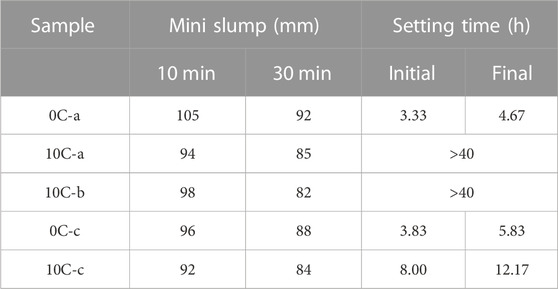
TABLE 4. Mini-slump tests after 10 and 30 min and initial and final setting time results for alkali-activated and hybrid mixtures.
Sample 0C-a starts to set after 3.33 h and reaches final setting after 4.67 h. These results show that the common issue of quick setting of alkali-activated cement has been avoided, giving setting times similar to those of traditional PC binders, confirming the suitability of the activator selected for the control mix 0C-a (Sasaki et al., 2019; Hertwig and Holschemacher, 2021). The second control formulation, 0C-c, prepared with 4M NaOH has a slightly longer setting time, albeit still less than 6 h to final setting.
Addition of CAC results in a delay in setting times in all cases. Setting times over 40 h were recorded for solutions “a” and “b”, made with sodium silicate solutions with different modulus, used in conjunction with CAC. When 4M NaOH is used as activator, type “c”, the setting times are still prolonged compared to 0C-c, however set within a reasonable timeframe (<13 h). These results are consistent with kinetics curves seen in Figure 3. The extent aluminate hydrate formation, which causes a reduction in flow, is not significant enough to trigger the setting process. This may be due to the low mass fraction of CAC in the mixes, which limits the extent of early hydrate formation.
Overall, CAC additions significantly compromise the fresh properties of hybrid binders, leading to decreased workability and delayed setting time of resulting binders.
Figure 4A shows the XRD diffraction patterns for control specimens 0C-a after 1, 2, 7, and 28 days. The pattern shows distinct broad humps at ∼7°, ∼29°, and ∼35° 2θ indicative of amorphous C-A-S-H gel formation (Tajuelo Rodriguez et al., 2017). Minor peaks are due to the formation of a hydrotalcite-group phase (HT, approximately Mg4Al2(CO3) (OH)12 3H2O, PDF#01-089-0460) which is has been observed extensively in alkali-activated slag systems (Wang and Scrivener, 1995; Myers et al., 2017; Walkley et al., 2017). The formation of crystalline hydrotalcite involves the dissolution of the Mg2+ component present within the GGBFS, and can result in enhanced properties of the binder, such as resistance to carbonation and chloride ingress (Kayali et al., 2012; Bernal et al., 2014). Calcite (CaCO3, PDF# 01-086-0174) is formed as the main carbonation product, appearing as a sharp peak overlaid on the broad hump at ∼29° 2θ. The phase evolution between 1 day and 28 days is minimal. The humps attributed to C-A-S-H are noted to become narrower over time as a result of increased short range order and improved gel development.
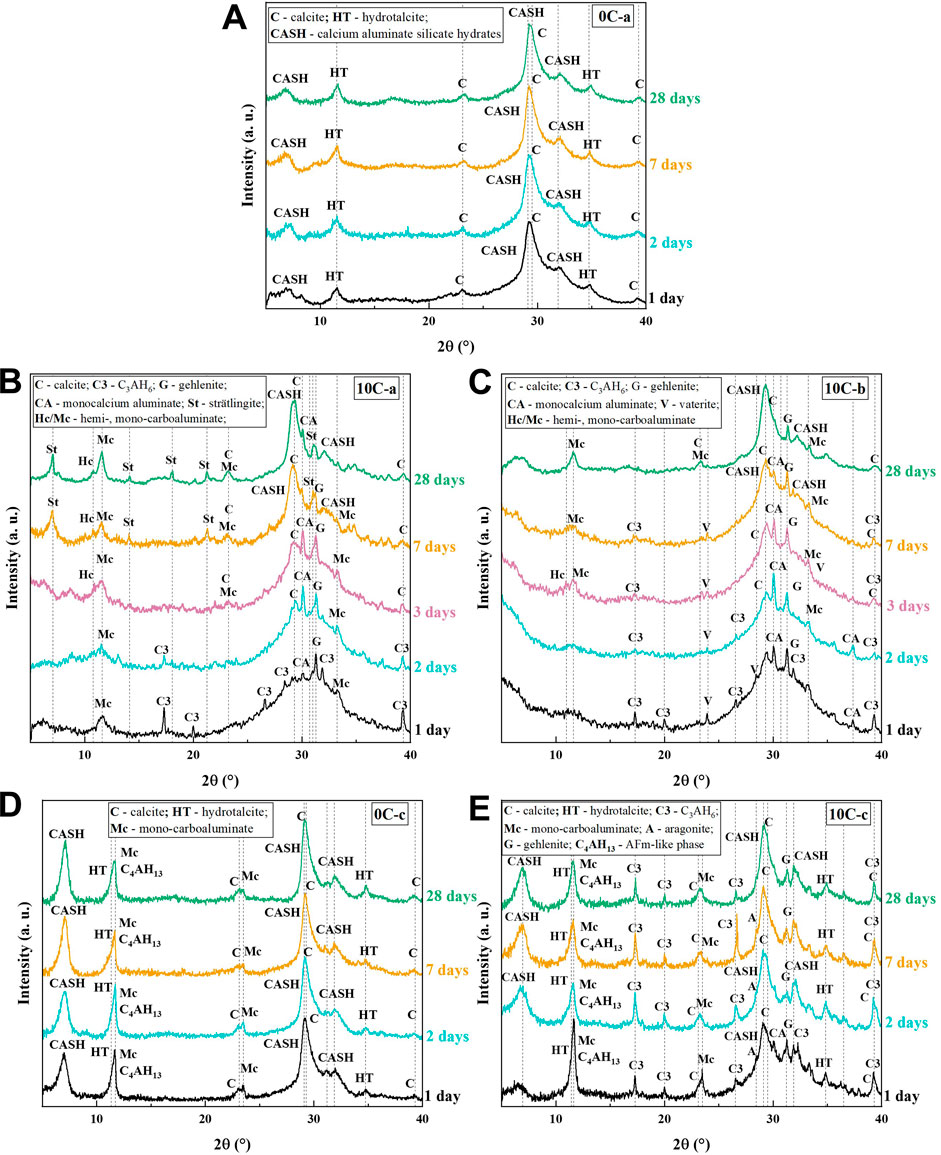
FIGURE 4. XRD patterns of alkali-activated and hybrid samples from 1 to 28 days of curing. (A) 0C-a, (B) 10C-a, (C) 10C-b, (D) 0C-c, and (E) 10C-c.
The XRD patterns of 10C-a are presented in Figure 4B. After 1 day, the peaks at ∼30° and ∼32° 2θ are identified as unreacted CAC phases: calcium monoaluminate (CA), as well as gehlenite (G) which is generally characterised by low reactivity and expected to be stable within the system at ambient temperature during the first stages of reaction (Puerta-Falla et al., 2016). Both CA and G are the major constituents of CAC (Ideker, 2019). Further peaks are referenced to calcium monocarboaluminate (Mc, C4A
The quick precipitation of reaction products (including C3AH6) on the surface of GGBFS grains might be the barrier that affects the dissolution and diffusion of the ions into solution for polycondensation reaction (Sun and Vollpracht, 2018) causing a delay in C-A-S-H formation, extended duration of the dormant period in the calorimetry data (Figure 3A) and retarded setting times (Table 4). Calcite is formed as carbonation product after 2 days, whilst the intensity of C3AH6 is progressively reduced during the following days of curing until it becomes undetectable after 7 days. Early C-A-S-H formation is slow to occur due to the inhibited dissolution of GGBFS. Increased C-A-S-H formation after 7 days is accompanied by the appearance of strätlingite (C2ASH8, PDF# 01-085-8414). Strätlingite crystals are hexagonal AFm-structured plates incorporating Si, and therefore can form at relatively early ages if there exists a sufficient source of soluble silica promoted by sodium salts in a moderately alkaline environment (Ding et al., 1995). Strätlingite formation is also reported to be favoured when high contents of aluminium are present (Lothenbach and Gruskovnjak, 2007; Myers and Lothenbach, 2015), and it is possible that the Al provided by the redissolution of the C3AH6 is contributing to this process. The stability and coexistence of strätlingite with C-A-S-H can be confirmed after 28 days (Kwan et al., 1995; Okoronkwo and Glasser, 2016).
The XRD patterns of 10C-b in Figure 4C include the formation of vaterite (CaCO3 PDF# 01-072-0506) along with C3AH6, while Mc formation is not clearly defined until 28 days (Figure 4C). C3AH6 is present in the XRD data until 7 days as C-A-S-H forms slowly, similar to the 10C-a sample, and no peaks referenced to strätlingite are present. The lack of strätlingite is explained by its unfavourable formation at very high pH, in agreement with previous studies (Fernández-Jiménez et al., 2011) whereby strätlingite did not form from CAC in highly alkaline environments. It is hypothesised that as strätlingite requires a readily available source of soluble silica to form, there is insufficient dissolution of silica in the 10C-a sample after 2 days to allow for significant formation of this phase to be detected. All three samples containing CAC show a defined C-A-S-H peak at ∼29° 2θ that narrows over time, indicating an increase in short range ordering due to a higher degree of polymerisation of the gel phase (Maddalena et al., 2019).
The XRD pattern of 0C-c in Figure 4D contains peaks indexed to hydrotalcite, calcite, C-S-H, and also tetracalcium aluminate hydrate (C4AH13) as secondary AFm phase with major peaks overlapping hydrotalcite peaks. The formation of AFm-like secondary products alongside HT has been identified in NaOH-activated GGBFS (Bonk et al., 2003; Escalante-García et al., 2003; Gong and White, 2016; Gijbels et al., 2020). The evolution of phases with time is very limited, similar to the 0C-a control sample, meaning that the primary phase assemblage and structures formed since the initial stages of reaction remain stable.
Figure 4E shows the XRD patterns for 10C-c. Similar to the 0C-c samples, formation of hydrotalcite, calcite, C-S-H, and a secondary AFm phase is noted. Unreacted CA inclusions are observed from a secondary peak at ∼30° 2θ (which disappears after 1 day) and unreacted gehlenite which remains stable throughout alkali-activation. The identified aragonite peak (CaCO3, PDF# 00-041-1475) at ∼28° represents a secondary carbonation product along with calcite. C3AH6 is formed from the onset of reaction, as seen for 10C-a and 10C-b, however remains stable even after 28 days. It is noted that C-A-S-H forms initially, unlike for samples activated with sodium silicate, consistent with the calorimetry data as discussed above which show much less severe inhibition of the dissolution of GGBFS by CAC addition in systems activated by NaOH.
Figure 5 shows the FTIR results obtained for alkali-activated and hybrid samples after 2 and 28 days. The band at 1650 cm−1 is due to H-OH bond bending, indicative of weakly bonded water molecules trapped on the surface or in pores within the samples (Uchino et al., 1991; Heah et al., 2012). The bands at ∼1490–1410 cm−1 are related to O-CO bond stretching and corresponding asymmetric bending at ∼900–820 cm−1 (Trezza and Lavat, 2001; Lee and van Deventer, 2002; Reig et al., 2002; Hidalgo et al., 2009). All samples show modes relating to carbonation products. The major absorption band between 1200–900 cm−1 is associated with asymmetric Si-O-T (T: tetrahedral Si or Al) bond stretching and is significant in understanding the formation of reaction products (García-Lodeiro et al., 2008; Vafaei and Allahverdi, 2016). It is noted for all binders that after alkali-activation, the Si-O-T band shifts to lower wavenumbers and sharpens. The band is the combination of Si-O-Si asymmetric stretching vibrations with varying Al substitution, resulting in a change in bond stretching contributions. The remaining symmetric Si-O-T bond stretching ∼700 cm−1 and Si-O-T bond bending ∼520–420 cm−1 bands are also considered to include contributions from substituted Al.
In general, the major absorption band ∼950 cm−1 in alkali-activated specimens becomes more narrow and tends to shift to lower wavenumbers after 28 days compared with 2 days (Walkley et al., 2016). This is reported in the literature to be due to increased incorporation of Al, and the subsequent contribution from Al-O-Si linkages, within which the Al-O bonds are weaker than Si-O (Król et al., 2018). The integrated intensity of the band is also noted to shift to lower wavenumbers due to Al perturbations in local Si-O bonding (Allahverdi and Skvara, 2001). This is reflected in both 10C-a and 10C-b samples, where the major bands shift from 976 to 984 cm−1 (respectively) to 954 and 957 cm−1 after 28 days, and the shape of the band markedly changes from broad to sharp. The contribution of Si-O symmetric stretching vibrations appears to be larger for samples 0C-c and 10C-c activated with NaOH. Due to the contributions of LDH phases these samples show three distinct bands in the range ∼510–420 cm−1, which are attributed to the Al-O bonds of HT, C-A-S-H, and C4AH13 (Horgnies et al., 2013; Gijbels et al., 2020). The bands at ∼ 896 and ∼590 cm-1 for samples with CAC addition can be attributed to hydrogarnet C3AH6. (Horgnies et al., 2013).
29Si MAS NMR spectra, deconvolutions, and simulated spectra for the 2 and 28 days cured samples activated with sodium silicate and NaOH are shown in Figure 7 and Figure 8, respectively. The raw GGBFS spectrum is simulated with one peak centred at isotropic chemical shift, δiso, = −75 ppm (Figure 6A) and is linearly scaled and included in the simulation of the data for all alkali-activated samples to account for remnant unreacted GGBFS, with the assumption that this lineshape does not change throughout the reaction. The simulated spectrum for GGBFS in this work is consistent with previous studies (Tänzer et al., 2014). Any Si content within CAC is related to the presence of gehlenite, as seen in the XRD data of the precursors (Figure 2). The deconvoluted spectrum in Figure 6B shows Q0 and Q1 sites (δiso = −68, −71, −74, and −78 ppm) as the main Si environments (Stebbins and Xue, 2014; Allu et al., 2017).
Table 5 gives the deconvolution data for all 29Si MAS NMR spectra and quantification of Qn environments identified in all samples after 2 and 28 days of curing.
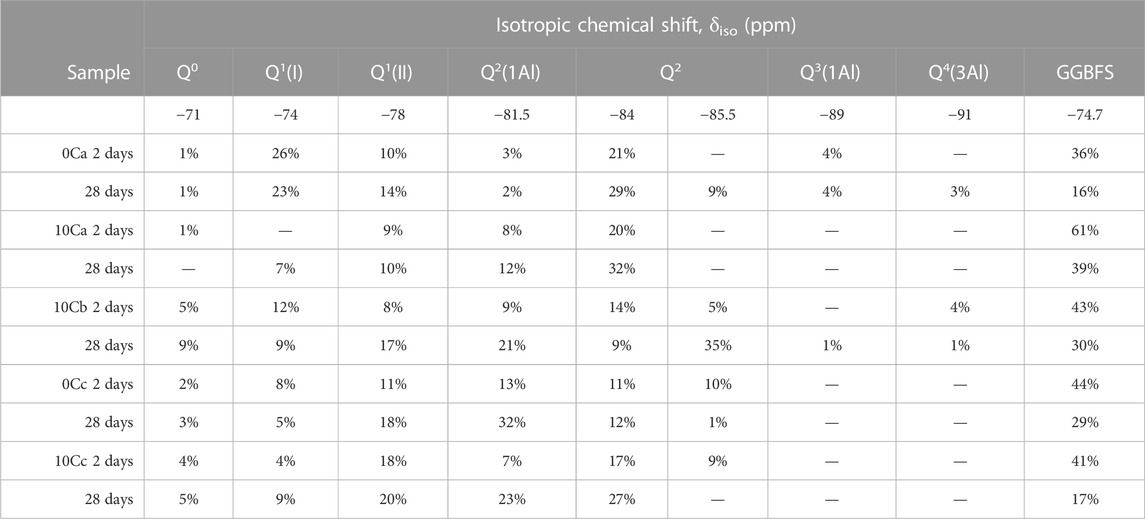
TABLE 5. Quantification of Qn environments identified in29Si MAS NMR spectra of alkali-activated and hybrid samples after 2 and 28 days. Estimated uncertainty in site percentages is ±1%.
Resonances at δiso = −68 and −71 ppm are attributed to Q0 and Q1 units of unreacted GGBFS and CAC (Figure 6). Both precursors have terminal and isolated Si groups present (Florian et al., 2012). The fraction of GGBFS is reduced with increasing curing times as can be seen from the comparison between the 2-day samples (Figures 7A, C, E, 8A, C) with the 28-day samples (Figures 7B, D, F, 8B, D). Signals at δiso = −74 and −78 ppm are attributed to the presence of two different types of Q1 sites in C-S-H or C-A-S-H type gels, which are the main reaction products in all the investigated systems. The assignment of Q1 sites in C-A-S-H gel is challenging as each individual unit may be bonded to Si or Al and have Ca2+, Na+, or H+ as balancing cations in various ratios that when combined cause variation in Si chemical shifts. Q1 is simulated with two peaks in the region between −70 and −80 ppm which are named Q1(I) and Q1(II) without assigning a specific chemical environment to each one, as a consequence of the complexity of such interactions (Bernal et al., 2013).
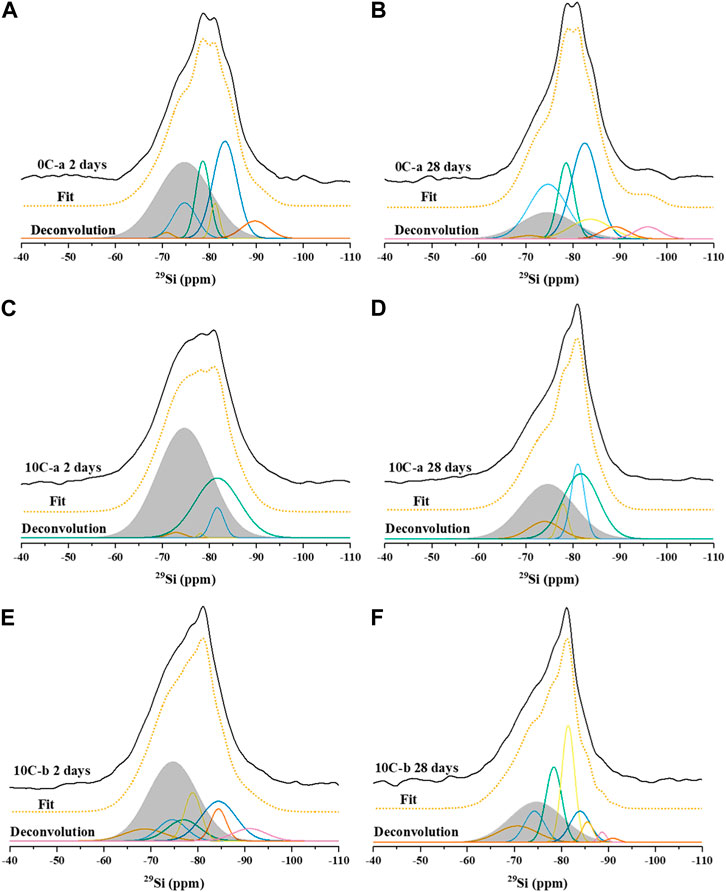
FIGURE 7. 29Si MAS NMR spectra with fit and deconvolution, of: (A) 0C-a 2 days, (B) 0C-a 28 days, (C) 10C-a 2 days, (D) 10C-a 28 days (E) 10C-b 2 days, and (F) 10C-b 28 days.
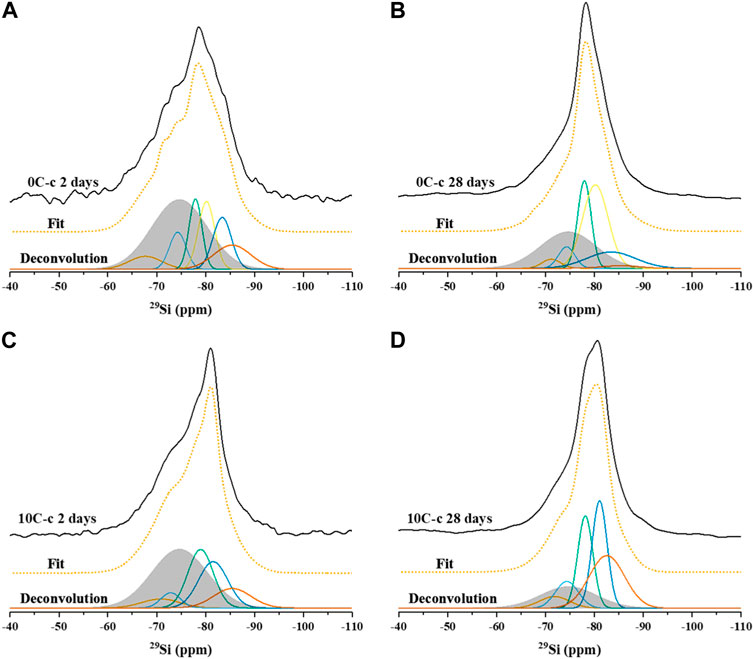
FIGURE 8. 29Si MAS NMR spectra with fit and deconvolution of samples activated with 4M NaOH: (A) 0C-c 2 days, (B) 0C-c 28 days, (C) 10C-c 2 days, and (D) 10C-c 28 days.
Network modifying cations can also affect the chemical environment of Qn (mAl) species, increasing the chemical shift, especially for strongly polarising cations such as calcium (Pena et al., 2008), resulting in additional overlap of the individual Qn (mAl) environments. The presence of distorted Al tetrahedra, Al(V), and Al(VI) species in octahedral configurations further complicates peak assignment in the 29Si MAS NMR spectra.
Resonances at δiso = −81.5, −84, and −85.5 ppm are attributed to Q2(1Al) and Q2 units indicating the formation of an Al-substituted C-S-H (C-A-S-H) gel with a tobermorite-type structure. These resonances are found in all samples (Figures 7A–F, 8A–D). The signals at δiso = −89 and −93 ppm are attributed to highly cross-linked Q3(1Al) and Q4(3Al) environments which overlap within the spectra (Myers et al., 2013). These are found in the control sample 0C-a activated with sodium silicate (Figure 7B), whilst not detected in the 0C-c sample activated using NaOH (Figure 8B). This formation of greater cross-linked C-A-S-H type gels when using sodium silicate has been observed in previous studies (Puertas et al., 2011).
The 27Al MAS NMR spectra for both precursors and alkali-activated materials are shown in Figure 9. The GGBFS spectrum exhibits one broad resonance spanning between δobs = 80 and 40 ppm, centred at δobs = ∼63 ppm, and which is assigned to a distribution of tetrahedral Al environments (AlT). There is not a single well-defined Al environment distinguishable within the spectrum due to the amorphous structure of the GGBFS precursor (Bernal et al., 2013; Walkley et al., 2016) (Figure 9C). The main characteristic of the CAC spectrum is an intense broad signal with centre at δobs = 81 ppm, attributed to the presence of AlT (Cong and Kirkpatrick, 1993; Pena et al., 2008; Hughes et al., 2019). The asymmetry of this peak is due to the convolution of signals assigned to two different CaAl2O4 components (Pena et al., 2008; Hughes et al., 2019). A minor signal between δobs = 10 and 13 ppm is associated with the presence of octahedral aluminium (AlO) in CAH10, that may appear as a consequence of material weathering (Arbi et al., 2013).
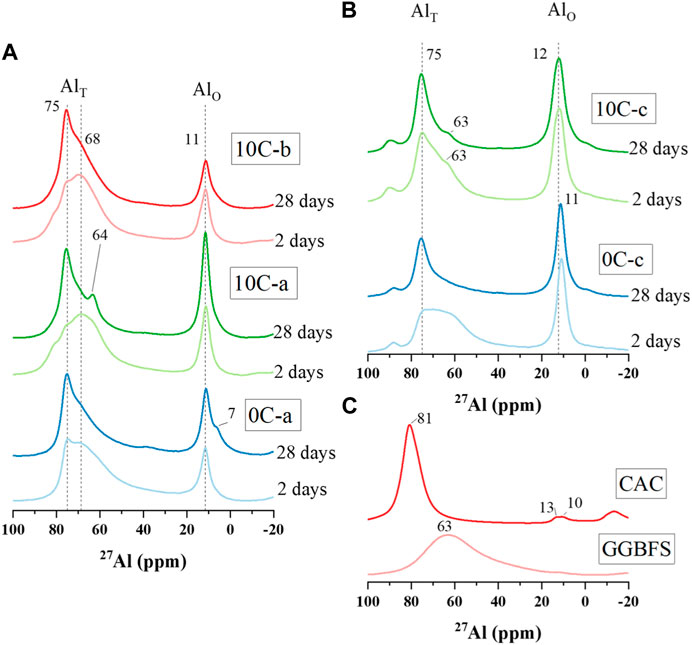
FIGURE 9. 27Al MAS NMR spectra for (A) alkali-activated and hybrid specimens activated with activator mixtures a and b after 2 and 28 days, (B) alkali-activated and hybrid specimens activated with 4M NaOH after 2 and 28 days, and (C) precursor materials GGBFS and CAC.
The 27Al NMR spectra for 2-day samples in Figure 9A show a similar broad signal spanning from δobs = 80 to 50 ppm assigned to Al in a slightly distorted tetrahedral environment. The sharp peak that appears at δobs = ∼75 ppm in the 0C-a 2-day spectrum is not present in either the 10C-a or 10C-b 2-day spectra. This peak is attributed to Al in a well-defined AlT coordination and incorporated in bridging tetrahedra, in which AlT sites are bonded to Q2(1Al) sites (q2(2Si)) (Richardson et al., 1993; Sun et al., 2006). This resonance becomes more intense and narrower for all samples with increasing curing time, particularly in the 10C-b 28-day spectrum, typical of a well-structured C-A-S-H type gel.
The resonance at δobs = 64 ppm in the 10C-a 28-day spectrum is attributed to strätlingite formation which is identified from the XRD data (Figure 4B). The narrow resonance at δobs = ∼11 ppm present in all sample spectra is assigned to AlO, found in AFm-like phases. The intensity of this band for the 10C-a 28-day sample is greater than the other samples due to the convolution of responses from both phases and strätlingite (Kwan et al., 1995; Dai et al., 2014). This resonance is also attributed to C3AH6, which is initially present in both 10C-a and 10C-b samples. The shoulder band at δobs = ∼7 ppm in the 0Ca 28-day spectrum may indicate the presence of hydrotalcite-like phase as major AFm phase as identified in the XRD data in Figure 4A (Andersen et al., 2003; Bonk et al., 2003).
The 27Al NMR spectra for the mixtures activated with NaOH solution, 0C-c and 10C-c, (Figure 9B) exhibit two signals related to AlT and AlO environments. For both samples, intense peaks are found at δobs = 11 and 12 ppm. Hydrotalcite, AFm-like phases, and katoite-type phases as C3AH6 (for 10C-c) are associated with this peak, identified from XRD data in Figures 4D, E. The AlT signal in the 0C-c spectrum evolves with increasing curing time, becoming sharper and narrower, with the main resonance found at δobs = ∼75 ppm attributed to q2(2Si) environment. The shoulder identified in the 10C-c spectrum at ∼63 ppm can be attributed to q3(3Si) due to additional Al incorporation into the gel (Wang and Scrivener, 2003; Arbi et al., 2013; Walkley and Provis, 2019). This may be attributed to formation of strätlingite as seen for 10C-a 28-day, however strätlingite is not identified from the XRD data of these samples.
Figure 10 shows backscattered electron (BSE) images of all alkali-activated and hybrid samples after 2 and 28 days of curing.
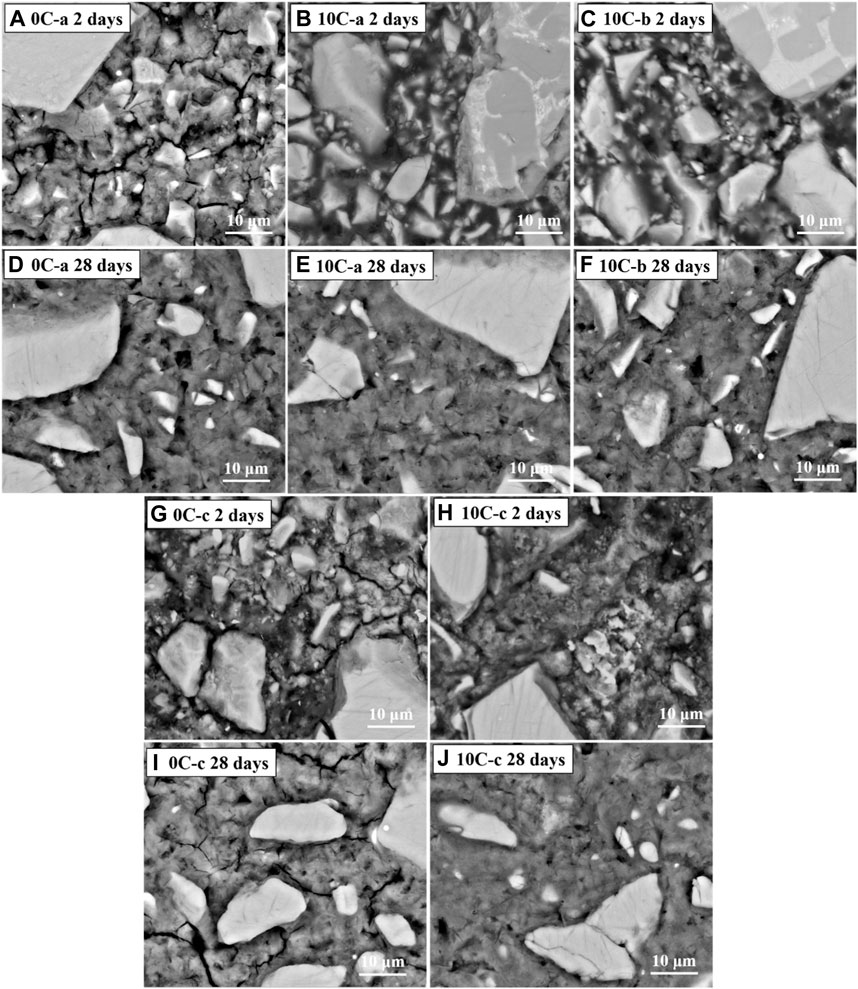
FIGURE 10. BSE images of alkali-activated and hybrid samples: (A) 0C-a 2 days, (B) 10C-a 2 days, (C) 10C-b 2 days, (D) 0C-a 28 days, and (E) 10C-a 28 days, (F) 10C-b 28 days, (G) 0C-c 2 days, (H) 10C-c 2 days, (I) 0C-c 28 days, (J) 10C-c 28 days.
The initial formation of C-A-S-H gel (grey region) in the 0C-a 2-day sample (Figure 10A) is seen surrounding partially unreacted GGBFS particles (brighter particles), with apparent porosity identified by the darker regions. Comparison with the sample after 28 days (Figure 10D) reveals that the 0C-a specimen progressively densifies, generating a more compact binder that appears homogenous, albeit with the persistent inclusion of remnant unreacted GGBFS particles.
The 10C-a and 10C-b 2-day image (Figures 10B, C) shows limited matrix gel formation; numerous unreacted small and large GGBFS particles are present with reduced interparticle spacing, resulting in a highly porous binder. Large CAC particles are also present, for which two distinctive areas of different greyscale levels are identified as CA and gehlenite (Figure 11). The change in microstructure of both samples after 28 days (Figures 10E, F) is similar to the 0C-a sample with increased densification and gel phase formation. Most of the small GGBFS particles are dissolved.
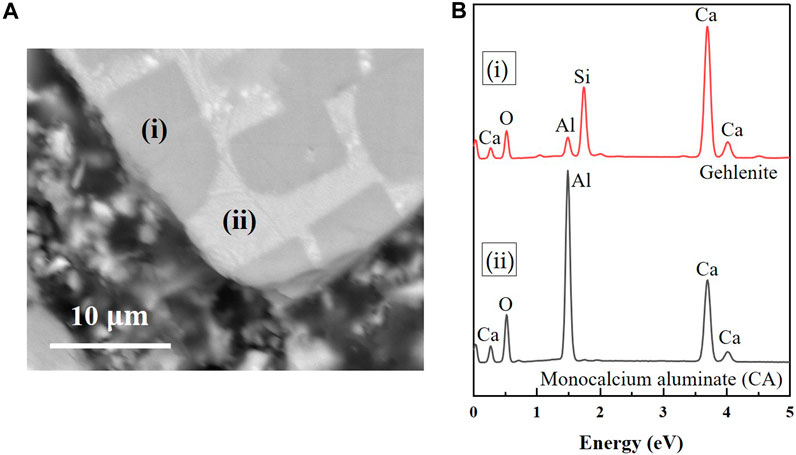
FIGURE 11. (A) BSE image of CAC particle and (B) EDS spectra relative to points (i) and (ii) identifid as gehlenite and CA.
Samples 0C-c and 10C-c after 2 days (Figures 10G, H) also show prominent unreacted GGBFS particles, and are highly heterogeneous composed by distinctive regions with a jagged appearance. The progression of C-A-S-H gel formation is visibly improved after 28 days (Figures 10I, J). The result is similar to the gel formed in sample 0C-a, however the gel formed in 0C-c appears more porous with respect to 10C-c.
Changes in the Ca/Si and Na/Si atomic ratios of the binders cured for 2 and 28 days were determined by SEM-EDS point analysis and are shown in Figures 12A, B.
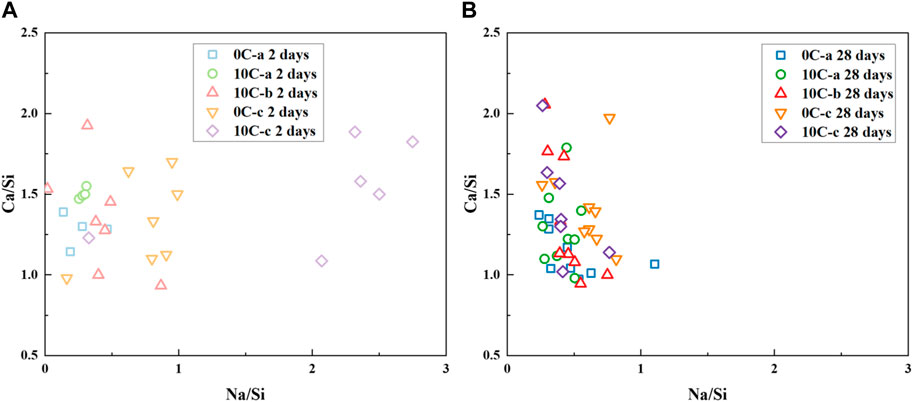
FIGURE 12. Bulk atomic ratio Ca/Si versus Na/Si (as determined by SEM-EDS analysis) for alkali activated and hybrid samples after (A) 2 days and (B) 28 days of curing.
Each sample after 2 days displays a range of values for the ratio Ca/Si between ∼1 and 2, similar to the precursors. The ratio Na/Si appears to be more elevated for sample 10C-c (>2) and sample 0C-c (∼1), where NaOH is used as an activator. Other samples have values ranging between 0.1–0.5. Increasing the curing time to 28 days, Figure 12B, the Ca/Si ratio slightly decreases for all samples, this is due to the further incorporation of Si in C-A-S-H type gels as the polycondensation reaction proceeds as a result of the slower dissolution of Si with respect to Ca from the precursor materials (Walkley et al., 2017). All data points appear to become more tightly clustered as the curing time increases, meaning that the gel type developed has a sim ilar chemical composition for all samples.
The 7 and 28 days compressive strength results for alkali-activated and hybrid samples are displayed in Figure 13. The 10C-a and 10C-b specimens after 7 days exhibit a slightly inferior strength (∼35 MPa) with respect to the control specimen 0C-a (∼44 MPa). As seen in the previous sections [analysis of kinetics (Figure 3), FTIR (Figure 5), XRD data (Figure 4), and SEM (Figures 10B, C)], the gel formation reaction during the first few days of curing is partially inhibited by the competitive and concurrent formation of other phases, such as hydrogarnet, AFm-like phases, and strätlingite. These compounds when formed at later stages do not result in diminished mechanical integrity, however their initial formation may prevent the complete dissolution and subsequent reorganisation of slag particles during polycondensation. The increase in compressive strength seen after 28 days, from 35 to 61 MPa for 10C-a and from 37 to 60 MPa for 10C-b, is considerable. This suggests that whilst formation of additional gel is gradual due to the initially retarded dissolution of aluminium and calcium sources, it is accompanied by significant AFm-like phases and strätlingite phase formation, which are known to promote the densification of the matrix (Midgley and Bhaskara Rao, 1978; Gosselin et al., 2010; Puerta-Falla et al., 2016; Yang et al., 2019), resulting in a more compact gel structure (Fernández-Jiménez et al., 2008; Arbi et al., 2013; Vafaei and Allahverdi, 2016). Both of these formulations surpass the 28-day strength developed by the control formulation 0C-a, which is 58 MPa.
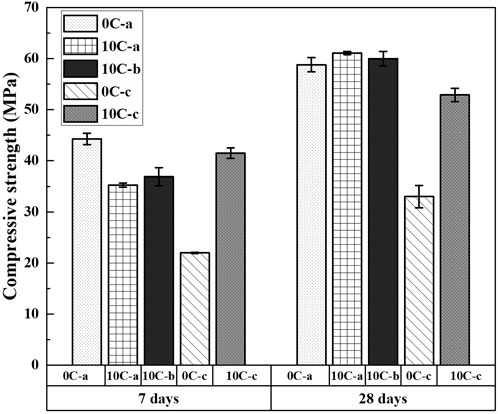
FIGURE 13. Compressive strength of alkali-activated and hybrid samples after 7 days and 28 days. Error bars represent the standard deviation among three replicate specimens.
When using NaOH as an activator the compressive strength developed by the control formulation 0C-c is inferior to that of 0C-a, reaching 22 and 33 MPa after 7 and 28 days, respectively; these values are consistent with those found in the literature (Aydin and Baradan, 2014; Sasui et al., 2019; Gijbels et al., 2020; Hakem Aziz et al., 2020). In this case the addition of CAC is beneficial as the increase of strength is substantial, surpassing 42 MPa and 52 MPa after 7 and 28 days. This provides evidence of good incorporation of Al into the binding phases.
Hybrid systems based on GGBFS with CAC additions, activated with sodium silicate or sodium hydroxide, have been characterised and analysed. The addition of CAC to alkali-activated systems does not result in the formation of the conventional CAC hydration products, such as CAH10, C2AH8, and AH3.
The conversion issue related to the use of CAC in traditional concrete mixes is avoided, as a direct consequence of alkali-activation resulting in differing reaction sequences. The addition of 10 wt% of CAC to alkali-activated binders has a strong impact, especially in the early stages of reaction; it retards the dissolution of GGBFS and consequently the polycondensation reaction of the main strength contributing phase, C-A-S-H gel.
Reaction kinetics and setting time show a delay of up to 50 h when 10% CAC is included in mixtures activated with sodium silicate. NaOH activated binders with CAC additions show a minimal delay. The workability is reduced with CAC addition.
Phase evolution studied by XRD revealed that when CAC is included in the mixture, hydrogarnet C3AH6 is formed along with carboaluminate hydrate phases from the onset of reaction, and the formation of C-A-S-H gel is delayed. C3AH6 is reduced over time and strätlingite is formed depending on activator dosage and pH. When NaOH is used as an activator the formation of AFm phases along with hydrotalcite is recorded. C-A-S-H gel forms from an early age (1 day) along with hydrogarnet C3AH6, which in this case remains stable over time, and strätlingite does not form. FTIR data confirm the retardation in C-A-S-H gel formation when sodium silicate is used as an activator for GGBFS with CAC additions.
From the comparison of sodium silicate activated CAC/GGBFS blends, the highest activator modulus results in larger, even if still limited, amounts of GGBFS reacting at early age as revealed by 29Si MAS NMR analysis. After 28 days, the C-A-S-H gel type formed with CAC additions has higher aluminium incorporation. BSE images taken at 2 and 28 days exhibit the clear evolution of gel phases obtained for control samples and hybrid samples activated with NaOH, whilst the 2-day images of 10C-a and 10C-b show an unformed binding phase. The final gel obtained after 28 days has a similar composition for all samples.
Compressive strength of hybrid samples is slightly lower than those solely based on GGBFS at early ages, but surpasses it after 28 days, reaching 60 MPa. NaOH-activated GGBFS has inferior strength development compared to when using sodium silicate, but in this case the addition of CAC is beneficial, as the strength increases by almost 50%.
The inclusion of CAC in alkali-activated GGBFS-based binders has a detrimental effect on systems activated with sodium silicate, resulting in poorer fresh properties and only marginal improvements in compressive strength. However, when NaOH is employed as the activator, the addition of CAC shows promise. Although the fresh properties are slightly compromised, the setting time delay is manageable from an operational perspective. The compressive strength increases by about 40% if compared with the NaOH activated system without CAC inclusion. This strength level is comparable to that achieved by a GGBFS system activated with sodium silicate, which is recognized for its higher strength. Consequently, this opens up new possibilities for utilizing NaOH as an activator and reducing the activator concentration.
The original contributions presented in the study are included in the article/Supplementary Material, further inquiries can be directed to the corresponding authors.
LS designed the study, performed the experiments, and drafted the first version of the manuscript. JP and BW contributed to the interpretation of data and supervised the work. All authors contributed to the article and approved the submitted version.
This work has been supported by the Interreg North-West Europe Programme as part of the European Union Cohesion Policy, in the framework of URBCON: “By-products for sustainable concrete in the urban environment” (NWE725).
The authors express their gratitude towards Ecocem Benelux B.V. for providing the GGBFS, to Imerys UK for providing CAC Secar 51, and to PQ Silicates for the generous supply of the sodium silicate used in this research.
The authors declare that the research was conducted in the absence of any commercial or financial relationships that could be construed as a potential conflict of interest.
All claims expressed in this article are solely those of the authors and do not necessarily represent those of their affiliated organizations, or those of the publisher, the editors and the reviewers. Any product that may be evaluated in this article, or claim that may be made by its manufacturer, is not guaranteed or endorsed by the publisher.
Abdelrahman, O., and Garg, N. (2022). Impact of Na/Al ratio on the extent of alkali-activation reaction: Non-linearity and diminishing returns. Front. Chem. 9, 806532–806615. doi:10.3389/fchem.2021.806532
Alahrache, S., Winnefeld, F., Champenois, J. B., Hesselbarth, F., and Lothenbach, B. (2016). Chemical activation of hybrid binders based on siliceous fly ash and Portland cement. Cem. Concr. Compos. 66, 10–23. doi:10.1016/j.cemconcomp.2015.11.003
Allahverdi, A., and Skvara, F. (2001). Nitric acid attack on hardened paste of geopolymeric cement. Ceram.-Silik. 4, 143–149.
Allu, A. R., Balaji, S., Tulyaganov, D. U., Mather, G. C., Margit, F., Pascual, M. J., et al. (2017). Understanding the formation of CaAl2Si2O8 in melilite-based glass-ceramics: Combined diffraction and spectroscopic studies. ACS Omega 2 (9), 6233–6243. doi:10.1021/acsomega.7b00598
Andersen, M. D., Jakobsen, H. J., and Skibsted, J. (2003). Incorporation of aluminum in the calcium silicate hydrate (C−S−H) of hydrated portland cements: A high-field 27Al and 29Si MAS NMR investigation. Inorg. Chem. 42 (7), 2280–2287. doi:10.1021/ic020607b
Arbi, K., Palomo, A., and Fernández-Jiménez, A. (2013). Alkali-activated blends of calcium aluminate cement and slag/diatomite. Ceram. Int. 39 (8), 9237–9245. doi:10.1016/j.ceramint.2013.05.031
ASTM Standard (2020). C109/C109M-20 Standard test method for compressive strength of hydraulic cement mortars.
Aydin, S., and Baradan, B. (2014). Effect of activator type and content on properties of alkali-activated slag mortars. Compos. Part B Eng. 57, 166–172. doi:10.1016/j.compositesb.2013.10.001
Bernal, S. A., Provis, J. L., Walkley, B., San Nicolas, R., Gehman, J. D., Brice, D. G., et al. (2013). Gel nanostructure in alkali-activated binders based on slag and fly ash, and effects of accelerated carbonation. Cem. Concr. Res. 53, 127–144. doi:10.1016/j.cemconres.2013.06.007
Bernal, S. A., San Nicolas, R., Myers, R. J., Mejía de Gutiérrez, R., Puertas, F., van Deventer, J. S., et al. (2014). MgO content of slag controls phase evolution and structural changes induced by accelerated carbonation in alkali-activated binders. Cem. Concr. Res. 57, 33–43. doi:10.1016/j.cemconres.2013.12.003
Bocullo, V. (2017). Alkaline activation of hybrid cements binders. J. Sustain. Archit. Civ. Eng. 19 (2), 65–73. doi:10.5755/j01.sace.19.2.17836
Bonk, F., Schneider, J., Cincotto, M. A., and Panepucci, H. (2003). Characterization by multinuclear high-resolution NMR of hydration products in activated blast-furnace slag pastes. J. Am. Ceram. Soc. 86 (10), 1712–1719. doi:10.1111/j.1151-2916.2003.tb03545.x
British Standards Institution (2016). BS EN 196-3:2016 Methods of testing cement - Part 3: Determination of setting times and soundness.
Brough, A. R., and Atkinson, A. (2002). Sodium silicate-based, alkali-activated slag mortars: Part I. Strength, hydration and microstructure. Cem. Concr. Res. 32 (6), 865–879. doi:10.1016/S0008-8846(02)00717-2
Bushnell-Watson, S. M., and Sharp, J. H. (1990). On the cause of the anomalous setting behaviour with respect to temperature of calcium aluminate cements. Cem. Concr. Res. 20 (5), 677–686. doi:10.1016/0008-8846(90)90002-F
Cao, Y. F., Tao, Z., Pan, Z., and Wuhrer, R. (2018). Effect of calcium aluminate cement on geopolymer concrete cured at ambient temperature. Constr. Build. Mater. 191, 242–252. doi:10.1016/j.conbuildmat.2018.09.204
Carrasco, L., Fernández-Gimenez, A., and Palomo, Á. (2007). Alkali activation of “Pozzolan-calcium aluminate cement” mixtures. Montreal: Proceedings of the 12th ICCC.
Collins, F. G., and Sanjayan, J. G. (1999). Workability and mechanical properties of alkali activated slag concrete. Cem. Concr. Res. 29 (3), 455–458. doi:10.1016/S0008-8846(98)00236-1
Cong, X., and Kirkpatrick, R. J. (1993). Hydration of calcium aluminate cements: A solid-state 27Al NMR study. J. Am. Ceram. Soc. 76 (2), 409–416. doi:10.1111/j.1151-2916.1993.tb03799.x
Dai, X., Aydin, S., Yardimci, M. Y., Lesage, K., and De Schutter, G. (2022). Early age reaction, rheological properties and pore solution chemistry of NaOH-activated slag mixtures. Cem. Concr. Compos. 133, 104715. doi:10.1016/j.cemconcomp.2022.104715
Dai, Z., Tran, T. T., and Skibsted, J. (2014). Aluminum incorporation in the C–S–H phase of white Portland cement–metakaolin blends studied by 27Al and 29Si MAS NMR spectroscopy. J. Am. Ceram. Soc. 97 (8), 2662–2671. doi:10.1111/jace.13006
Ding, J., Fu, Y., and Beaudoin, J. J. (1995). Strätlingite formation in high alumina cement - silica fume systems: Significance of sodium ions. Cem. Concr. Res. 25 (6), 1311–1319. doi:10.1016/0008-8846(95)00124-U
Ding, J., Fu, Y., and Beaudoin, J. J. (1996). Study of hydration mechanisms in the high alumina cement - sodium silicate system. Cem. Concr. Res. 26 (5), 799–804. doi:10.1016/S0008-8846(96)85017-4
Ding, W., He, Y., Lu, L., Wang, F., and Hu, S. (2021). Mechanical property and microstructure of quaternary phase paste blended with metakaolin. Cem. Concr. Compos. 118, 103934. doi:10.1016/j.cemconcomp.2021.103934
Escalante-García, J. I., Fuentes, A. F., Gorokhovsky, A., Fraire-Luna, P. E., and Mendoza-Suarez, G. (2003). Hydration products and reactivity of blast-furnace slag activated by various alkalis. J. Am. Ceram. Soc. 86 (12), 2148–2153. doi:10.1111/j.1151-2916.2003.tb03623.x
Fernández-Jiménez, A., Palomo, A., Sobrados, I., and Sanz, J. (2006). The role played by the reactive alumina content in the alkaline activation of fly ashes. Microporous Mesoporous Mater. 91 (1), 111–119. doi:10.1016/j.micromeso.2005.11.015
Fernández-Jiménez, A., Palomo, Á., Vazquez, T., Vallepu, R., Terai, T., and Ikeda, K. (2008). Alkaline activation of blends of metakaolin and calcium aluminate. J. Am. Ceram. Soc. 91, 1231–1236. doi:10.1111/j.1551-2916.2007.02002.x
Fernández-Jiménez, A., Vázquez, T., and Palomo, A. (2011). Effect of sodium silicate on calcium aluminate cement hydration in highly alkaline media: A microstructural characterization. J. Am. Ceram. Soc. 94 (4), 1297–1303. doi:10.1111/j.1551-2916.2010.04242.x
Florian, P., Veron, E., Green, T. F. G., Yates, J. R., and Massiot, D. (2012). Elucidation of the Al/Si ordering in gehlenite Ca2Al2SiO7 by combined 29Si and 27Al NMR spectroscopy/quantum chemical calculations. Chem. Mater. 24 (21), 4068–4079. doi:10.1021/cm3016935
García-Lodeiro, I., Fernández-Jiménez, A., Blanco, M. T., and Palomo, A. (2008). FTIR study of the sol–gel synthesis of cementitious gels: C–S–H and N–A–S–H. J. Sol-Gel Sci. Technol. 45 (1), 63–72. doi:10.1007/s10971-007-1643-6
Garcia-Lodeiro, I., Fernandez-Jimenez, A., and Palomo, A. (2013). Hydration kinetics in hybrid binders: Early reaction stages. Cem. Concr. Compos. 39, 82–92. doi:10.1016/j.cemconcomp.2013.03.025
García-Lodeiro, I., Fernández-Jiménez, A., and Palomo, A. (2013). Variation in hybrid cements over time. Alkaline activation of fly ash–portland cement blends. Cem. Concr. Res. 52, 112–122. doi:10.1016/j.cemconres.2013.03.022
Garcia-Lodeiro, I., Palomo, A., and Fernández-Jiménez, A., (2015). “2 - an overview of the chemistry of alkali-activated cement-based binders,” in Handbook of alkali-activated cements, mortars and concretes (Oxford: Woodhead Publishing), 19–47. doi:10.1533/9781782422884.1.19
Gijbels, K., Pontikes, Y., Samyn, P., Schreurs, S., and Schroeyers, W. (2020). Effect of NaOH content on hydration, mineralogy, porosity and strength in alkali/sulfate-activated binders from ground granulated blast furnace slag and phosphogypsum. Cem. Concr. Res. 132, 106054. doi:10.1016/j.cemconres.2020.106054
Gong, K., and White, C. E. (2016). Impact of chemical variability of ground granulated blast-furnace slag on the phase formation in alkali-activated slag pastes. Cem. Concr. Res. 89, 310–319. doi:10.1016/j.cemconres.2016.09.003
Gosselin, C., Gallucci, E., and Scrivener, K. (2010). Influence of self heating and Li2SO4 addition on the microstructural development of calcium aluminate cement. Cem. Concr. Res. 40 (10), 1555–1570. doi:10.1016/j.cemconres.2010.06.012
Haha, M. B., Lothenbach, B., Le Saout, G., and Winnefeld, F. (2011). Influence of slag chemistry on the hydration of alkali-activated blast-furnace slag — Part I: Effect of MgO. Cem. Concr. Res. 41 (9), 955–963. doi:10.1016/j.cemconres.2011.05.002
Hakem Aziz, I., Mustafa Al Bakri Abdullah, M., Arif Anuar Mohd Salleh, M., and Victor Sandu, A. (2020). The incorporation of sodium hydroxide (NaOH) concentration and CaO-Si components on ground granulated blast furnace slag geopolymers. IOP Conf. Ser. Mater. Sci. Eng. 864 (1), 012005. doi:10.1088/1757-899X/864/1/012005
Heah, C. Y., Kamarudin, H., Mustafa Al Bakri, A., Bnhussain, M., Luqman, M., Khairul Nizar, I., et al. (2012). Study on solids-to-liquid and alkaline activator ratios on kaolin-based geopolymers. Constr. Build. Mater. 35, 912–922. doi:10.1016/j.conbuildmat.2012.04.102
Hertwig, L., and Holschemacher, K. (2021). Setting time and strength monitoring of alkali-activated cement mixtures by ultrasonic testing. Materials 1889 (14).
Hidalgo, A., García, J. L., Alonso, M. C., Fernández, L., and Andrade, C. (2009). Microstructure development in mixes of calcium aluminate cement with silica fume or fly ash. J. Therm. Analysis Calorim. 96 (2), 335–345. doi:10.1007/s10973-007-8439-3
Horgnies, M., Chen, J., and Bouillon, C. (2013). Overview about the use of Fourier Transform Infrared spectroscopy to study cementitious materials. WIT Trans. Eng. Sci. 77, 251–262. doi:10.2495/MC130221
Hughes, C. E., Walkley, B., Gardner, L. J., Walling, S. A., Bernal, S. A., Iuga, D., et al. (2019). Exploiting in-situ solid-state NMR spectroscopy to probe the early stages of hydration of calcium aluminate cement. Solid State Nucl. Magn. Reson. 99, 1–6. doi:10.1016/j.ssnmr.2019.01.003
Ideker, J. H. (2019). “12 - calcium aluminate cements,” in Lea’s chemistry of cement and concrete. Editors P. C. Hewlett, and M. Liska (Oxford, United Kingdom: Butterworth-Heinemann), 537–584. 5th Edit. doi:10.1016/B978-0-08-100773-0.00012-5
Juenger, M. C. G., Winnefeld, F., Provis, J., and Ideker, J. (2011). Advances in alternative cementitious binders. Cem. Concr. Res. 41 (12), 1232–1243. doi:10.1016/j.cemconres.2010.11.012
Kayali, O., Khan, M. S. H., and Sharfuddin Ahmed, M. (2012). The role of hydrotalcite in chloride binding and corrosion protection in concretes with ground granulated blast furnace slag. Cem. Concr. Compos. 34 (8), 936–945. doi:10.1016/j.cemconcomp.2012.04.009
Khale, D., and Chaudhary, R. (2007). Mechanism of geopolymerization and factors influencing its development: A review. J. Mater. Sci. 42 (3), 729–746. doi:10.1007/s10853-006-0401-4
Król, M., Rożek, P., Chlebda, D., and Mozgawa, W. (2018). Influence of alkali metal cations/type of activator on the structure of alkali-activated fly ash – ATR-FTIR studies. Spectrochimica Acta - Part A Mol. Biomol. Spectrosc. 198, 33–37. doi:10.1016/j.saa.2018.02.067
Kwan, S., LaRosa, J., and Grutzeck, M. W. (1995). 29Si and 27Al MASNMR study of strätlingite. J. Am. Ceram. Soc. 78 (7), 1921–1926. doi:10.1111/j.1151-2916.1995.tb08910.x
Le Saoût, G., Ben Haha, M., Winnefeld, F., and Lothenbach, B. (2011). Hydration degree of alkali-activated slags: A 29Si NMR study. J. Am. Ceram. Soc. 94 (12), 4541–4547. doi:10.1111/j.1551-2916.2011.04828.x
Lee, W. K. W., and van Deventer, J. S. J. (2002). The effects of inorganic salt contamination on the strength and durability of geopolymers. Colloids Surfaces A Physicochem. Eng. Aspects 211 (2), 115–126. doi:10.1016/S0927-7757(02)00239-X
López, A. H., García Calvo, J. L., García Olmo, J., Petit, S., and Alonso, M. C. (2008). Microstructural evolution of calcium aluminate cements hydration with silica fume and fly ash additions by scanning electron microscopy, and mid and near-infrared spectroscopy. J. Am. Ceram. Soc. 91 (4), 1258–1265. doi:10.1111/j.1551-2916.2008.02283.x
Lothenbach, B., and Gruskovnjak, A. (2007). Hydration of alkali-activated slag: Thermodynamic modelling. Adv. Cem. Res. 19 (2), 81–92. doi:10.1680/adcr.2007.19.2.81
Maddalena, R., Li, K., Chater, P. A., Michalik, S., and Hamilton, A. (2019). Direct synthesis of a solid calcium-silicate-hydrate (C-S-H). Constr. Build. Mater. 223, 554–565. doi:10.1016/j.conbuildmat.2019.06.024
Midgley, H. G., and Bhaskara Rao, P. (1978). Formation of stratlingite, 2CaO.SiO2.Al2O3.8H2O, in relation to the hydration of high alumina cement. Cem. Concr. Res. 8 (2), 169–172. doi:10.1016/0008-8846(78)90005-4
Mostafa, N. Y., Zaki, Z. I., and Abd Elkader, O. H. (2012). Chemical activation of calcium aluminate cement composites cured at elevated temperature. Cem. Concr. Compos. 34 (10), 1187–1193. doi:10.1016/j.cemconcomp.2012.08.002
Myers, R. J., Bernal, S. A., Gehman, J. D., van Deventer, J. S., and Provis, J. L. (2015). The role of Al in cross-linking of alkali-activated slag cements. J. Am. Ceram. Soc. 98 (3), 996–1004. doi:10.1111/jace.13360
Myers, R. J., Bernal, S. A., and Provis, J. L. (2017). Phase diagrams for alkali-activated slag binders. Cem. Concr. Res. 95, 30–38. doi:10.1016/j.cemconres.2017.02.006
Myers, R. J., Bernal, S. A., San Nicolas, R., and Provis, J. L. (2013). Generalized structural description of calcium–sodium aluminosilicate hydrate gels: The cross-linked substituted tobermorite model. Langmuir 29 (17), 5294–5306. doi:10.1021/la4000473
Myers, R. J., Lothenbach, B., Bernal, S. A., and Provis, J. L. (2015). Thermodynamic modelling of alkali-activated slag cements. Appl. Geochem. 61, 233–247. doi:10.1016/j.apgeochem.2015.06.006
Okoronkwo, M. U., and Glasser, F. P. (2016). Stability of strätlingite in the CASH system. Mater. Struct. 49 (10), 4305–4318. doi:10.1617/s11527-015-0789-x
Palomo, A., Monteiro, P., Martauz, P., Bilek, V., and Fernandez-Jimenez, A. (2019). Hybrid binders: A journey from the past to a sustainable future (opus caementicium futurum). Cem. Concr. Res. 124, 105829. doi:10.1016/j.cemconres.2019.105829
Pastor, C., Fernández-Jiménez, A., and Vázquez, T. (2009). Hidratación del cemento de aluminato de calcio en condiciones de muy elevada alcalinidad. Mater. Construcción 59 (293). doi:10.3989/mc.2009.42407
Pena, P., Rivas Mercury, J., de Aza, A., Turrillas, X., Sobrados, I., and Sanz, J. (2008). Solid-state 27Al and 29Si NMR characterization of hydrates formed in calcium aluminate–silica fume mixtures. J. Solid State Chem. 181 (8), 1744–1752. doi:10.1016/j.jssc.2008.03.026
Provis, J. L., and Bernal, S. A. (2014). Geopolymers and related alkali-activated materials. Annu. Rev. Mater. Res. 44 (1), 299–327. doi:10.1146/annurev-matsci-070813-113515
Provis, J. L., Palomo, A., and Shi, C. (2015). Advances in understanding alkali-activated materials. Cem. Concr. Res. 78, 110–125. doi:10.1016/j.cemconres.2015.04.013
Puerta-Falla, G., Balonis, M., Le Saout, G., Kumar, A., Rivera, M., Falzone, G., et al. (2016). The influence of slightly and highly soluble carbonate salts on phase relations in hydrated calcium aluminate cements. J. Mater. Sci. 51 (12), 6062–6074. doi:10.1007/s10853-016-9912-9
Puertas, F., Palacios, M., Manzano, H., Dolado, J., Rico, A., and Rodríguez, J. (2011). A model for the C-A-S-H gel formed in alkali-activated slag cements. J. Eur. Ceram. Soc. 31 (12), 2043–2056. doi:10.1016/j.jeurceramsoc.2011.04.036
Reig, F. B., Adelantado, J. V. G., and Moreno, M. C. M. M. (2002). FTIR quantitative analysis of calcium carbonate (calcite) and silica (quartz) mixtures using the constant ratio method. Application to geological samples. Talanta 58, 811–821. doi:10.1016/s0039-9140(02)00372-7
Reig, L., Soriano, L., Borrachero, M., Monzó, J., and Payá, J. (2016). Influence of calcium aluminate cement (CAC) on alkaline activation of red clay brick waste (RCBW). Cem. Concr. Compos. 65, 177–185. doi:10.1016/j.cemconcomp.2015.10.021
Richardson, I. G., Brough, A. R., Brydson, R., Groves, G. W., and Dobson, C. M. (1993). Location of aluminum in substituted calcium silicate hydrate (C-S-H) gels as determined by 29Si and 27Al NMR and EELS. J. Am. Ceram. Soc. 76 (9), 2285–2288. doi:10.1111/j.1151-2916.1993.tb07765.x
Sasaki, K., Kurumisawa, K., and Ibayashi, K. (2019). Effect of retarders on flow and strength development of alkali-activated fly ash/blast furnace slag composite. Constr. Build. Mater. 216, 337–346. doi:10.1016/j.conbuildmat.2019.05.022
Sasui, S., Kim, G., Nam, J., Koyama, T., and Chansomsak, S. (2019). Strength and microstructure of class-C fly ash and GGBS blend geopolymer activated in NaOH & NaOH + Na2SiO3. Materials 13 (1), 59. doi:10.3390/ma13010059
Stebbins, J. F., and Xue, X. (2014). “15. NMR spectroscopy of inorganic earth materials,” in Spectroscopic methods in mineralogy and material sciences. Editors G. Henderson, D. Neuville, and R. Downs (Berlin: De Gruyter), 605–654. doi:10.1515/9781614517863.605
Sun, G. K., Young, J. F., and Kirkpatrick, R. J. (2006). The role of Al in C–S–H: NMR, XRD, and compositional results for precipitated samples. Cem. Concr. Res. 36 (1), 18–29. doi:10.1016/j.cemconres.2005.03.002
Sun, Z., and Vollpracht, A. (2018). Isothermal calorimetry and in-situ XRD study of the NaOH activated fly ash, metakaolin and slag. Cem. Concr. Res. 103, 110–122. doi:10.1016/j.cemconres.2017.10.004
Tajuelo Rodriguez, E., Garbev, K., Merz, D., Black, L., and Richardson, I. G. (2017). Thermal stability of C-S-H phases and applicability of Richardson and Groves’ and Richardson C-(A)-S-H(I) models to synthetic C-S-H. Cem. Concr. Res. 93, 45–56. doi:10.1016/j.cemconres.2016.12.005
Tan, Z., Bernal, S. A., and Provis, J. L. (2017). Reproducible mini-slump test procedure for measuring the yield stress of cementitious pastes. Mater. Struct. 50 (6), 235–312. doi:10.1617/s11527-017-1103-x
Tänzer, R., Buchwald, A., and Stephan, D. (2014). Effect of slag chemistry on the hydration of alkali-activated blast-furnace slag. Mater. Struct. 48 (3), 629–641. doi:10.1617/s11527-014-0461-x
Trezza, M. A., and Lavat, A. E. (2001). Analysis of the system 3CaO·Al2O3–CaSO4·2H2O–CaCO3–H2O by FT-IR spectroscopy. Cem. Concr. Res. 31 (6), 869–872. doi:10.1016/S0008-8846(01)00502-6
Uchino, T., Sakka, T., and Iwasaki, M. (1991). Interpretation of hydrated states of sodium silicate glasses by infrared and Raman analysis. J. Am. Ceram. Soc. 74 (2), 306–313. doi:10.1111/j.1151-2916.1991.tb06880.x
Vafaei, M., and Allahverdi, A. (2016). Influence of calcium aluminate cement on geopolymerization of natural pozzolan. Constr. Build. Mater. 114, 290–296. doi:10.1016/j.conbuildmat.2016.03.204
Wadsö, L. (2010). Operational issues in isothermal calorimetry. Cem. Concr. Res. 40 (7), 1129–1137. doi:10.1016/j.cemconres.2010.03.017
Walkley, B., and Provis, J. L. (2019). Solid-state nuclear magnetic resonance spectroscopy of cements. Mater. Today Adv. 1, 100007. doi:10.1016/j.mtadv.2019.100007
Walkley, B., San Nicolas, R., Sani, M. A., Bernal, S. A., van Deventer, J. S., and Provis, J. L. (2017). Structural evolution of synthetic alkali-activated CaO-MgO-Na2O-Al2O3-SiO2 materials is influenced by Mg content. Cem. Concr. Res. 99, 155–171. doi:10.1016/j.cemconres.2017.05.006
Walkley, B., San Nicolas, R., Sani, M. A., Rees, G. J., Hanna, J. V., van Deventer, J. S., et al. (2016). Phase evolution of C-(N)-A-S-H/N-A-S-H gel blends investigated via alkali-activation of synthetic calcium aluminosilicate precursors. Cem. Concr. Res. 89, 120–135. doi:10.1016/j.cemconres.2016.08.010
Wang, S.-D., and Scrivener, K. L. (1995). Hydration products of alkali activated slag cement. Cem. Concr. Res. 25 (3), 561–571. doi:10.1016/0008-8846(95)00045-E
Wang, S. D., and Scrivener, K. L. (2003). 29Si and 27Al NMR study of alkali-activated slag. Cem. Concr. Res. 33 (5), 769–774. doi:10.1016/S0008-8846(02)01044-X
Yang, H. J., Ann, K. Y., and Jung, M. S. (2019). “Development of strength for calcium aluminate cement mortars blended with GGBS,” in Advances in materials science and engineering. Editor J. Rydz (London: Hindawi), 9896012. doi:10.1155/2019/9896012
Keywords: alkali-activation, C-A-S-H, calcium aluminate cements (CAC), hybrid binders, ground granulated blast furnace slag (GGBFS)
Citation: Stefanini L, Walkley B and Provis JL (2023) Investigating the retarding effect of CAC in alkali-activated cements. Front. Mater. 10:1212177. doi: 10.3389/fmats.2023.1212177
Received: 25 April 2023; Accepted: 05 June 2023;
Published: 15 June 2023.
Edited by:
Jae Eun Oh, Ulsan National Institute of Science and Technology, Republic of KoreaReviewed by:
Sungchul Bae, Hanyang University, Republic of KoreaCopyright © 2023 Stefanini, Walkley and Provis. This is an open-access article distributed under the terms of the Creative Commons Attribution License (CC BY). The use, distribution or reproduction in other forums is permitted, provided the original author(s) and the copyright owner(s) are credited and that the original publication in this journal is cited, in accordance with accepted academic practice. No use, distribution or reproduction is permitted which does not comply with these terms.
*Correspondence: Laura Stefanini, bGF1cmEuc3RlZmFuaW5pQHZ0dC5maQ==; John L. Provis, ai5wcm92aXNAc2hlZmZpZWxkLmFjLnVr
†Present address: Laura Stefanini, VTT Technical Research Centre of Finland LTD, Espoo, Finland
Disclaimer: All claims expressed in this article are solely those of the authors and do not necessarily represent those of their affiliated organizations, or those of the publisher, the editors and the reviewers. Any product that may be evaluated in this article or claim that may be made by its manufacturer is not guaranteed or endorsed by the publisher.
Research integrity at Frontiers

Learn more about the work of our research integrity team to safeguard the quality of each article we publish.