 Qiushi Hu
 Heng Li1
- 1School of Mechanical Engineering, Jiangsu University of Science and Technology, Zhenjiang, China
- 2School of Energy Power and Mechanical Engineering, North China Electric Power University, Beijing, China
The flexspline and flexible bearing constitute a critical contact pair in a harmonic drive system, and their torsional stiffness has a significant impact on the performance characteristics manifested by the harmonic drive. In this study, a micro scale three-dimensional fractal model was combined with a macro scale finite element simulation method to establish an equivalent torsional stiffness model for the flexspline-flexible bearing contact pair (FS-FB contact pair), which enables the theoretical prediction of the torsional stiffness of this contact pair. A torsional stiffness testing platform was constructed for a harmonic drive, and the consistency between the experimental results of the torsional stiffness curve and the theoretical predictions validates the effectiveness of the proposed model. The influences of torque, installation eccentricity, and deformation coefficient on the torsional stiffness of the FS-FB contact pair were also discussed. The results indicate that the torsional stiffness of the FS-FB contact pair increases nonlinearly with an increase in torque. On the other hand, the torsional stiffness of the FS-FB contact pair decreases with an increase in installation eccentricity, and increases before subsequently decreasing with an increase in deformation coefficient. Moreover, as torque increases, the impact of installation eccentricity and deformation coefficient on the torsional stiffness diminishes. This article provides a theoretical reference for the optimization design and performance enhancement of harmonic drives.
1 Introduction
Harmonic drives have been widely used in fields such as robotics, aerospace, and precision medical equipment due to their unique structure and performance advantages (Pham and Ahn, 2018; Cai et al., 2019; Li et al., 2020). As the core component of a harmonic drive, the flexspline-flexible bearing (FS-FB) contact pair features a compact structure and strong adaptive deformation, which makes it ideal for precision transmission applications with high accuracy, high load, and high reduction ratio. Due to the nonlinear deformation characteristics of the flexspline and flexible bearing, the torsional stiffness of the FS-FB contact pair exhibits a complex nonlinear variation with increasing torque. This nonlinear torsional stiffness directly impacts the transmission accuracy and stability of the harmonic drive (Hu et al., 2021). The modeling and analyzing the torsional stiffness of the FS-FB system is crucial for researching the transmission performance of harmonic drives.
The finite element method (FEM) is a widely used approach to analyze the contact characteristics of gears (Zeng and Tan, 2013; Lin et al., 2022; Wang et al., 2022). Cai W. et al. (2019) proposed a two-stage nutation drive mechanism of double circular arc bevel gears. They analyzed the dynamic characteristics of the mechanism employing the FEM and validated the feasibility of the proposed transmission mechanism through experiments. Li et al. (2011) conducted finite element contact analysis on rectangular asperities of rough surfaces, and studied the effects of uneven distribution of contact stress and local plastic deformation on normal contact stiffness. They obtained the normal and tangential interfacial contact stiffness under different loading conditions. Tang and Pu (2011) constructed a model of a five-teeth spiral bevel gear using the FEM. By loaded tooth contact analysis, they calculated the normal contact force and comprehensive elastic deformation, obtained the single and multiple teeth meshing stiffness, and analyzed the effect of different loads on the stiffness curve. Lin et al. (2020) have derived the tooth profile equations of internal and external spiral bevel gears based on double circular-arc spiral bevel gears, and established the tooth surface contact trajectory equation through the meshing equation and coordinate transformation. They conducted finite element loading contact simulation on the double circular-arc gears with different potential error values.
From a macroscopic perspective, the machining surface of a mechanical part is smooth, while from a microscopic perspective, the surface is rough with many irregularities, meaning that the surface morphology of the mechanical part is rough. The contact between rough surfaces is characterized by the interaction of asperities (Zhai et al., 2016; Xiao et al., 2019; Chen et al., 2022). Statistical and fractal contact models have been widely used to solve contact problems on rough surfaces. Greenwood and Williamson (1966) proposed a hypothesis that the curvature radius of the asperities on rough surfaces is the same and the height follows a Gaussian distribution, and based on this, they constructed the statistical rough surface GW contact model. However, the GW model only considers the elastic deformation stage of the asperities. Zhao et al. (2000) established an elastic-plastic asperity microcontact model, namely, the Z-MC contact model. The ZMC model incorporates the transitional regime from elastic deformation to fully plastic flow of the asperity into consideration. Kogut and Etsion. (2002); Kogut and Etsion. (2003) solved the elastic-plastic contact problem of a rigid flat pressing against a sphere through finite element simulation and constructed the KE elastic-plastic model, which extends the classical Hertz solution to a fully plastic contact area. However, contact models based on statistical parameters do not provide unique characterization and analysis results for the given rough surfaces. Based on the fractal theory and the Weierstrass-Mandelbrot function (Majumdar and Tien, 1990) characterizing the two-dimensional profile features of isotropic rough surfaces, Majumdar and Bhushan (1991) developed the MB fractal contact model for rough surfaces. It is noteworthy that the MB model indicates that smaller contact spots tend to undergo plastic deformation, while larger contact spots undergo elastic deformation. This prediction is in stark contrast to the classical theories of contact mechanics, which predicts the opposite. In the MB model, the deformation of a single asperity is a complete deformation that is independent of the applied load, and the asperity peak curvature radius is a parameter related to the contact area rather than a constant value. Later, Morag and Etsion (2006) demonstrated that the deformation process of a single asperity on a fractal surface always starts from an elastic state and eventually undergoes an elastic-plastic transition. Liou and Lin (2010) believed that the behaves of a fractal asperity conforms to classical contact mechanics. By combining the generalized Weierstrass-Mandelbrot function with the radius-vector function method, the formulas for the fractal surface profiles of sphere-based and cylinder-based particles were derived. A microcontact model, considering sphere-based and cylinder-based fractal bodies in contact with a smooth rigid flat surface was established, and the real contact area and the contact load were obtained. Research on contact stiffness of joint surfaces has also been developed. Jiang et al. (2010) introduced a contact stiffness model for investigating rough surface contacts in machined plane joints, utilizing fractal geometry and accounting for elastic-plastic deformation and size-dependent contact stiffness. The model was validated through theoretical analysis and experimental testing and found to be accurate on cast iron specimens. Tian et al. (2017) modeled the normal contact stiffness of the slow sliding surface in machine tool ground foot, and discussed the influence of surface parameters on the surface dynamic characteristics. Liao et al. (2017) put forward a method for identifying the contact stiffness and contact force of shrink-fit tool-holder joint based on Hertz theory and fractal theory, considering the friction factor. They analyzed the effects of radial interference, tool insertion length, and rotation speed on the contact behaviors between the shrink-fit tool-holder connection. Li et al. (2020); Li et al. (2021) considered the influence of bulk substrate deformation caused by the interaction between the asperity and the bulk substrate, and established a contact stiffness model of the joint surface with continuous and smooth characteristics by using Hermite polynomial interpolation functions.
Previous researchers have made valuable contributions to the modeling and analysis of mechanical part contact, providing deeper insights into the performance of mechanical surfaces. However, there is currently a lack of research on macro-microscale combined modeling of mechanical surfaces. The amalgamation of these techniques holds promise in revealing the underlying characteristics of mechanical surface properties more accurately.
This article is centered on the investigation of the torsional stiffness of the FS-FB contact pair in a harmonic drive. The process flowchart is shown in Figure 1. The rest of this article is organized as follows. In Section 2, a torsional stiffness model of the FS-FB contact pair is established based on the combination of fractal theory and FEM. In Section 3, the effectiveness of the proposed model is verified through the torsional stiffness test of the harmonic drive. The effects of torque, installation eccentricity, and deformation coefficient on the torsional stiffness of the FS-FB contact pair are discussed. Finally, the main conclusions are summarized in Section 4. The torsional stiffness modeling and prediction method of the FS-FB contact pair proposed in this article provides an important reference for optimizing the design of harmonic drives and improving transmission stiffness and accuracy.
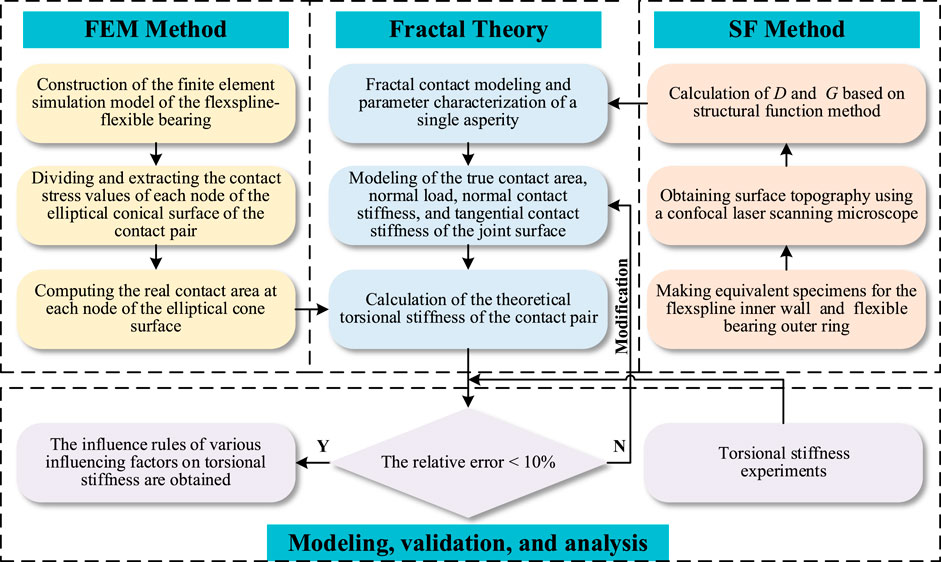
FIGURE 1. Flowchart of the article.
2 Modeling of torsional stiffness of flexspline-flexible bearing contact
The torsional stiffness of the FS-FB contact pair is of paramount importance to the overall performance of the harmonic drive system. The structural diagram of the CD-14–100 harmonic drive prototype is presented in Figure 2, which exhibits an outer diameter of 50 mm and has a rated torque output of 5Nm. The flexspline is a flexible thin-walled cylindrical part with external teeth, and its inner wall is connected to the wave generator through a flexible bearing. The wave generator, equipped with the flexible bearing on the outside, is a cam with an elliptical cross-section that causes the outer ring of the flexible bearing to be supported and deformed into a concentric ellipse. In the working state, the contact surface between the flexspline and the flexible bearing is an annular elliptical cone surface. The contact status between the inner wall of the flexspline and the outer ring of the flexible bearing directly affects the torsional stiffness of the contact pair. However, the torsional stiffness of the FS-FB contact pair can also be influenced by various factors such as operating conditions (e.g., load torque), design parameters (e.g., deformation coefficient), assembly errors (e.g., installation eccentricity), and exhibits nonlinear characteristics. It is essential to create the torsional stiffness model for the FS-FB contact pair to improve the overall torsional stiffness of the harmonic drive.
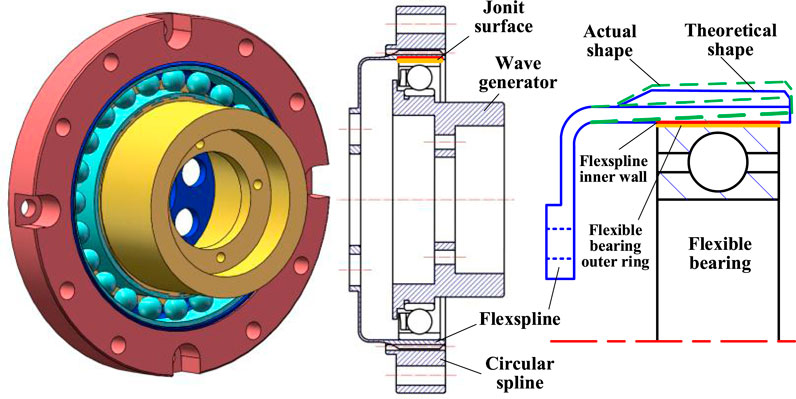
FIGURE 2. Structure diagram of a CD-14–100 model harmonic drive.
2.1 Three-dimensional fractal modeling of joint surface
The mechanical joint surfaces demonstrate continuous, non-differentiable, and self-affine fractal characteristics (Yan and Komvopoulos, 1998). These features conform to the three-dimensional Weierstrass-Mandelbrot (W-M) function (Ji et al., 2013), which is defined as follows:
Where, z (x, y) is the height of the surface profile; x, y are the displacement coordinates, respectively; G is the fractal roughness parameter; D is the three-dimensional fractal dimension (
By setting
The contact between two rough surfaces can be replaced by an equivalent rough surface contacting a rigid flat surface. Assuming that the single asperity is semi-spherical, where 2rm represents the base length, 2r′ represents the truncated length, and 2r represents the actual contact length. The profile curve of the single asperity before deformation shown in Figure 3 can be expressed as (Liou and Lin, 2010):
by setting
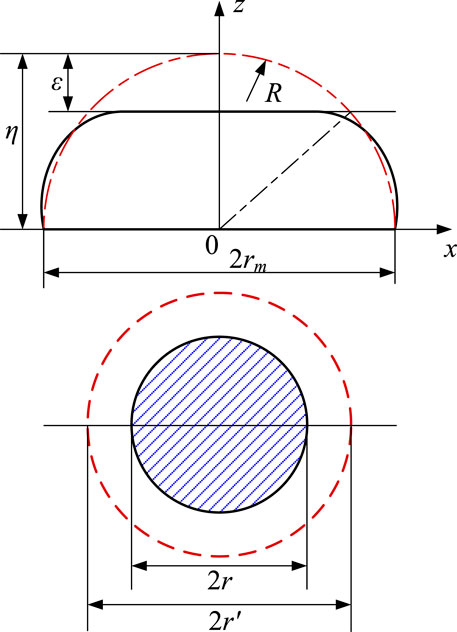
FIGURE 3. Contact deformation model of a single asperity.
The asperity height η is given by:
and the curvature radius R, at the peak of the asperity, has the expression as (Zhang et al., 2021):
When the truncated length is 2r′, the actual deformation of the asperity ε can be written as:
In general, asperities on one surface are squeezed by asperities on another surface, causing the asperities to undergo elastic, elastoplastic, or plastic deformation. According to the classical Hertz elastic contact theory, the critical normal deformation εec that separates the completely elastic state from the elastoplastic state for a single asperity can be expressed as:
Where, k is the hardness coefficient related to the Poisson’s ratio ν of the material, and can be written as
For
When
For
Where, sep1 and sep2 mean the contact areas in the first and second phases of elastoplastic deformation, respectively; fep1 and fep2 mean the normal contact loads in the first and second phases of elastoplastic deformation, respectively; fec means the contact load for
It is defined that sepc1 is the first elastoplastic critical contact area and sepc2 is the second elastoplastic critical contact area. By substituting Eq. 9 and Eq. 10 into Eq. 11 and Eq. 12, the equations for the normal contact loads during the elastoplastic stage are generated as follows:
For
2.1.1 Total real contact area and total normal contact load of joint surface
Assuming that the morphology of the joint surface is isotropic, the three-dimensional fractal dimension can be expressed as
Where, sl represents the largest contact area of the asperity under the contact load; ψ represents the fractal region expansion coefficient, which satisfies the following equation
Then, the real contact area of elastic deformation region of the joint surface can be written as:
The real contact area of the first elastoplastic deformation region can be written as:
The real contact area of the second elastoplastic deformation region can be written as:
The real contact area of the plastic deformation region can be written as:
The total real contact area of the joint surface can be given as:
Based on the normal contact load expressions of a single asperity in the elastic, elastoplastic, and plastic deformation stages, the normal contact load on the elastic deformation region of the joint surface can be written as:
The normal contact load on the first elastoplastic deformation region can be written as:
The normal contact load on the second elastoplastic deformation region can be written as:
The normal contact load on the plastic deformation region can be written as:
The total normal contact load of the joint surface can be given as:
Then, the normal contact stress on the joint surface can be expressed as:
2.1.2 Normal contact stiffness modeling of joint surface
When two rough surfaces come into contact with each other, the asperities undergo elastic, elastoplastic, or plastic deformation, where the normal contact stiffness during the plastic deformation stage should be calculated as zero. According to the definition of stiffness, the normal contact stiffness of an individual asperity undergoing completely elastic deformation can be written as:
By integrating over the elastic deformation region (
Similarly, the relationship between the normal contact stiffness and the contact area for an individual asperity undergoing the first and second stages of elastoplastic deformation can be obtained as:
By integrating in the first elastoplastic deformation zone (
The total normal contact stiffness of the joint surface can be expressed as:
2.1.3 Tangential contact stiffness modeling of joint surface
Based on the results of researchers, the tangential deformation of a single asperity can be expressed as (Zhang et al., 2013):
Where μ represents the static friction coefficient; G′ represents the equivalent shear modulus, which can be written as
According to Eq. 36, the tangential contact load of a single asperity can be expressed as:
The tangential contact stiffness of a single asperity can be expressed as:
Unlike previous researchers who assumed that the ratio of t to f is a constant value (Zhang et al., 2013; Pan et al., 2017), the ratio of t and f has a significant impact on the tangential contact stiffness. According to Eq. 37 and Eq. 38, the ratio of t to f for a single asperity is different in the elastic, first elastoplastic, and second elastoplastic stages is as follows:
Then, the elastic tangential contact stiffness, first elastoplastic tangential contact stiffness, and second elastoplastic tangential contact stiffness of the joint surface can be expressed respectively as:
Where Ht1, Ht2, and Ht3 are the coefficients related to material properties and fractal parameters of the contact surfaces, which can be written as
The total tangential contact stiffness of the joint surface can be expressed as:
2.2 Equivalent torsional stiffness of FS-FB contact pair
The joint surface of the FS-FB contact pair is a spatial elliptical cone surface, characterized by a non-uniform stress distribution and varying contact stiffness at different positions. The elliptical cone surface is divided into nT meshes, with varying sizes of asperities present within each mesh. Following the application of force, these asperities exhibit four deformation states based on the magnitude of deformation: elastic deformation, first-stage elastic-plastic deformation, second-stage elastic-plastic deformation, and plastic deformation. The real contact area and normal contact load at the ith mesh node C can be calculated using Eq. 22 and Eq. 27. This article introduces the equivalent torsional stiffness to describe the stiffness of the FS-FB contact pair, as presented in Figure 4. The normal contact stiffness KNri and tangential contact stiffness KTri at the ith mesh node are oriented perpendicular and parallel to the elliptical cone surface, respectively. The conical angle of the elliptical cone surface is denoted by α, and the tangential pressure angle is denoted by β. The phase angle of the elliptical cross-section is denoted by θi, where zero phase angle located at the position of the major axis. The equivalent torsional stiffness of the FS-FB contact pair can be obtained by summing up the normal and tangential contact stiffness components of the elliptical cone surface, expressed as follows:
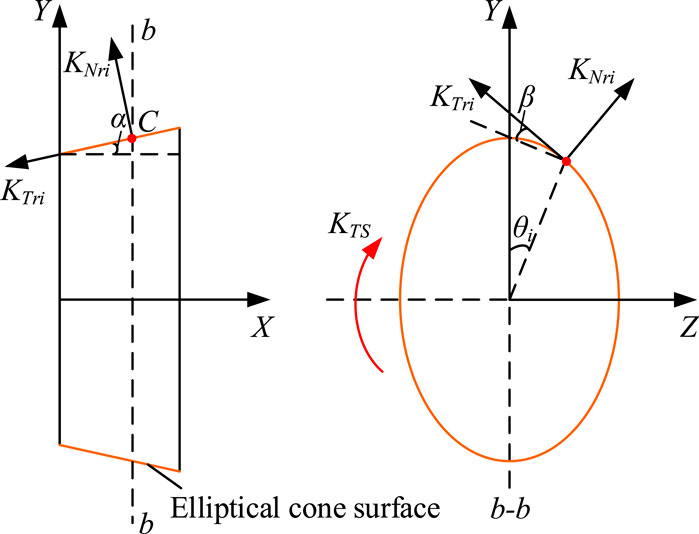
FIGURE 4. Torsional stiffness diagram of the FS-FB contact pair.
Where, Ra is the polar radius of the elliptical section, which can be written as
2.3 Finite element modeling of torsional stiffness of FS-FB contact pair
The fractal parameters D and G in this article can be obtained using the structure function method (SF method) (Wang et al., 2018). As direct measurement of the elliptical cone surface of the FS-FB contact pair is challenging, two test specimens were manufactured for the determination of the fractal parameters. The specimens, named Specimen 1 (flexspline specimen) and Specimen 2 (flexible bearing specimen), were cylindrical in shape and had a diameter of 30 mm. The materials, roughness, and processing methods of the specimens were the same as those of the FS-FB contact pair. The confocal laser scanning microscope VK-X1000 was used to collect the surface data from the two specimens, within a sampling range of a square area of
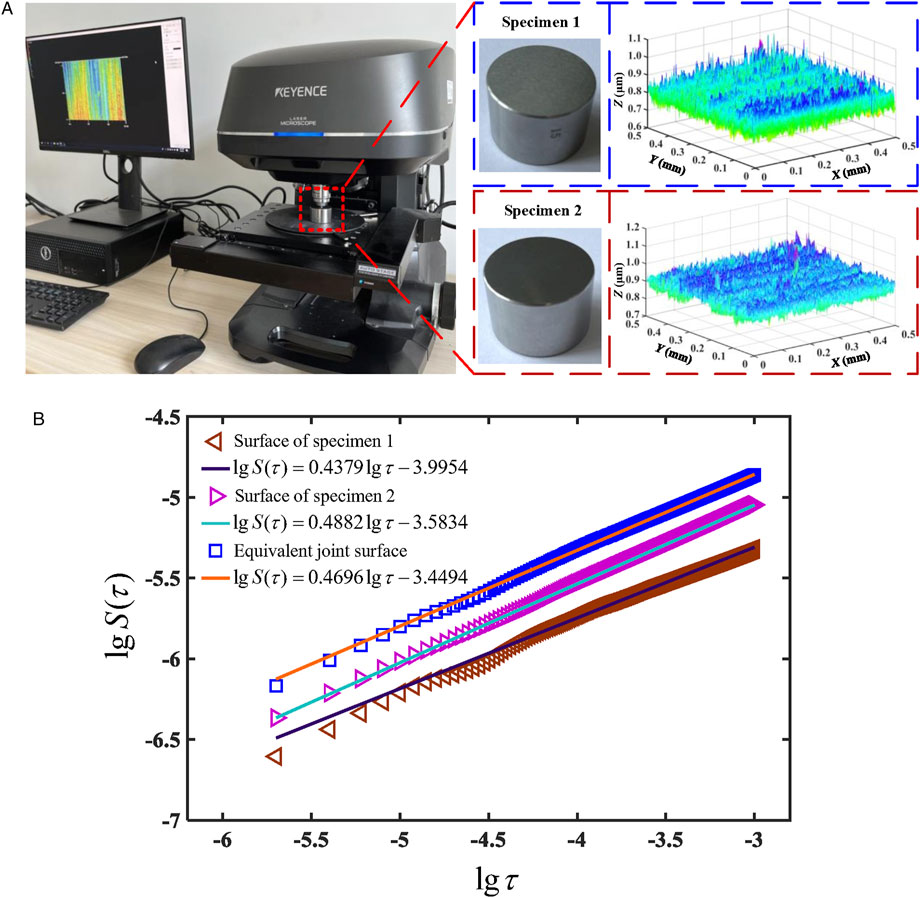
FIGURE 5. Fractal parameters extraction and reconstruction of the FS-FB contact pair: (A) Collection of the surface profiles, (B) Structure functions.
The establishment of the FEM model for the FS-FB contact pair in a harmonic drive is based on the following simplifications: 1) the inner wall of the wave generator is considered as an infinitely rigid body with no deformation; 2) the axial displacement of the shell is not considered when the flexspline undergoes deformation; 3) the tooth end of the flexspline is simplified as an equivalent gear, with a wall thickness that is
The FEM modeling and analysis of the FS-FB contact pair is illustrated in Figure 6, and the specific steps are as follows.
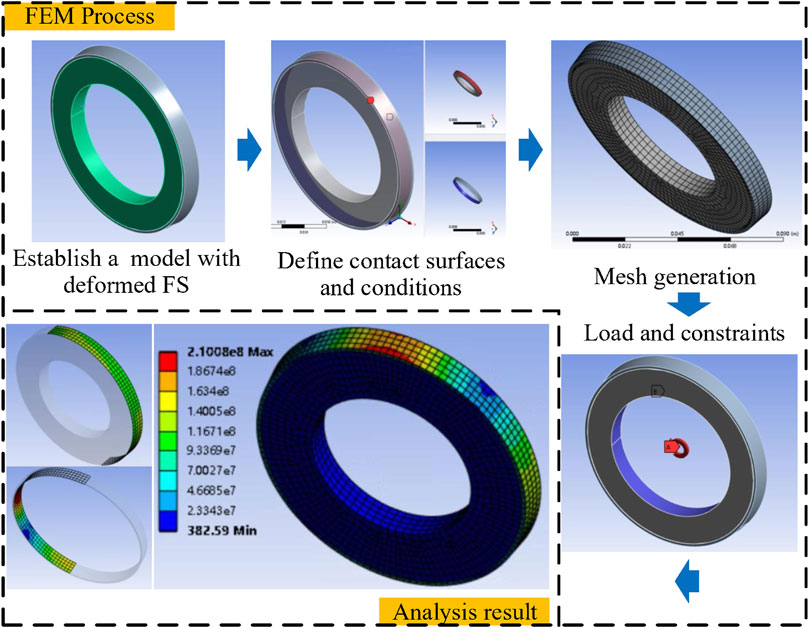
FIGURE 6. FEM modeling and analysis of the FS-FB contact pair.
Step 1. Modeling and parameters settings. A simplified three-dimensional model of the harmonic drive was created using the Solidworks software, and then imported into the ANSYS Workbench software. The flexspline material was set to 40CrNiMoA, with a density of 7.83 × 10³ kg/m3, an elastic modulus of 2.09 × 10⁵MPa, and a Poisson’s ratio of 0.295. The flexible bearing material was set to GCR15, with a density of 7.83 × 10³ kg/m3, an elastic modulus of 2.19 × 10⁵MPa, and a Poisson’s ratio of 0.3.
Step 2. Definition of contact surfaces and conditions. The inner wall of the flexspline and the outer ring of the flexspline bearing were defined as “Frictional” and the coefficient of friction was set as 0.15.
Step 3. Mesh Generation. The “Sweep” and “Face sizing” methods were combined to ensure that the mesh of the contact region was hexahedral. The mesh size was set to 0.001 mm and the mesh number was
Step 4. Application of load and constraints. The inner ring of the flexspline bearing was fixed and a torque of 0-5Nm was applied to the outer circumference of the flexspline.
Step 5. Analysis and stress extraction. The position of the flexspline cup opening was set to Position I, 5 mm away from the cup opening was Position II, and 10 mm away from the cup opening was Position III. The normal contact stress and tangential contact stress of each node on the elliptical cone surface were extracted under a rated torque of 5Nm, as shown inFigures 7A, B.
Step 6. Torsional stiffness calculation. The equivalent torsional stiffness of the FS-FB contact pair was calculated according to Eq. 28 and Eq. 35, Eq. 44, and Eq. 45 in Section 2.1, as shown in Figure 7C.
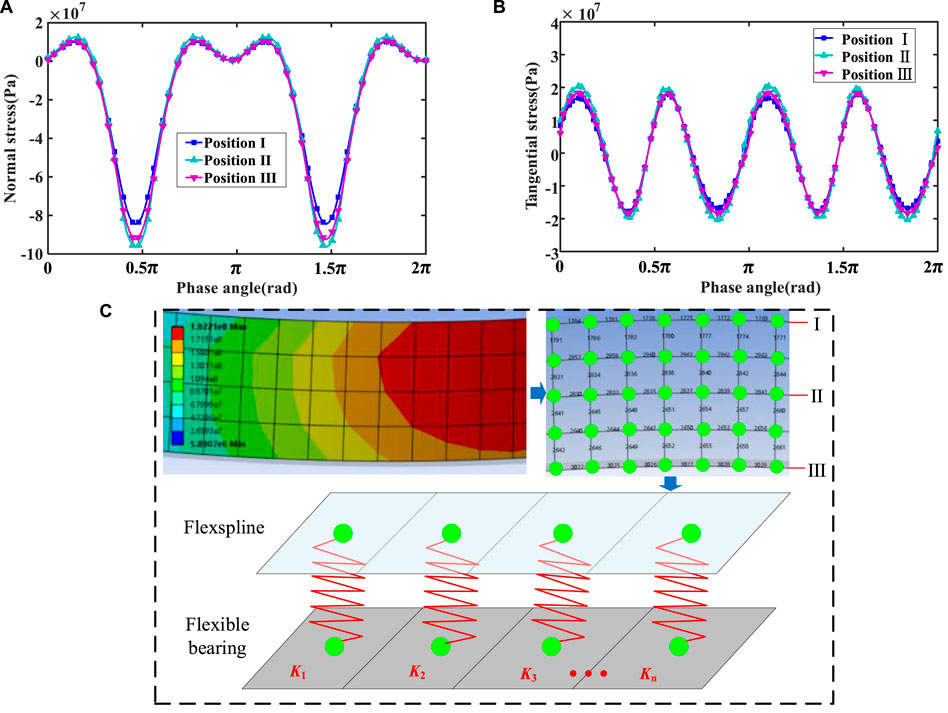
FIGURE 7. Stress extraction and equivalent torsional stiffness synthesis on the elliptical cone surface of the FS-FB contact pair: (A) Normal contact stress extraction, (B) Tangential contact stress extraction, (C) Equivalent torsional stiffness synthesis.
3 Verification and analysis of torsional stiffness of FS-FB contact pair
In this section, a torsional stiffness test scheme was developed to validate the accuracy of the proposed model, and an analysis was conducted to investigate the influence of various factors on the torsional stiffness of the FS-FB contact pair.
3.1 Validation of the proposed model
To validate the effectiveness of the proposed torsional stiffness model, a torsional stiffness test bench for the harmonic drive was constructed, as presented in Figure 8. The test object was a CD-14–100 model harmonic drive prototype. The test bench loads torque by means of a servo motor, while a torque sensor and a grating ruler respectively measure torque and angle. The technical specifications of the test bench can be found in Table 1.
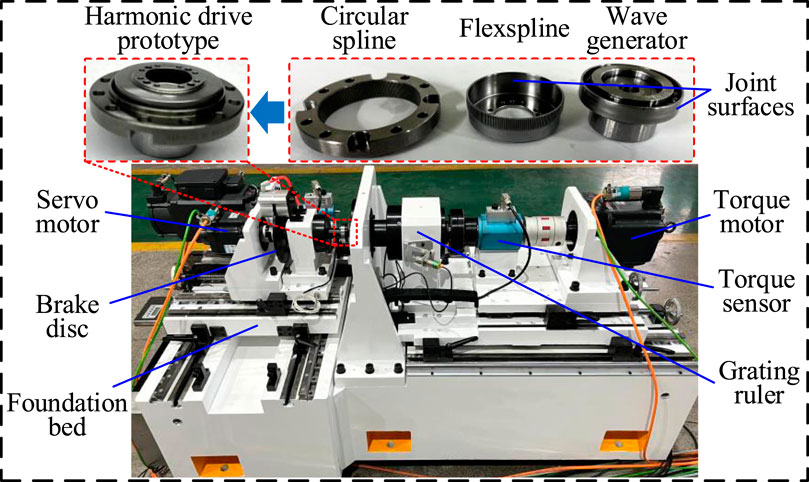
FIGURE 8. The torsional stiffness test bench for the harmonic drive.
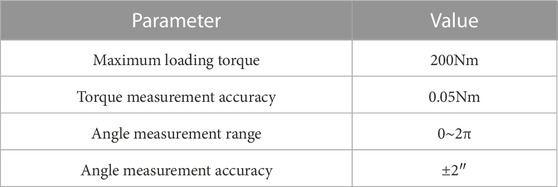
TABLE 1. Technical specifications of torsional stiffness test bench.
During the testing process, the brake disc at the input end was locked, and the torque motor at the output end loaded from zero to the rated torque of 5Nm with a step of 0.01Nm. The torque sensor and grating ruler respectively recorded the torque values and rotation angle values at the output end. Then, the torque-rotation angle curve was plotted with torque as the horizontal axis and rotation angle as the vertical axis, as depicted in Figure 9. The curve reflects the torque response characteristics of the harmonic drive at different rotation angles. By fitting the torque-angle curve data to a mathematical function and performing differentiation on it, the mapping relationship between torque and torsional stiffness of the harmonic drive can be obtained.
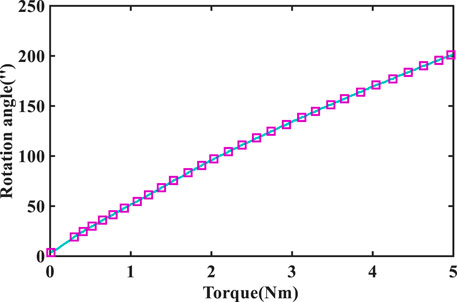
FIGURE 9. The torque-rotation angle curve of the harmonic drive.
The torsional stiffness of the harmonic drive can be expressed as:
Where, KFS represents the torsional stiffness of the flexspline cylinder; KCS represents the meshing stiffness of the circular spline-flexspline; KTS represents the torsional stiffness of the flexspline-flexible bearing.
It is defined that the synthetical stiffness of the circular spline and flexspline is
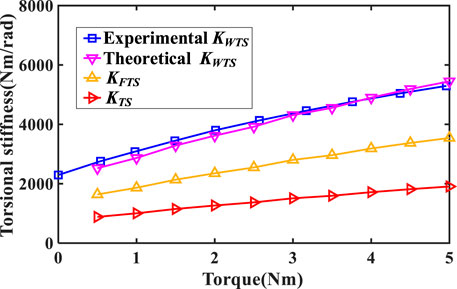
FIGURE 10. Comparison between experimental and theoretical torsional stiffness of harmonic drive under different torques.
It can be observed from Figure 10 that the trend of the theoretical and experimental harmonic drive torsional stiffness curves with respect to torque variation is extremely consistent. The maximum error between the experimental and theoretical values of the harmonic drive torsional stiffness occurs at 0.5Nm, where the theoretical torsional stiffness is 2524.92Nm/rad and the experimental torsional stiffness is 2723.75Nm/rad, with a relative error of 7.30%. This result demonstrates the accuracy of the proposed model.
3.2 Effect of torque on torsional stiffness
Figure 11A depicts the contact stress distribution of FS-FB contact pair at Position Ⅰ under different torque conditions. It can be observed from Figure 11A that, with the increase of torque, the amplitude of the normal contact stress increases, and when the torque is 5Nm, the absolute value of maximum normal contact stress appears at the long axis of the elliptical cone section, which is 96.35 MPa. Overall, the stress curve exhibits approximate symmetry within the intervals of 0-π and π-2π. Figure 11B depicts the effect of torque on the torsional stiffness of the FS-FB contact pair. It can be observed from Figure 11B that the torsional stiffness increases with the increase of torque, but the growth rate gradually slows down, and they exhibit a non-linear relationship. When the torque reaches 5Nm, the torsional stiffness is 1820.44Nm/rad.
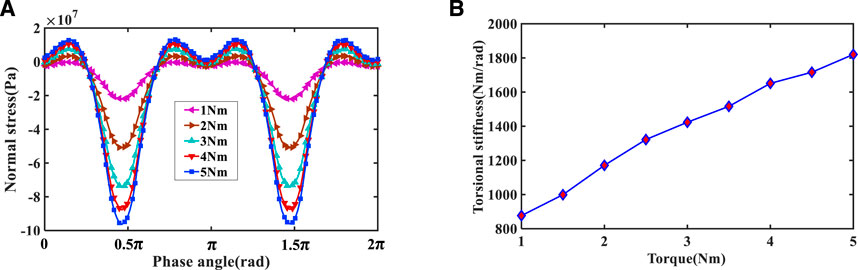
FIGURE 11. Contact stress distribution and torsional stiffness of FS-FB contact pair under different torques: (A) Contact stress distribution, (B) Torsional stiffness at different torques.
3.3 Effect of installation eccentricity on torsional stiffness
During the installation process of a harmonic drive, it is crucial to strictly control the coaxiality between the flexspline and the flexible bearing. However, due to manufacturing and assembly errors, it is inevitable that installation eccentricity issues will occur. The installation eccentricity will cause changes in the stress distribution of the FS-FB contact pair, thereby affecting the deformation of the flexspline and the bearing capacity of the flexible bearing. Therefore, investigating the influence of installation eccentricity on the performance of the FS-FB contact pair is of great significance. Figure 12 illustrates the effect of installation eccentricity on the torsional stiffness of the FS-FB contact pair. As shown in the figure, the torsional stiffness of the FS-FB contact pair decreases continuously as the eccentricity value increases. At a torque of 1Nm, increasing the eccentricity from 0um to 10um results in a reduction in the torsional stiffness by 9.40%. For torques of 3Nm and 5Nm, the same increase in the eccentricity leads to reductions in the torsional stiffness of 6.61% and 5.02%, respectively. Additionally, as the torque increases, the degree to which the installation eccentricity affects the torsional stiffness continues to decrease.
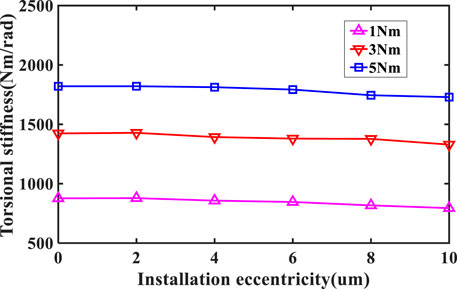
FIGURE 12. The effect of installation eccentricity on the torsional stiffness of FS-FB contact pair under different torques.
3.4 Effect of deformation coefficient on torsional stiffness
The deformation coefficient is one of the main design parameters of a harmonic drive, and it affects the FS-FB contact pair significantly. Excessive deformation coefficient of the wave generator may increase the contact stress between the flexspline and flexible bearing and result in a shorter lifespan of the contact pair. So, when designing a harmonic drive, it is critical to factor in the impact of the deformation coefficient on the FS-FB contact pair and use it to determine suitable material and structural parameters. Figure 13 illustrates how the deformation coefficient affects the torsional stiffness of the FS-FB contact pair. It indicates that the torsional stiffness of the FS-FB contact pair increases initially, then decreases as the deformation coefficient rises. The torsional stiffness reaches its maximum value when the deformation coefficient is 0.21. At 1Nm torque, the maximum torsional stiffness increases by 12.65% from the minimum to 1009.11Nm/rad with the deformation coefficient growing from 0.195 to 0.215. At 3Nm torque, the maximum torsional stiffness is 1552.69Nm/rad, an increase of 8.76% compared to the minimum. At 5Nm torque, maximum torsional stiffness is 1940.49Nm/rad, an increase of 7.12% compared to the minimum. In addition, as the torque increases, the magnitude of the variation in the torsional stiffness of the FS-FB contact pair caused by the deformation coefficient decreases.
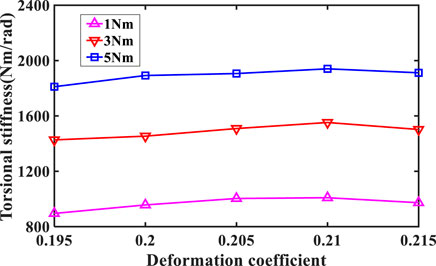
FIGURE 13. The effect of deformation coefficient on the torsional stiffness of FS-FB contact pair under different torques.
4 Conclusion
This article focuses on the FS-FB contact pair in a harmonic drive. The torsional stiffness of this contact pair has been thoroughly investigated by means of modeling, verification, and analysis. From this research, the following conclusions can be drawn:
1) A fractal-based approach combined with finite element simulation was used to establish an equivalent torsional stiffness model for the FS-FB contact pair. At the microscale, the equivalent fractal dimension D and fractal roughness parameter G of the FS-FB contact pair were determined using the structure function method to be 2.5304 and 2.4248 × 10⁻⁷ m respectively, and the three-dimensional fractal model was applied in calculating the normal and tangential contact stiffness of the joint surface. At the macroscale, the finite element method was introduced to obtain the stress distribution on the elliptical cone surface of the FS-FB contact pair.
2) A test bench was built to measure the torsional stiffness of a harmonic drive, and a CD-14–100 model was tested. The experimental torsional stiffness curve was obtained with a maximum torsional stiffness of 5294Nm/rad. Based on the synthetical stiffness curve of the circular spline and flexspline obtained from simulation and the torsional stiffness curve of the FS-FB contact pair derived using the proposed model, the theoretical torsional stiffness curve of the harmonic drive was obtained. The change trend of the theoretical and experimental torsional stiffness curves is consistent, with a maximum error of 7.3%, which validates the accuracy of the proposed model.
3) An analysis was conducted on the factors influencing the torsional stiffness of the FS-FB contact pair. The results indicate that the torsional stiffness of the FS-FB contact pair increases with torque, reaching a maximum of 1820.44Nm/rad at 5Nm. Increasing eccentricity leads to decreased torsional stiffness. At 1Nm torque, an increase in eccentricity from 0um to 10um results in a 9.40% reduction in torsional stiffness. For torques of 3Nm and 5Nm, increasing eccentricity results in reductions in torsional stiffness of 6.61% and 5.02%, respectively. Increasing deformation coefficient leads to an increased-then-decreased torsional stiffness. At 1Nm torque, an increase in deformation coefficient from 0.195 to 0.215 results in a 12.65% increase in torsional stiffness. For torques of 3Nm and 5Nm, increasing deformation coefficient results in increases in torsional stiffness of 8.76% and 7.12%, respectively. This provides a basis for the design and optimization of the contact pair to enhance its performance and reliability.
Data availability statement
The original contributions presented in the study are included in the article/supplementary material, further inquiries can be directed to the corresponding author.
Author contributions
QH modeling, validation, analysis, and writing original draft; HL and GW conducting the experiments under the guidance of QH; LL data curation. All authors contributed to the article and approved the submitted version.
Funding
Jiangsu Province Industry-University-Research Cooperation Project coded BY20221307 and the Natural Science Foundation of the Jiangsu Higher Education Institutions of China coded 23KJB460011.
Acknowledgments
The authors would also like to acknowledge the technical support and facilities provided by School of Mechanical Engineering, Jiangsu University of Science and Technology.
Conflict of interest
The authors declare that the research was conducted in the absence of any commercial or financial relationships that could be construed as a potential conflict of interest.
Publisher’s note
All claims expressed in this article are solely those of the authors and do not necessarily represent those of their affiliated organizations, or those of the publisher, the editors and the reviewers. Any product that may be evaluated in this article, or claim that may be made by its manufacturer, is not guaranteed or endorsed by the publisher.
References
Cai, L. G., Hu, Q. S., Liu, Z. F., Yang, C. B., and Zhang, T. (2019a). Stress calculation and fatigue life evaluation on cup-type flexspline under bending and torsion in harmonic drive. J. Chin. Soc. Mech. Eng.40 (5), 471–480.
Cai, Y. W., Yao, L. G., Ding, J. X., Ouyang, S. M., and Zhang, J. (2019b). Study on transmission error of double circular arc spiral bevel gears for nutation drive based on assembly errors and different loads. Forsch. Ingenieurwes.83 (3), 481–490. doi:10.1007/s10010-019-00347-4
Chen, J. J., Yuan, Y., Cheng, Y., and He, Y. F. (2018). Scale dependent normal contact stiffness fractal model of joint interfaces. J. Mech. Eng.54 (21), 127–137. doi:10.3901/JME.2018.21.127
Chen, Y. S., Li, P. Y., Sun, J., Shang, M., and Shao, L. M. (2022). Fractal model of contact thermal stiffness. Machines10 (6), 464. doi:10.3390/MACHINES10060464
Ding, X. X., Yan, R. Q., and Jia, Y. L. (2014). Construction and analysis of fractal contact mechanics model for rough surface based on base length. Tribology34 (04), 341–347. doi:10.16078/j.tribology.2014.04.010
Greenwood, J. A., and Williamson, J. B. P. (1966). Contact of nominally flat surfaces. Proc. R. Soc. Lond. Ser. A Math. Phys. Sci.295 (1442), 300–319. doi:10.1098/rspa.1966.0242
Hu, Q. S., Liu, Z. F., Yang, C. B., and Xie, F. G. (2021). Research on dynamic transmission error of harmonic drive with uncertain parameters by an interval method. Precis. Eng.68, 285–300. doi:10.1016/J.PRECISIONENG.2020.12.017
Ji, C. C., Zhu, H., and Jiang, W. (2013). Fractal prediction model of thermal contact conductance of rough surfaces. Chin. J. Mech. Eng-Eg.26 (01), 128–136. doi:10.3901/CJME.2013.01.128
Jiang, S. Y., Zheng, Y. J., and Zhu, H. (2010). A contact stiffness model of machined plane joint based on fractal theory. J. Tribolo-T. Asme.132 (1), 011401. doi:10.1115/1.4000305
Kout, L., and Etsion, I. (2003). A finite element based elastic-plastic model for the contact of rough surfaces. Tribol. Trans.46 (3), 383–390. doi:10.1080/10402000308982641
Kout, L., and Etsion, I. (2002). Elastic-plastic contact analysis of a sphere and rigid flat. J. Appl. Mech-T. Asme.69 (5), 657–662. doi:10.1115/1.1490373
Li, H. G., Liu, H., and Yu, L. (2011). Contact stiffness of rough mechanical joint surface. J. Xi’an Jiaot. Univ.45 (06), 69–74.
Li, L., Wang, J. J., Pei, X. Y., Chu, W., and Cai, A. J. (2020b). A new method for modeling mechanical joint surface contact stiffness. J. Mech. Eng.56 (9), 162–169. doi:10.3901/JME.2020.09.162
Li, L., Yun, Q. Q., Wang, J. J., Dong, Y. B., and Shi, X. H. (2021). A continuous and smooth contact stiffness model for mechanical joint surfaces. J. Mech. Eng.57 (7), 117–124. doi:10.3901/JME.2021.07.117
Li, X. Z., Song, C. S., Yang, Y., Zhu, C. C., and Liao, D. L. (2020a). Optimal design of wave generator profile for harmonic gear drive using support function. Mech. Mach. Theory.152, 103941. doi:10.1016/j.mechmachtheory.2020.103941
Liao, J. P., Zhang, J. F., Feng, P. F., Yu, D. W., and Wu, Z. J. (2017). Identification of contact stiffness of shrink-fit tool-holder joint based on fractal theory. Int. J. Adv. Manuf. Tech.90 (5-8), 2173–2184. doi:10.1007/s00170-016-9506-3
Lin, C., Wang, Y., Hu, Y. N., Ran, G., and Yu, Y. Q. (2022). Nonlinear dynamic analysis of eccentric curve-face gear transmission system. J. Sound. Vib.520, 116596. doi:10.1016/J.JSV.2021.116596
Lin, Z., Yao, L. G., Zhang, J., Su, T. K., and Chen, K. J. (2020). Tooth contact analysis with latent error of double circular-arc spiral bevel gears for industrial robot joint nutation drive. J. Braz. Soc. Mech. Sci.42 (1), 10. doi:10.1007/s40430-019-2085-0
Liou, J. L., and Lin, J. F. (2010). A modified fractal microcontact model developed for asperity heights with variable morphology parameters. Wear268 (1-2), 133–144. doi:10.1016/j.wear.2009.07.003
Majumdar, A., and Bhushan, B. (1991). Fractal model of elastic-plastic contact between rough surfaces. J. Tribolo-T. Asme.113 (1), 1–11. doi:10.1115/1.2920588
Majumdar, A., and Tien, C. L. (1990). Fractal characterization and simulation of rough surfaces. Wear136 (2), 313–327. doi:10.1016/0043-1648(90)90154-3
Mandelbrot, B. B. (1985). Self-affine fractals and fractal dimension. Phys. Scr.32 (4), 257–260. doi:10.1088/0031-8949/32/4/001
Morag, Y., and Etsion, I. (2006). Resolving the contradiction of asperities plastic to elastic mode transition in current contact models of fractal rough surfaces. Wear262 (5), 624–629. doi:10.1016/j.wear.2006.07.007
Pan, W. J., Li, X. P., Li, M. Y., Wang, X., Gao, J. Z., and Wen, B. C. (2017). Three-dimensional fractal theory modeling of tangential contact stiffness of mechanized joint surfaces. J. Vib. Eng.30 (04), 577–586. doi:10.16385/j.cnki.issn.1004-4523.2017.04.008
Pham, A. D., and Ahn, H. J. (2018). High precision reducers for industrial robots driving 4th industrial revolution: State of arts, analysis, design, performance evaluation and perspective. Int. J. Pr. Eng. Man-Gt.5 (4), 519–533. doi:10.1007/s40684-018-0058-x
Tang, J. Y., and Pu, T. P. (2011). Spiral bevel gear meshing stiffness calculations based on the finite element method. J. Mech. Eng.47 (11), 23–29. doi:10.3901/JME.2011.11.023
Tian, H. L., Dong, Y. F., Yu, Y., Zhang, Y., Chen, T. M., and Zheng, J. H. (2017). Fractal model of normal stiffness for slow sliding surface in machine tool ground foot and experimental confirmation. J. Mech. Eng.53 (17), 172–184. doi:10.3901/JME.2017.17.172
Wang, R. Q., Zhu, L. D., and Zhu, C. X. (2018). Investigation of contact stiffness model for joint surfaces based on domain expansion factor and asperity interaction. J. Mech. Eng.54 (19), 88–95. doi:10.3901/JME.2018.19.088
Wang, S., Wang, J. X., Li, J. Y., Wang, B., Lei, Y., Wang, C., et al. (2022). Relation of myocardial perfusion reserve and left ventricular ejection fraction in ischemic and nonischemic cardiomyopathy. J. Chongqing Univ.45 (12), 143–150. doi:10.1016/j.amjcard.2022.02.022
Xiao, H. F., Sun, Y. Y., and Chen, Z. G. (2019). Fractal modeling of normal contact stiffness for rough surface contact considering the elastic–plastic deformation. J. Braz. Soc. Mech. Sci.41 (1), 11. doi:10.1007/s40430-018-1513-x
Yan, W., and Komvopoulos, K. (1998). Contact analysis of elastic-plastic fractal surfaces. J. Appl. Phys.84 (7), 3617–3624. doi:10.1063/1.368536
Zeng, Q. D., and Tan, F. Z. (2013). Finite element analysis of gear contact on two-speed transmission in electric cars. Appl. Mech. Mat.2516 (341-342), 443–446. doi:10.4028/www.scientific.net/AMM.341-342.443
Zhai, C., Gan, Y., Hanaor, D., Proust, G., and Retraint, D. (2016). The role of surface structure in normal contact stiffness. Exp. Mech.56 (3), 359–368. doi:10.1007/s11340-015-0107-0
Zhang, X. L., Wang, N. S., Lan, G. S., Wen, S. H., and Chen, Y. H. (2013). Tangential damping and its dissipation factor models of joint interfaces based on fractal theory with simulations. J. Tribolo-T. Asme.136 (1), 011704. doi:10.1115/1.4025548
Zhang, X. L., Zhang, W., Wen, S. H., and Yao, S. S. (2021). Three-dimensional fractal model with scale correlation for static friction factor of joint interfaces. J. Mech. Eng.57 (09), 127–138. doi:10.3901/JME.2021.09.127
Keywords: harmonic drive, contact pair, fractal theory, flexspline-flexible bearing, macromicro scale modeling, torsional stiffness
Citation: Hu Q, Li H, Wang G and Li L (2023) Research on torsional stiffness of flexspline-flexible bearing contact pair in harmonic drive based on macro-micro scale modeling. Front. Mater. 10:1211019. doi: 10.3389/fmats.2023.1211019
Received: 24 April 2023; Accepted: 28 June 2023;
Published: 12 July 2023.
Edited by:
Yihao Zheng, Worcester Polytechnic Institute, United StatesReviewed by:
Ziling Zhang, Shanghai Maritime University, ChinaYang Tian, Shenyang Ligong University, China
Pavlo Maruschak, Ternopil Ivan Pului National Technical University, Ukraine
Copyright © 2023 Hu, Li, Wang and Li. This is an open-access article distributed under the terms of the Creative Commons Attribution License (CC BY). The use, distribution or reproduction in other forums is permitted, provided the original author(s) and the copyright owner(s) are credited and that the original publication in this journal is cited, in accordance with accepted academic practice. No use, distribution or reproduction is permitted which does not comply with these terms.
*Correspondence: Qiushi Hu, aHFzQGp1c3QuZWR1LmNu